


1 Introduction
Static tabs of various shapes, inclination angles and orientations are often used as a passive control strategy to promote mixing and convective heat transfer (Stephens & Collins Reference Stephens and Collins1955; Zaman, Reeder & Samimy Reference Zaman, Reeder and Samimy1994; Gad-elhak Reference Gad-elhak2000; Habchi et al.
Reference Habchi, Lemenand, Della Valle and Peerhossaini2010a
,Reference Habchi, Lemenand, Valle and Peerhossaini
b
; Kaci et al.
Reference Kaci, Habchi, Lemenand, Della Valle and Peerhossaini2010; Ghanem et al.
Reference Ghanem, Habchi, Lemenand, Della Valle and Peerhossaini2013). Turbulent transport past tabs is enhanced by the formation of energetic and long-lasting vortical structures such as hairpin-like vortices and a streamwise counter-rotating vortex pair (CVP) (Gretta & Smith Reference Gretta and Smith1993; Yang, Meng & Sheng Reference Yang, Meng and Sheng2001; Ghanem et al.
Reference Ghanem, Lemenand, Della Valle, Habchi and Peerhossaini2012). Multiple studies have investigated the complex vortex dynamics in tab wakes; Gretta & Smith (Reference Gretta and Smith1993), for example, used flow visualization and anemometry to characterize the flow past a trapezoidal tab. They proposed that a streamwise counter-rotating vortex pair is present in the wake and is enveloped by hairpin vortices along its length. In this phenomenological model, the two vortical structures coexist. Using planar laser-induced fluorescence (PLIF), Elavarasan & Meng (Reference Elavarasan and Meng2000) found that the CVP and hairpin vortices dominate different regions of the wake. The CVP is dominant in a streamwise distance of
 ${\sim}1.5h$
behind the tab, where
${\sim}1.5h$
behind the tab, where
 $h$
denotes the tab height. Beyond that location, hairpin vortices dominate the wake dynamics. Two later studies by Yang et al. (Reference Yang, Meng and Sheng2001) and Dong & Meng (Reference Dong and Meng2004) supported the findings of Elavarasan & Meng (Reference Elavarasan and Meng2000).
$h$
denotes the tab height. Beyond that location, hairpin vortices dominate the wake dynamics. Two later studies by Yang et al. (Reference Yang, Meng and Sheng2001) and Dong & Meng (Reference Dong and Meng2004) supported the findings of Elavarasan & Meng (Reference Elavarasan and Meng2000).
Planar particle image velocimetry (PIV) measurements by Yang et al. (Reference Yang, Meng and Sheng2001) and direct numerical simulations (DNS) by Dong & Meng (Reference Dong and Meng2004) characterized the dynamics of the CVP and the hairpin vortices in the wake of trapezoidal tabs. These studies suggested the evolvement of the CVP into the hairpin vortex legs through a process of deformation and splitting. The head of the hairpin is rolled from a shear layer that forms near the top of the tab. Yang et al. (Reference Yang, Meng and Sheng2001) found that the hairpin vortices are long-lasting structures persisting
 ${\sim}12h$
downstream of the tab. Dong & Meng (Reference Dong and Meng2004) highlighted the role of hairpin vortices in mixing enhancement through the pumping of near-wall low-speed fluid into the outer flow. Furthermore, they found that the pairing and coalescence of hairpin vortices leads to vertical growth of the wake and increased mixing. Near the tab, the CVP plays a significant role in mixing through the common-up pumping at the central region of the wake. In contrast to the model of the CVP evolution into the legs of hairpin vortices, Habchi et al. (Reference Habchi, Lemenand, Valle and Peerhossaini2010b
), using a combination of laser Doppler velocimetry measurements and numerical simulations, found the CVP to retain coherence for
${\sim}12h$
downstream of the tab. Dong & Meng (Reference Dong and Meng2004) highlighted the role of hairpin vortices in mixing enhancement through the pumping of near-wall low-speed fluid into the outer flow. Furthermore, they found that the pairing and coalescence of hairpin vortices leads to vertical growth of the wake and increased mixing. Near the tab, the CVP plays a significant role in mixing through the common-up pumping at the central region of the wake. In contrast to the model of the CVP evolution into the legs of hairpin vortices, Habchi et al. (Reference Habchi, Lemenand, Valle and Peerhossaini2010b
), using a combination of laser Doppler velocimetry measurements and numerical simulations, found the CVP to retain coherence for
 ${\sim}10h$
downstream of a trapezoidal tab; however, the CVP undergoes an exponential decay in strength. Very recent smoke visualizations by Park et al. (Reference Park, Pagan-Vazquez, Alvarado, Chamorro, Lux and Marsh2016) have provided evidence for Kelvin–Helmholtz (KH) instability in the near wake at a Reynolds number
${\sim}10h$
downstream of a trapezoidal tab; however, the CVP undergoes an exponential decay in strength. Very recent smoke visualizations by Park et al. (Reference Park, Pagan-Vazquez, Alvarado, Chamorro, Lux and Marsh2016) have provided evidence for Kelvin–Helmholtz (KH) instability in the near wake at a Reynolds number
 $Re\sim 2000$
based on the hydraulic diameter of their test section. Further quantification of this instability and its effect on the mean flow and vortex dynamics remains to be addressed.
$Re\sim 2000$
based on the hydraulic diameter of their test section. Further quantification of this instability and its effect on the mean flow and vortex dynamics remains to be addressed.
The complexity of the vortex dynamics in the tab wake is further dissected in the work of Dong & Meng (Reference Dong and Meng2004). The CVP and the hairpin vortices are classified as primary structures, as they are formed directly by the interaction between the tab and the surrounding flow. Secondary structures are also present in the wake; these are formed by the interaction of the primary vortices. A secondary hairpin vortex with the same sense of rotation as the primary one was observed by both Yang et al. (Reference Yang, Meng and Sheng2001) and Dong & Meng (Reference Dong and Meng2004); the latter proposed that it originates from the wall-induced vorticity that is pumped by the primary hairpin vortex. Yang et al. (Reference Yang, Meng and Sheng2001) observed another secondary vortical structure with a rotation opposite to the hairpin vortices; the three-dimensionality of this structure was challenging to map with planar PIV. Finally, a secondary streamwise CVP was identified by Dong & Meng (Reference Dong and Meng2004). This secondary CVP has an opposite sense of rotation to that of the primary one, making it disadvantageous to mixing, as it results in a downward flow at the central plane of the wake.
Trapezoidal tabs have received special attention due to their ability to generate hairpin vortices and their use in high-efficiency vortab (HEV) mixers. Tabs of rectangular and triangular shapes are also used for control and mixing enhancement (Reeder & Samimy Reference Reeder and Samimy1996; Chua, Yu & Wang Reference Chua, Yu and Wang2003; Yu, Zhang & Shan Reference Yu, Zhang and Shan2015). Gretta (Reference Gretta1990) suggested that the lack of a top flat edge in a triangular tab leads to the formation of a CVP but no hairpin vortices. Furthermore, Gretta (Reference Gretta1990) reached the conclusion that trapezoidal tabs are better mixers through observation of the disturbance in a uniform hydrogen bubble sheet used for visualization. He noted that trapezoidal tabs had the maximum disturbance height caused by vortical structures. This finding led many of the following studies to focus on trapezoidal tabs. Furthermore, experimental efforts have mostly relied on flow visualization and planar PIV measurements, both of which have limited ability to characterize coherent three-dimensional (3D) structures such as hairpin vortices. While the DNS study of Dong & Meng (Reference Dong and Meng2004) provides a detailed description of the vortex dynamics within the wake, it was performed at a relatively low Reynolds number
 $Re_{h}\sim 600$
based on the tab height and free-stream incoming velocity.
$Re_{h}\sim 600$
based on the tab height and free-stream incoming velocity.
The vortical structures in the wake of a similar element, a micro-ramp, have been frequently studied for use as a passive mechanism to control flow separation. The large-scale vortices in the wake of a micro-ramp exhibit similar organization to those in the wake of tabs. Recently, Sun et al. (Reference Sun, Schrijer, Scarano and Van Oudheusden2012) used 3D tomographic PIV to study vortical structures in the wake of a micro-ramp in a supersonic turbulent boundary layer at Mach number
 $M=2$
and
$M=2$
and
 $Re_{h}=140\,000$
. They showed a complex interaction between the CVP and the arc-shaped vortices, where the intermittent arc-shaped vortices result in reducing the distance between the cores of the CVP. Ye, Schrijer & Scarano (Reference Ye, Schrijer and Scarano2016) studied the transition to turbulence behind a micro-ramp at
$Re_{h}=140\,000$
. They showed a complex interaction between the CVP and the arc-shaped vortices, where the intermittent arc-shaped vortices result in reducing the distance between the cores of the CVP. Ye, Schrijer & Scarano (Reference Ye, Schrijer and Scarano2016) studied the transition to turbulence behind a micro-ramp at
 $Re_{h}=1170$
; using tomographic PIV, they showed the presence of the primary CVP and arc-shaped vortices. Furthermore, they showed a sidewise development of secondary and tertiary streamwise vortex pairs.
$Re_{h}=1170$
; using tomographic PIV, they showed the presence of the primary CVP and arc-shaped vortices. Furthermore, they showed a sidewise development of secondary and tertiary streamwise vortex pairs.
While experimental 3D PIV measurements have revealed the topology of vortical structures in the wake of micro-ramps, similar studies remain needed to unravel the vortical structure organization in the wakes of tabs. Moreover, the vortex dynamics have been mostly studied for trapezoidal tabs, leaving a gap on the effect of tab geometry on the primary and secondary vortices. In this work, we experimentally study the near-wake region behind rectangular, trapezoidal, triangular and ellipsoidal tabs using volumetric PIV at two Reynolds numbers,
 $Re_{h}\sim 2000$
and
$Re_{h}\sim 2000$
and
 $Re_{h}\sim 13\,000$
. The geometries are chosen such that the trailing tab edge exhibits a reduction in vertex points. We further employ high-spatial-resolution planar PIV to get a closer look at the turbulence statistics and flow instabilities. We aim to highlight and uncover the effect of tab geometry and incoming flow regime (laminar versus turbulent) on the vortical structures and turbulence statistics; we revisit the vortex interaction models discussed earlier and adjust them through experimental evidence. The experimental set-up is described in § 2; the results are analysed and discussed in § 3; and the main conclusions of this work are presented in § 4.
$Re_{h}\sim 13\,000$
. The geometries are chosen such that the trailing tab edge exhibits a reduction in vertex points. We further employ high-spatial-resolution planar PIV to get a closer look at the turbulence statistics and flow instabilities. We aim to highlight and uncover the effect of tab geometry and incoming flow regime (laminar versus turbulent) on the vortical structures and turbulence statistics; we revisit the vortex interaction models discussed earlier and adjust them through experimental evidence. The experimental set-up is described in § 2; the results are analysed and discussed in § 3; and the main conclusions of this work are presented in § 4.

Figure 1. Basic dimensions of the rectangular, trapezoidal, triangular and ellipsoidal tabs under study. They share the same base width
 $W=28$
mm, length
$W=28$
mm, length
 $L=40$
mm and inclination angle
$L=40$
mm and inclination angle
 $\unicode[STIX]{x1D6FC}=24.5^{\circ }$
.
$\unicode[STIX]{x1D6FC}=24.5^{\circ }$
.
2 Experimental set-up
2.1 Geometry and flow conditions
The flow past trapezoidal, rectangular, triangular and ellipsoidal tabs was experimentally studied using volumetric and high-spatial-resolution planar PIV in a 2.5 m long refractive-index-matching (RIM) channel. The flume has a square cross-section of
 $112.5~\text{mm}\times 112.5~\text{mm}$
and free-stream turbulence intensity
$112.5~\text{mm}\times 112.5~\text{mm}$
and free-stream turbulence intensity
 $\unicode[STIX]{x1D70E}_{u}/U_{0}<0.7\,\%$
for
$\unicode[STIX]{x1D70E}_{u}/U_{0}<0.7\,\%$
for
 $Re_{h}=13\,000$
and
$Re_{h}=13\,000$
and
 $\unicode[STIX]{x1D70E}_{u}/U_{0}\simeq 0$
for
$\unicode[STIX]{x1D70E}_{u}/U_{0}\simeq 0$
for
 $Re_{h}=2000$
. Here,
$Re_{h}=2000$
. Here,
 $\unicode[STIX]{x1D70E}_{u}$
and
$\unicode[STIX]{x1D70E}_{u}$
and
 $U_{0}$
denote the standard deviations of the velocity fluctuations and free-stream velocity. All the tabs were built from smooth acrylic plates with 1.6 mm thickness. They shared the same bulk geometry, i.e. inclination angle
$U_{0}$
denote the standard deviations of the velocity fluctuations and free-stream velocity. All the tabs were built from smooth acrylic plates with 1.6 mm thickness. They shared the same bulk geometry, i.e. inclination angle
 $\unicode[STIX]{x1D6FC}=24.5^{\circ }$
, base width
$\unicode[STIX]{x1D6FC}=24.5^{\circ }$
, base width
 $W=28~\text{mm}$
, length
$W=28~\text{mm}$
, length
 $L=40$
mm and height
$L=40$
mm and height
 $h=17$
mm as indicated in figure 1. The inclination angle of the tabs (
$h=17$
mm as indicated in figure 1. The inclination angle of the tabs (
 $\unicode[STIX]{x1D6FC}=24.5^{\circ }$
) and the taper angle of the trapezoidal tab (
$\unicode[STIX]{x1D6FC}=24.5^{\circ }$
) and the taper angle of the trapezoidal tab (
 $7.6^{\circ }$
) are chosen to match one of the cases studied by Dong & Meng (Reference Dong and Meng2004), allowing for insightful comparison. The tabs were attached to the sidewall of the RIM channel (as shown in the schematics) 700 mm (
$7.6^{\circ }$
) are chosen to match one of the cases studied by Dong & Meng (Reference Dong and Meng2004), allowing for insightful comparison. The tabs were attached to the sidewall of the RIM channel (as shown in the schematics) 700 mm (
 $41h$
) from the inlet for the volumetric measurements and 1500 mm (
$41h$
) from the inlet for the volumetric measurements and 1500 mm (
 $90h$
) for the planar measurements. The volumetric measurements were added to get additional insight on the 3D characteristics of the vortical structures and differences across tab geometries. Therefore, these measurements were made at an upstream location to ensure minimum boundary layer effects. The planar measurements were made at the centreline of the tab (and channel), and therefore the bottom and top wall boundary layers are determined to have a minimal effect on the flow statistics. The tabs were fixed to a flat plate that spanned the channel length and had an elliptical leading edge at the inlet to minimize disturbances to the flow. Through fine temperature control, the refractive index of the working fluid (NaI aqueous solution,
$90h$
) for the planar measurements. The volumetric measurements were added to get additional insight on the 3D characteristics of the vortical structures and differences across tab geometries. Therefore, these measurements were made at an upstream location to ensure minimum boundary layer effects. The planar measurements were made at the centreline of the tab (and channel), and therefore the bottom and top wall boundary layers are determined to have a minimal effect on the flow statistics. The tabs were fixed to a flat plate that spanned the channel length and had an elliptical leading edge at the inlet to minimize disturbances to the flow. Through fine temperature control, the refractive index of the working fluid (NaI aqueous solution,
 ${\sim}63\,\%$
by weight) was carefully matched to that of the tabs, rendering them nearly invisible. RIM granted full optical access with minimized reflections, allowing for measurements near and under the tabs. The NaI solution has a density of
${\sim}63\,\%$
by weight) was carefully matched to that of the tabs, rendering them nearly invisible. RIM granted full optical access with minimized reflections, allowing for measurements near and under the tabs. The NaI solution has a density of
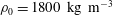 $\unicode[STIX]{x1D70C}_{0}=1800~\text{kg}~\text{m}^{-3}$
and a kinematic viscosity
$\unicode[STIX]{x1D70C}_{0}=1800~\text{kg}~\text{m}^{-3}$
and a kinematic viscosity
 $\unicode[STIX]{x1D708}\simeq 1.1\times 10^{-6}~\text{m}^{2}~\text{s}^{-1}$
. For further details on the channel and the RIM technique, the reader is referred to Blois et al. (Reference Blois, Christensen, Best, Elliott, Austin, Dutton, Bragg, Garcia and Fouke2012), Bai & Katz (Reference Bai and Katz2014) and Hamed et al. (Reference Hamed, Kamdar, Castillo and Chamorro2015). Each of the three tabs was studied at two Reynolds numbers,
$\unicode[STIX]{x1D708}\simeq 1.1\times 10^{-6}~\text{m}^{2}~\text{s}^{-1}$
. For further details on the channel and the RIM technique, the reader is referred to Blois et al. (Reference Blois, Christensen, Best, Elliott, Austin, Dutton, Bragg, Garcia and Fouke2012), Bai & Katz (Reference Bai and Katz2014) and Hamed et al. (Reference Hamed, Kamdar, Castillo and Chamorro2015). Each of the three tabs was studied at two Reynolds numbers,
 $Re_{h}=U_{0}h/\unicode[STIX]{x1D708}\simeq 2000$
(henceforth low
$Re_{h}=U_{0}h/\unicode[STIX]{x1D708}\simeq 2000$
(henceforth low
 $Re$
) and 13000 (henceforth high
$Re$
) and 13000 (henceforth high
 $Re$
). Here,
$Re$
). Here,
 $U_{0}$
is the incoming free-stream velocity preceding the tab. For both measurement locations, the incoming boundary layer was laminar at the low
$U_{0}$
is the incoming free-stream velocity preceding the tab. For both measurement locations, the incoming boundary layer was laminar at the low
 $Re$
and turbulent at the high
$Re$
and turbulent at the high
 $Re$
. As such, the distinctive behaviour observed across
$Re$
. As such, the distinctive behaviour observed across
 $Re_{h}$
is indicative of the impact of the incoming flow regime. At the location of the planar measurements, the boundary layer had a thickness
$Re_{h}$
is indicative of the impact of the incoming flow regime. At the location of the planar measurements, the boundary layer had a thickness
 $\unicode[STIX]{x1D6FF}_{99}/h=0.9$
and 1.4 at the low and high
$\unicode[STIX]{x1D6FF}_{99}/h=0.9$
and 1.4 at the low and high
 $Re_{h}$
, while
$Re_{h}$
, while
 $\unicode[STIX]{x1D6FF}_{99}/h\sim 0.7$
for the volumetric measurements. It is important to note that
$\unicode[STIX]{x1D6FF}_{99}/h\sim 0.7$
for the volumetric measurements. It is important to note that
 $\unicode[STIX]{x1D6FF}_{99}/h$
is a key parameter in determining the response of the boundary layer to the tabs. Here,
$\unicode[STIX]{x1D6FF}_{99}/h$
is a key parameter in determining the response of the boundary layer to the tabs. Here,
 $\unicode[STIX]{x1D6FF}_{99}/h$
is held constant for each case across the four tab geometries, allowing for meaningful comparisons. A summary of the experiments and flow conditions is given in table 1. Figure 2 illustrates the incoming boundary layer profile and turbulence statistics (when appropriate) for both Reynolds numbers at the tab location for the volumetric measurements. Figure 3 shows similar quantities at the location of the planar measurements.
$\unicode[STIX]{x1D6FF}_{99}/h$
is held constant for each case across the four tab geometries, allowing for meaningful comparisons. A summary of the experiments and flow conditions is given in table 1. Figure 2 illustrates the incoming boundary layer profile and turbulence statistics (when appropriate) for both Reynolds numbers at the tab location for the volumetric measurements. Figure 3 shows similar quantities at the location of the planar measurements.

Figure 2. Incoming boundary layer statistics at the volumetric measurement location: (a) time-averaged streamwise velocity profile
 $U/U_{0}$
for the low
$U/U_{0}$
for the low
 $Re$
; (b) time-averaged streamwise velocity profile
$Re$
; (b) time-averaged streamwise velocity profile
 $U/U_{0}$
for the high
$U/U_{0}$
for the high
 $Re$
; (c) turbulence intensity
$Re$
; (c) turbulence intensity
 $\unicode[STIX]{x1D70E}_{u}/U_{0}$
for the high
$\unicode[STIX]{x1D70E}_{u}/U_{0}$
for the high
 $Re$
; (d) Reynolds shear stress
$Re$
; (d) Reynolds shear stress
 $-\langle u^{\prime }w^{\prime }\rangle /U_{0}^{2}$
for the high
$-\langle u^{\prime }w^{\prime }\rangle /U_{0}^{2}$
for the high
 $Re$
.
$Re$
.
Table 1. Experimental parameters and flow conditions.


Figure 3. Incoming boundary layer statistics at the planar measurement location: (a) time-averaged streamwise velocity profile
 $U/U_{0}$
for the low
$U/U_{0}$
for the low
 $Re$
; (b) time-averaged streamwise velocity profile
$Re$
; (b) time-averaged streamwise velocity profile
 $U/U_{0}$
for the high
$U/U_{0}$
for the high
 $Re$
; (c) turbulence intensity
$Re$
; (c) turbulence intensity
 $\unicode[STIX]{x1D70E}_{u}/U_{0}$
for the high
$\unicode[STIX]{x1D70E}_{u}/U_{0}$
for the high
 $Re$
; (d) Reynolds shear stress
$Re$
; (d) Reynolds shear stress
 $-\langle u^{\prime }w^{\prime }\rangle /U_{0}^{2}$
for the high
$-\langle u^{\prime }w^{\prime }\rangle /U_{0}^{2}$
for the high
 $Re$
.
$Re$
.

Figure 4. Schematics of the experimental set-up for the volumetric PIV measurements.
2.2 Volumetric PIV set-up
The volumetric, three-component velocity measurements were made using a three-camera V3V system from TSI. This measurement technique was developed by Pereira et al. (Reference Pereira, Gharib, Dabiri and Modarress2000) and relies on the use of two or more camera apertures to obtain multiple images of scattering sources. The images are then used to obtain 3D displacements through multiple particle detection and tracking algorithms. In short, a three-step scheme is followed to obtain the volumetric, three-component velocity field from an image pair. First, the two-dimensional (2D) location in each of the six images (three cameras and two consecutive frames) is determined through a particle identification algorithm. In the next step, the 2D locations of the identified particles are used, along with a multi-plane calibration, to locate them in 3D space. Finally, the velocity is found through particle tracking across the two consecutive frames and then interpolated onto a rectangular grid. The reader is referred to Troolin & Longmire (Reference Troolin and Longmire2009), Sharp et al. (Reference Sharp, Hill, Troolin, Walters and Lai2010) and Chamorro et al. (Reference Chamorro, Troolin, Lee, Arndt and Sotiropoulos2013) for more details on the interrogation scheme. The V3V system has recently been used for volumetric flow measurements in different studies. For example, Chamorro et al. (Reference Chamorro, Troolin, Lee, Arndt and Sotiropoulos2013) utilized this technique to study the vortical structures in the wake of a hydrokinetic turbine. Other examples include the study of vorticity dynamics in revolving wings (Cheng et al.
Reference Cheng, Sane, Barbera, Troolin, Strand and Deng2013), jet flows (Cambonie, Gautier & Aider Reference Cambonie, Gautier and Aider2013) and vortical structures generated by plunging wings (Calderon et al.
Reference Calderon, Wang, Gursul and Visbal2013). The system employed in this study consisted of three 8 MP (3320
 $\times$
2496 pixels), 12-bit, frame-straddle, charge-coupled device (CCD) cameras fixed within a frame as shown in figure 4. The flow was seeded with
$\times$
2496 pixels), 12-bit, frame-straddle, charge-coupled device (CCD) cameras fixed within a frame as shown in figure 4. The flow was seeded with
 $50~\unicode[STIX]{x03BC}\text{m}$
silver-coated hollow glass spheres. The measurement volume was set to
$50~\unicode[STIX]{x03BC}\text{m}$
silver-coated hollow glass spheres. The measurement volume was set to
 $140~\text{mm}\times 100~\text{mm}\times 50~\text{mm}$
(
$140~\text{mm}\times 100~\text{mm}\times 50~\text{mm}$
(
 $x\times y\times z$
) and was illuminated using a laser volume supplied by a
$x\times y\times z$
) and was illuminated using a laser volume supplied by a
 $250~\text{mJ}~\text{pulse}^{-1}$
double-pulsed Quantel laser. For each of the eight cases (four tabs, two
$250~\text{mJ}~\text{pulse}^{-1}$
double-pulsed Quantel laser. For each of the eight cases (four tabs, two
 $Re$
), 2500 image pairs were captured at a frequency of 2 Hz and later processed using the Insight V3V software from TSI following the aforementioned scheme. The interrogation voxel had a size of
$Re$
), 2500 image pairs were captured at a frequency of 2 Hz and later processed using the Insight V3V software from TSI following the aforementioned scheme. The interrogation voxel had a size of
 $8~\text{mm}\times 8~\text{mm}\times 8~\text{mm}$
with 70 % overlap, resulting in a final vector grid spacing
$8~\text{mm}\times 8~\text{mm}\times 8~\text{mm}$
with 70 % overlap, resulting in a final vector grid spacing
 $\unicode[STIX]{x0394}x=\unicode[STIX]{x0394}y=\unicode[STIX]{x0394}z\simeq 2~\text{mm}$
after interpolation onto a rectangular grid. A typical image pair resulted in approximately 22 000 independent randomly spaced velocity vectors. Pereira & Gharib (Reference Pereira and Gharib2002) estimated the uncertainty to be less than 1 % in the streamwise and spanwise velocity components and less than 4 % in the wall-normal component for a set-up similar to the one shown in figure 4. This implies an uncertainty less than 6 % in the vortex circulation discussed below. These measurements were used to investigate the large-scale vortices formed downstream of the tabs, and therefore the
$\unicode[STIX]{x0394}x=\unicode[STIX]{x0394}y=\unicode[STIX]{x0394}z\simeq 2~\text{mm}$
after interpolation onto a rectangular grid. A typical image pair resulted in approximately 22 000 independent randomly spaced velocity vectors. Pereira & Gharib (Reference Pereira and Gharib2002) estimated the uncertainty to be less than 1 % in the streamwise and spanwise velocity components and less than 4 % in the wall-normal component for a set-up similar to the one shown in figure 4. This implies an uncertainty less than 6 % in the vortex circulation discussed below. These measurements were used to investigate the large-scale vortices formed downstream of the tabs, and therefore the
 $50~\unicode[STIX]{x03BC}\text{m}$
particles are determined to be sufficient for this purpose. The spatial resolution of the volumetric measurements results in coarser estimation of the velocity gradients compared to those of the planar counterpart. However, the resolution is sufficient to provide meaningful comparison across the various tabs.
$50~\unicode[STIX]{x03BC}\text{m}$
particles are determined to be sufficient for this purpose. The spatial resolution of the volumetric measurements results in coarser estimation of the velocity gradients compared to those of the planar counterpart. However, the resolution is sufficient to provide meaningful comparison across the various tabs.

Figure 5. Schematics of the experimental set-up and details of the field of view for the planar PIV measurements.
2.3 Planar high-spatial-resolution PIV set-up
The high-resolution 2D PIV measurements were made in a streamwise wall-normal plane (
 $x$
–
$x$
–
 $z$
) coinciding with the centre of both the tab and the channel. Measurements were obtained with a planar system from TSI. The working fluid was seeded with
$z$
) coinciding with the centre of both the tab and the channel. Measurements were obtained with a planar system from TSI. The working fluid was seeded with
 $14~\unicode[STIX]{x03BC}\text{m}$
silver-coated hollow glass spheres. A field of view (FOV)
$14~\unicode[STIX]{x03BC}\text{m}$
silver-coated hollow glass spheres. A field of view (FOV)
 $190~\text{mm}\times 112~\text{mm}$
was illuminated using a 1 mm thick laser sheet supplied by a
$190~\text{mm}\times 112~\text{mm}$
was illuminated using a 1 mm thick laser sheet supplied by a
 $250~\text{mJ}~\text{pulse}^{-1}$
double-pulsed laser from Quantel. Four thousand image pairs for each case (four tabs, two
$250~\text{mJ}~\text{pulse}^{-1}$
double-pulsed laser from Quantel. Four thousand image pairs for each case (four tabs, two
 $Re_{h}$
) were captured at a frequency of 1 Hz by an 11 MP, 12-bit, frame-straddle, CCD camera. Figure 5 shows the schematics of the experimental set-up, including the FOV details. Image pairs were interrogated with a recursive cross-correlation method using the Insight 4G software package from TSI. The final interrogation window was 16
$Re_{h}$
) were captured at a frequency of 1 Hz by an 11 MP, 12-bit, frame-straddle, CCD camera. Figure 5 shows the schematics of the experimental set-up, including the FOV details. Image pairs were interrogated with a recursive cross-correlation method using the Insight 4G software package from TSI. The final interrogation window was 16
 $\times$
16 pixels with 50 % overlap, resulting in a final vector grid spacing
$\times$
16 pixels with 50 % overlap, resulting in a final vector grid spacing
 $\unicode[STIX]{x0394}x=\unicode[STIX]{x0394}z=380~\unicode[STIX]{x03BC}\text{m}$
. These measurements were used to acquire detailed, well-resolved turbulence statistics and to capture instability mechanisms in the shear layer downstream of the tabs.
$\unicode[STIX]{x0394}x=\unicode[STIX]{x0394}z=380~\unicode[STIX]{x03BC}\text{m}$
. These measurements were used to acquire detailed, well-resolved turbulence statistics and to capture instability mechanisms in the shear layer downstream of the tabs.
3 Results and discussion

Figure 6. Time-averaged streamwise velocity
 $U/U_{0}$
contours in vertical
$U/U_{0}$
contours in vertical
 $y$
–
$y$
–
 $z$
planes at
$z$
planes at
 $x/h=1$
, 4 and 7 and in the wall-parallel
$x/h=1$
, 4 and 7 and in the wall-parallel
 $x$
–
$x$
–
 $y$
plane at
$y$
plane at
 $z/h=0.41$
obtained from volumetric PIV measurements. Vectors indicate in-plane velocity field. (a,b) Trapezoidal tab, low and high
$z/h=0.41$
obtained from volumetric PIV measurements. Vectors indicate in-plane velocity field. (a,b) Trapezoidal tab, low and high
 $Re_{h}$
, respectively. (c,d) Triangular tab, low and high
$Re_{h}$
, respectively. (c,d) Triangular tab, low and high
 $Re_{h}$
, respectively.
$Re_{h}$
, respectively.

Figure 7. Time-averaged streamwise velocity
 $U/U_{0}$
profiles at the central plane of the four tabs at the low and high
$U/U_{0}$
profiles at the central plane of the four tabs at the low and high
 $Re_{h}$
. The results are obtained from high-spatial-resolution planar PIV. The velocity profiles are taken at the locations indicated in the abscissa and lines indicate rectangular (continuous), trapezoidal (dashed), triangular (dot-dashed) and ellipsoidal (long-dashed) tabs.
$Re_{h}$
. The results are obtained from high-spatial-resolution planar PIV. The velocity profiles are taken at the locations indicated in the abscissa and lines indicate rectangular (continuous), trapezoidal (dashed), triangular (dot-dashed) and ellipsoidal (long-dashed) tabs.
In this section we present the common and distinctive flow statistics and dominant vortical structures for the rectangular, trapezoidal, triangular and ellipsoidal tabs at the low and high
 $Re_{h}$
. Owing to the extensive experimental effort (four tab geometries, two Reynolds numbers and two measurement techniques) and for brevity, we highlight only selected representative cases without compromising the overall discussion. Although the tabs share various geometrical features, including base width, height and inclination angle, their different frontal geometries lead to distinctive characteristics and streamwise evolution of the vortical structures in the wake. First, the impact of the geometry and Reynolds number on the mean flow past the tabs is illustrated in figures 6–10. The normalized time-averaged streamwise velocity contours
$Re_{h}$
. Owing to the extensive experimental effort (four tab geometries, two Reynolds numbers and two measurement techniques) and for brevity, we highlight only selected representative cases without compromising the overall discussion. Although the tabs share various geometrical features, including base width, height and inclination angle, their different frontal geometries lead to distinctive characteristics and streamwise evolution of the vortical structures in the wake. First, the impact of the geometry and Reynolds number on the mean flow past the tabs is illustrated in figures 6–10. The normalized time-averaged streamwise velocity contours
 $U/U_{0}$
for the trapezoidal and triangular tabs are shown in figure 6 within the vertical
$U/U_{0}$
for the trapezoidal and triangular tabs are shown in figure 6 within the vertical
 $y$
–
$y$
–
 $z$
planes at
$z$
planes at
 $x/h=1$
, 4 and 7 and in the wall-parallel
$x/h=1$
, 4 and 7 and in the wall-parallel
 $x$
–
$x$
–
 $y$
plane at
$y$
plane at
 $z/h=0.41$
. In figure 6 and subsequent ones, the centre of the tab base is located at (
$z/h=0.41$
. In figure 6 and subsequent ones, the centre of the tab base is located at (
 $0,0,0$
), the velocity vectors indicate in-plane flow field and the wall-parallel plane at
$0,0,0$
), the velocity vectors indicate in-plane flow field and the wall-parallel plane at
 $z/h=0.41$
marks the lower boundary of the volumetric measurement region. For the two tabs shown in figure 6, and the other two which are not shown for brevity, the velocity distribution is dependent on the incoming flow regime (laminar versus turbulent), where the normalized deficit is reduced for each tab at the higher
$z/h=0.41$
marks the lower boundary of the volumetric measurement region. For the two tabs shown in figure 6, and the other two which are not shown for brevity, the velocity distribution is dependent on the incoming flow regime (laminar versus turbulent), where the normalized deficit is reduced for each tab at the higher
 $Re_{h}$
(turbulent incoming flow). Furthermore, the larger frontal area of the trapezoidal tab (figure 6
a,b) compared to the triangular one (figure 6
c,d) leads, as expected, to a larger normalized flow deficit and near-wake size across both Reynolds numbers. This dependence on the flow-facing tab area was observed for the other tabs as well. The flow-facing tab areas as a percentage of that of the rectangular tab are 81 %, 79 % and 50 % for the trapezoidal, ellipsoidal and triangular tabs, respectively.
$Re_{h}$
(turbulent incoming flow). Furthermore, the larger frontal area of the trapezoidal tab (figure 6
a,b) compared to the triangular one (figure 6
c,d) leads, as expected, to a larger normalized flow deficit and near-wake size across both Reynolds numbers. This dependence on the flow-facing tab area was observed for the other tabs as well. The flow-facing tab areas as a percentage of that of the rectangular tab are 81 %, 79 % and 50 % for the trapezoidal, ellipsoidal and triangular tabs, respectively.
The
 $U/U_{0}$
profiles, shown in figure 7 and obtained using high-spatial-resolution planar PIV at the central plane of the four tabs, highlight the higher sensitivity of the flow field to the tab geometry at the low
$U/U_{0}$
profiles, shown in figure 7 and obtained using high-spatial-resolution planar PIV at the central plane of the four tabs, highlight the higher sensitivity of the flow field to the tab geometry at the low
 $Re_{h}$
. Only the rectangular tab exhibits flow reversal near the wall for
$Re_{h}$
. Only the rectangular tab exhibits flow reversal near the wall for
 ${\sim}3h$
downstream of the tab edge. The inflection points of the velocity profile differ in their vertical location across the tab geometry at the low
${\sim}3h$
downstream of the tab edge. The inflection points of the velocity profile differ in their vertical location across the tab geometry at the low
 $Re_{h}$
. Yang et al. (Reference Yang, Meng and Sheng2001) showed for a trapezoidal tab that the inflection point near
$Re_{h}$
. Yang et al. (Reference Yang, Meng and Sheng2001) showed for a trapezoidal tab that the inflection point near
 $z/h=1$
is associated with the hairpin vortex head while the lower inflection point is associated with a secondary vortical structure with an opposite sense of rotation to the hairpin vortex head. Furthermore, the mean shear,
$z/h=1$
is associated with the hairpin vortex head while the lower inflection point is associated with a secondary vortical structure with an opposite sense of rotation to the hairpin vortex head. Furthermore, the mean shear,
 $\unicode[STIX]{x2202}U/\unicode[STIX]{x2202}z$
, at the tab height is significantly enhanced at the low
$\unicode[STIX]{x2202}U/\unicode[STIX]{x2202}z$
, at the tab height is significantly enhanced at the low
 $Re_{h}$
, promoting KH instability, whose effects will be shown below. At the base of the tabs (figure 7), upstream flow reversal is observed at the low
$Re_{h}$
, promoting KH instability, whose effects will be shown below. At the base of the tabs (figure 7), upstream flow reversal is observed at the low
 $Re_{h}$
, giving rise to the ‘necklace’ vortex that was first observed in the simulations of Dong & Meng (Reference Dong and Meng2004). However, this recirculation region is not present at the high
$Re_{h}$
, giving rise to the ‘necklace’ vortex that was first observed in the simulations of Dong & Meng (Reference Dong and Meng2004). However, this recirculation region is not present at the high
 $Re_{h}$
.
$Re_{h}$
.

Figure 8. Time-averaged spanwise velocity
 $V/U_{0}$
contours for the trapezoidal tab at the low (a) and high (b)
$V/U_{0}$
contours for the trapezoidal tab at the low (a) and high (b)
 $Re_{h}$
in vertical
$Re_{h}$
in vertical
 $y$
–
$y$
–
 $z$
planes at
$z$
planes at
 $x/h=1$
, 4 and 7 and in the wall-parallel
$x/h=1$
, 4 and 7 and in the wall-parallel
 $x$
–
$x$
–
 $y$
plane at
$y$
plane at
 $z/h=0.41$
obtained from volumetric PIV measurements. Vectors indicate in-plane velocity field.
$z/h=0.41$
obtained from volumetric PIV measurements. Vectors indicate in-plane velocity field.

Figure 9. Time-averaged wall-normal velocity
 $W/U_{0}$
contours for the trapezoidal tab at the low (a) and high (b)
$W/U_{0}$
contours for the trapezoidal tab at the low (a) and high (b)
 $Re_{h}$
in vertical
$Re_{h}$
in vertical
 $y$
–
$y$
–
 $z$
planes at
$z$
planes at
 $x/h=1$
, 4 and 7 and in the wall-parallel
$x/h=1$
, 4 and 7 and in the wall-parallel
 $x$
–
$x$
–
 $y$
plane at
$y$
plane at
 $z/h=0.41$
obtained from volumetric PIV measurements. Vectors indicate in-plane velocity field.
$z/h=0.41$
obtained from volumetric PIV measurements. Vectors indicate in-plane velocity field.

Figure 10. Time-averaged wall-normal velocity
 $W/U_{0}$
profiles at
$W/U_{0}$
profiles at
 $z/h=1$
(i.e. tab tip) for the four tabs at the low (a) and high (b)
$z/h=1$
(i.e. tab tip) for the four tabs at the low (a) and high (b)
 $Re_{h}$
. The results are obtained from the volumetric PIV measurements. Colours indicate profiles from the rectangular (green
$Re_{h}$
. The results are obtained from the volumetric PIV measurements. Colours indicate profiles from the rectangular (green
 $+$
), trapezoidal (red
$+$
), trapezoidal (red
 $\ast$
), triangular (blue
$\ast$
), triangular (blue
 $\bigcirc$
) and ellipsoidal (black
$\bigcirc$
) and ellipsoidal (black
 $\times$
) tabs.
$\times$
) tabs.

Figure 11. The counter-rotating vortex pair in the wake of the trapezoidal tab illustrated with
 $x$
-vorticity isosurfaces
$x$
-vorticity isosurfaces
 $\unicode[STIX]{x1D714}_{x}h/U_{0}=+0.1$
(red) and
$\unicode[STIX]{x1D714}_{x}h/U_{0}=+0.1$
(red) and
 $-0.1$
(blue) at the low (a) and high (b)
$-0.1$
(blue) at the low (a) and high (b)
 $Re_{h}$
. The
$Re_{h}$
. The
 $V/U_{0}$
contours and in-plane velocity vector fields in
$V/U_{0}$
contours and in-plane velocity vector fields in
 $y$
–
$y$
–
 $z$
planes at
$z$
planes at
 $x/h=3$
and 6 and in the
$x/h=3$
and 6 and in the
 $x$
–
$x$
–
 $y$
plane at
$y$
plane at
 $z/h=0.41$
are superimposed for clarity. The results are obtained from the volumetric PIV measurements.
$z/h=0.41$
are superimposed for clarity. The results are obtained from the volumetric PIV measurements.

Figure 12. Streamwise evolution of the vertical location
 $z/h$
of the CVP core averaged across both branches at the low (a) and high (b)
$z/h$
of the CVP core averaged across both branches at the low (a) and high (b)
 $Re_{h}$
. Results are from the volumetric PIV measurements for the rectangular (green
$Re_{h}$
. Results are from the volumetric PIV measurements for the rectangular (green
 $+$
), trapezoidal (red
$+$
), trapezoidal (red
 $\ast$
), triangular (blue
$\ast$
), triangular (blue
 $\bigcirc$
) and ellipsoidal (black
$\bigcirc$
) and ellipsoidal (black
 $\times$
) tabs.
$\times$
) tabs.

Figure 13. Streamwise evolution of the normalized circulation
 $\unicode[STIX]{x1D6E4}/\unicode[STIX]{x1D6E4}_{0}$
averaged across both branches of the CVP at the low (a) and high (b)
$\unicode[STIX]{x1D6E4}/\unicode[STIX]{x1D6E4}_{0}$
averaged across both branches of the CVP at the low (a) and high (b)
 $Re_{h}$
. Results are from the volumetric PIV measurements for the rectangular (green
$Re_{h}$
. Results are from the volumetric PIV measurements for the rectangular (green
 $+$
), trapezoidal (red
$+$
), trapezoidal (red
 $\ast$
), triangular (blue
$\ast$
), triangular (blue
 $\bigcirc$
) and ellipsoidal (black
$\bigcirc$
) and ellipsoidal (black
 $\times$
) tabs.
$\times$
) tabs.
The normalized time-averaged spanwise
 $V/U_{0}$
and wall-normal
$V/U_{0}$
and wall-normal
 $W/U_{0}$
velocity distributions for the trapezoidal tab at both
$W/U_{0}$
velocity distributions for the trapezoidal tab at both
 $Re_{h}$
, shown in figures 8 and 9, reveal the signature of the CVP that induces significant mean spanwise flow, and upward wall-normal entrainment at the tab symmetry plane. The spanwise flow
$Re_{h}$
, shown in figures 8 and 9, reveal the signature of the CVP that induces significant mean spanwise flow, and upward wall-normal entrainment at the tab symmetry plane. The spanwise flow
 $V$
reaches up to
$V$
reaches up to
 ${\sim}0.17U_{0}$
at the low
${\sim}0.17U_{0}$
at the low
 $Re_{h}$
and exhibits a decrease in the overall distribution at the high
$Re_{h}$
and exhibits a decrease in the overall distribution at the high
 $Re_{h}$
(figure 8). An upward flow is formed in the region between the two branches of the CVP and reaches up to
$Re_{h}$
(figure 8). An upward flow is formed in the region between the two branches of the CVP and reaches up to
 ${\sim}0.15U_{0}$
at the symmetry plane at the low
${\sim}0.15U_{0}$
at the symmetry plane at the low
 $Re_{h}$
(figure 9). This upward flow is essential in the mixing and transport of near-wall fluid into the free-stream flow (Dong & Meng Reference Dong and Meng2004). Similar to the spanwise component,
$Re_{h}$
(figure 9). This upward flow is essential in the mixing and transport of near-wall fluid into the free-stream flow (Dong & Meng Reference Dong and Meng2004). Similar to the spanwise component,
 $W/U_{0}$
is significantly lower at the high
$W/U_{0}$
is significantly lower at the high
 $Re_{h}$
. The reduction in
$Re_{h}$
. The reduction in
 $V/U_{0}$
and
$V/U_{0}$
and
 $W/U_{0}$
at the high
$W/U_{0}$
at the high
 $Re_{h}$
was also observed for the other tabs. To further inspect the effect of Reynolds number and tab geometry on the vertical flow, figure 10 shows one-dimensional (1D) profiles of
$Re_{h}$
was also observed for the other tabs. To further inspect the effect of Reynolds number and tab geometry on the vertical flow, figure 10 shows one-dimensional (1D) profiles of
 $W/U_{0}$
at
$W/U_{0}$
at
 $z/h=1$
(tab tip) for the four tabs at both
$z/h=1$
(tab tip) for the four tabs at both
 $Re_{h}$
. Despite some spanwise asymmetry, probably a result of multiple factors, fair comparison across the different tab geometries is provided from these profiles. Upstream of
$Re_{h}$
. Despite some spanwise asymmetry, probably a result of multiple factors, fair comparison across the different tab geometries is provided from these profiles. Upstream of
 $x/h=2$
, the region of enhanced vertical flow is mainly due to the inclined geometry of the tabs. Beyond
$x/h=2$
, the region of enhanced vertical flow is mainly due to the inclined geometry of the tabs. Beyond
 $x/h=2$
, the enhanced vertical flow is due to the common-up entrainment induced by the CVP and the upward pumping by intermittent hairpin vortices. These two primary vortical structures are discussed in detail below. Overall, the vertical flow is reduced at the high
$x/h=2$
, the enhanced vertical flow is due to the common-up entrainment induced by the CVP and the upward pumping by intermittent hairpin vortices. These two primary vortical structures are discussed in detail below. Overall, the vertical flow is reduced at the high
 $Re_{h}$
, with the triangular tab showing the lowest wall-normal flow across both
$Re_{h}$
, with the triangular tab showing the lowest wall-normal flow across both
 $Re_{h}$
. At the low
$Re_{h}$
. At the low
 $Re_{h}$
, the rectangular and trapezoidal tabs maintain higher wall-normal flow; while at the high
$Re_{h}$
, the rectangular and trapezoidal tabs maintain higher wall-normal flow; while at the high
 $Re_{h}$
, the rectangular tab performs better than the other tabs.
$Re_{h}$
, the rectangular tab performs better than the other tabs.
The 3D topology of the CVP, which forms due to the pressure drop across the tabs (Dong & Meng Reference Dong and Meng2004), is illustrated for the trapezoidal tab at both
 $Re_{h}$
in figure 11 through isosurfaces of the normalized
$Re_{h}$
in figure 11 through isosurfaces of the normalized
 $x$
-vorticity
$x$
-vorticity
 $\unicode[STIX]{x1D714}_{x}h/U_{0}=\pm 0.1$
with superimposed
$\unicode[STIX]{x1D714}_{x}h/U_{0}=\pm 0.1$
with superimposed
 $V/U_{0}$
planar contours. In contrast to the hairpin vortices, the CVP is present in the mean flow field and, as such,
$V/U_{0}$
planar contours. In contrast to the hairpin vortices, the CVP is present in the mean flow field and, as such,
 $\unicode[STIX]{x1D714}_{x}$
is here calculated using the time-averaged flow field (
$\unicode[STIX]{x1D714}_{x}$
is here calculated using the time-averaged flow field (
 $V,W$
). The structures in figure 11 were also visualized using the
$V,W$
). The structures in figure 11 were also visualized using the
 $Q$
(Hunt, Wray & Moin Reference Hunt, Wray and Moin1988) and
$Q$
(Hunt, Wray & Moin Reference Hunt, Wray and Moin1988) and
 $\unicode[STIX]{x1D706}_{2}$
(Jeong & Hussain Reference Jeong and Hussain1995) criteria and showed similar topology. It is noted that, at the low
$\unicode[STIX]{x1D706}_{2}$
(Jeong & Hussain Reference Jeong and Hussain1995) criteria and showed similar topology. It is noted that, at the low
 $Re_{h}$
, a secondary CVP with an opposite sense of pair rotation to that of the primary one is observed downstream of
$Re_{h}$
, a secondary CVP with an opposite sense of pair rotation to that of the primary one is observed downstream of
 $x/h=5$
(figure 11
a). This secondary structure was observed in the simulations of Dong & Meng (Reference Dong and Meng2004) and Habchi et al. (Reference Habchi, Lemenand, Valle and Peerhossaini2010b
) and was identified as detrimental to mixing, as it induces a downward flow in the symmetry axis of the tab. We provide experimental evidence of this secondary structure appearing at the low
$x/h=5$
(figure 11
a). This secondary structure was observed in the simulations of Dong & Meng (Reference Dong and Meng2004) and Habchi et al. (Reference Habchi, Lemenand, Valle and Peerhossaini2010b
) and was identified as detrimental to mixing, as it induces a downward flow in the symmetry axis of the tab. We provide experimental evidence of this secondary structure appearing at the low
 $Re_{h}$
; however, this structure was not observed at the high
$Re_{h}$
; however, this structure was not observed at the high
 $Re_{h}$
. In fact, this structure was observed for all tabs at the low
$Re_{h}$
. In fact, this structure was observed for all tabs at the low
 $Re_{h}$
but for none at the high
$Re_{h}$
but for none at the high
 $Re_{h}$
. It is likely that the more prominent wall vortical structures at the high
$Re_{h}$
. It is likely that the more prominent wall vortical structures at the high
 $Re$
result in reducing the coherence of this near-wall secondary CVP. Additional measurements of higher resolution are needed to investigate the presence of this structure. As seen in figure 11, the primary CVP is inclined at a higher angle at the low
$Re$
result in reducing the coherence of this near-wall secondary CVP. Additional measurements of higher resolution are needed to investigate the presence of this structure. As seen in figure 11, the primary CVP is inclined at a higher angle at the low
 $Re_{h}$
, possibly due to the presence of the secondary CVP and the lower advection at the low
$Re_{h}$
, possibly due to the presence of the secondary CVP and the lower advection at the low
 $Re_{h}$
. Following a procedure similar to that of Lögdberg, Fransson & Alfredsson (Reference Lögdberg, Fransson and Alfredsson2009) and Habchi et al. (Reference Habchi, Lemenand, Valle and Peerhossaini2010b
), the location of the core of the CVP is identified as the point of maximum
$Re_{h}$
. Following a procedure similar to that of Lögdberg, Fransson & Alfredsson (Reference Lögdberg, Fransson and Alfredsson2009) and Habchi et al. (Reference Habchi, Lemenand, Valle and Peerhossaini2010b
), the location of the core of the CVP is identified as the point of maximum
 $Q_{x}$
, where
$Q_{x}$
, where
 $$\begin{eqnarray}Q_{x}=-\frac{1}{2}\frac{\unicode[STIX]{x2202}W}{\unicode[STIX]{x2202}y}\frac{\unicode[STIX]{x2202}V}{\unicode[STIX]{x2202}z}\end{eqnarray}$$
is the second invariant of the 2D velocity gradient tensor calculated locally in a given
 $y$
–
$y$
–
 $z$
plane. In figure 12, the height of the core for both branches is averaged and shows steeper slope at the low Reynolds number across all tabs.
$z$
plane. In figure 12, the height of the core for both branches is averaged and shows steeper slope at the low Reynolds number across all tabs.
Further, the circulation
 $$\begin{eqnarray}\unicode[STIX]{x1D6E4}=\int _{A}|\unicode[STIX]{x1D714}_{x}|\frac{h}{U_{0}}\,\text{d}A\end{eqnarray}$$
is calculated locally at each
 $y$
–
$y$
–
 $z$
plane. Here,
$z$
plane. Here,
 $|\unicode[STIX]{x1D714}_{x}|h/U_{0}$
is the normalized vorticity in the
$|\unicode[STIX]{x1D714}_{x}|h/U_{0}$
is the normalized vorticity in the
 $x$
-direction and
$x$
-direction and
 $A$
is the normalized area of the vortex defined as the region where
$A$
is the normalized area of the vortex defined as the region where
 $Q_{x}$
drops to 5 % of its maximum value at the core (Lögdberg et al.
Reference Lögdberg, Fransson and Alfredsson2009; Habchi et al.
Reference Habchi, Lemenand, Valle and Peerhossaini2010b
). Figure 13 shows the circulation for all tabs at the two
$Q_{x}$
drops to 5 % of its maximum value at the core (Lögdberg et al.
Reference Lögdberg, Fransson and Alfredsson2009; Habchi et al.
Reference Habchi, Lemenand, Valle and Peerhossaini2010b
). Figure 13 shows the circulation for all tabs at the two
 $Re_{h}$
averaged across both branches and normalized by the global maximum,
$Re_{h}$
averaged across both branches and normalized by the global maximum,
 $\unicode[STIX]{x1D6E4}_{0}$
, which occurs for the trapezoidal tab at
$\unicode[STIX]{x1D6E4}_{0}$
, which occurs for the trapezoidal tab at
 $x/h\sim 4$
at the low
$x/h\sim 4$
at the low
 $Re_{h}$
. Larger circulation and slower decay are observed at the low
$Re_{h}$
. Larger circulation and slower decay are observed at the low
 $Re_{h}$
. This is attributed to the reduced background turbulence from the incoming boundary layer flow (shown in figure 17), which reduces the coherence of the vortical structures induced by the tabs. Consequently, the reduced coherence and circulation at the high
$Re_{h}$
. This is attributed to the reduced background turbulence from the incoming boundary layer flow (shown in figure 17), which reduces the coherence of the vortical structures induced by the tabs. Consequently, the reduced coherence and circulation at the high
 $Re_{h}$
lead to the lower mean spanwise and wall-normal flows discussed earlier. The strength of the CVP exhibits distinctive streamwise evolution across Reynolds number. At the low
$Re_{h}$
lead to the lower mean spanwise and wall-normal flows discussed earlier. The strength of the CVP exhibits distinctive streamwise evolution across Reynolds number. At the low
 $Re_{h}$
, continuous growth in
$Re_{h}$
, continuous growth in
 $\unicode[STIX]{x1D6E4}/\unicode[STIX]{x1D6E4}_{0}$
is observed until a maximum occurs at
$\unicode[STIX]{x1D6E4}/\unicode[STIX]{x1D6E4}_{0}$
is observed until a maximum occurs at
 $x/h\sim 4$
, while the maximum is reached significantly earlier at
$x/h\sim 4$
, while the maximum is reached significantly earlier at
 $x/h\sim 2.5$
at the high
$x/h\sim 2.5$
at the high
 $Re_{h}$
. The lower incoming flow turbulence at the low
$Re_{h}$
. The lower incoming flow turbulence at the low
 $Re_{h}$
allows for the coherence and strength of the CVP to be preserved for a larger downstream distance. Owing to the important role of the CVP in mixing, the distinctive behaviour and topology across
$Re_{h}$
allows for the coherence and strength of the CVP to be preserved for a larger downstream distance. Owing to the important role of the CVP in mixing, the distinctive behaviour and topology across
 $Re_{h}$
suggests higher efficiency through CVP mixing at the low
$Re_{h}$
suggests higher efficiency through CVP mixing at the low
 $Re_{h}$
. Moreover, when such tabs are placed in rows, the spacing must be chosen carefully in correspondence with the operating
$Re_{h}$
. Moreover, when such tabs are placed in rows, the spacing must be chosen carefully in correspondence with the operating
 $Re_{h}$
to maintain energetic steady mixing. Given that the CVP originates due to the pressure drop, it is expected that tab blockage affects the strength of the CVP. However, as seen in figure 13, the normalized circulation does not directly correspond to blockage and is shown to be highly dependent on geometry and incoming flow regime. This suggests the need for application-specific testing when choosing a tab geometry where mixing by the CVP is desired.
$Re_{h}$
to maintain energetic steady mixing. Given that the CVP originates due to the pressure drop, it is expected that tab blockage affects the strength of the CVP. However, as seen in figure 13, the normalized circulation does not directly correspond to blockage and is shown to be highly dependent on geometry and incoming flow regime. This suggests the need for application-specific testing when choosing a tab geometry where mixing by the CVP is desired.
Quasi-periodic hairpin vortices in the wake of trapezoidal tabs have been reported through 2D flow visualizations and planar PIV (Elavarasan & Meng Reference Elavarasan and Meng2000; Yang et al.
Reference Yang, Meng and Sheng2001). However, the 2D character of these measurements falls short in its ability to describe the 3D topology of the hairpin vortices and their interaction with the CVP. Although limited to a low
 $Re_{h}=600$
, the DNS simulations by Dong & Meng (Reference Dong and Meng2004) have greatly advanced the understanding of these structures. They observed that the hairpin vortex heads are rolled from the shear layer formed at the trailing edge of the tab. Moreover, they suggested splitting and deformation as the mechanism responsible for transforming the CVP into the hairpin vortex legs. Our volumetric PIV measurements show the hairpin vortices and their interaction with the CVP at a
$Re_{h}=600$
, the DNS simulations by Dong & Meng (Reference Dong and Meng2004) have greatly advanced the understanding of these structures. They observed that the hairpin vortex heads are rolled from the shear layer formed at the trailing edge of the tab. Moreover, they suggested splitting and deformation as the mechanism responsible for transforming the CVP into the hairpin vortex legs. Our volumetric PIV measurements show the hairpin vortices and their interaction with the CVP at a
 $Re_{h}$
one order of magnitude higher than that of Dong & Meng (Reference Dong and Meng2004). Furthermore, our measurements show that the CVP does not necessarily evolve into the hairpin legs, and that there are various forms of interaction. Figure 14 illustrates a representative instant where the coexistence of the hairpin structures and the CVP takes place in the wake of the ellipsoidal tab at
$Re_{h}$
one order of magnitude higher than that of Dong & Meng (Reference Dong and Meng2004). Furthermore, our measurements show that the CVP does not necessarily evolve into the hairpin legs, and that there are various forms of interaction. Figure 14 illustrates a representative instant where the coexistence of the hairpin structures and the CVP takes place in the wake of the ellipsoidal tab at
 $Re_{h}=2000$
. There, the hairpin structures are identified using an isosurface of the normalized vorticity magnitude
$Re_{h}=2000$
. There, the hairpin structures are identified using an isosurface of the normalized vorticity magnitude
 $|\unicode[STIX]{x1D714}|h/U_{0}=1.2$
. Two stream traces (with
$|\unicode[STIX]{x1D714}|h/U_{0}=1.2$
. Two stream traces (with
 $u-u_{c}$
,
$u-u_{c}$
,
 $v$
,
$v$
,
 $w$
, where
$w$
, where
 $u_{c}$
is the velocity at the core of the downstream hairpin head) are shown to highlight the flow direction and circulation at the hairpin head. The instantaneous CVP (in contrast to the mean one in figure 11) is identified using an isosurface of the normalized
$u_{c}$
is the velocity at the core of the downstream hairpin head) are shown to highlight the flow direction and circulation at the hairpin head. The instantaneous CVP (in contrast to the mean one in figure 11) is identified using an isosurface of the normalized
 $Q$
criterion
$Q$
criterion
 $Q_{x}h^{2}/U_{0}^{2}=0.02$
, where
$Q_{x}h^{2}/U_{0}^{2}=0.02$
, where
 $Q_{x}$
is calculated at consecutive
$Q_{x}$
is calculated at consecutive
 $y$
–
$y$
–
 $z$
planes using (3.1). Note that, for figure 14, both
$z$
planes using (3.1). Note that, for figure 14, both
 $\unicode[STIX]{x1D714}$
and
$\unicode[STIX]{x1D714}$
and
 $Q_{x}$
are calculated based on the instantaneous flow field (
$Q_{x}$
are calculated based on the instantaneous flow field (
 $u,v,w$
). While hairpin vortices were observed for all tabs, we illustrate here those in the wake of an ellipsoidal tab to show that a flat trailing edge is not a necessary condition for the generation of hairpin vortices. This is in contrast with the work of Gretta (Reference Gretta1990), who suggested the need for a flat tab trailing edge for the generation of hairpin vortices. However, we point out that a flat edge is likely to enhance the shear,
$u,v,w$
). While hairpin vortices were observed for all tabs, we illustrate here those in the wake of an ellipsoidal tab to show that a flat trailing edge is not a necessary condition for the generation of hairpin vortices. This is in contrast with the work of Gretta (Reference Gretta1990), who suggested the need for a flat tab trailing edge for the generation of hairpin vortices. However, we point out that a flat edge is likely to enhance the shear,
 $\unicode[STIX]{x2202}u/\unicode[STIX]{x2202}z$
, leading to stronger hairpin vortices, as discussed in the context of the 2D measurements below. As seen in figure 14, hairpin vortices coexist and interact with the CVP. Although the CVP is influenced and deformed due to this interaction, it remains present, in contrast with the observations of Dong & Meng (Reference Dong and Meng2004). An enlarged view of the region
$\unicode[STIX]{x2202}u/\unicode[STIX]{x2202}z$
, leading to stronger hairpin vortices, as discussed in the context of the 2D measurements below. As seen in figure 14, hairpin vortices coexist and interact with the CVP. Although the CVP is influenced and deformed due to this interaction, it remains present, in contrast with the observations of Dong & Meng (Reference Dong and Meng2004). An enlarged view of the region
 $6\leqslant x/h\leqslant 7$
is given in figure 15 and suggests at least two forms of interaction between the hairpin vortex legs and CVP structures. The region A (figure 15
a) highlights the coexistence, and not merging, of the hairpin leg with the CVP. The branch of the CVP with negative streamwise vorticity continues past the hairpin head, while the branch with positive streamwise vorticity undergoes deformation and splits around the hairpin head, as seen in region B (figure 15
b). Similar instantaneous interactions have been observed for the other tabs. High-frame-rate measurements are needed to further investigate the temporal behaviour of these large-scale vortices. Such measurements would allow for a better description of the interaction of the CVP with the hairpin vortices.
$6\leqslant x/h\leqslant 7$
is given in figure 15 and suggests at least two forms of interaction between the hairpin vortex legs and CVP structures. The region A (figure 15
a) highlights the coexistence, and not merging, of the hairpin leg with the CVP. The branch of the CVP with negative streamwise vorticity continues past the hairpin head, while the branch with positive streamwise vorticity undergoes deformation and splits around the hairpin head, as seen in region B (figure 15
b). Similar instantaneous interactions have been observed for the other tabs. High-frame-rate measurements are needed to further investigate the temporal behaviour of these large-scale vortices. Such measurements would allow for a better description of the interaction of the CVP with the hairpin vortices.

Figure 14. Coexistence of hairpin vortices with CVP in the wake of an ellipsoidal tab at the low
 $Re_{h}$
. Hairpin structures (in blue) are identified using the
$Re_{h}$
. Hairpin structures (in blue) are identified using the
 $|\unicode[STIX]{x1D714}|h/U_{0}=1.2$
isosurface. CVP (in red) is identified using the
$|\unicode[STIX]{x1D714}|h/U_{0}=1.2$
isosurface. CVP (in red) is identified using the
 $Q_{x}h^{2}/U_{0}^{2}=0.02$
isosurface. Two stream traces (with
$Q_{x}h^{2}/U_{0}^{2}=0.02$
isosurface. Two stream traces (with
 $u-u_{c}$
,
$u-u_{c}$
,
 $v$
,
$v$
,
 $w$
, where
$w$
, where
 $u_{c}$
is the velocity at the core of the hairpin head) are shown to depict the sense of rotation. The levels for the
$u_{c}$
is the velocity at the core of the hairpin head) are shown to depict the sense of rotation. The levels for the
 $u/U_{0}$
contours in the wall-parallel
$u/U_{0}$
contours in the wall-parallel
 $x$
–
$x$
–
 $y$
plane at
$y$
plane at
 $z/h=0.41$
are the same as in figure 6. The results are obtained from volumetric PIV measurements; the hairpin vortices without the CVP are shown in the top right corner for clarity.
$z/h=0.41$
are the same as in figure 6. The results are obtained from volumetric PIV measurements; the hairpin vortices without the CVP are shown in the top right corner for clarity.

Figure 15. Enlarged view from figure 14 around
 $6\lesssim x/h\lesssim 7$
illustrating the interaction between the hairpin vortex and CVP.
$6\lesssim x/h\lesssim 7$
illustrating the interaction between the hairpin vortex and CVP.
Further insight into the formation, dynamics and trajectory of the heads of the hairpin vortices is gained from the representative instantaneous signed swirling strength
 $\unicode[STIX]{x1D6EC}_{ci}h/U_{0}$
fields obtained from the 2D high-resolution measurements given in figure 16. Here
$\unicode[STIX]{x1D6EC}_{ci}h/U_{0}$
fields obtained from the 2D high-resolution measurements given in figure 16. Here
 $\unicode[STIX]{x1D6EC}_{ci}$
is the magnitude of the imaginary part of the complex eigenvalues of the velocity gradient tensor (Zhou et al.
Reference Zhou, Adrian, Balachandar and Kendall1999) and its sign indicates the orientation of the swirl (Wu & Christensen Reference Wu and Christensen2006). Figure 16 highlights the generation of hairpin vortices (heads) in the case of triangular and ellipsoidal tabs regardless of their lack of a flat trailing edge. Moreover, figure 16 contrasts the dynamics across
$\unicode[STIX]{x1D6EC}_{ci}$
is the magnitude of the imaginary part of the complex eigenvalues of the velocity gradient tensor (Zhou et al.
Reference Zhou, Adrian, Balachandar and Kendall1999) and its sign indicates the orientation of the swirl (Wu & Christensen Reference Wu and Christensen2006). Figure 16 highlights the generation of hairpin vortices (heads) in the case of triangular and ellipsoidal tabs regardless of their lack of a flat trailing edge. Moreover, figure 16 contrasts the dynamics across
 $Re_{h}$
for the four tabs. In particular, the necklace vortex at the upstream edge of the four tabs, illustrated at the top left corner of the rectangular tab at low
$Re_{h}$
for the four tabs. In particular, the necklace vortex at the upstream edge of the four tabs, illustrated at the top left corner of the rectangular tab at low
 $Re_{h}$
, is not present at the high
$Re_{h}$
, is not present at the high
 $Re_{h}$
. At the low
$Re_{h}$
. At the low
 $Re_{h}$
, the high shear,
$Re_{h}$
, the high shear,
 $\unicode[STIX]{x2202}u/\unicode[STIX]{x2202}z$
, promotes KH instability that manifests in the periodic shedding of hairpin vortices. In fact, the flow is mostly laminar upstream of this location at this
$\unicode[STIX]{x2202}u/\unicode[STIX]{x2202}z$
, promotes KH instability that manifests in the periodic shedding of hairpin vortices. In fact, the flow is mostly laminar upstream of this location at this
 $Re_{h}$
. Interestingly, the geometry affects the location of the onset of hairpin vortices at the low
$Re_{h}$
. Interestingly, the geometry affects the location of the onset of hairpin vortices at the low
 $Re_{h}$
. A careful review of numerous instantaneous fields suggests that the largest delay in hairpin vortex location occurs for triangular tabs. The vortex dynamics at the high
$Re_{h}$
. A careful review of numerous instantaneous fields suggests that the largest delay in hairpin vortex location occurs for triangular tabs. The vortex dynamics at the high
 $Re_{h}$
are remarkably richer due to the turbulent nature of the incoming and wake flows. The entire wake exhibits a high population of vortical structures and lacks the well-formed KH instability observed at the low
$Re_{h}$
are remarkably richer due to the turbulent nature of the incoming and wake flows. The entire wake exhibits a high population of vortical structures and lacks the well-formed KH instability observed at the low
 $Re_{h}$
. The multi-scale finer structures around the large-scale hairpin vortices affect their strength, path and coherence.
$Re_{h}$
. The multi-scale finer structures around the large-scale hairpin vortices affect their strength, path and coherence.

Figure 16. Instantaneous signed swirling strength
 $\unicode[STIX]{x1D6EC}_{ci}h/U_{0}$
at the central plane of the four tabs at both
$\unicode[STIX]{x1D6EC}_{ci}h/U_{0}$
at the central plane of the four tabs at both
 $Re_{h}$
. The top left panel shows an example of the necklace vortex formed at the leading edge of the tabs for the low
$Re_{h}$
. The top left panel shows an example of the necklace vortex formed at the leading edge of the tabs for the low
 $Re$
cases. The results are obtained from high-spatial-resolution planar PIV measurements.
$Re$
cases. The results are obtained from high-spatial-resolution planar PIV measurements.

Figure 17. Turbulent kinetic energy
 $\text{TKE}=\langle {u^{\prime }}^{2}+{w^{\prime }}^{2}\rangle /2U_{0}^{2}$
fields for the four tabs at both
$\text{TKE}=\langle {u^{\prime }}^{2}+{w^{\prime }}^{2}\rangle /2U_{0}^{2}$
fields for the four tabs at both
 $Re_{h}$
. The results are obtained from the high-spatial-resolution planar PIV measurements.
$Re_{h}$
. The results are obtained from the high-spatial-resolution planar PIV measurements.

Figure 18. Primary Reynolds shear stress
 $-\langle u^{\prime }w^{\prime }\rangle /U_{0}^{2}$
fields for the four tabs at both
$-\langle u^{\prime }w^{\prime }\rangle /U_{0}^{2}$
fields for the four tabs at both
 $Re_{h}$
. The results are obtained from the high-spatial-resolution planar PIV measurements.
$Re_{h}$
. The results are obtained from the high-spatial-resolution planar PIV measurements.
Table 2. Normalized average circulation
 $\bar{\unicode[STIX]{x1D6E4}}/(U_{0}h)$
and vortex core radius
$\bar{\unicode[STIX]{x1D6E4}}/(U_{0}h)$
and vortex core radius
 $\bar{r_{c}}/h$
of hairpin heads observed within
$\bar{r_{c}}/h$
of hairpin heads observed within
 $5.5\leqslant x/h\leqslant 7.5$
for the four tabs at the low
$5.5\leqslant x/h\leqslant 7.5$
for the four tabs at the low
 $Re_{h}$
. Subindex
$Re_{h}$
. Subindex
 $r$
indicates a quantity from the rectangular tab.
$r$
indicates a quantity from the rectangular tab.

The comparatively low turbulence levels at the low
 $Re_{h}$
allow for further comparisons in the strength and scale of the hairpin heads across tab geometries. Following Moriconi (Reference Moriconi2009), we chose the Lamb–Oseen vortex as a simplified model to represent the head of hairpin vortices identified at the low
$Re_{h}$
allow for further comparisons in the strength and scale of the hairpin heads across tab geometries. Following Moriconi (Reference Moriconi2009), we chose the Lamb–Oseen vortex as a simplified model to represent the head of hairpin vortices identified at the low
 $Re_{h}$
in figure 16. The Lamb–Oseen vortex is a non-stationary solution of the Navier–Stokes equations given in cylindrical coordinates as
$Re_{h}$
in figure 16. The Lamb–Oseen vortex is a non-stationary solution of the Navier–Stokes equations given in cylindrical coordinates as
 $$\begin{eqnarray}u_{\unicode[STIX]{x1D703}}(r)=\frac{\unicode[STIX]{x1D6E4}}{2\unicode[STIX]{x03C0}r}[1-\text{e}^{-r^{2}/r_{c}^{2}}].\end{eqnarray}$$
Here,
 $r_{c}$
is the vortex core radius at a given instant and
$r_{c}$
is the vortex core radius at a given instant and
 $r$
is the radial distance from the vortex core. Although a simplified model, it shows remarkable agreement with the measured data. To allow for comparisons across different tabs, we compute the normalized mean circulation
$r$
is the radial distance from the vortex core. Although a simplified model, it shows remarkable agreement with the measured data. To allow for comparisons across different tabs, we compute the normalized mean circulation
 $\bar{\unicode[STIX]{x1D6E4}}/(U_{0}h)$
and vortex core radius
$\bar{\unicode[STIX]{x1D6E4}}/(U_{0}h)$
and vortex core radius
 $\bar{r_{c}}/h$
for hairpin heads within
$\bar{r_{c}}/h$
for hairpin heads within
 $5.5\leqslant x/h\leqslant 7.5$
across 30 instantaneous fields. Both
$5.5\leqslant x/h\leqslant 7.5$
across 30 instantaneous fields. Both
 $\unicode[STIX]{x1D6E4}$
and
$\unicode[STIX]{x1D6E4}$
and
 $r_{c}$
were obtained from curve fitting individual hairpin heads to the Lamb–Oseen model;
$r_{c}$
were obtained from curve fitting individual hairpin heads to the Lamb–Oseen model;
 $\bar{\unicode[STIX]{x1D6E4}}/(U_{0}h)$
and
$\bar{\unicode[STIX]{x1D6E4}}/(U_{0}h)$
and
 $\bar{r_{c}}/h$
are reported in table 2. The rectangular tab has the highest circulation and core radius, while the triangular tab shows the weaker and smaller hairpin heads. To facilitate comparison, the quantities for the other tabs are scaled by that of the rectangular. There, it is noted that the circulation of the hairpin heads for the triangular tab are
$\bar{r_{c}}/h$
are reported in table 2. The rectangular tab has the highest circulation and core radius, while the triangular tab shows the weaker and smaller hairpin heads. To facilitate comparison, the quantities for the other tabs are scaled by that of the rectangular. There, it is noted that the circulation of the hairpin heads for the triangular tab are
 ${\sim}50\,\%$
of those of the rectangular one, but their size is similar (
${\sim}50\,\%$
of those of the rectangular one, but their size is similar (
 $r_{c}$
for the triangular tab is
$r_{c}$
for the triangular tab is
 $92\,\%$
of the rectangular). As reported in table 2, tab geometry, through blockage and trailing edge, plays a significant role in determining the scale and strength of the generated hairpin vortices.
$92\,\%$
of the rectangular). As reported in table 2, tab geometry, through blockage and trailing edge, plays a significant role in determining the scale and strength of the generated hairpin vortices.
Finally, the turbulent kinetic energy
 $\text{TKE}=\langle {u^{\prime }}^{2}+{w^{\prime }}^{2}\rangle /2U_{0}^{2}$
and primary Reynolds shear stress
$\text{TKE}=\langle {u^{\prime }}^{2}+{w^{\prime }}^{2}\rangle /2U_{0}^{2}$
and primary Reynolds shear stress
 $-\langle u^{\prime }w^{\prime }\rangle /U_{0}^{2}$
obtained from the planar PIV measurements are given in figures 17 and 18 for the four tabs at both
$-\langle u^{\prime }w^{\prime }\rangle /U_{0}^{2}$
obtained from the planar PIV measurements are given in figures 17 and 18 for the four tabs at both
 $Re_{h}$
. The figures illustrate the distinctive behaviour of the velocity fluctuations across
$Re_{h}$
. The figures illustrate the distinctive behaviour of the velocity fluctuations across
 $Re_{h}$
. In contrast to the high
$Re_{h}$
. In contrast to the high
 $Re_{h}$
case, enhanced turbulence levels are delayed by
$Re_{h}$
case, enhanced turbulence levels are delayed by
 ${\sim}(2{-}3)h$
behind the downstream edge of the tab. In this region, the high shear promotes KH instability. The reduced turbulence levels within this region along with the delayed generation of hairpin vortices (figure 16) allow the CVP to maintain coherence and growth in strength in contrast to the high
${\sim}(2{-}3)h$
behind the downstream edge of the tab. In this region, the high shear promotes KH instability. The reduced turbulence levels within this region along with the delayed generation of hairpin vortices (figure 16) allow the CVP to maintain coherence and growth in strength in contrast to the high
 $Re_{h}$
case (figure 13). Figures 17 and 18 suggest that this instability develops over a larger distance for the triangular tab, which is in line with the mean shear,
$Re_{h}$
case (figure 13). Figures 17 and 18 suggest that this instability develops over a larger distance for the triangular tab, which is in line with the mean shear,
 $\unicode[STIX]{x2202}U/\unicode[STIX]{x2202}z$
, inferred from figure 7. Dong & Meng (Reference Dong and Meng2004) and Habchi et al. (Reference Habchi, Lemenand, Valle and Peerhossaini2010b
) have discussed in detail the role of the various vortical structures in mixing. Given the distinctive vortex dynamics across
$\unicode[STIX]{x2202}U/\unicode[STIX]{x2202}z$
, inferred from figure 7. Dong & Meng (Reference Dong and Meng2004) and Habchi et al. (Reference Habchi, Lemenand, Valle and Peerhossaini2010b
) have discussed in detail the role of the various vortical structures in mixing. Given the distinctive vortex dynamics across
 $Re_{h}$
and tab geometry, the problem of mixing maximization proves to be a complex one best determined at the operational
$Re_{h}$
and tab geometry, the problem of mixing maximization proves to be a complex one best determined at the operational
 $Re_{h}$
.
$Re_{h}$
.
4 Conclusions
We provide 3D PIV measurements of the CVP, hairpin vortices and secondary CVP in the wake of tabs with various geometries. We further offer new evidence on the interaction of these primary and secondary structures. Across the four studied tab geometries and two
 $Re_{h}$
, the CVP is coherently present in the mean flow field and leads to significant mean spanwise and wall-normal flows. The topology and strength of the CVP exhibit distinctive behaviour across Reynolds number, where growth in strength is observed for a significantly longer distance and a steeper inclination angle is maintained at the low
$Re_{h}$
, the CVP is coherently present in the mean flow field and leads to significant mean spanwise and wall-normal flows. The topology and strength of the CVP exhibit distinctive behaviour across Reynolds number, where growth in strength is observed for a significantly longer distance and a steeper inclination angle is maintained at the low
 $Re_{h}$
across the four tabs. Moreover, a secondary CVP with opposite sense of rotation to that of the primary one is observed for the four tabs only at the low
$Re_{h}$
across the four tabs. Moreover, a secondary CVP with opposite sense of rotation to that of the primary one is observed for the four tabs only at the low
 $Re_{h}$
and is determined to be detrimental to mixing due to its downward flow entrainment at its central plane. The larger circulation of the CVP at the low
$Re_{h}$
and is determined to be detrimental to mixing due to its downward flow entrainment at its central plane. The larger circulation of the CVP at the low
 $Re_{h}$
is attributed to lower turbulence levels of the incoming flow, which reduce the coherence of the CVP. This larger circulation and enhanced coherence result in comparatively larger mean spanwise and wall-normal flows for the four tabs at the low
$Re_{h}$
is attributed to lower turbulence levels of the incoming flow, which reduce the coherence of the CVP. This larger circulation and enhanced coherence result in comparatively larger mean spanwise and wall-normal flows for the four tabs at the low
 $Re_{h}$
. The flow field is shown to be sensitive to the tab geometry. The CVP retains the highest circulation for the trapezoidal tab at the low
$Re_{h}$
. The flow field is shown to be sensitive to the tab geometry. The CVP retains the highest circulation for the trapezoidal tab at the low
 $Re_{h}$
, suggesting its superiority in steady mixing through the induced mean spanwise and wall-normal flows. At the low
$Re_{h}$
, suggesting its superiority in steady mixing through the induced mean spanwise and wall-normal flows. At the low
 $Re_{h}$
, the circulation for the trapezoidal tab is higher than that of the rectangular tab even though it has a significantly lower flow-facing area (81 % of that of the rectangular tab). At the high
$Re_{h}$
, the circulation for the trapezoidal tab is higher than that of the rectangular tab even though it has a significantly lower flow-facing area (81 % of that of the rectangular tab). At the high
 $Re_{h}$
, the trapezoidal and rectangular tabs exhibit approximately similar circulation. The triangular tab exhibits the lowest circulation across both
$Re_{h}$
, the trapezoidal and rectangular tabs exhibit approximately similar circulation. The triangular tab exhibits the lowest circulation across both
 $Re_{h}$
.
$Re_{h}$
.
In contrast to the work of Gretta (Reference Gretta1990), the 2D and 3D measurements presented here provide evidence that hairpin vortices are formed in ellipsoidal and trapezoidal tabs regardless of their lack of a flat trailing edge. However, the presence of a flat trailing edge leads to larger mean shear,
 $\unicode[STIX]{x2202}U/\unicode[STIX]{x2202}z$
, and consequently stronger hairpin vortices. The interaction of the CVP with the hairpin vortices for the four tabs at the low
$\unicode[STIX]{x2202}U/\unicode[STIX]{x2202}z$
, and consequently stronger hairpin vortices. The interaction of the CVP with the hairpin vortices for the four tabs at the low
 $Re_{h}$
, captured in 3D, shows a complex coexistence of both structures, with the CVP undergoing deformation and splitting at times. In contrast to previous studies, we observe the CVP to remain coherently present regardless of this complex interaction. The high-spatial-resolution PIV measurements at the central plane allowed for the quantification of the strength and scale of the heads of the generated hairpin vortices across the various tabs. The heads at the central plane are found to be in good agreement with the Lamb–Oseen vortex model. Using this formulation, we provide evidence for the ability of rectangular tabs to generate stronger hairpin vortices relative to trapezoidal, triangular and ellipsoidal ones. The generation of hairpin vortices is delayed
$Re_{h}$
, captured in 3D, shows a complex coexistence of both structures, with the CVP undergoing deformation and splitting at times. In contrast to previous studies, we observe the CVP to remain coherently present regardless of this complex interaction. The high-spatial-resolution PIV measurements at the central plane allowed for the quantification of the strength and scale of the heads of the generated hairpin vortices across the various tabs. The heads at the central plane are found to be in good agreement with the Lamb–Oseen vortex model. Using this formulation, we provide evidence for the ability of rectangular tabs to generate stronger hairpin vortices relative to trapezoidal, triangular and ellipsoidal ones. The generation of hairpin vortices is delayed
 ${\sim}(2{-}3)h$
at the low
${\sim}(2{-}3)h$
at the low
 $Re_{h}$
due to the presence of KH instability. Negligible turbulence levels within the instability region allow for the CVP to maintain coherence and growth in strength. While the trapezoidal tab exhibited the highest circulation for the CVP, the hairpin heads in its wake are found to be much weaker than those of the rectangular tab (
$Re_{h}$
due to the presence of KH instability. Negligible turbulence levels within the instability region allow for the CVP to maintain coherence and growth in strength. While the trapezoidal tab exhibited the highest circulation for the CVP, the hairpin heads in its wake are found to be much weaker than those of the rectangular tab (
 ${\sim}50\,\%$
of the rectangular). This evidence suggests the need for heat transfer measurements to indicate which tab is the superior passive mixer in HEV applications. Finally, the considerably distinctive vortex dynamics across
${\sim}50\,\%$
of the rectangular). This evidence suggests the need for heat transfer measurements to indicate which tab is the superior passive mixer in HEV applications. Finally, the considerably distinctive vortex dynamics across
 $Re_{h}$
suggests that tab geometry and spacing must be chosen specifically according to the operational incoming flow regime.
$Re_{h}$
suggests that tab geometry and spacing must be chosen specifically according to the operational incoming flow regime.
Acknowledgements
This work was supported by the Department of Mechanical Science and Engineering, University of Illinois at Urbana-Champaign, as part of the start-up package of Leonardo P. Chamorro. The experiments were performed in a facility built under the National Science Foundation grant award CBET-0923106. The authors are grateful for the help of Dr C. Marsh at the US Army Construction Engineering Research Laboratory (CERL), and undergraduate students A. Gibson, D. Harmon, M. Sadowski and D. Jeffries at the University of Illinois.


