1. Introduction
1.1 One of the critical assumptions in funding pension schemes, pricing annuity products and reserving for annuity portfolios is the longevity of the individuals involved.
1.2 Longevity is, in itself, a measure of survival, and so a function of underlying mortality rates. Modelling mortality rates and, so, in turn, life expectancy has long been the role of actuaries (in financial arenas) and statistical demographers (in fiscal and social planning).
1.3 In this paper we focus on the statistical predictors of mortality and longevity. Particular focus is given to pension schemes, since the dataset used relates to occupational pension schemes, and the expertise of the authors lends itself to pensions’ applications. However, the conclusions will be directly applicable to pensions actuaries and be of interest to life actuaries.
1.4 Section 2 provides some context to the problem of predicting pensioner longevity. We proceed to identify which items of information stored on the administration systems of a typical pension scheme most strongly predict the mortality experienced by members post retirement. This requires us to describe the dataset used (Section 3), including the measures taken to ensure the quality of the data, before we explain, in Section 4, the methods used to disaggregate the effect of multiple predictors in a heterogeneous dataset.
1.5 The results of our analysis highlight the relative importance of gender, affluence, lifestyle and retirement health status as predictors for post-retirement mortality, and hence longevity. These results are presented in Section 5. We also consider the question of how best to measure affluence. We show that, for men, it is the salary at retirement or at earlier exit, rather than the pension, which is more informative. This section also describes the way in which the mortality gap between different individuals attenuates (declines) with age for all factors.
1.6 This paper, by necessity, includes a discussion of a range of techniques, some of which may be unfamiliar to some readers. We have included a glossary (see Appendix), covering those statistical terms used which we believe may be unfamiliar to readers. When these terms are first introduced, we have highlighted them in italics.
2. Predicting post-retirement longevity
2.1 Actuaries advising pension schemes are frequently called upon to advise on appropriate longevity assumptions – be it for sponsors to use for corporate accounting and for funding purposes, or trustees, in order that they may make an informed assumption for funding or other purposes. In particular, the focus is usually on the mortality experienced once a member retires, since, financially, this is the most important period.
2.2 Usually the post-retirement mortality assumption is split into two parts. The first is current mortality, the ‘baseline’ in regulatory terms (The Pensions Regulator, 2008). For large groups of individuals, for example at the national and regional levels, and very large pension schemes, this can be graduated directly, based upon experience. More usually, it is deduced for a particular scheme by adjusting a published mortality table to the experience of the scheme, or using adjustments which reflect the scheme's broad characteristics (for example using the scheme's industry, typical pension amounts or a postcode analysis to deduce an appropriate adjustment factor, based upon wider experience such as the CMI's study of self-administered pension schemes and the ONS's population level analysis).
2.3 The second part of the assumption is how these mortality rates may change in the future, which is inherently more uncertain. Since it is commonly assumed that mortality rates will fall, this assumption is often referred to as the ‘future improvement assumption’.
2.4 The focus of this paper is on the baseline post-retirement mortality assumptions and how the membership of a pension scheme can be profiled (or segmented) by a variety of characteristics, into groups more homogeneous in terms of mortality experience. Currently, it is usual practice for the future improvement assumption to be the same for individuals within a scheme, regardless of the characteristics of different individuals (other than, perhaps, gender). A discussion of how recent improvements have differed by longevity characteristic, and how their future evolution might be modelled, is outside the scope of this paper, although the authors would encourage further research in this area.
2.5 Figure 1 shows, relative to published tables, the potential variability in baseline mortality that exists between different schemes. For each of the 91 occupational pension schemes, which had contributed data to Club Vita by December 2008 (see Section 3), the ratio of the observed male mortality which would be expected, had the experience been in accordance with the ‘00’ series life office normal retirement pensioner tables (the ‘PNxL00’ tables), is plotted against the corresponding ratio for women.

Figure 1 Ratio of actual mortality to expected mortality for pensioners and dependants aged 65 and over for the period 2005 to 2007 for each of the 91 occupational pension schemes within the Club Vita dataset as at December 2008.
2.6 Figure 2 shows that these variations in experience lead to over five years’ difference, at the scheme level, in observed (period) life expectancy from age 65 for men, and almost six years’ difference for women. It is worth noting that fewer schemes are shown in Figure 2, namely 67, as we have applied strict criteria to the minimum scheme size (exposed to risk in excess of 1,000 life years) and to the availability of data at each age (minimum exposed to risk of 100 life years in each age band up to age 90). We have excluded some schemes, because, for some of the smallest and most immature schemes, a credible period life expectancy cannot be calculated.

Figure 2 Variation in observed period life expectancy based on data for 2005 to 2007 for 67 of the 91 occupational pension schemes within the Club Vita dataset as at December 2008.
2.7 The ranges of experience seen in Figure 1 and Figure 2 are currently equivalent to a range of over 15% in liability valuations. At a scheme level this is material. However, each scheme also aggregates over heterogeneous underlying populations. The individual members of pension schemes tend to be heterogeneous in terms of occupation (for example, manual and clerical workers in the same scheme), affluence and lifestyle, and hence in longevity prospects.
2.8 Univariate studies, stratified by gender and age, have shown that mortality rates and life expectancy are distinctly different for populations segmented by occupation-based social class (ONS 2007), industry (CMI 2007), affluence (CMI 2009b) and geo-demographics (ONS 2008). However, in all of these studies two issues remain. First, within each group considerable heterogeneity remains – for example, each of the ‘social class by occupation’ categories historically reported upon (i.e. ranging from I – Professionals to V – Unskilled Occupations) are likely to contain a wide spread of incomes. Second, the effects estimated by these studies cannot be readily combined into an actuarial assumption, owing to the correlations between factors such as income and social class. Relatively little work which seeks to disaggregate the underlying heterogeneity has been published to date. Notable exceptions in this regard are Richards & Jones (Reference Richards and Jones2004) and Richards (Reference Richards2008), although this is the first time when such approaches have been applied to data from occupational pension schemes in particular.
2.9 We use multivariable analysis to model post-retirement mortality in terms of a number of variables, showing, in Section 5, that these variables explain a difference of over 10 years in life expectancy from age 65. Crucially, each of the schemes considered in Figure 1 and Figure 2 has a distinct mix of current pensioners across this range of life expectancies.
2.10 Within this paper, the post-retirement mortality rates are calibrated to the recent experience of current pensioners. However, by profiling the membership of a scheme in terms of explanatory variables such as affluence, geo-demographics and retirement health status, the analysis lends itself to the identification of an appropriate baseline post-retirement assumption for future pensioners as well as for current pensioners.
2.11 Understanding the profile of a scheme's membership in terms of predictive variables, and the mortality rates associated with individuals of like characteristics, enables us:
– to reduce estimation risk in the baseline assumption by reducing the reliance placed on a single, actual over expected ratio, the confidence interval for which is often large;
– to reflect changes in the nature of future pensioners compared to current pensioners automatically – many companies’ workforces have changed substantially over time. For example, the printing and car manufacturing industries have, in general, shifted from heavy manual production to high technology automated production lines. Inferences made about the post-retirement mortality of the active members and deferred pensioners, of a particular scheme, based upon the recent experience or general characteristics of the current pensioner population of that same scheme, can be misleading resulting in inappropriate technical provisions, balance sheet liabilities, and costings of ongoing accrual;
– to identify whether sub-groups of the scheme's membership have different longevity characteristics, which can be important if seeking an equitable sharing of the costs of benefits accruing (or deficit arising) between employers in multi-employer schemes, or when assessing debts upon cessation events, such as an employer leaving a scheme; and
– to tailor a mortality assumption to the potential new members arising from a scheme merger, facilitating more reliable assessments of the impact of any proposed merger, and the terms of any transfer of liabilities.
2.12 The accurate assessment of baseline mortality is also key to risk-reduction strategies. For schemes implementing liability-driven investment solutions, it is critical to reliably identify the best estimate cash-flows against which to construct a hedging portfolio. Where a scheme is contemplating using derivatives designed to hedge against longevity trend risk, the trustees need a reliable starting position if they are to appreciate truly the risk-reduction and cost implications of such transactions.
2.13 Some schemes are also seeking to remove concentrated idiosyncratic risk, i.e. where a small number of members represents a disproportionate amount of the scheme's liabilities. It is highly likely that these members are also towards the top end of the life expectancy spectrum. A key first step in assessing the cost effectiveness of any annuity (or alternative) solution is, therefore, to have a reliable estimate of the longevity of these members.
3. Dataset used and data preparation
3.1. Dataset Used
3.1.1 The data underlying this paper have been collected by Club Vita, an organisation which provides longevity analytics to pension schemes, employers and their actuarial advisers. The data come exclusively from occupational pension schemes, and cover almost five million records, including current and former active members, deferred pensioners, pensioners, dependants and deceased members. The analysis in this paper relates specifically to the first 91 schemes for which data had been cleaned and analysed as at March 2009.
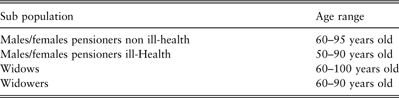
3.1.2 The analysis of this paper focuses on the records of pensioners currently in receipt of benefits; widows, widowers and children in receipt of pension benefits (collectively known as dependants); and deceased members (who, at the time of death may have been any one of these types of members). At the time of analysis there were in excess of 1.6 million such records spanning 1992 to 2008.
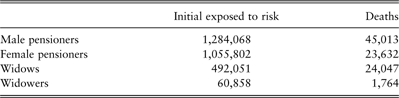
3.1.3 Table 1 provides some key indicators of the size of the dataset. Since we will be focussing our analysis on informing the baseline assumption of recent mortality rates, we have concentrated on analysing the recent calendar years of 2005 to 2007.
Table 1 Summary of Club Vita dataset for the period 2005 to 2007.
3.1.4 The schemes in the dataset relate to a broad mix of industry types, including basic materials, industrials, consumer goods, consumer services, utilities, financials, technology, local authorities and charities.
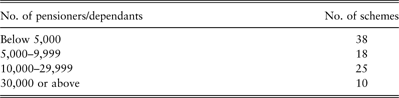
3.1.5 Table 2 provides a summary of the size of schemes in terms of the number of pensioners and dependants.
Table 2 Summary of scheme size.

3.1.6 Different schemes hold different data on their administration systems. Club Vita collects a full history of each member's movement through the scheme, including the key dates required for exposure calculations. In addition, extensive information is collected on a member's background, for example, the nature of the occupation (i.e. manual, non-manual or executive) whilst employed, the reason for leaving/retirement, salary history, pension amount, etc. This information provides a rich set of possible longevity differentiators (covariates).
3.1.7 Table 3 provides a summary of the range of two of these covariates, annual pension amounts and full-time equivalent salaries (revalued to 2008), for pensioners in the dataset.
Table 3 Summary of affluence measures.

3.1.8 Administration records include personal information such as name, address and postcode. This information can be used to verify the data collected, and also to augment the dataset, with additional covariates available from third party databases. For example, there are a number of commercial profilers that map United Kingdom postcodes onto geo-demographic profiles using propensity indices, such as the ACORN system used for the data presented in this paper (CACI, 2009). These are based on demographic and consumer lifestyle databases, and, whilst designed for marketing purposes, they have proven to be effective at predicting mortality (see, for example, Richards (Reference Richards2008) for further discussion).
3.1.9 Risk factors or differentiators are used to search for patterns in the data, and so to identify types of people who experience similar mortality rates. When analysing mortality and longevity, we are interested in identifying important predictive covariates from the wide range of covariates available to us. This paper will focus on analysing the effects of age, gender, retirement health, pension amount, last known salary (revalued to current monetary terms with RPI), and geo-demographic indicators on mortality. This is not an exhaustive list of possible differentiators, and we would expect subsequent analysis to extend the list of material risk factors.
3.1.10 Schemes typically have a provision for members to retire on enhanced benefits if they are unable to work due to ill-health. This gives rise to a binary covariate, “ill-health” or “non ill-health”, which relates to the health at retirement. Figure 3 shows, using male pensioners as an example, that the general patterns in mortality are quite different for these two groups. We have, therefore, stratified (segmented) the population by health at retirement, and have fitted different models to the ill-health and the non ill-health populations.

Figure 3 Crude mortality rates with beta-binomial 95% credibility intervals in the logit scale for male pensioners.
3.1.11 We collect two different affluence proxies: the amount of pension and the last known salary, i.e. the salary at retirement or at earlier exit from active membership. Our a priori belief is that the pension is, at best, a crude proxy to affluence, owing to its dependence on the service with the employer. Low pensions, in particular, can be misleading, since they may relate to a low paid but long serving employee, a short serving higher paid employee, or someone whose accrual was limited through career breaks, part-time work or the closure of the scheme to future accrual. An element of our analysis is to identify whether the salary at retirement or at exit (which is commonly stored on occupational pension scheme records) is a better longevity predictor. Since the salary at retirement, or at earlier exit, and pension are reported at different dates for different members, we have adjusted these to a consistent monetary value basis by rolling-up (or back) to January 2008 and September 2007 respectively.
3.1.12 Whilst occupation is available as a binary variable of manual or non-manual, we have not included it in the paper, so as to provide as succinct an exposition of the techniques employed as possible. Our analysis, however, indicates that, where the covariates described above are available, the occupation provides relatively less additional information than each of the covariates considered (around ![]() year extra life expectancy from age 65 for a non-manual versus a manual employee with otherwise similar characteristics).
year extra life expectancy from age 65 for a non-manual versus a manual employee with otherwise similar characteristics).
3.2. Data Preparation
3.2.1 It is crucial to ensure the quality of the data. Accordingly, before analysis, we screen the data against a range of quality criteria, to ensure that any obvious errors, inconsistencies, or artificial biases, which arise as a facet of administrative practices, do not distort our analysis.
3.2.2 It is critical that we have no systematic inconsistencies between the in-force (alive) and the deaths datasets. For example, during the early years of the computerisation of pensions administration, it was common practice periodically to ‘purge’ (i.e. delete) the records of deceased members in order to save on (expensive) disk space. If we were to include these years in our analysis, we would not be observing all the deaths. We check the frequency of deaths over time to detect when such events may have occurred, for example by step discontinuities in mortality rates. This enables us to determine an ‘earliest usable date’ (EUD) for each of the schemes, which is used to truncate exposures (i.e., only those members exposed to risk after the EUD are considered). Similarly, to avoid any bias for late notified deaths, we also exclude the last month of data supplied to allow for incurred, but not reported, deaths, leading to a ‘latest usable date’ (LUD).
3.2.3 It is also necessary to ensure reliable data for each of the covariates which we analyse. The nature of pension administration records is such that this data may be missing in some cases. However, simply ignoring these records may distort analyses, particularly if records with unusable covariates display a systematic bias and are not missing at random. For example, if postcode data are missing for records for deceased members but not for live pensioners, then the missing postcode data will be an indicator of old age survival, rather than being of a random group. Using an ‘average’ value for missing numerical covariates, such as the pension or the salary amount, may similarly introduce distortions.
3.2.4 This issue of missing or erroneous covariates has been addressed. Individual records were flagged as potentially erroneous, given a set of carefully chosen criteria. These criteria included, for example, when an individual is recorded to have had a low salary at retirement, but a relatively large pension, or when an individual has a very low or high salary or pension compared to other scheme members and the range of salaries reasonably expected, given the nature of the scheme's industry. If, under these particular criteria, the proportion of records flagged within a scheme exceeded a reasonable threshold level, then these records were excluded. For each scheme where the overall level of missing or erroneous records was excessively high for a specific covariate, or when these records showed an important imbalance among dead and alive members, we would have reason to be suspicious about the recording of that covariate. In this circumstance, the records for the entire scheme would be excluded from analyses involving that covariate, to avoid the scheme introducing a bias. These scheme level exclusions have been set separately for males and females, and for pensioners and dependants, reflecting differences in some of the administrative practices which result in variations in quality of covariate coverage between these groups. For instance, some schemes may show a marked difference in the availability of full-time equivalent salaries for women, as the salaries are more likely to be part-time than those for men.
3.2.5 In some cases we are able to impute the missing data before applying the above process. For example, we are reliant upon having postcodes to link members to socio-economic and health indicators which relate to each one of the U.K.'s 1.7 million postcodes (typically, groups of ten to 15 individual households). However, postcodes are not always held on the records, particularly for people who died some years ago, and the Post Office changes postcodes from time to time, for example as new housing developments take place. By using commercial software specifically designed for the purpose of cleaning addresses, we can use the person's name, and any partial address supplied, to impute missing postcodes and correct wrong ones. For a typical scheme, 10% of records are corrected by this process.
3.3. Duplicate Records
Since our dataset relates to member records, there will be an element of duplication, as certain individuals may have multiple records, both within and between schemes. Consequently, our observations of survival and death are not entirely independent observations. The data allowed the presence of duplicates to be checked for 89% of records. Overall, under 4% of pensioners and dependants were found to have more than one record. This level of duplication is believed to be low in comparison with, for example, typical life insurance policy datasets. It is not known how this level of duplication compares to that in other sets of occupational pension scheme data (for example the CMI's SAPS study) as, traditionally, levels of duplication have not been measured in other studies. Empirical tests undertaken have identified no bias to the crude rates of mortality as a result of this low level of duplication.
4. Statistical Methods Used
4.1. Overview
4.1.1 Mortality rates can be defined in a number of different ways. A typical mortality table provides one-year probabilities of death qx, according to age x, of individuals. Crude mortality rates can be derived directly from death and exposure data at each age. However, mortality rates are often averaged over time (to smooth the year-to-year variation in crude mortality rates) and/or smoothed across ages. It is generally accepted that immediate post-natal mortality and the ‘accident hump’ aside, mortality rates increase with age. Since crude mortality rates are affected by random variation, they can suggest that a younger age has a higher mortality rate than an older age. Better estimates of the ‘true’ mortality rate at age x can be obtained by taking crude rates at adjacent ages into account. This is, effectively, a smoothing process known as a graduation.
4.1.2 Numerous different graduation techniques have been devised over the years, for example using weighted averages across ages and fitting cubic splines or other functional forms. These techniques traditionally relate to the problem of graduating across age. In our investigations, we explore and produce graduations that consider, simultaneously, the effects of multiple variables alongside age.
4.1.3 Publicly available population-based data are usually available in the form of summary statistics, which present counts of deaths and lives for different sub-populations, genders and age-groups. Life office data have, at least historically, been graduated, by bodies such as the CMI, in grouped form. This traditional approach of segmenting data into groups, which are assumed to be homogeneous, and then modelling mortality within those groups, has some drawbacks. For example, when there is a large number of potential risk factors, this can create more categories than the data can cope with, for example categories with no observations or with very low expected deaths. It is often the case that different sub-groups are then amalgamated in order to achieve a number of groups compatible with the volume of data available. A classical example of this is to group ages so that there is a minimum of five deaths incurred in each age-group (see, for example, Benjamin & Pollard, Reference Benjamin and Pollard1989).
4.1.4 We can describe individuals in terms of their covariate profile, i.e. the combination of covariate values considered in the model. Even in a large dataset such as ours, the possible combinations of age, gender, affluence, geo-demographics and retirement health may result in as many different covariate profiles as there are records. This is itself not a problem, provided that we model mortality at the individual rather than at the grouped level. This involves either:
– modelling individual deaths via a Bernoulli model to estimate qx conditional on the characteristics of an individual, which would usually be done using a generalised linear model (GLM); or
– estimating μx by using a survival model.
4.1.5 In this paper we focus our attention on using GLMs. However, we readily acknowledge the current debate as to the relative merits of using survival models rather than GLMs, and the reader is referred to Richards (Reference Richards2008) for an exposition of survival techniques. Our survival modelling work supports the conclusions in Section 5 of the relative importance of different covariates in predicting longevity, and our work with the Cox proportional hazards model (Cox & Oakes, Reference Cox and Oakes1984) has also reaffirmed the findings of Richards (Reference Richards2008), that it is preferable to ensure that any survival models are fully parametric survival models, with a suitable distribution to allow for the non-proportionality of covariate effects, i.e. that the covariate impacts attenuate with age.
4.1.6 In the rest of this section we describe the methods used to fit our GLM. The fitting consists of four key steps, namely:
(1) preparing the data for the GLM, including identifying the ages over which the data are sufficiently credible to fit the model;
(2) the actual fitting;
(3) verifying the fit of the model; and
(4) deciding how to extend the fitted GLM to ages outside of the range to which it is fitted.
Firstly, however, we provide a recap on GLMs.
4.2. A Brief Introduction to GLMs
4.2.1 GLMs are a class of statistical models that generalise classical linear models to include other outcome types, and are detailed in, for example, McCullagh & Nelder (Reference McCullagh and Nelder1989). In particular, GLMs relate the random distribution of the measured response variable (the distribution function) to the systematic (non-random) portion of the experiment (the linear predictor or the covariates), through a function g (the link function).
4.2.2 Specifically, suppose that the vector of n observations y is assumed to be the realisation of a random variable Y with mean μ. The systematic part of the GLM is a specification for the vector μ, in terms of a small number of parameters β 1, …, βp. This specification takes the form:
where the xij are the jth covariate for observation i, and the βs are parameters whose values are usually estimated from the data, using iterative procedures to maximise the likelihood of the observations.
4.2.3 In a life table context, the parameter of interest is the probability that a person aged x will die within one year, denoted by qx, for each age x. Equivalently we can write the random variable Y as the event that an individual aged x dies within a certain period. When an individual either died (Y = 1) in a certain period or survived to the end of the period (Y = 0), we can write Pr(Yi = 1)=qx. The principal objective of our statistical analysis is to investigate the relationship between the response probability qx and possible explanatory variables x = (x 1, … , xp).
4.2.4 GLMs for individual mortality are typically based around the Bernoulli model, using qx and the logistic (or logit) transformation, which has been widely used in actuarial practice. The logistic mortality law, namely that:
is a simplified version of the mortality law proposed by Perks (Reference Perks1932), which can be equivalently written as:
which is an expression of a simple GLM, where age is the only covariate, and the linear predictor is a linear combination of age and a constant. We introduced a number of different risk factors in ¶2.8, which univariate studies have shown to be predictive of mortality. Crucially, the linear predictor structure in the GLM makes it easy for us simultaneously to model these different risk factors. We can extend the expression on the right of the above formula to include covariates other than age. Further, although the linear predictor is a linear combination of predictors and parameters, the predictors can include functions of covariates, for example, age squared. The functional form of the linear predictor is discussed in Section 4.4.
4.2.5 One of the benefits of using a logistic link in the model relates to the ease of parameter interpretation. The transformation ![]() turns a probability into the equivalent odds in favour of the event (in this case, death). Thus, the odds that an older individual dies within one year increase over that of a younger individual with each year of age by exp(β).
turns a probability into the equivalent odds in favour of the event (in this case, death). Thus, the odds that an older individual dies within one year increase over that of a younger individual with each year of age by exp(β).
4.2.6 GLMs are structured to estimate differences relative to the baseline profile. For example, if the baseline consisted of manual pensioners, then the fitted model parameters estimate non-manual mortality as a departure from the manual component of the baseline. In addition, as the fitted model is calibrated to individual-level data, it can be used to make predictions both at the individual and at the group level, given a specific covariate profile.
4.2.7 Although the most widely used parametric forms for the GLM are the Binomial and Poisson distributions, we acknowledge that there are a wide range of possible parametric forms for mortality (“mortality laws”) discussed in actuarial literature such as Haberman and Renshaw (Reference Haberman and Renshaw1996), Cairns et al. (Reference Cairns, Blake, Dowd, Coughlan, Epstein, Ong and Balevich2007), Macdonald (Reference MacDonald1996a, Reference MacDonald1996b and Reference MacDonald1996c) and Richards (Reference Richards2008). Richards (2007) describes a number of mortality laws which can be expressed in GLM terms, and Richards & Jones (Reference Richards and Jones2004) present the results of a GLM for pensioner mortality in a large portfolio of life office annuitants, and they show that the logistic regression was the best of a variety of choices of GLM. In Club Vita, the performance of different forms and models is part of our ongoing research.
4.3. GLM Specific Data Preparation
4.3.1 To create the Bernoulli outcome for a given calendar year, we create a response variable ‘Dead in year t’, which has a value of one if the member died in that calendar year and zero if not. Exposure to risk is derived from the date of birth, the date retired, the date of death, the date of exit for other reasons, plus the EUD and the LUD dates. The pensioner population is subject to migration, and left truncation and right censoring are part of the nature of the data, so that not all members contribute a full calendar year to the exposure. Dropping all partial exposure cases would be an unnecessary reduction of information. However, including those records with partial exposure in the binomial GLM, without adjusting for the part year nature, could lead to a systematic under-estimation of the qx. We therefore weight the contribution of each of the membership records according to its exposure to risk in a year, counting as a full observation when the exposed risk is equal to one.
4.3.2 When carrying out statistical modelling to graduate baseline mortality rates, we need to strike a balance between the resultant rates being as up to date, and hence, relevant to current mortality as possible, and the need to smooth out fluctuations in mortality pertaining to a specific calendar year. Therefore, we have modelled mortality based on three whole calendar years for the period 2005 to 2007. This period is consistent with the length of time used in a typical inter-valuation experience of a pension scheme, and by the ONS in creating interim life tables.
4.3.3 When looking at a period of time, a common estimate for ![]() , which smoothes the year-to-year variation, is given by taking the aggregate data over the period, i.e. for the period 2005 to 2007:
, which smoothes the year-to-year variation, is given by taking the aggregate data over the period, i.e. for the period 2005 to 2007:
![\[--><$$>{{\hat{q}}_x} = \dfrac{{\mathop{\sum}\limits_{t = 2005}^{2007} {{{D}_{x,t}}} }}{{\mathop{\sum}\limits_{t = 2005}^{2007} {{{E}_{x,t}}} }}\eqno<$$><!--\]](https://static.cambridge.org/binary/version/id/urn:cambridge.org:id:binary:20160331040803723-0276:S1357321711000018_eqnU7.gif?pub-status=live)
where Dx,t is the number of deaths at age x in calendar year t and Ex,t is the initial exposed to risk at age x in calendar year t.
4.3.4 An underlying assumption of GLM modelling is that the observations are independent. In our approach, the same individual can provide exposure for up to three years. The impact of this lack of independence is reduced, since our models always adjust for age, and an individual never provides information for the same age in more than one year. We tested the impact of the extra source of variation introduced by this with a generalised linear mixed model (Gelman & Hill, Reference Gelman and Hill2007), and it was not significant, so this was not considered further.
4.3.5 Before modelling, it is necessary to consider the age-ranges which will be included in the model for each of the different strata, such as the male non ill-health pensioners. As an example, Figure 4 shows the logit of crude mortality rates with their corresponding 95% confidence intervals for non ill-health pensioners. We can see, for women (Figure 4(a)), how the intervals widen steeply for ages less than 60, and gently for older ages between the early 90s and 101, where it jumps. For males (Figure 4(b)), it can be seen how the intervals increase for ages less than 60, and for ages higher than 95. For aggregated models (i.e. if age only was to be considered as a covariate), we may consider including ages below 60 and above 95. However, we have sought to have a good coverage and a good fit when different covariate profiles (high salary, low lifestyle, etc.) are taken into account, so we have fitted models over only those ages with particularly good data coverage. Consequently, the adopted range for pensioners retiring on non ill-health grounds was from ages 60 to 95. Table 4 shows the age ranges adopted for different strata following similar reasoning.

Figure 4 Logit of crude mortality rates with 95% confidence intervals for pensioner non ill-health population.
Table 4 Age ranges over which GLM fitted for different strata.

4.4. Fitting the Model
4.4.1 The formulation of any statistical model is a lengthy process, requiring judgement, experience and a range of statistical tools/checks. The resulting model should have reasonable statistical and mathematical properties (accepting that no statistical model is perfect), be consistent with the knowledge of the process under study, and be able to extrapolate to related datasets (for example, the pensioners in a particular pension scheme). Even after applying these criteria, however, there are often several competing models, and a standard statistic is needed for comparing them. A simpler model with few rather than many parameters is favoured over comparatively complex ones, provided that they fit the data, broadly speaking, equally well.
4.4.2 Akaike's Information Criterion (AIC) is a goodness-of-fit statistic, which can be used to assess alternative models fitted to the same dataset (Akaike, Reference Akaike1974). The AIC for a given model is defined as:
where l is the log-likelihood of the fitted model, p is the number of parameters in the model, and r is a penalty term, equal to two. The AIC statistic is therefore a combination of a general measure of model fit (−2l) and the complexity of the model (rp), and its use ensures that over-parameterised models are penalised.
4.4.3 We also use the Bayesian or Schwarz Information Criterion (BIC) to guide our model selection. This uses an alternative penalty of r=log(n), where n is the number of observations, so that the BIC penalises additional parameters more strongly than the AIC does. A lower value of the AIC (or the BIC) is an indication of a better-fitting model than one whose AIC (or BIC) is higher.
4.4.4 Model choice is usually a compromise between goodness-of-fit and simplicity, and the use of the AIC and the BIC statistics helps to ensure that a parsimonious model is selected. We wish to avoid over-fitting to the data, as this will have a detrimental effect on the robustness of the model and, more crucially, on its ability to predict outside the dataset used. In practice, we use both the AIC and the BIC to define a set of possible models. Since the AIC penalises complexity less, it will generally select more complex models. A battery of goodness-of-fit tests commonly used in the actuarial and the statistical fields (as described in Section 4.5) are then carried out on these models, and the most suitable model within this set is selected.
4.4.5 Identifying candidate models requires us to consider the functional form and the possible transformation of variables (e.g., age). This is necessarily a combination of a visual assessment to understand the features of the mortality rates and goodness-of-fit statistics. The plot of the crude mortality rates, supplemented with some type of spline or non-parametric smoother, is usually a very powerful aid to identify candidate functions. Fitting models with different parametric forms, and comparing AICs and BICs, will complement the evidence of visual assessment.
4.4.6 In order to construct candidate models we also need to identify which covariates are predictive of mortality. Before doing this, however, we accept that the inclusion of a continuous covariate, or a discrete covariate made up of many groups, in a regression model can result in an unwieldy number of fitted curves. To avoid this, we cluster or partition these predictors into discrete covariates formed of smaller groups, broadly homogeneous in their mortality experience. To remove any subjectivity in the choice of how to group the data, and the number of groups needed to ensure optimal prediction, we use statistical criteria to guide the grouping of the data. We use Ward's method (Ward, Reference Ward1963) and the recursive partitioning and regression tree (rpart) method (Therneau & Atkinson, Reference Therneau and Atkinson1997), in order to simplify a complex discrete covariate, such as the 57-group ACORN lifestyle covariate, and to determine the optimal cut points with which to make continuous covariates, such as revalued salary at exit/retirement and pension amount, discrete. When either method results in more than one simplified discrete covariate of comparable prediction error (consisting of a different number of groups), the set of covariates was examined in a GLM, and the covariate grouping which resulted in the lowest AIC/BIC was selected to be used for the predictive models. Specifically, for the data analysed in this paper, the process led to five geo-demographic groups, and the affluence groups are described in Table 5.
Table 5 Results of discretising affluence measures.

4.4.7 It is interesting to note that greater granularity is suggested for affluence amongst men than amongst women. A possible reason for this is that the longevity prospects of those women who are currently in receipt of pensions may be more strongly determined by the total household income than by their personal income. The greater emancipation in the workplace of successive generations of women means that we might reasonably expect greater granularity to emerge over time.
4.4.8 Different explorations and analyses were undertaken to identify covariates that had an impact on mortality. We begin the selection process with a univariable analysis of each factor, including correlation/association summaries (Cramer's V for categorical data), chi-square tests and individual odds ratios with 95% confidence intervals (Agresti, Reference Agresti2002). A univariable logistic regression is supplemented with a plot of the smoothed mortality rates by the covariates. Cleveland's loess smoother (a locally weighted polynomial regression smoother) is used to smooth the mortality rates, as it has been shown to perform excellently when the response is binary (Harrell, Reference Harrell2001). A loess smoother plot is helpful in ascertaining the potential importance of the variable, and the possible presence and effect of extreme observations, but also the appropriate parametric relationship and/or scale. An example of such a plot is shown later (Section 5, Figure 7). On top of assessing the relevance of a covariate based on the reduction in AIC and BIC, the coefficients (size and direction of effects) are also assessed.
4.4.9 Figure 5 shows crude mortality rates for covariates considered one at a time. In general, the effects observed are consistent with what one would expect intuitively. For instance, younger people presenting lower mortality rates than older people, former manual workers presenting higher mortality rates than former non-manuals, higher affluence (=5) presenting lower mortality rates than lower affluence (=1), and upper lifestyle (E) presenting lower mortality rates than lower lifestyle group (A). Health status at retirement does not seem to have a large overall effect, however its effect is greatly dependent on age, as ill-health pensioners by definition will retire relatively young.

Figure 5 Crude mortality rates (proportion of deaths) by different covariates for the male pensioners population.
4.4.10 Upon completion of the univariate analyses, we select variables for the multivariable analysis, and check for interactions among the variables in the model. The approach which we have chosen is a stepwise method, in which variables are selected either for inclusion or exclusion from the model, in a sequential fashion, based solely on the statistical criteria of the AIC and the BIC. The stepwise approach is useful and intuitively appealing, as it both builds sequentially and readily considers models which otherwise might not have been examined. The stepwise procedures are used as a guide, however, as we also believe that the meaningfulness of covariates in the context of the model application should always be considered. For example, it is possible to reject longevity predictors based on the AIC alone, if the covariate is relatively sparse in the overall dataset, and so the small amount of extra precision in the likelihood is offset by the introduction of extra parameters. However, if that particular predictor results in a meaningful and financially material difference in life expectancy, and was particularly prevalent in certain pension schemes, then it could be important to allow for it in valuing pension scheme liabilities.
4.4.11 The importance of each variable included in the fitted model is verified by examining the statistical significance of each estimated coefficient. Where variables fail to discriminate meaningfully between individuals, they are taken out and the model is refitted. This process of deleting, refitting and verifying continues until it appears that all the important variables are included in the model and those excluded are actuarially and/or statistically unimportant.
4.5. Verifying the Fit of the Model
4.5.1 There are a variety of summary test statistics and measures which are useful to assess the goodness-of-fit of the models and a full assessment relies in the exploration of different measures and plots. Examining a model's goodness of fit involves determining whether the fitted model's residual variation is small, displays no systematic tendency, and follows the variability postulated by the model. Evidence of lack-of-fit may come from a violation of one or more of these three characteristics.
4.5.2 The chi-squared test is an often used goodness-of-fit statistic. However, as noted by Hosmer (Reference Hosmer1991), this test statistic does not follow a chi-square for logistic regression. The limitation of using the chi-square test with binary data has generated work on alternative goodness-of-fit tests in recent years. This work has not identified a ‘unique test’ which should be trusted completely as a sole indicator of goodness of fit for logistic GLMs.
4.5.3 As well as using the AIC and the BIC, we also verify fit by looking at the modified chi-square statistic, based on deciles of risk proposed by Hosmer & Lemeshow (Reference Hosmer and Lemeshow1980), and the tests familiar from actuarial literature, including the Kolmogorov-Smirnov test, the signs test, the runs test, cumulative deviations, serial correlations tests, etc (see Forfar et al. (Reference Forfar, McCutcheon and Wilkie1988) for details of these tests). In all cases we perform the test at the 5% level. The large number of covariate profiles means that we would reasonably expect some profiles to fail some tests. As certain combinations of covariates will be less populous than others, and as the method is designed to include inferences across covariate profiles, rather than graduating to specific data segmentation, a pragmatic view needs to be taken on the results of this battery of tests, i.e. accepting a moderate level of failures which do not display any systematic tendencies, such as always failing for certain lifestyle groups.
4.5.4 The R-squared (R2) statistic is often used as a goodness-of-fit measure in ordinary linear regression. No equivalent statistic to R2 exists for logistic regression. However, several pseudo values,such as Efron's or McKelvey and Zavoina's R2 have been developed, reflecting different interpretations of the aim of the model (see Veall & Zimmermann, Reference Veall and Zimmermann1996), and we include a number of these in our battery of tests.
4.5.5 In any individual analysis it is also important to assess whether there are any observations exerting undue influence. We do this by using residual plots in accordance with Hosmer & Lemeshow (Reference Hosmer and Lemeshow2000). We also assess the performance of the models by comparing crude and fitted life expectancies, and by verifying the internal consistency of the different mortality curves calibrated – for example whether, for like covariate profiles, male mortality exceeds female mortality at all ages.
4.6. Extending the Model to Other Ages
4.6.1 The fitted curves produced by the GLMs span the age range of the data to which the curves were fitted. However mortality probabilities, which cover a wider age range, are needed, leading to the issue of how best to extend the curves to older and younger ages.
4.6.2 Since we are modelling logit(qx) it is natural to focus on logit(qx) when extending these curves. There are a number of features which we consider it is desirable for our extensions to have:
(1) Extensions should have the same value as the fitted curve at the ages where they join.
(2) Extensions should be monotonic increasing with age.
(3) Extensions should not introduce inconsistencies, i.e. crossings between different strata/covariate profiles.
(4) Extensions should approach a justifiable value at the oldest and youngest ages.
To this list, some readers might add smoothness at the point of extension. However, there is little statistical justification for this, as the fitting techniques do not focus on the derivatives at the extremes of the extensions.
4.6.3 In order to achieve our desired features, we have used linear extensions, which is a deliberately simplistic and pragmatic approach. Further, at advanced ages the linear logistic model seems to hold reasonably well at overall dataset levels (see, for example, Thatcher et al., Reference Thatcher, Kannisto and Vaupel1998).
4.6.4 Logit curves have been linearly extended up to age 125, and the ‘oldest old’ parameter has been chosen so that the force of mortality at age 125.5 equals one (i.e. μ 125.5 = 1 and so, logot(q 125) = 0.54). We have used age 125, as survival beyond age 120 has been verified in the case of Jeanne Calment (Jenne & Vaupel, Reference Jenne and Vaupel1999). A force of mortality equal to one has been chosen in light of work by the CMI (2009a) and Thatcher et al. (Reference Thatcher, Kannisto and Vaupel1998), which suggests that this is an appropriate order of magnitude for men and women.
4.6.5 For younger ages, curves were extended downwards to age 16. However, extensions take reference to mortality at age ten to avoid any distortions at age 16 owing to the ‘accident hump’. The limiting values at age ten are the U.K. population values for the same period as that to which we are calibrating the curves, as determined by interim English Life Tables. In essence, these are the crude population rates for the U.K. at age ten, which, currently, are 0.000104 for boys and 0.000095 for girls.
4.6.6 For ill-health graduations, the curves have been extended in a slightly different manner. We extend to lower ages by keeping logit(qx) constant at all ages x ≤ 50 which reflects the flattening of mortality observed in the data. For older ages, we are conscious that the age range we have fitted to stops sooner for ill-health than for non ill-health. To avoid inadvertent crossing of the non ill-health and ill-health curves at older ages, we extend the ill-health curve by linearly reducing the gap between it and the non ill-health curves.
5. Results of Modelling Pensioner Longevity
5.1. Key Results
5.1.1 We showed in ¶3.1.10, how retirement health is an important differentiator of mortality, especially at younger ages, and we explained that, due to fundamental differences in the underlying pattern of mortality, we have modelled the ill-health and non ill-health subsets of the data separately. In this section, we focus on the subset of male pensioners not retiring on grounds of ill-health as a means of illustrating the methods used. The approaches taken are, however, equally applicable, and have been applied similarly to other sub-groups, the high level results of which we summarise at the end of this section.
5.1.2 We begin the modelling process by considering models with intercept and age terms, i.e. models of the form logit(qx) = a + f(x), where f(x) is a function of age. After exploring different polynomial forms (linear, quadratic, cubic, quartic, etc.), a model based on a cubic polynomial in age, i.e. of the form logit(qx) = a + bx + cx 2 + dx 3), was found to result in the lowest AIC (Table 6)
Table 6 Goodness-of-fit values from model with age (x) only.

5.1.3 The AIC and the BIC statistics both examine the goodness-of-fit of a model, but with a different emphasis on model complexity. Their joint use, therefore, allows a range of suitable candidate models to be considered further, through additional goodness-of-fit tests and visual assessment of the fitted curves. Based on the models in Table 6, these candidate models would include the linear, quadratic and cubic models. The mean-fitted mortality estimates from these models, together with the crude rates from the data to which the models were fitted, are shown in Figure 6. Although the BIC was lower when only a linear or quadratic term in age was chosen, visual examination of these fitted model curves against the shape of the crude mortality rates revealed a relatively poor fit at the oldest ages, compared to that of the cubic model (Figure 6). Further examination revealed that these two forms also performed poorly in some of the goodness-of-fit tests mentioned in Section 4.5 (namely in the runs, sign and χ2 tests), whereas the cubic form did not and this model was therefore preferred. Overall, the cubic model fits the mean crude rates well, with the fitted mean lying well within the confidence intervals at all ages.

Figure 6 Fitted crude rates from a GLM with age and intercept terms only, with points showing mean crude rates, together with 95% beta-binomial probability intervals.
5.1.4 The aim of a GLM, in the context of this paper, is to predict the current baseline mortality for pensioners accurately (i.e. to minimise the systematic error between a GLM-based prediction of mortality and that observed from the data) through the use of explanatory variables, such as revalued salary at retirement or earlier exit. We use plots of the smoothed logit-transformed mortality rates to examine both how well a variable explains differences in mortality, and the shape of these differences over age. Each of the salary, pension and geo-demographic covariates was examined using loess plots, before being considered for inclusion in the model. In each case the covariates were grouped according to the methods described in ¶4.4.6.
5.1.5 Figure 7 shows a plot of the logit-transformed mortality rates by each of these covariates, smoothed over age using a loess smoother. The crude rates by each of the five geo-demographic profile groups (as described in ¶4.4.6) are shown in Figure 7(a). The figure reveals the relatively large separation in mortality rates for pensioners in different profiles and, therefore, the predictive value of including this variable in a mortality model. The separation in rates seen in Figure 7(a) is more pronounced at younger ages, with the differences attenuating (declining) with age for most profile groups. This ‘funnelling’ highlights a need for differences in the mortality rates between the groups to be modelled with an appropriate age-dependent form. Figure 7(b) (salary band) and Figure 7(c) (pension band) plot the smoothed logit of crude rates, and also show considerable separation of rates between different levels of the affluence covariates. A similar attenuation over age of the differences between rates for the different salary and pension groups can be seen, again suggesting the need to model changes in the effect on mortality rates over age appropriately. This attenuation is unsurprising, given that a constant difference in the logit of mortality (i.e. a model with no age interaction) broadly corresponds to a stable ratio of qx values and, as many authors have noted (for example Hoffman, Reference Hoffman2008), differences in mortality tend to decline in relative terms as age increases.

Figure 7 Plot of smoothed logit transformed mortality rates over age by each of: (a) geo-demographic profile groups (A-E, group A corresponds to shortest living pensioners and E the longest living); (b) salary groups (1: lowest salary band, 5:highest salary band; as per Table 5); and (c) pension groups (from 1: lowest pension band to 5: highest pension band; as per Table 5).
5.1.6 When looking at Figure 7, it is important to note here that large differences in the logit scale at younger ages translate to only small differences in the real scale, whereas small differences in logit qx translate to large differences in qx at older ages. It is therefore of great importance to ensure that the attenuation of differences of qx in the logit scale are captured appropriately.
5.1.7 The decision of the appropriate form of the interaction of a covariate with age (i.e. what order exponent of age) is important. We initially included the affluence and geo-demographic variables in the GLM as a function independent of age. This allows for the broad difference in mortality for each sub-group of the variable to be modelled, relative to a chosen baseline group for the variable. The inclusion of an additional interaction term with age allows the possibility of these differences varying (i.e. diminishing) with age. For all of the variables considered, when an interaction term between the variable and the age was included, the resultant fit was slightly better (marked by the lower AIC) than when the interaction term was excluded.
5.1.8 An example of the process described in ¶5.1.7, using the salary band variable, is shown in Table 7. We began by building a model using the functional form described in ¶5.1.3, and adding only the main (or age-independent) effect of a covariate, such as a model of the form logit(qx) = a + bx+cx 2 + dx 3 + ej salary j, where j = 1, …, 5 relates to the jth salary group (Table 7, row A). Thereafter, we tested for improvements in the fit of the model through adding the interactions between the covariate and either a linear, a quadratic, a cubic or a quartic term in age (Table 7, rows B-E). The salary and age-linear interaction gave the lowest AIC (row B), however, it was observed that this resulted in the crossing of curves at older ages. Crossing of this nature is not only counter-intuitive, but was also not supported by the data, therefore it is likely that this model was over-fitted. We considered alternative interactions between the covariate and the reciprocal of linear, quadratic, cubic and quartic terms in age (Table 7, rows F to I) to mirror more closely the funnel effect generally observed in the underlying data, i.e. the narrowing of differences in logit qx over the ages observed in Figure 7(b).
Table 7 Comparison of interaction terms between age and salary bandj (j = 1, … , 5).

† Highlighted terms in rows B to I correspond to additional terms added to the model given in row A.
5.1.9 The model that best fitted the data in terms of the AIC and maintained good properties, was one where a cubic reciprocal interaction was used to model the effect of variables as a function of age. Upon closer examination of the effects and coefficients of the model, it was noted that once the reciprocal cubic interaction with age was added, the quadratic age term and the age-independent salary effects were not significantly different from zero. As a simplification, these terms were removed from the model resulting in the form logit(qx) = a + bx + dx 3 + vjx −3*salaryj; for j = 1, …, 5 (Table 7, row J). This simpler model resulted in a modest increase in the AIC but a large improvement in terms of the BIC, reflecting the relatively parsimonious choice of model (Table 7, row J). A similar process was carried out for each covariate in turn and, in each case, the final model resulted in a similar form to that described in row J of Table 7.
5.1.10 Figure 8 shows the resulting AIC and BIC values for the individual covariate and age interaction models, based on the cubic reciprocal interaction forms described above. The addition of the salary band covariate to the model including only age resulted in the greatest AIC and BIC decrease. The addition of the geo-demographic group covariate instead of salary resulted in a similar reduction, suggesting that both the salary and the geo-demographics are strong predictors of mortality. Whilst the inclusion of the pension amount also resulted in a large decrease, its impact was smaller than that of either the salary or the geo-demographics. It is interesting to observe these differences, given that all three covariates can be considered as proxies for socio-economic status, with the geo-demographic profiles grouping individuals into postcode-based consumer-type groups, whilst the pension and the salary represent, more directly, the purchasing power of individuals. This could be interpreted as the geo-demographic group capturing a ‘lifestyle’ element of socio-economic status, and the salary and the pension as affluence measures. Given the relatively high correlation between salary and pension amounts (Cramer's V statistic = 0.63), and the fact that they are both regarded as direct measures of economic affluence, we only consider the inclusion of one or the other in the models at any given time.

Figure 8 Relative change in the AIC and the BIC from a model containing age terms only.
5.1.11 A crucial result is that the salary offers more predictive power for mortality for the male pensioner population than the pension amount does. This can be seen from Figure 8, in that the inclusion of the re-valued salary at retirement (or earlier exit) covariate resulted in a better model fit (lower AIC and BIC) than the inclusion of the pension amount, irrespective of whether the geo-demographic covariate was included. It suggests that the salary may be a more reliable indicator of an individual's relative income position. In many ways this is unsurprising. The pension amount, principally as a function of the salary and the length of service, is highly correlated with the salary, but will be a relatively ‘noisier’ covariate, as it is measured in terms of the pension income of an individual from a particular scheme. For individuals with modest pensions, this could, therefore, be their total pension income, or it could be one of many pensions which they receive and therefore suggest a misleadingly low level of affluence.
5.1.12 The lower predictivity of the pension, given a knowledge of lifestyle factors, is also highlighted by Richards & Jones (Reference Richards and Jones2004). Nonetheless, we find that pension amount adds predictive value in the absence of historic salary information and this reaffirms the findings of Richards that: “incorporating both geo-demographic type and pension size will usually be better than using either variable on its own” (Richards, Reference Richards2008).
5.2. An Example of the Application of these Results
5.2.1 Assuming that a pension scheme has information available on all three of the covariates considered above, we suggest that it would be best (for male pensioners) to use both the salary at retirement (or earlier exit) and the geo-demographic profile to predict mortality when valuing pension scheme liabilities. The resulting mortality model can be expressed as:
where:
– qx is the probability that a life (in the jth salary group and kth geo-demographic group) aged x exact will die before reaching age x + 1;
– a is the intercept or constant term of the model;
– b and c are the covariate-independent linear and the cubic terms in age x;
– dj is the covariate-dependent, cubic reciprocal term in age for the jth salary group (j = 1, 2, …, 5); and
– ek is the covariate-dependent, cubic reciprocal term in age for the kth geo-demographic group (k = 1, 2, …, 5).
Fitting this model to the dataset resulted in the parameter estimates given in Table 8. We also show their standard errors and associated test statistics and p-values. From the p-values we observe that all coefficients are significantly different from zero. Although parameter estimates for the interaction effects appear large in this form, it should be remembered that they are applied to numbers of the order of 65−3 to 95−3.
Table 8 Estimated parameters from a GLM, including age, salary and geo-demographic group, based on a subset of male pensioners retiring on non-ill health grounds.

† The changes in the logit-transformed probability of death are also presented here as it corresponds to the scale in which the outcome is modelled in the GLM.
‡ Relative to the estimated qx of 0.045 for an individual aged 75, in Lifestyle B and earning £15K to 22.5K.
5.2.2 For ease of interpretation, the right side of Table 8 shows the model-based covariate effects on qx in both the logit and untransformed scale and on the odds of dying for a pensioner aged 75 years, compared to the baseline group. The most populated group was chosen as the baseline, namely a salary of £15K to £22.5K and geo-demographic group B. So for example, a male pensioner aged 75, earning a salary of less than £15K p.a. at retirement or at exit, has 12% higher odds of dying (and an 11% higher probability of dying) before his next birthday than a male pensioner aged 75 earning between £15K and £22.5K p.a. (Table 8). Similarly, the odds of dying for male pensioners in geo-demographic group E are 26% lower than for those in geo-demographic group B (and the probability of dying is 25% lower).
5.2.3 We can use these coefficients to produce estimates of qx for each covariate profile. For example, based on the fitted model, a pensioner aged 75, earning <£15,000 p.a. (in current terms) at retirement or at exit and classified as being in geo-demographic group C would have an estimated logit(q 75) of:
This corresponds to ![]() . In contrast, the q 75 is 0.026 for someone who was earning, in current terms, in excess of £48,500 p.a. The corresponding q 95 values are estimated to be 0.13 and 0.09 respectively. The complete range of predicted qx values for ages 60 to 95 are shown in Figure 9, both on the logit transformed scale and on the original scale of qx for the top and bottom salary bands. There is a clear separation between the mean predictions and their associated 95% confidence intervals, highlighting the statistically significant differences between these two groups at all ages – we shall return to the confidence intervals in Section 5.3. The funnel shape of the crude rates observed in Figure 7, that is the narrowing of differences in logit qx over age, is modelled well by the chosen form.
. In contrast, the q 75 is 0.026 for someone who was earning, in current terms, in excess of £48,500 p.a. The corresponding q 95 values are estimated to be 0.13 and 0.09 respectively. The complete range of predicted qx values for ages 60 to 95 are shown in Figure 9, both on the logit transformed scale and on the original scale of qx for the top and bottom salary bands. There is a clear separation between the mean predictions and their associated 95% confidence intervals, highlighting the statistically significant differences between these two groups at all ages – we shall return to the confidence intervals in Section 5.3. The funnel shape of the crude rates observed in Figure 7, that is the narrowing of differences in logit qx over age, is modelled well by the chosen form.

Figure 9 Fitted mortality curves for pensioners earning a salary at retirement in the lowest and highest salary bands, given a geo-demographic profile of C based upon model parameters given in Table 8 (solid lines show mean estimates; dashed lines show prediction errors of the mean).
5.2.4 The significance of the salary and the geo-demographic groups on the pension liability can be best illustrated by examining their impact on the life expectancy and the annuity values. Table 9 shows curtailed life expectancies and annuity values (for interest rates of 2.5% and 5%) for a subset of covariate profiles estimated from the model. In each case, these are joint on a period of 31 years, i.e. they reflect the life expectancy and annuities over a potential period of payments of up to, and including, age 95. This reflects the period over which we have fitted the data. In practice, liabilities include benefits payable after age 95. The ‘uncurtailed’ values are shown in Section 5.4 as part of our discussion on extending the model to older ages. However, it is useful to first consider the curtailed values as these are prior to the subjectivity introduced by model extensions.
Table 9 Life expectancies and annuity (2.5% and 5%) values.

5.2.5 Table 9 shows that there is a spread of over six years in the mean life expectancy from the low salary/low lifestyle group to the high salary/upper lifestyle group.
5.3. Parameter Uncertainty
5.3.1 For any statistical modelling of real data, it is essential to understand the uncertainty around the estimates obtained and the variability of the phenomena of the study. In the situation considered in this paper, the uncertainty around the estimate of the underlying mortality rates for a given covariate profile and population is needed. The level of uncertainty comes from the parameters and the predictions related to the model. The 95% confidence intervals for the mean-fitted curves are presented in Figure 9 for each age. For the purposes of pension scheme valuations, a more meaningful summary is given in terms of life expectancies and annuity values (Table 10).
Table 10 Distributions of curtailed life expectancies from age 65 for given geo-demographic groups and salary amounts (male pensioners)Footnote †.

† Curtailed life expectancies based on the age range of 60 to 95 for which model was fitted.
5.3.2 We have simulated the fitted life expectancy distribution using a Monte Carlo procedure based on the model chosen and the data used. A full assessment would start with the simulation of the predictive distribution for the number of deaths ![]() in each covariate profile based on the binomial distribution as:
in each covariate profile based on the binomial distribution as:
However, this depends on the exposure profile used and includes both the binomial variation (i.e. idiosyncratic risk) as well as the parameter uncertainty. In order to isolate the parameter uncertainty, we take into account just the uncertainty estimated by the statistical model and ignore the extra binomial variability which comes from the predictions for the number of deaths within each of the covariate profiles. In practice, overall uncertainty within a particular portfolio includes the idiosyncratic risk derived from the binomial variability, the extent of which will vary from portfolio to portfolio.
5.3.3 Confidence intervals for the mean life expectancy were generated for each covariate profile, to represent a range of life expectancy scenarios. The Monte Carlo process starts by obtaining a sample of the predicted mortality rates (qx) using the mean and variance estimated from the model. The simulated qx are then used to calculate a sample of the curtailed life expectancies and annuities at different ages. A selection of summary statistics from this process are presented in Table 10.
5.3.4 Figure 10 gives a graphical representation by showing the 95% confidence intervals for the different geo-demographic and salary groups. The pattern of increasing mean life expectancy values, as the salary and the socio-economic status increase, is apparent. We can also appreciate the uncertainty around these quantities. The less populated covariate profiles have more uncertainty around the true underlying mortality rate, and therefore around their life expectancy prediction. Unsurprisingly, the uncertainty is therefore largest for the lowest lifestyle group combined with high salaries, and vice versa. However, we can see that changing an individual covariate leads to differences in mean life expectancy, which are much larger than the uncertainty around that mean life expectancy, i.e. the differences in life expectancies are real and material, and so warrant allowance for in valuing pension scheme liabilities.

Figure 10 Life expectancy 95% intervals for male pensioners non ill-health for different geo-demographic and salary groups.
5.4. Extension of the Model to Older Ages
5.4.1 In practice, the application of the fitted mortality rates needs to cover a wider range of ages (especially older ages) than we are able to use directly in the fitting process. We have extended the fitted curves in line with the process described in Section 4.6. The extensions are illustrated in Figure 11, as applied to the fitted curves shown earlier in Figure 9.

Figure 11 Fitted mortality curves post-extension for pensioners given a geo-demographic profile of C, based upon model parameters given in Table 8.
5.4.2 Table 11 shows life expectancies from age 65 for different geo-demographic and salary combinations based on the extended mortality curves. We can see how, compared to Table 9, the life expectancies increase slightly (up to 0.4 years), reflecting the fact that the life expectancy is no longer curtailed after age 95. The modest increases highlight how the choice of extension to older ages is unlikely to be a material concern, justifying the adoption of a pragmatic approach. We note, however, that some care is required when combining baseline curves with projections of future changes in mortality, especially where these result in material proportions of pensioners reaching age 95. (The reader is directed to CMI (2009c) for an analysis of the sensitivity of annuities and life expectancies to the assumptions regarding older ages.)
Table 11 Fitted life expectancies (![]() ) under extended model.
) under extended model.

5.4.3 As would be expected, the range of life expectancies shown in Table 11 has also very slightly increased compared to Table 9, since those with the greatest chance of surviving to age 95 see the biggest increases in their life expectancies.
5.5. Summary of Results from Other Strata
5.5.1 So far we have focussed on the results of modelling male pensioners. However, we have applied the same techniques to the other strata. Table 12 summarises the key results of fitting to these different strata.
Table 12 Range of life expectancies from age 65 for other strata.

5.5.2 The wide variety of life expectancies within and between strata is evident from Table 12. We note that:
– the range of life expectancies over all covariates/strata is in excess of ten years;
– this range corresponds to a range of the order of 60% in the single life annuity values; and
– there is a similar level of difference (two to three years) seen between ill-health and non ill-health retirees, compared to the ranges of life-expectancies seen owing to other covariates.
5.6. Missing Covariate Information
5.6.1 When all information is available, it is simple to model all of the effects together. In practice, the characteristics used above to predict longevity for male non ill-health pensioners will not all be stored on the membership records of all members of all schemes. When information is unavailable, the same approach can be followed for a reduced set of covariates. So if, for example, a pension scheme does not store the addresses of scheme members, a model would be calibrated to age and salary or age and pension instead. The idea is to make the most of the relevant information available to strengthen prediction, but to have the flexibility to adjust when some information is not available.
5.6.2 We have stratified by retirement health. In practice, this is a predictor, which is not always available when valuing pension scheme liabilities. In these cases a method is needed to model post-retirement mortality, which is not differentiated by retirement health. One approach is to model the mortality of all pensioners directly, using the techniques explored in this paper. However, as noted in ¶3.1.10, the very different patterns of mortality with age between non ill-health and ill-health retirees make direct modelling of the aggregate rates as a functional form of age challenging. Below age 50, we know that post-retirement mortality must relate to ill-health retirees, whilst as the age of the population increases, the rates applied will be dominated by non ill-health retirees. In light of this, when the retirement health is not known, we prefer a pragmatic approach of blending the curves fitted to each of the non ill-health and the ill-health populations, allowing for the propensity of each retirement type at each age.
6. Allowing for Individual Longevity Predictors when Valuing Pension Scheme Liabilities
6.1 We saw, in Section 5, how, by analysing the data held within occupational pension scheme records, we can identify powerful predictors of longevity. In aggregate, these predictors identify over ten years’ difference in life expectancy between two individuals. These differences are financially material – some 60% in the value of single life annuities from age 65. Therefore, it seems expedient that we should allow for these differences when valuing pension scheme liabilities.
6.2 The modelling techniques described in this paper require a large dataset, rich in member information. Few, if any, individual occupational pension schemes would have the data required to calibrate these models in isolation. However, by pooling data, sufficient volumes have been reached within the dataset analysed here. Once calibrated to a dataset, however, the results of the models (i.e. graduated qx values) can readily and easily be applied to the membership of any occupational pension scheme.
6.3 The most direct way to use the results of this modelling would be to identify the characteristics of each individual in a portfolio. Each individual can then be valued on the mortality curve corresponding to his or her covariate profile.
6.4 For pension scheme valuations, this often leads to a larger number of mortality tables being used in actuarial valuations than has been the case traditionally. In our experience, well-built valuation systems can, given modern computing power, readily accommodate this approach. Indeed, this is an approach currently used by a number of occupational pension schemes.
6.5 In practice, some valuation systems may have constraints which prevent the cost-efficient use of large numbers of mortality tables as part of valuing a portfolio. In addition, for some applications of mortality tables, such as determining the terms on which members can exercise transfer values, early retirement options and commutation rights, a balance will need to be struck between precision and the potential additional administrative costs of member-specific terms.
6.6 In situations where directly using individually-based mortality tables is considered inappropriate, we would suggest first understanding the membership profile in terms of the key longevity characteristics identified here. This enables a suitable composite assumption to be constructed by appropriately weighting the individual tables.
6.7 When constructing the composite assumption, there are a number of important considerations including, but not limited to: deciding how granular the composite should remain; the desirable properties of any aggregated curve, given how it will be used; and the method of aggregation. A full exposition and analysis of the possible options of constructing a composite assumption is beyond the scope of this paper. However, the reader is referred to a forthcoming paper on this matter which will be available from Club Vita.
7. Conclusions
7.1 The observed period life expectancy in occupational pension schemes exhibits a wide range. For the 91 schemes considered in this paper, the observed period (post-retirement) life expectancy from age 65 ranged, in 2005 to 2007, from under 15 years to over 20 years for men, and from 18 years to almost 25 years for women.
7.2 The range of life expectancies comes as little surprise. Individuals are heterogeneous in terms of longevity characteristics, and schemes are, in turn, a heterogeneous mix of such individuals.
7.3 Administration records of pension schemes, coupled with third party databases provide a rich source of data on potential longevity predictors. Affluence, geo-demographics propensity indicators, using an individual's full postcode, retirement health and gender have each been shown to have a material impact on mortality, and so on longevity. In aggregate, these account for over ten years’ difference in the life expectancy for different individuals, or, equivalently, lead to annuities (and so to liability valuations) which differ by 60%.
7.4 We have shown that, where available, the last known salary at retirement or earlier exit (re-valued with RPI) is a more powerful affluence-based longevity predictor than the pension for men, and so should be used in preference to the pension.
7.5 Further, by using postcode geo-demographic indicators, we have been able to isolate a separate, non-affluence related geo-demographic component to longevity, which can be considered to be a lifestyle effect of ‘how individuals spend their money’, rather than ‘how much money they have’. Using a postcode geo-demographic indicator, in combination with an affluence indicator, provides a refinement over using a single indicator.
7.6 The differences in life expectancy between individuals with different characteristics have been isolated using generalised linear models (GLMs). Since the resulting differences in life expectancy are large compared to the differences arising from uncertainty in the fitted parameters, we can be confident that allowing for these longevity predictors leads to more reliable estimates of post-retirement life expectancy, and, in turn, the valuation of pension scheme liabilities. Considering the membership of a portfolio in terms of the longevity predictors of the individuals therein also has particular merit, in that it readily captures the differences between different parts of the portfolio – for example between current and future pensioners.
7.7 The results of the modelling presented here can be applied directly by using post-retirement mortality assumptions appropriate to each individual within a pension portfolio. Alternatively, by appropriate weighting of the individual assumptions, a proxy can be generated for use across groups of members.
Acknowledgments
The authors wish to thank Club Vita LLP for providing access to the data underlying this paper, and in particular Mike Wilkinson for his help in implementing data validation and preparation. The authors also thank the two anonymous referees for helpful comments. All the analyses discussed in this paper have been performed using the R statistical software package (R Development Core Team 2008).
Disclosure of Interests
Club Vita LLP has been established by Hymans Robertson LLP, which employs Dr A.M. Madrigal, Dr D.D. Patel, A.T. Gaches and S.D. Baxter. Club Vita LLP operates at arms length to Hymans Robertson LLP, under the stewardship of an independent supervisory board, as a longevity comparison club providing statistical analysis to trustees and sponsors of occupational pension schemes. Full details of the structure of Club Vita and its supervisory board can be found at http://www.clubvita.co.uk.
Dr F.E. Matthews provides statistical consultancy services to Hymans Robertson LLP.
Appendix: Glossary of Statistical Terms
A1. 95% Confidence/Credibility Intervals
A 95% confidence interval for a parameter is an interval in which, if you repeated your sampling exercise and recalculated the interval each time, in 95% of the cases would include the true value of the parameter. Classical confidence intervals cannot be used to infer that the true value of the parameter lies within the interval with a given degree of belief, for example 95%. Credibility Intervals are ranges which contain the true values of parameters with a stated degree of belief or probabilities, for example, in a 95% credibility interval, the probability that the parameter lies within the interval is 95%. In general, confidence intervals are based only on the data, whilst Bayesian credibility intervals may incorporate problem-specific contextual information regarding a prior belief about the distribution of the parameter, and then modify this distribution in light of observed data. For example, we have used beta-binomial credibility intervals, whereby the beta distribution represents the uncertainty in the value of the parameter qx, whilst the binomial distribution represents the variability in the observed number of deaths. Many professional statisticians and decisions scientists, as well as non-statisticians, intuitively interpret confidence intervals in the Bayesian credibility interval sense. ‘Credible intervals’ are often called ‘confidence intervals’, and it is common to simply use ‘confidence interval’ as a general term. The choice of the level of confidence/probability is arbitrary, although 95%, 90% and 99% are generally used. The width of the interval reflects the degree of uncertainty, the smaller the interval the more precise the results.
A2. Chi-squared Test
The chi-squared test is a statistical method used to assess two types of comparisons: a test for goodness-of-fit or a test for independence in a contingency table. The test is based upon comparing the chi-squared statistic, calculated as ![]() , to the χ 2distribution with the appropriate degrees of freedom within the problem. The goodness of fit test examines whether an observed distribution differs significantly from a theoretical distribution; for example, this could be the deaths observed in a population and those predicted when a specific model and underlying distribution are assumed. It can also be used to examine whether the distribution of individuals among the categories of one variable is independent of the distribution of individuals in another; for example, does the distribution of deaths differ between individuals earning low/high salaries?
, to the χ 2distribution with the appropriate degrees of freedom within the problem. The goodness of fit test examines whether an observed distribution differs significantly from a theoretical distribution; for example, this could be the deaths observed in a population and those predicted when a specific model and underlying distribution are assumed. It can also be used to examine whether the distribution of individuals among the categories of one variable is independent of the distribution of individuals in another; for example, does the distribution of deaths differ between individuals earning low/high salaries?
A3. Cramer's V Coefficient
Cramer's V is a way of calculating correlation in contingency tables of varying sizes. Chi-square says that there is a significant relationship between variables, but it does not say how significant and important this is. Cramer's V gives this additional information. A statistically significant chi-square can be the result of a large sample size, rather than evidence of any substantive relationship between the variables. The Cramer's V statistic is not affected by sample size; it is interpreted as a measure of the relative (strength of an) association between two variables, X and Y; and it is calculated by:
where X 2 is the chi-square statistic, M is the number of categories for X, and N is the number of categories for Y. The coefficient ranges from 0 (no association) to one (perfect association). In practice, a Cramer's V of 0.10 provides a good minimum threshold for suggesting that there is a substantive relationship between two variables.
A4. Generalised Linear Model (GLM)
In an ordinary least squares (OLS) regression model, a response random variable Y is expressed as a linear relation of predictor variables x 1, …, xn ; this approach, however, is not suitable for modelling probabilities, since they have a limited range, and predictions from an OLS regression could result in values below zero or above one. GLMs extend the OLS framework by relating the predictor variables to a response variable via a link function, allowing the mean value of the response to be expressed as a linear function of the explanatory variables. A commonly used link function for modelling binomial random variables, and so probabilities such as qx values, is the logistic function:
Modelling probabilities using the logistic transformation ensures that any resulting predictions are always bounded by zero and one.
A5. Generalised Linear Mixed Model (GLMM)
GLMs are fixed effect models, i.e. they assume that all observations are independent of each other, and that the only source of randomness arises from these independent random samples. However, when we have more than one observation of the same individual on an experimental unit (for example a pension scheme or year of exposure), this assumption may not be appropriate, and the resulting additional random effects which arise may also need to be modelled. This extra source of variation can be dealt with by modelling this data structure explicitly with a form of GLMs known as generalised linear mixed models (GLMMs), or hierarchical generalised linear models, in which the linear predictor also contains random effects.
A6. Hosmer & Lemeshow Statistic
The Hosmer-Lemeshow Statistic is a measure of goodness of fit or lack of fit. Sufficient replication within subpopulations is required to make the chi-square goodness-of-fit tests valid. When there are one or more continuous predictors in the model, the data are often too sparse to get repeated observations of the same combination of statistics to use this statistic reliably. Hosmer & Lemeshow (Reference Hosmer and Lemeshow1980) recommend that the observations should be partitioned into ten equally sized groups according to their predicted probabilities. The Hosmer-Lemeshow statistic is then calculated as the chi-square statistic from the table of observed and expected frequencies for these ten groups. This test is available for binary response models.
A7. Linear Predictor
If we assume a response y is observed at fixed values of independent variables x 1, … ,xp, then in a GLM, the independent variables influence the distribution of y through the linear predictor – η = β 1x 1 +…+ βpxp – a linear combination of the unknown model parameters and the independent variables.
A8. Logistic Regression
A logistic regression model is a generalised linear model which uses a logistic link function. See generalised linear model above for more details.
A9. Loess Smoother
Similar to methods such as spline functions, a scatterplot smoother (or smoother) is used when a smooth curve is required through a scatter plot of y vs. x. The loess smoother is a type of scatterplot smoothing method which fits a weighted polynomial regression to data points in a specified region about each x value, with the nearest points given the most weight, and then uses the values of x predicted by the model as the smoothed value of x.
A10. Monte Carlo Simulation Procedure
Monte Carlo simulation is a method for iteratively evaluating a deterministic model using sets of random numbers as inputs. A simulation typically involves over 10,000 evaluations of the model. By using random inputs, a deterministic model can be turned into a stochastic model. In Monte Carlo simulation, the inputs are randomly generated from probability distributions designated to simulate the process of sampling from an actual population. Hence, the distribution for the inputs is chosen so that it most closely matches data which we already have, or best represents our current state of knowledge. This method is often used when the model is complex, nonlinear, or involves more than just a couple of uncertain parameters.
A11. Odds Ratio
The odds ratio is a statistical measure of the likelihood of an event occurring if it is exposed to a certain factor. It is used as a descriptive statistic, and plays an important role in logistic regression. The odds ratio is the ratio of the odds of an event occurring in one group to the odds of it occurring in another group. If the probabilities of the event in each of the groups are p 1 (first group) and p2 (second group), then the odds ratio is:
An odds ratio of one indicates that the condition or event under study is equally likely to occur in both groups, an odds ratio greater than one indicates that the condition or event is more likely to occur in the first group than in the second, and an odds ratio less than one indicates that the condition or event is less likely to occur in the first group. The odds ratio must be greater than or equal to zero, so that it is undefined if p 2(1−p 1) equals zero.
In our case, the event of interest relates to how the odds of dying compare for different conditions/risk factors.
A12. Recursive Partitioning and Regression Tree (rpart)
A recursive partitioning and regression tree (rpart) is a method of partitioning one or more covariates into a manageable number of discrete groups in order to maximise the homogeneity of an outcome, such as the probability of death. The resulting model can be used to predict the response with respect to a partitioned covariate, and to inform the optimal clusters with which to simplify a complex discrete or continuous covariate.
A13. Univariable /Multivariable Analysis
A univariable analysis generally corresponds to an analysis in which the effect of only one variable at a time is considered on a response variable. A multivariable analysis, therefore involves examining the effect of a combination of several variables on a response variable. In the context of the mortality models presented in this paper, univariable effects are examined only after adjusting for age effects.
A14. Ward's Method
Ward's method (like rpart - see above) seeks to form clusters that maximise the homogeneity of an outcome. Under Ward's method, each cluster initially relates to an individual observation. These clusters are then merged, one pair at a time. At each stage the two clusters chosen for merging are the two for which the resulting model (i.e. with one fewer cluster) has the smallest sum of squared errors. This continues until all observations are included in one cluster. Incorporating a merging cost aids the choice of the optimal number of clusters.