


1. Introduction
Flowing granular materials segregate by particle size, density or other physical properties, which is a phenomenon crucial to many industrial and geophysical processes (Ottino & Khakhar Reference Ottino and Khakhar2000; Ottino & Lueptow Reference Ottino and Lueptow2008; Frey & Church Reference Frey and Church2009). Despite decades of research on this topic, fundamental aspects of granular flow-driven segregation remain elusive, and state-of-the-art continuum segregation models largely rely instead on ad hoc or configuration-specific closure schemes (Gray Reference Gray2018; Umbanhowar, Lueptow & Ottino Reference Umbanhowar, Lueptow and Ottino2019; Thornton Reference Thornton2021). Recent efforts characterizing forces on single-intruder particles in otherwise species-monodisperse granular flows have advanced our understanding of segregation at the particle level (Tripathi & Khakhar Reference Tripathi and Khakhar2011; Guillard, Forterre & Pouliquen Reference Guillard, Forterre and Pouliquen2016; Jing, Kwok & Leung Reference Jing, Kwok and Leung2017; Staron Reference Staron2018; van der Vaart et al. Reference van der Vaart, van Schrojenstein Lantman, Weinhart, Luding, Ancey and Thornton2018; Jing et al. Reference Jing, Ottino, Lueptow and Umbanhowar2020) and led to segregation force models applicable across flow configurations (Guillard et al. Reference Guillard, Forterre and Pouliquen2016; Jing et al. Reference Jing, Ottino, Lueptow and Umbanhowar2021). However, it is unclear whether or how single-intruder results can be applied to granular mixtures with finite species concentration (Rousseau et al. Reference Rousseau, Chassagne, Chauchat, Maurin and Frey2021; Tripathi et al. Reference Tripathi, Kumar, Nema and Khakhar2021). More fundamentally, the mechanisms governing changes in segregation behaviours between intruder and mixture regimes as the species concentration is varied remain unresolved.
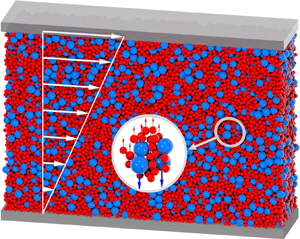
In this paper, we extend the virtual-spring-based ‘force meter’ approach for a single-intruder particle (Guillard et al. Reference Guillard, Forterre and Pouliquen2016; van der Vaart et al. Reference van der Vaart, van Schrojenstein Lantman, Weinhart, Luding, Ancey and Thornton2018; Jing et al. Reference Jing, Ottino, Lueptow and Umbanhowar2020) to size-bidisperse mixtures of arbitrary species concentration and use it to characterize the dependence of the segregation force on concentration for various particle-size ratios in controlled, constant-shear-rate flow simulations, see figure 1(a). We find that the segregation force exhibits a plateau at lower concentrations and changes monotonically above a critical concentration, indicating a transition from non-interacting intruders to cooperative phenomena in mixtures, which is reminiscent of previously observed asymmetric concentration dependence in the segregation flux (van der Vaart et al. Reference van der Vaart, Gajjar, Epely-Chauvin, Andreini, Gray and Ancey2015; Jones et al. Reference Jones, Isner, Xiao, Ottino, Umbanhowar and Lueptow2018). We also show that these results can provide closures for connecting segregation models with continuum-based frameworks for flowing granular mixtures.

Figure 1. (a) Large (4 mm, blue) and small (2 mm, red) particles ( $c_l=c_s=0.5$) in a controlled, constant-shear-rate flow. (b) Scaled restoring force,
  $F_{{res},i},$ vs time for large (blue) and small (red) particles. Data points sampled at 0.01 s intervals; bold curves are averages using a 1 s long sliding window. Horizontal lines are averages from 2 to 5 s. (c) Mean centre of mass offset between species,
  $\bar {z}_l-\bar {z}_s$, remains unchanged from its initial value with reactive restoring forces opposing segregation. Without restoring forces, large particles rise and small particles sink, such that
  $\bar {z}_l- \bar {z}_s$ increases. (d–f) Local concentration of large particles away from walls (i.e.
  $0.1\leqslant z/H\leqslant 0.9$) remains unchanged over time when the restoring force is ON, unlike the case without restoring forces (OFF), where the effects of segregation are clearly evident by
  $t=50$ s.
2. Simulations and methods
An in-house discrete element method (DEM) code running on CUDA-enabled NVIDIA GPUs (Isner et al. Reference Isner, Umbanhowar, Ottino and Lueptow2020) is used to simulate a size-bidisperse particle mixture with species volume concentration  $c_i$, diameter
  $d_i$ and density
  $\rho _i=1\ {\rm g}\ {\rm cm}^{-3}$ (
 $i = l$,
  $s$ for large or small particles, respectively) sheared in a streamwise (
 $x$) and spanwise (
 $y$) periodic domain of length
  $L=35d_l$, width
  $W=10d_l$ and height
  $H=25d_l$ to
  $50d_l$ (varied as needed) in the presence of gravity (
 $g=9.81\ {\rm m}\ {\rm s}^{-2}$, in the negative
  $z$-direction), see figure 1(a). The standard linear spring-dashpot model (Cundall & Strack Reference Cundall and Strack1979) is used to resolve particle–particle and particle–wall contacts of spherical particles using a friction coefficient of 0.5, a restitution coefficient of 0.2 and a binary collision time of 0.15 ms. The contact stiffness number
  $\kappa = k_n/(P \bar {d}) \approx 10^{4}$ (where
  $k_n$ is the normal contact stiffness,
  $P$ is the local pressure and
  $\bar {d}=c_l d_l +c_s d_s$ is the mean particle diameter) is sufficiently large that particle stiffness should have negligible influence on the flow (da Cruz et al. Reference da Cruz, Emam, Prochnow, Roux and Chevoir2005). We have verified that increasing or decreasing
  $\kappa$ by an order of magnitude does not affect the simulation results. Changing bounding walls from smooth to bumpy (randomly attached particles) does not affect the results. Large (
 $d_l=4$ mm) and small particles (
 $d_s$ varied to adjust the size ratio,
  $d_l/d_s$) have a
  $\pm 10$ % uniform size distribution to minimize layering (Staron & Phillips Reference Staron and Phillips2014) (increasing the size variation to
  $\pm 20$ % does not alter our results). Depending on the size ratio, between 26 000 and 150 000 particles are included in each simulation.
A constant shear rate  $\dot {\gamma }=U/H$ varied from 25 to
  $50\ {\rm s}^{-1}$ is imposed on the flow by the combination of the translating upper bounding wall and a streamwise stabilizing force,
  $F_{{stabilize},k}=K_s (u_k-\dot {\gamma } z_k)$, on each particle
  $k$ at every simulation time step, where U is the upper bounding wall velocity,
  $u_k$ is the particle streamwise velocity,
  $z_k$ is the vertical particle position and
  $K_s$ is a gain parameter (Lerner, Düring & Wyart Reference Lerner, Düring and Wyart2012; Clark et al. Reference Clark, Thompson, Shattuck, Ouellette and O'Hern2018; Fry et al. Reference Fry, Umbanhowar, Ottino and Lueptow2018; Saitoh & Tighe Reference Saitoh and Tighe2019; Duan et al. Reference Duan, Umbanhowar, Ottino and Lueptow2020; Jing et al. Reference Jing, Ottino, Lueptow and Umbanhowar2020). This stabilizing force reduces the granular temperature in the streamwise direction but does not affect the rheological behaviour (Jing et al. Reference Jing, Ottino, Lueptow and Umbanhowar2020) or segregation (Jing et al. Reference Jing, Ottino, Lueptow and Umbanhowar2021), and the constant shear rate eliminates forces associated with shear gradients (Fan & Hill Reference Fan and Hill2011a,Reference Fan and Hillb; Guillard et al. Reference Guillard, Forterre and Pouliquen2016; Jing et al. Reference Jing, Ottino, Lueptow and Umbanhowar2021). An overburden pressure
  $P_0$ equal to the pressure at a depth of
  $H_w=20d_l$ (i.e.
  $P_0=\rho \phi g H_w$ where the bulk solid fraction
  $\phi$ varies from 0.56 to 0.59 depending on flow conditions) is applied using a massive flat frictional top wall that is free to move vertically (fluctuates by
  ${\pm }2\,\%$ or less after an initial rapid dilatation of the particles at flow onset) and moves horizontally at a velocity determined by the constant-shear-rate velocity profile. The inertial number,
  $I=\dot {\gamma }\bar {d} \sqrt {\rho /P}$, varies between 0.06 to 0.26 depending on the flow conditions, indicating a dense granular flow.
A spring-like vertical restoring force proportional to the difference in the vertical centre of mass positions of the two initially mixed species is applied uniformly to all particles of each species  $i$ at every simulation time step in order to characterize the particle forces. The restoring force simultaneously suppresses segregation throughout the flow domain which otherwise would change the local species concentration. This method is inspired by the virtual-spring-based technique used in single-intruder DEM simulations to measure the segregation force (Guillard et al. Reference Guillard, Forterre and Pouliquen2016; van der Vaart et al. Reference van der Vaart, van Schrojenstein Lantman, Weinhart, Luding, Ancey and Thornton2018; Jing et al. Reference Jing, Ottino, Lueptow and Umbanhowar2020). The difference here is that the same virtual-spring restoring force is applied to all particles of each species rather than to just a single-intruder particle, allowing us to consider a wide range of relative concentrations of the two species. This approach resembles that in a recent study where opposing forces are applied to all particles of each species to study the interspecies drag (Bancroft & Johnson Reference Bancroft and Johnson2021). Here, the restoring force on each particle of species
  $i$ is
  $F_{{res},i}=-K_r[( \bar {z}_{i}-\bar {z}_j)-( \bar {z}_{i,0}-\bar {z}_{j,0})]/N_i$, where the centre of mass of species
  $i$ is
  $\bar {z}_{i}={\sum _{k\in i}^{N_i} z_kV_k}/{\sum _{k= 1}^{N} V_k}$ and
  $\bar {z}_{i,0}=\bar {z}_{i}(t=0)$,
  $V_k$ is the volume of particle
  $k$, subscript
  $j$ indicates the other species, and
  $N_i$ and
  $N$ are the number of particles of species
  $i$ and the total number of particles, respectively. The applied restoring forces balance, i.e.
 \begin{equation} F_{{res},i} N_i+F_{{res},j}N_j=0, \end{equation}
and the bulk flow behaviour (e.g. shear flow, bulk pressure) is unaltered. Similar to the imposed velocity profiles, we have further confirmed both here and in previous work (Jing et al. Reference Jing, Ottino, Lueptow and Umbanhowar2021) that the particle-restoring forces do not affect either the rheological characteristics of the flow or kinetic stress fields in the segregation direction.
Figure 1(b) plots the instantaneous restoring force scaled by particle weight,  $F_{{res},i}/(m_ig)$, at 0.01 s intervals for the example case shown in figure 1(a) with
  $d_l/d_s = 2$ and
  $c_l = c_s = 0.5$. The scaled restoring forces for large (blue) and small (red) particles are equal and opposite for
  $c_l=c_s=0.5$ due to the force balance, which can be written as
  $c_lF_{{res},l}/(m_lg)+c_sF_{{res},s}/(m_sg)=0$ based on (2.1), noting that particle mass
  $m_i=\rho V_i$ and species volume concentration
  $c_i=N_i V_i/V_{{tot}}$, where
  $V_{{tot}}$ is the total particle volume. The time average
  $F_{{res},i}/(m_ig)$ over 1 s time windows (bold curve) remains relatively constant 2 s after flow onset, although small force fluctuations are evident due to the stochastic nature of granular flows. In addition, varying the uniform shear rate
  $\dot {\gamma }$, the layer thickness
  $H$ or the gain parameters
  $K_s$ and
  $K_r$ has minimal influence on
  $F_{{res},i}/(m_ig)$, indicating that the restoring force is independent of the details of the flow geometry and control parameters, and that its effect is uniform through the depth of the particle bed.
To demonstrate the effectiveness of the restoring force in balancing the segregation force, the centre of mass offset between the two species scaled by the large particle diameter is shown in figure 1(c). Note that  $(\bar {z}_l-\bar {z}_s)/d_l\approx 0.5$ at
  $t=0$, which is close to the ideal uniformly mixed value of 0 (our dense packing is achieved by placing particles in a grid pattern and letting them settle under gravity before applying shear, which results in the slight initial offset between the centres of mass of the two species of
  $0.5d_l$). Without restoring forces,
  $(\bar {z}_l-\bar {z}_s)/d_l$ increases with time as the two species segregate with a constant segregation velocity after an initial dilatation of particles (
 $t < 0.5$ s) following flow onset at
  $t = 0$. The segregation velocity remains nearly constant until the local particle concentration changes enough to affect the segregation, typically after 20 s, depending on particle properties and flow conditions. In contrast, with the restoring force ON to reactively balance the segregation force,
  $(\bar {z}_l-\bar {z}_s)/d_l$ remains near its initial value of 0.5, corresponding to no segregation.
The effectiveness of the restoring force in maintaining the mixed (unsegregated) state is also evident in the concentration profiles in figure 1(d–f), where  $c_l$ remains at its initial value of 0.5 away from the walls (i.e.
  $0.1\leqslant z/H\leqslant 0.9$) when the restoring force is ON. Near the walls,
  $c_l$ slightly decreases because small particles can reside closer to the walls than the large particles. This wall exclusion effect due to particle-size differences does not change the mean centre of mass offset between species,
  $\bar {z}_l-\bar {z}_s$. As a result, the force measurement approach is unaffected. For example, doubling the layer thickness
  $H$ significantly decreases the proportion of the flow affected by the walls, but the measured segregation force differs by less than 5 %. With the restoring forces OFF, segregation occurs throughout the depth of the layer with a local segregation rate inversely proportional to the square root of depth (Duan et al. Reference Duan, Umbanhowar, Ottino and Lueptow2020). As a result,
  $c_l$ deviates from 0.5 with noticeable segregation near the top wall
  $(z/H>0.7)$ at
  $t=5$ s (figure 1e) and throughout the layer at
  $t=50$ s (figure 1f).
Since  $F_{{res},i}$, which is determined as the time average of the reactive restoring force, balances the particle segregation force,
  $F_{{seg},i}$ and the particle weight,
  $m_ig$,
 \begin{equation} F_{{seg},i}=m_i g-F_{{res},i}. \end{equation}
 The segregation force  $F_{{seg},i}$ is always upward, opposing gravity. Since
  $F_{{res},s}>0$ (figure 1b),
  $F_{{seg},s}< m_s g$ so small particles would sink without the restoring force; likewise, since
  $F_{{res},l}<0$,
  $F_{{seg},l}>m_l g$ so large particles would rise without the restoring force. From here on, we scale the segregation force with the particle weight,
  $\hat {F}_i=F_{{seg},i}/(m_i g)$.
3. Results
The first key result of this paper is measurements of the dependence of the segregation force on concentration for various particle-size ratios. Figure 2(a–c) shows examples of the dimensionless segregation force,  $\hat {F}_{i}$ (symbols) vs concentration for three size ratios (
 $d_l/d_s=1.3$, 2 and 3), where the error bars reflect fluctuations of the reactive restoring force in figure 1(b). Although the error bars are relatively large at low concentrations,
  $\hat {F}_{i}$ clearly plateaus to a maximal (minimal) value approaching the single-intruder limit
  $\hat {F}_{i,0}$ at
  $c_i\approx 0$ and decreases (increases) monotonically with
  $c_i$ for large (small) particles. For both small and large species,
  $\hat {F}_{i,1}=1$ (or, equivalently,
  $F_{{seg},i}=m_i g$) in the monodisperse limit (
 $c_i = 1$), since the segregation force exactly offsets the particle weight.

Figure 2. (a–c) Scaled particle segregation force  $\hat {F}_i=F_{{seg},i}/(m_i g)$ vs species concentration
  $c_i$ for large (
 $_{\bigcirc}$, blue) and small (
 $\triangle$, red) particles with size ratio
  $d_l/d_s=1.3$ (a), 2 (b) and 3 (c). Error bars are the standard deviation for the time average of
  $F_{{res},i}$. Dashed and dotted curves are predictions of the single-intruder segregation force model extended to mixtures (3.2). Solid curves are fits of (3.3) using large particle data. Arrows indicate the concentration
  $c_{i,{crit}}$ where
  $F_i$ deviates from the intruder limit, see text. (d)
  $\hat {F}_{i,0}$ from fits of (3.3) to large (
 $_{\bigcirc}$, filled blue) and small (
 $\triangle$, filled red) particle data. Dashed curve is a single-intruder model based on single-intruder simulations (Jing et al. Reference Jing, Ottino, Lueptow and Umbanhowar2020).
Details of the dependence of  $\hat {F}_{i}$ on
  $c_i$ vary with the size ratio,
  $d_i/d_j$. First, consider figure 2(a) for
  $d_l/d_s=1.3$ (corresponding to
  $d_i/d_j=1.3$ and 1/1.3), which shows that the plateau in
  $\hat {F}_i$ for both species extends from
  $c_i=0$ to a critical concentration,
  $c_{i,{crit}}\approx 0.3$ (defined precisely below). For
  $c_i< c_{i,{crit}}$, particles of species
  $i$ interact so infrequently with each other that the segregation force acting on them is essentially that for a single-intruder particle (i.e. concentration independent). As
  $c_i$ increases beyond
  $c_{i,{crit}}$, interactions between particles of species
  $i$ become significant, eventually resulting in the segregation force approaching the monodisperse limit as
  $c_i$ approaches one. The segregation force plateau extends to higher concentrations (greater than 0.5) as
  $d_i/d_j$ increases, see figure 2(b,c). Furthermore,
  $c_{l,{crit}}\geqslant c_{s,{crit}}$, indicating that large particles act like intruders at higher concentrations than small particles. For example, for
  $d_l/d_s=3$ (figure 2c), the plateau for large particles extends to
  $c_{l,{crit}}\approx 0.6,$ which is nearly four times the value of
  $c_{s,{crit}}\approx 0.15$. Results similar to those in figure 2(a–c) are obtained for seven additional size ratios in the range
  $1< d_l/d_s\leqslant 3$ considered here.
The total segregation force across both species for the entire system, which sums to the total particle weight, can be expressed using (2.1) and (2.2), as
 \begin{equation} \hat{F}_i c_i+ \hat{F}_jc_j = 1. \end{equation}
Noting that  $c_j=1-c_i$ and
  $\hat {F}_{j}=F_{j,0}$ for
  $c_j\leqslant c_{j,{crit}}$ (or, equivalently,
  $c_i\geqslant 1-c_{j,{crit}}$), we can predict
  $\hat {F}_{i}$ for mixtures not only in the intruder regime of species
  $i$, but also in the intruder regime of species
  $j$:
$j$:
 \begin{equation} \hat{F}_{i}=\left\{\begin{array}{@{}ll} \hat{F}_{i,0} & c_i\leqslant c_{i,{crit}}, \\ {}\big[1-\hat{F}_{j,0}(1-c_i)\big]/c_i & c_i\geqslant 1-c_{j,{crit}}. \end{array}\right. \end{equation}
Figure 2(a–c) show that the predictions of (3.2) for both large (dashed curves) and small particles (dotted curves) match the segregation force data (symbols) in the vicinity of the concentration extremes when  $\hat {F}_{i,0}$ and
  $\hat {F}_{j,0}$ are based on the intruder-limit values given in figure 2(d) and determined by fitting the data to (3.3) as described shortly. That is, determining
  $\hat {F}_{l,0}$ for
  $c_l< c_{l,{crit}}$ for large particles (dashed blue horizontal line in figure 2a–c) leads to the corresponding prediction for
  $\hat {F}_s$ at large
  $c_l$ (dashed red curve in figure 2a–c) and likewise for small particles (dotted red horizontal line and dotted blue curve in figure 2a–c). This approximation fits the data well, except in the middle of the concentration range where the initial deviation of the data from the horizontal line reflects the approximate value of
  $c_{i,{crit}}$.
Though (3.2) combined with  $\hat {F}_{i,0}$ and
  $\hat {F}_{j,0}$ predicts
  $\hat {F}_i$ at the concentration extremes, a greater challenge is to model
  $\hat {F}_i$ in the intermediate transition regime (i.e.
  $c_{i,{crit}} < c_i < 1-c_{j,{crit}}$). Since
  $\hat {F}_i$ is bounded at both ends of the concentration range, we propose a relation of the form
 \begin{equation} \hat{F}_{l}=1+(\hat{F}_{l,0}-1) \tanh\left(\frac{1-\hat{F}_{s,0}}{\hat{F}_{l,0}-1} \frac{c_s}{c_l}\right) \end{equation}
for large particles, noting that the characteristics of the hyperbolic tangent function, i.e.  $\lim _{c_l\to 0} \tanh (c_s/c_l)=1$ and
  $\lim _{c_l\to 1}\tanh (c_s/c_l)=0$, satisfy the theoretical constraints that
  $\hat {F}_l=\hat {F}_{l,0}$ at
  $c_l=0$ and
  $\hat {F}_l=1$ at
  $c_l=1$. Substituting (3.3a) into the force balance of (3.1) and solving for
  $\hat {F}_{s}$ gives
 \begin{equation} \hat{F}_{s}=1 -(\hat{F}_{l,0}-1) \frac{c_l}{c_s} \tanh\left(\frac{1-\hat{F}_{s,0}}{\hat{F}_{l,0}-1} \frac{c_s}{c_l}\right). \end{equation}
Equation (3.3b) also satisfies the same constraints at both concentration limits, i.e.  $\hat {F}_s=\hat {F}_{s,0}$ at
  $c_s=0$ and
  $\hat {F}_s=1$ at
  $c_s=1$. The fit parameters
  $\hat {F}_{l,0}$ and
  $\hat {F}_{s,0}$ correspond to intruder segregation forces and can be obtained by fitting (3.3a) to the data for large particles or, equivalently, fitting (3.3b) to the data for small particles with no significant differences in the fit quality or fit parameter values.
To demonstrate the validity of our simulation and fitting approach, figure 2(d) shows  $\hat {F}_{i,0}$ based on curve fits to (3.3) for both large (blue circles) and small (red triangles) particle data. The two data sets match within the uncertainty, demonstrating the robust nature of the hyperbolic functional form of (3.3) in characterizing the segregation force. In addition, the results are comparable to predictions (dashed curve) of a single-intruder model derived from single-intruder simulations (Jing et al. Reference Jing, Ottino, Lueptow and Umbanhowar2020), even though these simulations use different particle properties (i.e.
  $d_l=1 - 40$ mm,
  $d_s=5$ mm and
  $\rho =2.5\ {\rm g}\ {\rm mm}^{-3}$), implement a different contact model (i.e. Hertz contact model with Young's modulus of 5
 $\times 10^{7}$ Pa and Poison's ratio 0.4), use a different flow geometry (inclined chute and uniform shear) and have a slightly lower solid volume fraction (
 $\phi =0.55$ instead of
  $\phi =0.56 - 0.59$ here). This validates not only the values we find for the segregation force at the single-intruder limit, but also our approach for direct measurement of segregation forces in bidisperse mixtures.
With an accurate model for  $\hat {F}_i,$ i.e. (3.3), we now define the critical concentration,
  $c_{i,{crit}}$, as the concentration at which
  $\hat {F}_i-1$ deviates by 5 % from
  $\hat {F}_{i,0}-1$. Based on 260 simulations at different concentrations, size ratios and shear rates, and fitting the resulting segregation force data to (3.3), the dependence of
  $c_{i,{crit}}$ for a wide range of conditions can be determined. The phase diagram in figure 3(a) shows the dependence of
  $c_{i,{crit}}$, which describes the limiting concentration below which a particle acts as an intruder and above which cooperative phenomena between similar particles makes the system act like a mixture. This is the second key result of this paper.

Figure 3. (a) Segregation force regimes (shaded areas) dependence on large particle concentration,  $c_l,$ and size ratio,
  $d_l/d_s$. Symbols represent
  $c_{i,{crit}}$ for large (
 $_{\bigcirc}$, filled blue) and small (
 $\triangle$, filled red) particles. Curves are
  $c_{i,{crit}}=0.74[1-\exp (-0.52 d_i/d_j)]$ (see text). (b) Sheared bed images for
  $d_l/d_s=2$ (vertical dotted line in (a)) at
  $c_l$ intervals of 0.1. For
  $c_s< c_{s,{crit}}\approx 0.18$ (or, equivalently,
  $c_l\gtrapprox 0.82$), the small-particle segregation force equals that on a single small intruder, while for
  $c_l< c_{l,{crit}}\approx 0.46$ the large-particle segregation force equals that on a single large intruder. Intermediate concentrations (
 $0.46\lessapprox c_l\lessapprox 0.82$), where segregation forces are less than for intruders, are termed mixture-like.
In figure 3(a),  $c_{i,{crit}}$ (symbols) for both large and small particles increases monotonically with size ratio for the range explored here (
 $1< d_l/d_s\leqslant 3$) and is reasonably well fit by the expression
  $c_{i,{crit}}=0.74[1-\exp (-0.52 d_i/d_j)].$ The limiting value of
  $c_{i,{crit}}=0.74$ for
  $d_i/d_j\gg 1$ matches the free-sifting limit for small particles in a network of randomly close-packed large particles at
  $\phi _{max}=0.64$, i.e.
  $1/(2-\phi _{max})$ (Prasad, Santangelo & Grason Reference Prasad, Santangelo and Grason2017). This suggests that for
  $c_l>0.74$ small particles percolate downward through the voids without significantly affecting the flow of large particles, indicating a possible change in the size segregation mechanism (Golick & Daniels Reference Golick and Daniels2009; Schlick et al. Reference Schlick, Fan, Isner, Umbanhowar, Ottino and Lueptow2015).
In the monodisperse mixture limit ( $d_i/d_j=1$), the exponential fit gives
  $c_{i,{crit}}=0.30$, which implies that the corresponding large-particle concentration for
  $c_{s,{crit}}$ is
  $c_l=1-c_{s,{crit}} = 0.70$, as shown in figure 3(a). Values of
  $c_l$ for
  $c_{l,{crit}}$ and
  $c_{s,{crit}}$ are necessarily symmetric about
  $c_l=0.5$, since the intruder is the same as the surrounding particles. Intriguingly,
  $c_{i,{crit}}=0.30$ is nearly identical to
  $0.31$, the conducting sphere concentration at which disordered packings of monodisperse conducting and insulating spheres become globally conductive (i.e. exhibit long-range electrical conduction, thereby exceeding what is known as the ‘percolation threshold’) (Powell Reference Powell1979; Ziff & Torquato Reference Ziff and Torquato2017). Further, the critical concentrations for
  $1/3\leqslant d_s/d_l< 1$ from this study also match the percolation thresholds in size-bidisperse mixtures (He & Ekere Reference He and Ekere2004), suggesting that the particle segregation force and geometric percolation are related. Anecdotal support for this picture is provided by figure 3(b), which shows shear flow images for
  $d_l/d_s=2$. In the intruder-like regime for small particles (large
  $c_l$), small particles appear to contact each other infrequently and only in the voids between large particles, whereas in the intruder-like regime for large particles (small
  $c_l$), large particles appear to be well-separated by a continuous phase of small particles on average, and are therefore unlikely to interact directly with each other. In an attempt to better understand the connection between the intruder regimes and the percolation limit, the coordination number and the radial distribution function of each species were evaluated for mixtures with different size ratios. However, unlike the segregation force, these quantities vary smoothly over the concentration range, failing to duplicate the plateau and rapid change in
  $F_{{seg},i}$ near
  $c_{i,{crit}}$ (see Appendix A). Further investigation of the intruder regime transition at
  $c_{i,{crit}}$ is clearly necessary but is beyond the scope of this paper.
4. Discussion and conclusions
Our results characterizing the segregation force can be applied to continuum descriptions of segregation. Some previous studies assume  $\hat {F}_{i}$ depends linearly on
  $c_i$ to close the momentum equation (Gray & Thornton Reference Gray and Thornton2005; Rousseau et al. Reference Rousseau, Chassagne, Chauchat, Maurin and Frey2021). Despite some success for these continuum models in predicting concentration profiles of equal-volume mixtures, a linear relation between
  $\hat {F}_i$ and
  $c_i$ does not capture the segregation force plateau for intruders clearly evident in figure 2(a–c). In addition, the resulting symmetric form for the species-specific pressure, when coupled with a linear drag model, does not predict the asymmetric concentration dependence of segregation (i.e. small particles among mostly large particles segregate faster than vice versa) (Golick & Daniels Reference Golick and Daniels2009; Gajjar & Gray Reference Gajjar and Gray2014; Jones et al. Reference Jones, Isner, Xiao, Ottino, Umbanhowar and Lueptow2018). To address the asymmetric segregation flux,
  $\hat {F}_{i}$ has been proposed to be quadratic in
  $c_i$ (Gajjar & Gray Reference Gajjar and Gray2014; Duan et al. Reference Duan, Umbanhowar, Ottino and Lueptow2021; Trewhela, Ancey & Gray Reference Trewhela, Ancey and Gray2021; Tripathi et al. Reference Tripathi, Kumar, Nema and Khakhar2021). Although the coefficients in a quadratic model can be adjusted to minimize the difference between the model and the data, the quadratic form cannot reproduce the plateau approaching the intruder limit (
 $c_i\approx 0$), as will be shown shortly.
To address these shortcomings in modelling the segregation force within a continuum model framework, we recast our results (data and model (3.3)) as partial pressures (normal stresses), i.e.  ${\partial P_i}/{\partial z}=N_iF_{{seg},i}/(LWH)={n_iF_{{seg},i}}$ (Rousseau et al. Reference Rousseau, Chassagne, Chauchat, Maurin and Frey2021), where
  $n_i=c_i\phi /V_i$ is the particle number density. Combined with the bulk pressure gradient
  $\partial P/ \partial z= \phi \rho g$, the ratio of the pressure contribution of species
  $i$ to the bulk pressure, or normal stress fraction, is
  $f_i=P_i/P=c_i \hat {F}_{i}$ (Tunuguntla, Weinhart & Thornton Reference Tunuguntla, Weinhart and Thornton2017), which, unlike the standard mixture theory, does not necessarily equal the species volume fraction.
Having measured  $\hat {F}_i$ vs
  $c_i$, we can directly evaluate
  $f_i$ as figure 4(a–c) shows for three examples at
  $d_l/d_s=1.3$, 2 and 3. At all concentrations, the pressure partition functions for large and small particles sum to 1 (i.e.
  $f_l+f_s=1$), and the curves based on the segregation force model of (3.3) match the simulation data. The deviation of the pressure partitioning for
  $d_l/d_s \ne 1$ from the linear monodisperse case,
  $f_i=c_i$ (dotted line) is evident. Two previously proposed models assuming
  $f_i$ is a weighted function of particle size,
  $f_i=d_ic_i/\sum (d_i c_i)$ (Marks, Rognon & Einav Reference Marks, Rognon and Einav2012), or volume,
  $f_i=d_i^{3}c_i/\sum (d_i^{3} c_i)$ (Tunuguntla, Bokhove & Thornton Reference Tunuguntla, Bokhove and Thornton2014) have been shown (Tunuguntla et al. Reference Tunuguntla, Weinhart and Thornton2017) to be significantly less accurate than the quadratic model of Gajjar & Gray (Reference Gajjar and Gray2014) for the partial kinetic stress for
  $1.3\leqslant d_l/d_s \leqslant 1.7$ in a free-surface flow, but the results for the normal stress are inconclusive. Basing the normal stress fraction
  $f_i$ on the particle size (Marks et al. Reference Marks, Rognon and Einav2012) or volume (Tunuguntla et al. Reference Tunuguntla, Bokhove and Thornton2014) does not match our uniform shear flow data over the range of
  $1.1\leqslant d_l/d_s \leqslant 3$ (see Appendix B). The Gajjar & Gray (Reference Gajjar and Gray2014) model, which is included in figure 4(a–c), can be made to match the
  $f_i$ data by fitting two arbitrary model parameters via a least squares approach. However, when compared with measurements of
  $\hat {F}_{i}$ in figure 4(d–f), it is evident that (3.3) better captures the intruder plateau as
  $c_i$ approaches zero. We further note that the fit parameters for the Gajjar & Gray (Reference Gajjar and Gray2014) model are not universal, depend on
  $d_l/d_s$ and lack a physical meaning, whereas (3.3) depends only on the physically meaningful and measurable single-intruder limit segregation forces,
  $\hat {F}_{l,0}$ and
  $\hat {F}_{s,0}$. Thus, the pressure partition function based on (3.3), i.e.
  $f_i=c_i \hat {F}_i$ where
  $\hat {F}_i$ is determined from (3.3), shows promise for application to continuum models of flowing mixtures of bidisperse granular materials (Marks et al. Reference Marks, Rognon and Einav2012; Tunuguntla et al. Reference Tunuguntla, Bokhove and Thornton2014; Staron & Phillips Reference Staron and Phillips2015; Rousseau et al. Reference Rousseau, Chassagne, Chauchat, Maurin and Frey2021; Trewhela et al. Reference Trewhela, Ancey and Gray2021; Tripathi et al. Reference Tripathi, Kumar, Nema and Khakhar2021), although further work is necessary to elucidate any differences between the uniform shear flow studied here and more general free-surface flows.

Figure 4. (a–c) Ratio of species-specific pressure to bulk pressure,  $f_i=P_i/P$, for different size ratios. Symbols represent data for large (
 $_{\bigcirc}$, blue) and small (
 $\triangle$, red) particles. Solid curves are predictions of (3.3) recast as a pressure ratio, i.e.
  $f_i=c_i \hat {F}_i$. Dashed black curves are best fits of the quadratic (Gajjar & Gray Reference Gajjar and Gray2014) model to the data for each size ratio,
  $d_l/d_s$. Dotted lines represent the monodisperse case (
 $d_l/d_s=1$) where
  $f_i=c_i$. (d–f) Scaled segregation force from simulation data (symbols),
  $\hat {F}_i=f_i/c_i$, is well fit over the full
  $c_i$ range by (3.3) (solid curves) but poorly fit by the quadratic model (black dashed curves) at low
  $c_i.$ Data and (3.3) fits are reproduced from figure 2(a–c).
Our results capture and characterize the concentration dependence of the segregation force in uniform shear flows, but a word of caution about extensions is in order. Recent studies indicate that the intruder segregation force  $\hat {F}_{i,0}$ also depends on the shear gradient (Fan & Hill Reference Fan and Hill2011a,Reference Fan and Hillb; Guillard et al. Reference Guillard, Forterre and Pouliquen2016; Jing et al. Reference Jing, Ottino, Lueptow and Umbanhowar2021). Although the shear rate gradient-induced component of
  $F_{seg}$ is negligible in most free-surface flows (Jing et al. Reference Jing, Ottino, Lueptow and Umbanhowar2020), further study of the concentration dependence of
  $F_{seg}$ in flows where shear rate gradients matter (e.g. wall-driven flows) and for larger size ratios, where free sifting of small particles alters the segregation, is warranted.
Funding
This material is based upon work supported by the National Science Foundation under grant no. CBET-1929265.
Declaration of interests
The authors report no conflict of interest.
Appendix A. Coordination number and radial distribution function
To explore the difference in local structure between intruder and mixture regimes, the coordination number  $Z_i$ is plotted as a function of large-particle concentration
  $c_l$ for an example case with size ratio
  $d_l/d_s=2$ in figure 5. Unlike the segregation force,
  $Z_i$ for both large and small particles varies nearly linearly over the concentration range, failing to duplicate the plateau and change in segregation force near
  $c_{l,{crit} }\approx 0.46$ for size ratio 2. Likewise,
  $Z_i$ for different types of particle interactions is nearly linear in
  $c_l$, with no indication of abrupt changes in contact behaviour between the intruder and mixture regimes.

Figure 5. Dependence of coordination number  $Z_i$ for (a) large and (b) small particles on large-particle concentration for size ratio
  $d_l/d_s=2$.
  $Z_i$ for large or small particles (solid curve) can be separated into same-species (dash-dot) and interspecies (dashed) coordination numbers depending on the species of the contacting particles.
The radial distribution function (RDF),  $g(r)$, of large and small particles neighbouring large particles at the centre of the domain are plotted in figure 6. Here large particles are chosen as reference points because the segregation force plateau extends to higher concentration. For the example case with
  $d_l/d_s=2$, the RDF for both large and small particles at
  $c_l=0.4$, 0.5 and 0.6 are almost the same, also indicating no significant changes in the local structure of neighbouring particles near
  $c_{l,{crit} }\approx 0.46$ for
  $d_l/d_s=2$.

Figure 6. Radial distribution functions of (a) large and (b) small particles near  $c_{l,{crit} }\approx 0.5$ for
  $d_l/d_s=2$. Large particles at the centre of the domain are used as reference points. Data are averaged over 200 distinct times at intervals of 0.01 s. Colours represent different mixture concentrations as indicated in (a).
Appendix B. Other models for  $f_i$
$f_i$

Previously proposed models assume that  $f_i$ is a weighted function of particle size,
  $f_i=d_i c_i/\sum (d_i c_i)$ (Marks et al. Reference Marks, Rognon and Einav2012) or volume,
  $f_i=d_i^{3}c_i/\sum (d_i^{3} c_i)$ (Tunuguntla et al. Reference Tunuguntla, Bokhove and Thornton2014). These approaches do not fit our simulation data for
  $f_i$ (figure 7a–c) or
  $\hat {F}_i$ (figure 7d–f) in uniform shear flows.

Figure 7. (a–c) Ratio of species-specific pressure to bulk pressure,  $f_i=P_i/P$, for different size ratios. Symbols represent data for large (
 $_{\bigcirc}$, blue) and small (
 $\triangle$, red) particles. Solid curves are predictions of (3.3) recast as a pressure ratio, i.e.
 $\ \, f_i=c_i \hat {F}_i$. Thin curves are
  $f_i$ as assumed in previous studies:
  $f_i=d_ic_i/\sum (d_i c_i)$ (dashed) (Marks et al. Reference Marks, Rognon and Einav2012) and
  $f_i=d_i^{3}c_i/\sum (d_i^{3} c_i)$ (dash-dot) (Tunuguntla et al. Reference Tunuguntla, Bokhove and Thornton2014). Dotted lines represent the monodisperse case (
 $d_l/d_s=1$) where
  $f_i=c_i$. (d–f) The dependence of the scaled segregation force,
  $\hat {F}_i=f_i/c_i$, on
  $c_i$ for various models compared with simulation data and (3.3). Data and (3.3) fits are reproduced from figure 2(a–c).


