


1 Introduction
The upper ocean is a nexus of currents of many types, ranging from the general circulation and tides at the basin scale, through mesoscale and submesoscale eddies, inertia–gravity waves, boundary-layer turbulence and surface gravity waves. Historically, both because of the technological limits of instruments and computers and the desire for conceptual simplicity, these different phenomena have been investigated and understood somewhat independently of each other. The direction of the science, however, is toward understanding this system holistically.
Boundary-layer turbulence is generated from vertical profile instabilities of the currents and stratification forced by surface momentum and buoyancy fluxes. The turbulent kinetic energy (TKE) is conspicuously more intense within this relatively thin layer of thickness
 $h$
, and it provides vertical eddy fluxes of momentum and buoyancy to reshape the mean current
$h$
, and it provides vertical eddy fluxes of momentum and buoyancy to reshape the mean current
 $\boldsymbol{u}(z)$
and buoyancy
$\boldsymbol{u}(z)$
and buoyancy
 $b(z)$
(or, more simply, temperature
$b(z)$
(or, more simply, temperature
 $\unicode[STIX]{x1D703}(z)$
) profiles throughout this layer, while also sometimes entraining more quiescent fluid from below, thus increasing
$\unicode[STIX]{x1D703}(z)$
) profiles throughout this layer, while also sometimes entraining more quiescent fluid from below, thus increasing
 $h$
. This is a well studied phenomenon, both for the lower atmosphere and upper ocean, but it is perhaps best understood in situations with a high degree of horizontal homogeneity over distances much larger than
$h$
. This is a well studied phenomenon, both for the lower atmosphere and upper ocean, but it is perhaps best understood in situations with a high degree of horizontal homogeneity over distances much larger than
 $h$
.
$h$
.
Submesoscale currents draw their energy from larger-scale, mostly geostrophic flows (e.g. mesoscale eddies). They are particularly active in the weakly stratified upper ocean (i.e. the mixed layer), thus overlapping vertically with the boundary-layer turbulence. Their horizontal scale
 $L$
spans a wide range between a typical mesoscale length, the first baroclinic deformation radius
$L$
spans a wide range between a typical mesoscale length, the first baroclinic deformation radius
 $R_{d}$
and the boundary-layer depth
$R_{d}$
and the boundary-layer depth
 $h$
. Their dynamics is partly ageostrophic, though still strongly influenced by Earth’s rotation and density stratification. In particular, they exhibit a forward cascade of energy and thus provide a conduit to dissipation for larger-scale flows (we report on this in § 5.4 and the conclusions). They also provide substantial vertical fluxes of buoyancy and other material concentrations, connecting the interior profiles with the surface values. The vertical buoyancy flux is usually positive,
$h$
. Their dynamics is partly ageostrophic, though still strongly influenced by Earth’s rotation and density stratification. In particular, they exhibit a forward cascade of energy and thus provide a conduit to dissipation for larger-scale flows (we report on this in § 5.4 and the conclusions). They also provide substantial vertical fluxes of buoyancy and other material concentrations, connecting the interior profiles with the surface values. The vertical buoyancy flux is usually positive,
 $\overline{w^{\prime }b^{\prime }}>0$
, implying conversion of surface layer available potential energy to kinetic energy and an increase in density stratification. This subject is reviewed in McWilliams (Reference McWilliams2016).
$\overline{w^{\prime }b^{\prime }}>0$
, implying conversion of surface layer available potential energy to kinetic energy and an increase in density stratification. This subject is reviewed in McWilliams (Reference McWilliams2016).
Frontogenesis is an active submesoscale process that rapidly sharpens the horizontal density gradients at the surface, both for density steps (fronts) and for dense (cold) density lines (filaments). The classical frontogenetic process is by an ambient strain flow (Hoskins Reference Hoskins1982), which in this context might usually be associated with regions in between the cores of mesoscale eddies. However, frontogenesis is also induced by vertical momentum mixing by the boundary-layer turbulence in the presence of a submesoscale front or filament, through the secondary circulation (SC) established by an approximate horizontal momentum balance called turbulent thermal wind (TTW), involving the Coriolis force, baroclinic pressure gradient and vertical eddy diffusion (Gula, Molemaker & McWilliams Reference Gula, Molemaker and McWilliams2014). In a circulation model with parameterized boundary-layer mixing (using the K-profile parameterization (KPP); Large, McWilliams & Doney Reference Large, McWilliams and Doney1994), an initial dense filament in TTW balance undergoes rapid frontogenesis with shrinking width and increasing cross-filament velocity and buoyancy gradients until the width approaches the model grid resolution scale and the model’s subgrid-scale regularization procedure artificially arrests further frontogenesis (McWilliams et al. Reference McWilliams, Gula, Molemaker, Renault and Shchepetkin2015).
Our focus is on cold filaments, essentially a pair of warm–cold and cold–warm fronts separated by a finite horizontal distance. Cold filaments are more prevalent in geophysical flows, compared to their rarer, less active warm counterparts, and they exhibit super-exponential rates of sharpening (as do fronts in an ambient strain flow). McWilliams, Colas & Molemaker (Reference McWilliams, Colas and Molemaker2009a ) shows that the rate of sharpening for cold filaments is faster than the rates for either warm filaments or single-sided fronts. The reason is the favourable secondary circulation configuration of stronger surface convergence along the filament axis than in the other two configurations.
The present article is an investigation of the evolution of cold filament frontogenesis (CFF) induced by boundary-layer turbulence using large-eddy simulation (LES) at high Reynolds number. It builds on the parameterized mixing solutions in McWilliams et al. (Reference McWilliams, Gula, Molemaker, Renault and Shchepetkin2015) obtained using the regional oceanic modelling system (ROMS) (Shchepetkin & McWilliams Reference Shchepetkin and McWilliams2005). The LES model resolves both the submesoscale currents and the dominant scales of the turbulence and fully encompasses their dynamical interaction. The principal questions are the following: What is the final outcome of submesoscale TTW frontogenesis? How is the boundary-layer turbulence altered while this is happening? We present the results as a CFF lifecycle event: onset, arrest and decay. The use of LES with fine grid resolution and near-unity aspect ratio grids resolves the variance and energy transfers between horizontal and vertical motions, essentially independent of the subgrid-scale parameterization scheme.
Previous studies using LES to study idealized submesoscale processes focus on barotropic and baroclinic instabilities with much less attention paid to the dynamics of frontogenesis, (e.g. Mahadevan & Tandon Reference Mahadevan and Tandon2006; Özgökmen et al.
Reference Özgökmen, Poje, Fischer and Haza2011; Skyllingstad & Samelson Reference Skyllingstad and Samelson2012; Hamlington et al.
Reference Hamlington, Van Roekel, Fox-Kemper, Julien and Chini2014; Cornejo & Sepúlveda Reference Cornejo and Sepúlveda2016). An exception is the work by Samelson & Skyllingstad (Reference Samelson and Skyllingstad2016) who analyse their solutions in the frontogenetic framework first described by Hoskins & Bretherton (Reference Hoskins and Bretherton1972), and find Kelvin–Helmholtz instability is a main route leading to an unbalanced flow. Suzuki et al. (Reference Suzuki, Fox-Kemper, Hamlington and Roekel2016) also target frontal dynamics and analyse the momentum and energy budgets, including wave effects, using the solutions described by Hamlington et al. (Reference Hamlington, Van Roekel, Fox-Kemper, Julien and Chini2014). For a late time single-sided front, likely generated by submesoscale mixed layer eddies (Fox-Kemper, Ferrari & Hallberg Reference Fox-Kemper, Ferrari and Hallberg2008), they find submesoscale and traditional frontogenesis differ in part because of Stokes shear, a wave effect. The problem design in Skyllingstad & Samelson (Reference Skyllingstad and Samelson2012) and Hamlington et al. (Reference Hamlington, Van Roekel, Fox-Kemper, Julien and Chini2014) is approximately similar to ours, but they concentrate on the submesoscale instabilities that develop at long times from initial conditions that are weak, broad, warm fronts; their choice of frontal parameters are guided by the stability analysis of Boccaletti, Ferrari & Fox-Kemper (Reference Boccaletti, Ferrari and Fox-Kemper2007) and Thomas, Ferrari & Joyce (Reference Thomas, Ferrari and Joyce2013). It is important to note that these frontal simulations are initiated from a nearly quiescent two-dimensional (2-D) state with the resulting instabilities first appearing at long time, more than 10 days into the simulations. Near the end of the simulations described by Hamlington et al. (Reference Hamlington, Van Roekel, Fox-Kemper, Julien and Chini2014), the initial 2-D front disintegrates and numerous smaller-scale fronts populate the horizontal domain. Hamlington et al. (Reference Hamlington, Van Roekel, Fox-Kemper, Julien and Chini2014) impose down-front winds and waves misaligned at an angle of
 $30^{\circ }$
relative to the down-front axis. Skyllingstad & Samelson (Reference Skyllingstad and Samelson2012) only applies a slightly unstable surface buoyancy flux with a small temperature jump of 0.04 K across the front, and find instabilities develop at time
$30^{\circ }$
relative to the down-front axis. Skyllingstad & Samelson (Reference Skyllingstad and Samelson2012) only applies a slightly unstable surface buoyancy flux with a small temperature jump of 0.04 K across the front, and find instabilities develop at time
 $t>96~\text{h}$
. Skyllingstad & Samelson (Reference Skyllingstad and Samelson2012) use a domain size of
$t>96~\text{h}$
. Skyllingstad & Samelson (Reference Skyllingstad and Samelson2012) use a domain size of
 $(5.76,10.5,0.12)~\text{km}$
, similar to that used here, but with a coarser grid resolution. In these previous studies the arresting dynamics of frontogenesis is only briefly touched on, and the development of boundary-layer turbulence often occurs only after the frontal instability. One key difference is that the initial buoyancy gradient used by Hamlington et al. (Reference Hamlington, Van Roekel, Fox-Kemper, Julien and Chini2014) is nearly 20 times lower than the initial buoyancy gradient used here. However, Suzuki et al. (Reference Suzuki, Fox-Kemper, Hamlington and Roekel2016) finds that under the action of submesoscale mixed layer eddies, intermittent fronts can appear that are 5 times stronger than the initial state. Another difference is that the frontogenetic evolution described here is initialized with fully developed boundary-layer turbulence and emphasizes the important role of secondary circulations.
$(5.76,10.5,0.12)~\text{km}$
, similar to that used here, but with a coarser grid resolution. In these previous studies the arresting dynamics of frontogenesis is only briefly touched on, and the development of boundary-layer turbulence often occurs only after the frontal instability. One key difference is that the initial buoyancy gradient used by Hamlington et al. (Reference Hamlington, Van Roekel, Fox-Kemper, Julien and Chini2014) is nearly 20 times lower than the initial buoyancy gradient used here. However, Suzuki et al. (Reference Suzuki, Fox-Kemper, Hamlington and Roekel2016) finds that under the action of submesoscale mixed layer eddies, intermittent fronts can appear that are 5 times stronger than the initial state. Another difference is that the frontogenetic evolution described here is initialized with fully developed boundary-layer turbulence and emphasizes the important role of secondary circulations.
This study differs from previous ones using LES in that we use even finer meshes (e.g. nominally a factor of 3 finer in each coordinate direction near the water surface compared to Hamlington et al. (Reference Hamlington, Van Roekel, Fox-Kemper, Julien and Chini2014)), include fully developed turbulence as an initial state, apply alternatively either a wind stress in different directions relative to the filament axis or a surface cooling flux as the generators of turbulence and analyse the solutions over a time period
 $t<20~\text{h}$
. Focusing on a single filament allows us to study the impact of well-resolved turbulence on CFF and the ensuing frontal arrest within a single (large) computational mesh. The outline of the manuscript is as follows: a brief description of the LES equations and numerical algorithm is given in § 2, an outline of the numerical experiments is in § 3, the analysis technique used to decompose flow variables is described in § 4 and results are discussed in § 5. A summary of the findings is given in § 6.
$t<20~\text{h}$
. Focusing on a single filament allows us to study the impact of well-resolved turbulence on CFF and the ensuing frontal arrest within a single (large) computational mesh. The outline of the manuscript is as follows: a brief description of the LES equations and numerical algorithm is given in § 2, an outline of the numerical experiments is in § 3, the analysis technique used to decompose flow variables is described in § 4 and results are discussed in § 5. A summary of the findings is given in § 6.
The perspective of this paper is primarily on the submesoscale phenomenology, and a companion paper focuses more on the turbulent phenomena during CFF (Sullivan & McWilliams Reference Sullivan and McWilliams2017). Furthermore, as part of the idealization in posing this process study, we exclude interactions with surface gravity waves (also known as Langmuir turbulence in the boundary layer; Sullivan & McWilliams Reference Sullivan and McWilliams2010) here, but we intend to report on this generalization later.
2 Large-eddy simulation
The dynamics of the ocean boundary layer (OBL), including submesoscale and boundary-layer motions, is assumed to be described by a conventional large-eddy simulation model for a high Reynolds number Boussinesq flow with system rotation (e.g. Moeng Reference Moeng1984) and initially no wave effects (McWilliams, Sullivan & Moeng Reference McWilliams, Sullivan and Moeng1997; Sullivan, McWilliams & Melville Reference Sullivan, McWilliams and Melville2007):
 $$\begin{eqnarray}\displaystyle & \displaystyle \frac{\text{D}\boldsymbol{u}}{\unicode[STIX]{x2202}t}=-\boldsymbol{f}\times \boldsymbol{u}-\unicode[STIX]{x1D735}\unicode[STIX]{x03C0}+\hat{\boldsymbol{z}}b-\unicode[STIX]{x1D735}\boldsymbol{\cdot }\boldsymbol{T}, & \displaystyle\end{eqnarray}$$
 $$\begin{eqnarray}\displaystyle & \displaystyle \frac{\text{D}b}{\unicode[STIX]{x2202}t}=-\unicode[STIX]{x1D735}\boldsymbol{\cdot }\boldsymbol{B}, & \displaystyle\end{eqnarray}$$
 $$\begin{eqnarray}\displaystyle & \displaystyle \unicode[STIX]{x1D735}\boldsymbol{\cdot }\boldsymbol{u}=0. & \displaystyle\end{eqnarray}$$
 $\unicode[STIX]{x1D70C}\boldsymbol{u}$
and (2.1b
) for buoyancy
$\unicode[STIX]{x1D70C}\boldsymbol{u}$
and (2.1b
) for buoyancy
 $b$
. The divergence free (incompressible) condition (2.1c
) determines the elliptic pressure variable
$b$
. The divergence free (incompressible) condition (2.1c
) determines the elliptic pressure variable
 $\unicode[STIX]{x03C0}$
. Variables that appear in (2.1) are Cartesian coordinates
$\unicode[STIX]{x03C0}$
. Variables that appear in (2.1) are Cartesian coordinates
 $\boldsymbol{x}\equiv x_{i}=(x,y,z)$
, velocity components
$\boldsymbol{x}\equiv x_{i}=(x,y,z)$
, velocity components
 $\boldsymbol{u}\equiv u_{i}=(u,v,w)$
, rotation vector
$\boldsymbol{u}\equiv u_{i}=(u,v,w)$
, rotation vector
 $\boldsymbol{f}=(0,0,f)$
with
$\boldsymbol{f}=(0,0,f)$
with
 $f$
the Coriolis parameter and unit vector
$f$
the Coriolis parameter and unit vector
 $\hat{\boldsymbol{z}}$
in the vertical direction
$\hat{\boldsymbol{z}}$
in the vertical direction
 $z$
. The buoyancy variable is defined in terms of water density:
$z$
. The buoyancy variable is defined in terms of water density:
 $b=g(\unicode[STIX]{x1D70C}_{o}-\unicode[STIX]{x1D70C})/\unicode[STIX]{x1D70C}_{o}$
where
$b=g(\unicode[STIX]{x1D70C}_{o}-\unicode[STIX]{x1D70C})/\unicode[STIX]{x1D70C}_{o}$
where
 $(\unicode[STIX]{x1D70C},\unicode[STIX]{x1D70C}_{o})$
are density and reference density, respectively. We assume a linear equation of state that relates temperature
$(\unicode[STIX]{x1D70C},\unicode[STIX]{x1D70C}_{o})$
are density and reference density, respectively. We assume a linear equation of state that relates temperature
 $\unicode[STIX]{x1D703}$
and density:
$\unicode[STIX]{x1D703}$
and density:
 $\unicode[STIX]{x1D70C}=\unicode[STIX]{x1D70C}_{o}[1-\unicode[STIX]{x1D6FD}(\unicode[STIX]{x1D703}-\unicode[STIX]{x1D703}_{o})]$
with
$\unicode[STIX]{x1D70C}=\unicode[STIX]{x1D70C}_{o}[1-\unicode[STIX]{x1D6FD}(\unicode[STIX]{x1D703}-\unicode[STIX]{x1D703}_{o})]$
with
 $\unicode[STIX]{x1D6FD}$
the coefficient of expansion and
$\unicode[STIX]{x1D6FD}$
the coefficient of expansion and
 $\unicode[STIX]{x1D703}_{o}$
a reference temperature. The pressure variable
$\unicode[STIX]{x1D703}_{o}$
a reference temperature. The pressure variable  $$\begin{eqnarray}\unicode[STIX]{x03C0}=\frac{p}{\unicode[STIX]{x1D70C}_{o}}+\frac{2}{3}e\end{eqnarray}$$
contains a Bernoulli head from the subgrid-scale (SGS) energy expressed as the trace of the SGS momentum flux
 $e=\unicode[STIX]{x1D70F}_{ii}/2$
.
$e=\unicode[STIX]{x1D70F}_{ii}/2$
.
The LES equations contain unknown SGS momentum and buoyancy fluxes
 $(\boldsymbol{T}\equiv \unicode[STIX]{x1D70F}_{ij},\boldsymbol{B}\equiv b_{i})$
and SGS energy
$(\boldsymbol{T}\equiv \unicode[STIX]{x1D70F}_{ij},\boldsymbol{B}\equiv b_{i})$
and SGS energy
 $e$
. Numerous recipes are available for parameterizing these fluxes, and we use the standard eddy viscosity prescriptions
$e$
. Numerous recipes are available for parameterizing these fluxes, and we use the standard eddy viscosity prescriptions
 $\unicode[STIX]{x1D70F}_{ij}=-\unicode[STIX]{x1D708}_{t}(\unicode[STIX]{x2202}u_{i}/\unicode[STIX]{x2202}x_{j}+\unicode[STIX]{x2202}u_{j}/\unicode[STIX]{x2202}x_{i})$
and
$\unicode[STIX]{x1D70F}_{ij}=-\unicode[STIX]{x1D708}_{t}(\unicode[STIX]{x2202}u_{i}/\unicode[STIX]{x2202}x_{j}+\unicode[STIX]{x2202}u_{j}/\unicode[STIX]{x2202}x_{i})$
and
 $b_{i}=-\unicode[STIX]{x1D708}_{h}\unicode[STIX]{x2202}b/\unicode[STIX]{x2202}x_{i}$
described by Moeng (Reference Moeng1984) and Sullivan, McWilliams & Moeng (Reference Sullivan, McWilliams and Moeng1996). The turbulence eddy viscosities
$b_{i}=-\unicode[STIX]{x1D708}_{h}\unicode[STIX]{x2202}b/\unicode[STIX]{x2202}x_{i}$
described by Moeng (Reference Moeng1984) and Sullivan, McWilliams & Moeng (Reference Sullivan, McWilliams and Moeng1996). The turbulence eddy viscosities
 $(\unicode[STIX]{x1D708}_{t},\unicode[STIX]{x1D708}_{h})$
are parameterized in terms of
$(\unicode[STIX]{x1D708}_{t},\unicode[STIX]{x1D708}_{h})$
are parameterized in terms of
 $e$
,
$e$
,
 $(\unicode[STIX]{x1D708}_{t},\unicode[STIX]{x1D708}_{h})\sim \sqrt{e}\ell$
where the length scale
$(\unicode[STIX]{x1D708}_{t},\unicode[STIX]{x1D708}_{h})\sim \sqrt{e}\ell$
where the length scale
 $\ell$
is proportional to the grid mesh spacing
$\ell$
is proportional to the grid mesh spacing
 $\unicode[STIX]{x1D6E5}$
, but is reduced for strong stratification. To account for non-equilibrium effects at small scales we also solve an additional prognostic equation for
$\unicode[STIX]{x1D6E5}$
, but is reduced for strong stratification. To account for non-equilibrium effects at small scales we also solve an additional prognostic equation for
 $e$
; this SGS energy equation includes a standard suite of terms – production, buoyancy, diffusion and dissipation (Moeng Reference Moeng1984) – and it also includes advection by Stokes drift and Stokes production (McWilliams et al.
Reference McWilliams, Sullivan and Moeng1997; Sullivan et al.
Reference Sullivan, McWilliams and Melville2007).
$e$
; this SGS energy equation includes a standard suite of terms – production, buoyancy, diffusion and dissipation (Moeng Reference Moeng1984) – and it also includes advection by Stokes drift and Stokes production (McWilliams et al.
Reference McWilliams, Sullivan and Moeng1997; Sullivan et al.
Reference Sullivan, McWilliams and Melville2007).
Periodic boundary conditions are used in horizontal
 $x{-}y$
planes for all variables. At the top of the water
$x{-}y$
planes for all variables. At the top of the water
 $(z=0)$
the fluid is driven by an imposed wind stress or surface cooling (see § 3.1) with
$(z=0)$
the fluid is driven by an imposed wind stress or surface cooling (see § 3.1) with
 $w=0$
. At the lower boundary
$w=0$
. At the lower boundary
 $(z=H)$
, we impose a sponge layer to suppress reflections from the bottom boundary. A damping term of the form
$(z=H)$
, we impose a sponge layer to suppress reflections from the bottom boundary. A damping term of the form
 $\unicode[STIX]{x1D70E}_{d}(z)(\langle \unicode[STIX]{x1D712}\rangle -\unicode[STIX]{x1D712})$
is added to the right-hand side of each transport equation where
$\unicode[STIX]{x1D70E}_{d}(z)(\langle \unicode[STIX]{x1D712}\rangle -\unicode[STIX]{x1D712})$
is added to the right-hand side of each transport equation where
 $\langle \unicode[STIX]{x1D712}\rangle$
denotes an average over a horizontal
$\langle \unicode[STIX]{x1D712}\rangle$
denotes an average over a horizontal
 $x{-}y$
plane:
$x{-}y$
plane:
 $\unicode[STIX]{x1D712}=(\boldsymbol{u},b)$
as appropriate. The inverse time scale
$\unicode[STIX]{x1D712}=(\boldsymbol{u},b)$
as appropriate. The inverse time scale
 $\unicode[STIX]{x1D70E}_{d}$
decays to zero quadratically from its maximum value at the lower boundary over a distance of
$\unicode[STIX]{x1D70E}_{d}$
decays to zero quadratically from its maximum value at the lower boundary over a distance of
 $0.2H$
. The maximum value
$0.2H$
. The maximum value
 $\unicode[STIX]{x1D70E}_{d}(z=H)=cN_{o}/2\unicode[STIX]{x03C0}$
where
$\unicode[STIX]{x1D70E}_{d}(z=H)=cN_{o}/2\unicode[STIX]{x03C0}$
where
 $N_{o}^{2}=-(g/\unicode[STIX]{x1D70C}_{o})\text{d}\unicode[STIX]{x1D70C}/\text{d}z$
is the squared buoyancy frequency of the background stratification well below the thermocline. For the design conditions of the LES with stratification
$N_{o}^{2}=-(g/\unicode[STIX]{x1D70C}_{o})\text{d}\unicode[STIX]{x1D70C}/\text{d}z$
is the squared buoyancy frequency of the background stratification well below the thermocline. For the design conditions of the LES with stratification
 $N_{o}=5.86~\text{s}^{-3}$
(see appendix A) we set the empirical constant
$N_{o}=5.86~\text{s}^{-3}$
(see appendix A) we set the empirical constant
 $c=0.22$
and the time scale
$c=0.22$
and the time scale
 $T_{d}=1/\unicode[STIX]{x1D70E}_{d}\sim 81~\text{min}$
. Flow visualization and statistics show that this damping term has the desired feature of smothering the fluctuations to near zero in the damping layer near the bottom boundary.
$T_{d}=1/\unicode[STIX]{x1D70E}_{d}\sim 81~\text{min}$
. Flow visualization and statistics show that this damping term has the desired feature of smothering the fluctuations to near zero in the damping layer near the bottom boundary.
Our algorithms for integrating the LES equations (2.1) are well tested. The equations are advanced in time using an explicit fractional step method that enforces incompressibility at every stage of the third-order Runge–Kutta (RK3) scheme. Dynamic time stepping with a fixed Courant–Fredrichs–Lewy number is employed, which naturally adapts to a wide range of dynamical processes. The spatial discretization is second-order finite differences in the vertical direction and pseudospectral in the horizontal planes. For the present application, the advective terms in the momentum equations are written in rotational form, while a flux conserving form is used for the advective terms in the scalar (temperature) equation. The flow variables are explicitly filtered at each time step, i.e. dealiased, using the ‘
 $2/3$
’ rule (Moeng & Wyngaard Reference Moeng and Wyngaard1988). Further algorithmic details are given by Moeng (Reference Moeng1984), Sullivan, McWilliams & Moeng (Reference Sullivan, McWilliams and Moeng1994), Sullivan et al. (Reference Sullivan, McWilliams and Moeng1996), McWilliams, Moeng & Sullivan (Reference McWilliams, Moeng, Sullivan and Geernaert1999), Sullivan & Patton (Reference Sullivan and Patton2011), Moeng & Sullivan (Reference Moeng, Sullivan, North, Zhang and Pyle2015) and the references cited therein.
$2/3$
’ rule (Moeng & Wyngaard Reference Moeng and Wyngaard1988). Further algorithmic details are given by Moeng (Reference Moeng1984), Sullivan, McWilliams & Moeng (Reference Sullivan, McWilliams and Moeng1994), Sullivan et al. (Reference Sullivan, McWilliams and Moeng1996), McWilliams, Moeng & Sullivan (Reference McWilliams, Moeng, Sullivan and Geernaert1999), Sullivan & Patton (Reference Sullivan and Patton2011), Moeng & Sullivan (Reference Moeng, Sullivan, North, Zhang and Pyle2015) and the references cited therein.
3 Experiments
3.1 Cases
The LES experiments are not crafted as a case study of a specific submesoscale regime, but rather as an idealization designed to expose the generic dynamics of cold filament frontogenesis and arrest. In nature, filaments are spatially anisotropic structures with length-to-width ratios
 $\gg 10$
, especially during the sharpening phase of frontogenesis. At the same time, filaments are active in the OBL where the energy containing scales of turbulence
$\gg 10$
, especially during the sharpening phase of frontogenesis. At the same time, filaments are active in the OBL where the energy containing scales of turbulence
 $\ell$
are of the order of the boundary-layer depth
$\ell$
are of the order of the boundary-layer depth
 $h$
and less
$h$
and less
 $1<\ell <100~\text{m}$
. The wide scale separation between turbulence and fronts, 1 m–10 km, poses a severe computational challenge as the LES horizontal domain and resolution need to be simultaneously large enough and fine enough to resolve crucial scale interactions. The computational box needs to be sufficiently wide so that the geostrophic currents generated by the density filament are realistic in scale and magnitude with the resulting low wavenumber turbulent motions unconstrained by the periodic boundary conditions. At high wavenumbers the resolution needs to be fine enough so that most of the OBL turbulence is resolved with only a small fraction of the flux carried by the SGS model near the water surface.
$1<\ell <100~\text{m}$
. The wide scale separation between turbulence and fronts, 1 m–10 km, poses a severe computational challenge as the LES horizontal domain and resolution need to be simultaneously large enough and fine enough to resolve crucial scale interactions. The computational box needs to be sufficiently wide so that the geostrophic currents generated by the density filament are realistic in scale and magnitude with the resulting low wavenumber turbulent motions unconstrained by the periodic boundary conditions. At high wavenumbers the resolution needs to be fine enough so that most of the OBL turbulence is resolved with only a small fraction of the flux carried by the SGS model near the water surface.
Thus, given the goals of the simulations and the large aspect ratio of typical filaments we adopt a 2-D
 $(x{-}z)$
model of a filament for our LES modelling. The choice of domain size is initially guided by the results in McWilliams et al. (Reference McWilliams, Gula, Molemaker, Renault and Shchepetkin2015) and finally by extensive flow visualization and analysis of LES solutions in boxes of varying horizontal dimensions
$(x{-}z)$
model of a filament for our LES modelling. The choice of domain size is initially guided by the results in McWilliams et al. (Reference McWilliams, Gula, Molemaker, Renault and Shchepetkin2015) and finally by extensive flow visualization and analysis of LES solutions in boxes of varying horizontal dimensions
 $(L_{x},L_{y})$
. The down-front domain width
$(L_{x},L_{y})$
. The down-front domain width
 $L_{y}$
proves to be an important choice as we find
$L_{y}$
proves to be an important choice as we find
 $L_{y}$
needs to be large enough to support surprising large-scale anisotropic turbulence (see § 5 and the linear stability analysis of McWilliams, Molemaker & Olafsdottir (Reference McWilliams, Molemaker and Olafsdottir2009b
)). Our explorations, although not exhaustive, lead us to pick the domain
$L_{y}$
needs to be large enough to support surprising large-scale anisotropic turbulence (see § 5 and the linear stability analysis of McWilliams, Molemaker & Olafsdottir (Reference McWilliams, Molemaker and Olafsdottir2009b
)). Our explorations, although not exhaustive, lead us to pick the domain
 $(L_{x},L_{y},H)=(12,4.5,-0.25)~\text{km}$
with discretization
$(L_{x},L_{y},H)=(12,4.5,-0.25)~\text{km}$
with discretization
 $(N_{x},N_{y},N_{z})=(8192,3072,256)\sim 6.5\times 10^{9}$
grid points. This corresponds to a uniform horizontal spacing
$(N_{x},N_{y},N_{z})=(8192,3072,256)\sim 6.5\times 10^{9}$
grid points. This corresponds to a uniform horizontal spacing
 $\unicode[STIX]{x0394}x=\unicode[STIX]{x0394}y=1.46~\text{m}$
. The vertical grid is smoothly stretched with finer resolution near the water surface
$\unicode[STIX]{x0394}x=\unicode[STIX]{x0394}y=1.46~\text{m}$
. The vertical grid is smoothly stretched with finer resolution near the water surface
 $\unicode[STIX]{x0394}z=[0.5-1.68]~\text{m}$
; the vertical spacing between neighbouring cells is increased by a constant stretching factor
$\unicode[STIX]{x0394}z=[0.5-1.68]~\text{m}$
; the vertical spacing between neighbouring cells is increased by a constant stretching factor
 $K=\unicode[STIX]{x0394}z_{k+1}/\unicode[STIX]{x0394}z_{k}=1.0048$
, for
$K=\unicode[STIX]{x0394}z_{k+1}/\unicode[STIX]{x0394}z_{k}=1.0048$
, for
 $k=1,N_{z}$
. Given the filament alignment in the computational box, the coordinates
$k=1,N_{z}$
. Given the filament alignment in the computational box, the coordinates
 $(x,y,z)$
are also referred to as (cross-front, down-front, vertical) directions.
$(x,y,z)$
are also referred to as (cross-front, down-front, vertical) directions.
The expectation is that CFF will depend on the wind magnitude and direction based on the LES results for warm fronts described by Hamlington et al. (Reference Hamlington, Van Roekel, Fox-Kemper, Julien and Chini2014) and Suzuki et al. (Reference Suzuki, Fox-Kemper, Hamlington and Roekel2016). In the present work with cold filaments, the external forcing of the OBL is by surface winds or by surface cooling. Wind stress is applied in either the west-to-east or south-to-north directions with a water side friction velocity
 $u_{\ast }=0.01~\text{m}~\text{s}^{-1}$
with zero surface cooling
$u_{\ast }=0.01~\text{m}~\text{s}^{-1}$
with zero surface cooling
 $Q_{\ast }$
. This corresponds to surface winds of
$Q_{\ast }$
. This corresponds to surface winds of
 $U=8.5~\text{m}~\text{s}^{-1}$
with a drag coefficient
$U=8.5~\text{m}~\text{s}^{-1}$
with a drag coefficient
 $C_{d}\sim 1.2\times 10^{-3}$
based on the relationship given by Large & Pond (Reference Large and Pond1981). To examine the robustness of our findings, we consider a third simulation with
$C_{d}\sim 1.2\times 10^{-3}$
based on the relationship given by Large & Pond (Reference Large and Pond1981). To examine the robustness of our findings, we consider a third simulation with
 $u_{\ast }=0$
and a finite surface cooling of
$u_{\ast }=0$
and a finite surface cooling of
 $100~\text{W}~\text{m}^{-2}$
, which equates to a kinematic surface flux
$100~\text{W}~\text{m}^{-2}$
, which equates to a kinematic surface flux
 $Q_{\ast }=2.38\times 10^{-5}~\text{K}~\text{m}^{-1}~\text{s}^{-1}$
. Later, turbulence quantities are normalized by
$Q_{\ast }=2.38\times 10^{-5}~\text{K}~\text{m}^{-1}~\text{s}^{-1}$
. Later, turbulence quantities are normalized by
 $(u_{\ast },w_{\ast })$
in the non-zero (wind, cooling) cases, respectively. The Deardorff (Reference Deardorff1972a
) convective velocity scale is
$(u_{\ast },w_{\ast })$
in the non-zero (wind, cooling) cases, respectively. The Deardorff (Reference Deardorff1972a
) convective velocity scale is
 $w_{\ast }=(\unicode[STIX]{x1D6FD}|h_{i}|Q_{\ast })^{1/3}$
, where
$w_{\ast }=(\unicode[STIX]{x1D6FD}|h_{i}|Q_{\ast })^{1/3}$
, where
 $h_{i}=-66.5~\text{m}$
is the initial OBL depth before the submesoscale filament is introduced (§ 3.3). The velocity scales of the external forcing are used to normalize the velocities since the properties of the imposed filament are identical across the simulations. In all simulations the Coriolis parameter
$h_{i}=-66.5~\text{m}$
is the initial OBL depth before the submesoscale filament is introduced (§ 3.3). The velocity scales of the external forcing are used to normalize the velocities since the properties of the imposed filament are identical across the simulations. In all simulations the Coriolis parameter
 $f=7.81\times 10^{-5}~\text{s}^{-1}$
. To streamline the discussion the following acronyms are introduced:
$f=7.81\times 10^{-5}~\text{s}^{-1}$
. To streamline the discussion the following acronyms are introduced:
 $E$
denotes the simulation with west-to-east (or cross-front) winds,
$E$
denotes the simulation with west-to-east (or cross-front) winds,
 $N$
denotes the simulation with south-to-north (or down-front) winds and
$N$
denotes the simulation with south-to-north (or down-front) winds and
 $C$
denotes the simulation driven by surface cooling. Table 1 provides a summary of the simulations and selected bulk statistics.
$C$
denotes the simulation driven by surface cooling. Table 1 provides a summary of the simulations and selected bulk statistics.
Table 1. Simulations and bulk properties. In the table,
 $(t_{m},x_{p}/L,\text{TKE})$
are the (time stamp, cross-front location, TKE) where
$(t_{m},x_{p}/L,\text{TKE})$
are the (time stamp, cross-front location, TKE) where
 $\langle \unicode[STIX]{x1D701}\rangle _{p}$
reaches its maximum value. Turbulent kinetic energy (TKE) for
$\langle \unicode[STIX]{x1D701}\rangle _{p}$
reaches its maximum value. Turbulent kinetic energy (TKE) for
 $(E,N,C)$
is normalized by
$(E,N,C)$
is normalized by
 $(u_{\ast }^{2},u_{\ast }^{2},w_{\ast }^{2})$
, respectively.
$(u_{\ast }^{2},u_{\ast }^{2},w_{\ast }^{2})$
, respectively.

Among the possible instabilities for submesoscale fronts and filaments is the so-called mixed layer instability (MLI; Boccaletti et al.
Reference Boccaletti, Ferrari and Fox-Kemper2007; Fox-Kemper et al.
Reference Fox-Kemper, Ferrari and Hallberg2008). MLI is a variant of Eady’s classical baroclinic instability problem with uniform mean stratification
 $N_{ML}$
and mean vertical shear
$N_{ML}$
and mean vertical shear
 $\text{d}V/\text{d}z$
, and its most unstable eigenmodes have a horizontal scale near the mixed layer deformation radius,
$\text{d}V/\text{d}z$
, and its most unstable eigenmodes have a horizontal scale near the mixed layer deformation radius,
 $R_{ML}=N_{ML}H_{ML}/f$
. In interpreting its relevance to a continuously stratified fluid with vertical profile
$R_{ML}=N_{ML}H_{ML}/f$
. In interpreting its relevance to a continuously stratified fluid with vertical profile
 $N(z)$
, the estimation of
$N(z)$
, the estimation of
 $N_{ML}$
is somewhat ambiguous. In our far-field initial conditions at
$N_{ML}$
is somewhat ambiguous. In our far-field initial conditions at
 $t=2~\text{h}$
(§ 5.1),
$t=2~\text{h}$
(§ 5.1),
 $H_{ML}=66~\text{m}$
, and the
$H_{ML}=66~\text{m}$
, and the
 $N$
values in the middle of the mixed layer or at the bottom in the upper pycnocline are less than 0.3 or
$N$
values in the middle of the mixed layer or at the bottom in the upper pycnocline are less than 0.3 or
 $7\times 10^{-3}~\text{s}^{-1}$
, respectively; the corresponding
$7\times 10^{-3}~\text{s}^{-1}$
, respectively; the corresponding
 $R_{ML}$
estimates are less than 0.2 or 6 km, respectively. Also the fastest growing MLI time scale using equation (3) of Fox-Kemper et al. (Reference Fox-Kemper, Ferrari and Hallberg2008) gives an e-folding scale of 14.6 h which is long compared to the 15 h of simulation considered here. Thus, the posing of our problems here with
$R_{ML}$
estimates are less than 0.2 or 6 km, respectively. Also the fastest growing MLI time scale using equation (3) of Fox-Kemper et al. (Reference Fox-Kemper, Ferrari and Hallberg2008) gives an e-folding scale of 14.6 h which is long compared to the 15 h of simulation considered here. Thus, the posing of our problems here with
 $(L_{x},L_{y})=(12,4.5)~\text{km}$
is at least marginally large enough to resolve an active MLI mode if one were to arise in the more complicated filament flow field and active boundary-layer turbulent mixing in our simulations; yet we see no evidence of MLI in our solutions with its signature of
$(L_{x},L_{y})=(12,4.5)~\text{km}$
is at least marginally large enough to resolve an active MLI mode if one were to arise in the more complicated filament flow field and active boundary-layer turbulent mixing in our simulations; yet we see no evidence of MLI in our solutions with its signature of
 $\langle w^{\prime }b^{\prime }\rangle >0$
, see §§ 5.3 and 5.4.
$\langle w^{\prime }b^{\prime }\rangle >0$
, see §§ 5.3 and 5.4.
3.2 Thermal wind
The structure of the mean buoyancy field and the resulting geostrophic pressure gradients (thermal wind) used in the LES follow the design outlined by McWilliams et al. (Reference McWilliams, Gula, Molemaker, Renault and Shchepetkin2015). Given a 2-D buoyancy field
 $b(x,z)$
, the interior companion mean geostrophic shear profile is (e.g. Gill Reference Gill1982)
$b(x,z)$
, the interior companion mean geostrophic shear profile is (e.g. Gill Reference Gill1982)
 $$\begin{eqnarray}\boldsymbol{s}_{g}(x,z)=\frac{1}{f}\hat{\boldsymbol{z}}\times \unicode[STIX]{x1D735}_{\bot }b,\end{eqnarray}$$
where the subscript
 $\bot$
denotes a horizontal vector in the
$\bot$
denotes a horizontal vector in the
 $(x,y)$
plane. Then the geostrophic current
$(x,y)$
plane. Then the geostrophic current
 $\boldsymbol{u}_{g}=(0,v_{g})$
is
$\boldsymbol{u}_{g}=(0,v_{g})$
is
 $$\begin{eqnarray}\boldsymbol{u}_{g}(x,z)=\int _{H}^{z}\boldsymbol{s}_{g}\,\text{d}z^{\prime }\end{eqnarray}$$
taking the current deep in the water
 $\boldsymbol{u}_{g}(z=H)=0$
.
$\boldsymbol{u}_{g}(z=H)=0$
.
In our prescription of the buoyancy, its cross-front variation at the water surface
 $z=0$
is the smooth function
$z=0$
is the smooth function
 $b_{s}(x)=b_{o}-\unicode[STIX]{x1D6FF}b_{o}\exp [-(x/L)^{2}]$
, where
$b_{s}(x)=b_{o}-\unicode[STIX]{x1D6FF}b_{o}\exp [-(x/L)^{2}]$
, where
 $b_{o}$
is a constant background value,
$b_{o}$
is a constant background value,
 $\unicode[STIX]{x1D6FF}b_{o}$
is the buoyancy jump,
$\unicode[STIX]{x1D6FF}b_{o}$
is the buoyancy jump,
 $L$
is the front scale and
$L$
is the front scale and
 $x=0$
is the location of the front centreline. Given the cross-front length
$x=0$
is the location of the front centreline. Given the cross-front length
 $L_{x}=12~\text{km}$
of our computational box, we choose
$L_{x}=12~\text{km}$
of our computational box, we choose
 $(\unicode[STIX]{x1D6FF}b_{o},L)=$
(
$(\unicode[STIX]{x1D6FF}b_{o},L)=$
(
 $0.785\times 10^{-3}~\text{m}~\text{s}^{-2}$
, 2 km) as a compromise between realism and computational cost. These values result in a temperature jump of 0.48 K across a symmetric front of width
$0.785\times 10^{-3}~\text{m}~\text{s}^{-2}$
, 2 km) as a compromise between realism and computational cost. These values result in a temperature jump of 0.48 K across a symmetric front of width
 $2L=4~\text{km}$
with maximum and minimum geostrophic currents
$2L=4~\text{km}$
with maximum and minimum geostrophic currents
 $\pm 0.25~\text{m}~\text{s}^{-1}$
. Further details of the buoyancy field specification in the OBL interior are given in the appendix A.
$\pm 0.25~\text{m}~\text{s}^{-1}$
. Further details of the buoyancy field specification in the OBL interior are given in the appendix A.
3.3 Turbulent filament initialization
A multi-step recipe is used to initialize the filament simulations. First, simulations are started with the frontal parameters set to zero with turbulence triggered by small random perturbations to the buoyancy and current fields. Essentially, these pre-front LES are simulations of a spatially homogeneous OBL in a very large horizontal domain with wind stress or cooling either on or off from the outset depending on the desired attributes of the final frontal simulation. The simulations are integrated for more than 30 physical hours, in terms of a non-dimensional time
 $T=tu_{\ast }/|h|>20$
, which leads to well-developed turbulence. Statistics from the pre-front simulations are in good agreement with previous results, e.g. McWilliams et al. (Reference McWilliams, Sullivan and Moeng1997), Sullivan et al. (Reference Sullivan, Romero, McWilliams and Melville2012). Vertical profiles of the average horizontal currents
$T=tu_{\ast }/|h|>20$
, which leads to well-developed turbulence. Statistics from the pre-front simulations are in good agreement with previous results, e.g. McWilliams et al. (Reference McWilliams, Sullivan and Moeng1997), Sullivan et al. (Reference Sullivan, Romero, McWilliams and Melville2012). Vertical profiles of the average horizontal currents
 $(\overline{u},\overline{v})$
are shown in figure 1. Here the averaging is over horizontal planes and over the time interval
$(\overline{u},\overline{v})$
are shown in figure 1. Here the averaging is over horizontal planes and over the time interval
 $25<t<30~\text{h}$
; this averaging differs from that used in the presence of a filament (§ 4).
$25<t<30~\text{h}$
; this averaging differs from that used in the presence of a filament (§ 4).

Figure 1. Average currents from the homogeneous (pre-front) runs used to initialize the simulations with cold filaments.
 $(\overline{u},\overline{v})/u_{\ast }$
are indicated by (red, black) colours. The (solid lines, open circles) are current profiles obtained for
$(\overline{u},\overline{v})/u_{\ast }$
are indicated by (red, black) colours. The (solid lines, open circles) are current profiles obtained for
 $(E,N)$
winds, respectively. The mixed layer depth
$(E,N)$
winds, respectively. The mixed layer depth
 $h_{i}=-66.5~\text{m}$
. Because of the rotational symmetry of the horizontally homogeneous problem,
$h_{i}=-66.5~\text{m}$
. Because of the rotational symmetry of the horizontally homogeneous problem,
 $(\overline{u},\overline{v})$
from
$(\overline{u},\overline{v})$
from
 $E$
equals
$E$
equals
 $(\overline{v},-\overline{u})$
from
$(\overline{v},-\overline{u})$
from
 $N$
. These profiles are obtained by averaging over complete horizontal
$N$
. These profiles are obtained by averaging over complete horizontal
 $x{-}y$
planes and by averaging over five hours. For clarity the open circles are shown at every second grid level for case
$x{-}y$
planes and by averaging over five hours. For clarity the open circles are shown at every second grid level for case
 $N$
. The horizontal currents for the cooling simulation
$N$
. The horizontal currents for the cooling simulation
 $C$
are zero (not shown).
$C$
are zero (not shown).
Next, the last volume from the pre-front simulations serves as the restart volume for the frontal calculations with the following modifications. First, the mean buoyancy field in the restart volume is replaced with the three-layer horizontal and mean vertical frontal structure
 $b(x,z)$
given by (A 1). A three-dimensional buoyancy field is then generated by adding the turbulent buoyancy fluctuations from the restart volume to
$b(x,z)$
given by (A 1). A three-dimensional buoyancy field is then generated by adding the turbulent buoyancy fluctuations from the restart volume to
 $b(x,z)$
. This modified restart volume contains realistic turbulent fields plus the desired mean buoyancy field, however, it is lacking secondary circulations and in particular the central downwelling current, which is a key feature initiating frontogenesis. To stimulate secondary circulations, the simulations are next integrated forward in time holding the frontal buoyancy field fixed until a downwelling jet develops, this avoids slumping of the buoyancy field. We monitor the motions near the thermocline and find a vigorous downwelling jet and secondary circulations develop after approximately 1.8 h. Finally, at this point in the initialization all fields are allowed to evolve freely in time. The subsequent analysis references this special time as
$b(x,z)$
. This modified restart volume contains realistic turbulent fields plus the desired mean buoyancy field, however, it is lacking secondary circulations and in particular the central downwelling current, which is a key feature initiating frontogenesis. To stimulate secondary circulations, the simulations are next integrated forward in time holding the frontal buoyancy field fixed until a downwelling jet develops, this avoids slumping of the buoyancy field. We monitor the motions near the thermocline and find a vigorous downwelling jet and secondary circulations develop after approximately 1.8 h. Finally, at this point in the initialization all fields are allowed to evolve freely in time. The subsequent analysis references this special time as
 $t=0~\text{h}$
. Thus the initial conditions for our frontal calculations are more complete than the thermal wind (geostrophic) balance used by Skyllingstad & Samelson (Reference Skyllingstad and Samelson2012) and Hamlington et al. (Reference Hamlington, Van Roekel, Fox-Kemper, Julien and Chini2014) who superimpose frontal structures on top of an initially laminar flow. In the mixed layer, the initial state of our LES is an unsteady analogue to the TTW balance described by McWilliams et al. (Reference McWilliams, Gula, Molemaker, Renault and Shchepetkin2015) as the fields contain fully developed resolved turbulence and secondary circulations (e.g. figure 3 and the discussion in § 5.1). The simulations are integrated for more than 20 h past the start time
$t=0~\text{h}$
. Thus the initial conditions for our frontal calculations are more complete than the thermal wind (geostrophic) balance used by Skyllingstad & Samelson (Reference Skyllingstad and Samelson2012) and Hamlington et al. (Reference Hamlington, Van Roekel, Fox-Kemper, Julien and Chini2014) who superimpose frontal structures on top of an initially laminar flow. In the mixed layer, the initial state of our LES is an unsteady analogue to the TTW balance described by McWilliams et al. (Reference McWilliams, Gula, Molemaker, Renault and Shchepetkin2015) as the fields contain fully developed resolved turbulence and secondary circulations (e.g. figure 3 and the discussion in § 5.1). The simulations are integrated for more than 20 h past the start time
 $t=0$
.
$t=0$
.
In terms of the turbulent velocity scales
 $(u_{\ast },w_{\ast })$
based on the surface wind and buoyancy forcing that we use for normalizing the simulation results (as conventional in boundary-layer turbulence), the initial geostrophic velocity maximum is 15–20 times larger.
$(u_{\ast },w_{\ast })$
based on the surface wind and buoyancy forcing that we use for normalizing the simulation results (as conventional in boundary-layer turbulence), the initial geostrophic velocity maximum is 15–20 times larger.
4 Flow decomposition
The spatial inhomogeneity and temporal evolution of a two-dimensional density front add complexity to the analysis of the submesoscale circulations and turbulence in the OBL: the filaments are both temporally transient and inhomogeneous in
 $x{-}z$
directions. Thus, we choose the down-front domain
$x{-}z$
directions. Thus, we choose the down-front domain
 $L_{y}\gg |h|$
to capture large scales of motion and ensure flow homogeneity in the down-front direction. This has the added benefit of reducing random errors in computation of statistics. To diagnose mean and turbulence fields in our statistics and flow visualization we project the flow fields onto an
$L_{y}\gg |h|$
to capture large scales of motion and ensure flow homogeneity in the down-front direction. This has the added benefit of reducing random errors in computation of statistics. To diagnose mean and turbulence fields in our statistics and flow visualization we project the flow fields onto an
 $x{-}z$
plane by spatial averaging in the down-front direction; Skyllingstad & Samelson (Reference Skyllingstad and Samelson2012) also use this type of averaging. Hereafter this projection is referred to as a the ‘down-front average’ or ‘
$x{-}z$
plane by spatial averaging in the down-front direction; Skyllingstad & Samelson (Reference Skyllingstad and Samelson2012) also use this type of averaging. Hereafter this projection is referred to as a the ‘down-front average’ or ‘
 $y$
’ average and is indicated by
$y$
’ average and is indicated by
 $\langle \cdot \rangle$
. Note down-front averaging is a clean technique for simply separating the fields into mean and turbulence components without adding assumptions about scale separation. It does not explicitly separate submesoscale turbulence from boundary-layer turbulence, and the projection does not track possible down-front meandering of the front. However, we find the front meandering is relatively modest for large
$\langle \cdot \rangle$
. Note down-front averaging is a clean technique for simply separating the fields into mean and turbulence components without adding assumptions about scale separation. It does not explicitly separate submesoscale turbulence from boundary-layer turbulence, and the projection does not track possible down-front meandering of the front. However, we find the front meandering is relatively modest for large
 $L_{y}$
. The LES code is specially instrumented to compute down-front average statistics (defined below) on the fly with
$L_{y}$
. The LES code is specially instrumented to compute down-front average statistics (defined below) on the fly with
 $x{-}z$
planes of statistics archived at much finer time resolution compared to the archiving of complete 3-D volumes.
$x{-}z$
planes of statistics archived at much finer time resolution compared to the archiving of complete 3-D volumes.
The down-front projection of the velocity and buoyancy fields onto an
 $x{-}z$
plane naturally leads to the flow field decompositions
$x{-}z$
plane naturally leads to the flow field decompositions
 $$\begin{eqnarray}\boldsymbol{u}(\boldsymbol{x},t)=\langle \boldsymbol{u}\rangle (x,z,t)+\boldsymbol{u}^{\prime }(\boldsymbol{x},t),\quad b(\boldsymbol{x},t)=\langle b\rangle (x,z,t)+b^{\prime }(\boldsymbol{x},t),\end{eqnarray}$$
where means and fluctuations are denoted by
 $\langle \cdot \rangle$
and
$\langle \cdot \rangle$
and
 $(\cdot )^{\prime }$
, respectively. Also
$(\cdot )^{\prime }$
, respectively. Also
 $\langle \boldsymbol{u}\rangle$
, similarly for
$\langle \boldsymbol{u}\rangle$
, similarly for
 $\langle b\rangle$
, can be further decomposed into a background value that varies only with
$\langle b\rangle$
, can be further decomposed into a background value that varies only with
 $z$
and a SC that varies with
$z$
and a SC that varies with
 $(x,z)$
. Application of
$(x,z)$
. Application of
 $y$
averaging to products of flow variables, of course, leads to products of average fields and, most importantly, non-zero average co-variances between the instantaneous turbulence fields, e.g.
$y$
averaging to products of flow variables, of course, leads to products of average fields and, most importantly, non-zero average co-variances between the instantaneous turbulence fields, e.g.
 $$\begin{eqnarray}\langle uv\rangle =\langle u\rangle \langle v\rangle +\langle u^{\prime }v^{\prime }\rangle ,\quad \langle ub\rangle =\langle u\rangle \langle b\rangle +\langle u^{\prime }b^{\prime }\rangle ,\end{eqnarray}$$
where
 $\langle \langle f\rangle \langle g\rangle \rangle \equiv \langle f\rangle \langle g\rangle$
for arbitrary
$\langle \langle f\rangle \langle g\rangle \rangle \equiv \langle f\rangle \langle g\rangle$
for arbitrary
 $(f,g)$
. The correlations between mean fields are
$(f,g)$
. The correlations between mean fields are
 $\langle f\rangle \langle g\rangle \neq 0$
. A main motivation for decomposing the flow fields into means and turbulent fluctuations is to identify the crucial velocity–velocity and velocity–buoyancy correlations that couple the turbulence, from a statistical perspective, to the equations for the average circulations. Furthermore, the information contained in the average equations provides a guide as to which turbulence fields, and thus which turbulence dynamics, lead to frontal onset, arrest and decay. The flow decomposition employed here is essentially the technique of ‘phase averaging’ first proposed by Hussain & Reynolds (Reference Hussain and Reynolds1970) for the analysis of turbulent shear flows containing an organized wavy perturbation.
$\langle f\rangle \langle g\rangle \neq 0$
. A main motivation for decomposing the flow fields into means and turbulent fluctuations is to identify the crucial velocity–velocity and velocity–buoyancy correlations that couple the turbulence, from a statistical perspective, to the equations for the average circulations. Furthermore, the information contained in the average equations provides a guide as to which turbulence fields, and thus which turbulence dynamics, lead to frontal onset, arrest and decay. The flow decomposition employed here is essentially the technique of ‘phase averaging’ first proposed by Hussain & Reynolds (Reference Hussain and Reynolds1970) for the analysis of turbulent shear flows containing an organized wavy perturbation.
4.1 Down-front average equations
Applying
 $y$
averaging to the momentum and buoyancy equations (2.1a
) and (2.1b
), decomposing the flow fields according to the prescription (4.1), and invoking the averaging rule given by (4.2) leads to the equation set:
$y$
averaging to the momentum and buoyancy equations (2.1a
) and (2.1b
), decomposing the flow fields according to the prescription (4.1), and invoking the averaging rule given by (4.2) leads to the equation set:
 $$\begin{eqnarray}\displaystyle \frac{\unicode[STIX]{x2202}}{\unicode[STIX]{x2202}t}\langle u\rangle & = & \displaystyle -\frac{\unicode[STIX]{x2202}}{\unicode[STIX]{x2202}x}(\langle u\rangle \langle u\rangle +\langle u^{\prime }u^{\prime }\rangle +\frac{\langle p\rangle }{\unicode[STIX]{x1D70C}_{o}}+\frac{2\langle e\rangle }{3}+\langle \unicode[STIX]{x1D70F}_{11}\rangle )\nonumber\\ \displaystyle & & \displaystyle -\,\frac{\unicode[STIX]{x2202}}{\unicode[STIX]{x2202}z}(\langle u\rangle \langle w\rangle +\langle u^{\prime }w^{\prime }\rangle +\langle \unicode[STIX]{x1D70F}_{13}\rangle )+f\langle v\rangle ,\end{eqnarray}$$
 $$\begin{eqnarray}\displaystyle \frac{\unicode[STIX]{x2202}}{\unicode[STIX]{x2202}t}\langle v\rangle & = & \displaystyle -\frac{\unicode[STIX]{x2202}}{\unicode[STIX]{x2202}x}(\langle u\rangle \langle v\rangle +\langle u^{\prime }v^{\prime }\rangle +\langle \unicode[STIX]{x1D70F}_{12}\rangle )\nonumber\\ \displaystyle & & \displaystyle -\,\frac{\unicode[STIX]{x2202}}{\unicode[STIX]{x2202}z}(\langle v\rangle \langle w\rangle +\langle v^{\prime }w^{\prime }\rangle +\langle \unicode[STIX]{x1D70F}_{23}\rangle )-f\langle u\rangle ,\end{eqnarray}$$
 $$\begin{eqnarray}\displaystyle \frac{\unicode[STIX]{x2202}}{\unicode[STIX]{x2202}t}\langle w\rangle & = & \displaystyle -\frac{\unicode[STIX]{x2202}}{\unicode[STIX]{x2202}x}(\langle u\rangle \langle w\rangle +\langle u^{\prime }w^{\prime }\rangle +\langle \unicode[STIX]{x1D70F}_{13}\rangle )\nonumber\\ \displaystyle & & \displaystyle -\,\frac{\unicode[STIX]{x2202}}{\unicode[STIX]{x2202}z}\left(\langle w\rangle \langle w\rangle +\langle w^{\prime }w^{\prime }\rangle +\langle \unicode[STIX]{x1D70F}_{33}\rangle +\frac{\langle p\rangle }{\unicode[STIX]{x1D70C}_{o}}+\frac{2\langle e\rangle }{3}\right)+\langle b\rangle ,\end{eqnarray}$$
 $$\begin{eqnarray}\displaystyle \frac{\unicode[STIX]{x2202}}{\unicode[STIX]{x2202}t}\langle b\rangle & = & \displaystyle -\frac{\unicode[STIX]{x2202}}{\unicode[STIX]{x2202}x}(\langle u\rangle \langle b\rangle +\langle u^{\prime }b^{\prime }\rangle +\langle \unicode[STIX]{x1D70F}_{1b}\rangle )\nonumber\\ \displaystyle & & \displaystyle -\,\frac{\unicode[STIX]{x2202}}{\unicode[STIX]{x2202}z}(\langle w\rangle \langle b\rangle +\langle w^{\prime }b^{\prime }\rangle +\langle \unicode[STIX]{x1D70F}_{3b}\rangle ).\end{eqnarray}$$
 $x$
and
$x$
and
 $z$
directions. The right-hand side of the equations are written in flux conserving form which readily allows identification of the bulk effects that lead to frontogenesis and frontolysis. For an
$z$
directions. The right-hand side of the equations are written in flux conserving form which readily allows identification of the bulk effects that lead to frontogenesis and frontolysis. For an
 $x{-}y$
horizontally homogeneous flow (i.e. no front), cross-front derivatives disappear in (4.3),
$x{-}y$
horizontally homogeneous flow (i.e. no front), cross-front derivatives disappear in (4.3),
 $\langle w\rangle =0$
, and then (4.3) collapses to the standard 1-D Ekman layer equations for currents and buoyancy (e.g. McWilliams et al.
Reference McWilliams, Sullivan and Moeng1997). In general, the standard 1-D Ekman momentum and volume transport balances are disrupted locally by the streamwise divergence of mean and turbulent fluxes in (4.3).
$\langle w\rangle =0$
, and then (4.3) collapses to the standard 1-D Ekman layer equations for currents and buoyancy (e.g. McWilliams et al.
Reference McWilliams, Sullivan and Moeng1997). In general, the standard 1-D Ekman momentum and volume transport balances are disrupted locally by the streamwise divergence of mean and turbulent fluxes in (4.3).5 Interpretation of results
To provide a roadmap of the lifecycle of frontogenesis we show bulk statistics from simulations
 $(E,N,C)$
near the water surface over the time period
$(E,N,C)$
near the water surface over the time period
 $0<t<15~\text{h}$
in figure 2. In each simulation the time variation can be roughly divided into an initialization or onset period, an arrest period and a decay period. We organize the narrative based on these three time periods. We also refer to specific time stamps in figure 2:
$0<t<15~\text{h}$
in figure 2. In each simulation the time variation can be roughly divided into an initialization or onset period, an arrest period and a decay period. We organize the narrative based on these three time periods. We also refer to specific time stamps in figure 2:
 $t=2~\text{h}$
is slightly past the filament initialization,
$t=2~\text{h}$
is slightly past the filament initialization,
 $t=t_{m}$
is the time of arrest where the vertical vorticity
$t=t_{m}$
is the time of arrest where the vertical vorticity
 $\langle \unicode[STIX]{x1D701}\rangle _{p}$
reaches its maximum value and
$\langle \unicode[STIX]{x1D701}\rangle _{p}$
reaches its maximum value and
 $t=9~\text{h}$
is well into the decay period. Sample statistics collected at time stamp
$t=9~\text{h}$
is well into the decay period. Sample statistics collected at time stamp
 $t_{m}$
are summarized in table 1. An in-depth interpretation of figure 2 is postponed to § 5.2.
$t_{m}$
are summarized in table 1. An in-depth interpretation of figure 2 is postponed to § 5.2.

Figure 2. Peak average vertical vorticity
 $\langle \unicode[STIX]{x1D701}\rangle _{p}$
as a function of time for the different external forcings in table 1:
$\langle \unicode[STIX]{x1D701}\rangle _{p}$
as a function of time for the different external forcings in table 1:
 $(E,N,C)$
correspond to (blue, black, red) lines, respectively (a). Cross-front location
$(E,N,C)$
correspond to (blue, black, red) lines, respectively (a). Cross-front location
 $x_{p}/L$
of
$x_{p}/L$
of
 $\langle \unicode[STIX]{x1D701}\rangle _{p}$
(b),
$\langle \unicode[STIX]{x1D701}\rangle _{p}$
(b),
 $x_{p}$
tracks the movement of the cold filament centre. Turbulent kinetic energy TKE (c) normalized by
$x_{p}$
tracks the movement of the cold filament centre. Turbulent kinetic energy TKE (c) normalized by
 $(u_{\ast }^{2},u_{\ast }^{2},w_{\ast }^{2})$
in
$(u_{\ast }^{2},u_{\ast }^{2},w_{\ast }^{2})$
in
 $(E,N,C)$
, respectively. The open circle on the
$(E,N,C)$
, respectively. The open circle on the
 $\unicode[STIX]{x1D701}$
-curves marks the time stamp
$\unicode[STIX]{x1D701}$
-curves marks the time stamp
 $t=t_{m}$
of the maximum vertical vorticity.
$t=t_{m}$
of the maximum vertical vorticity.
5.1 Initial mean circulations and TTW
Our interpretation of the LES solutions begins with a discussion of the average flow fields at
 $t=2~\text{h}$
. Adopting a TTW approximation (Gula et al.
Reference Gula, Molemaker and McWilliams2014; McWilliams et al.
Reference McWilliams, Gula, Molemaker, Renault and Shchepetkin2015), the
$t=2~\text{h}$
. Adopting a TTW approximation (Gula et al.
Reference Gula, Molemaker and McWilliams2014; McWilliams et al.
Reference McWilliams, Gula, Molemaker, Renault and Shchepetkin2015), the
 $x{-}z$
spatial distribution of horizontal and vertical currents in our LES is approximately described by the balance between pressure gradients, Coriolis force and divergence of turbulent momentum fluxes:
$x{-}z$
spatial distribution of horizontal and vertical currents in our LES is approximately described by the balance between pressure gradients, Coriolis force and divergence of turbulent momentum fluxes:
 $$\begin{eqnarray}\displaystyle & \displaystyle f\langle v\rangle \approx \frac{\unicode[STIX]{x2202}}{\unicode[STIX]{x2202}x}\frac{\langle p\rangle }{\unicode[STIX]{x1D70C}_{o}}+\frac{\unicode[STIX]{x2202}}{\unicode[STIX]{x2202}z}(\langle u^{\prime }w^{\prime }\rangle +\langle \unicode[STIX]{x1D70F}_{13}\rangle ), & \displaystyle\end{eqnarray}$$
 $$\begin{eqnarray}\displaystyle & \displaystyle f\langle u\rangle \approx -\frac{\unicode[STIX]{x2202}}{\unicode[STIX]{x2202}z}(\langle v^{\prime }w^{\prime }\rangle +\langle \unicode[STIX]{x1D70F}_{23}\rangle ), & \displaystyle\end{eqnarray}$$
 $$\begin{eqnarray}\displaystyle & \displaystyle \frac{\unicode[STIX]{x2202}\langle w\rangle }{\unicode[STIX]{x2202}z}\approx -\frac{\unicode[STIX]{x2202}\langle u\rangle }{\unicode[STIX]{x2202}x}. & \displaystyle\end{eqnarray}$$

Figure 3. Average fields at
 $t=2~\text{h}$
for simulation
$t=2~\text{h}$
for simulation
 $E$
. The fields displayed from top to bottom are temperature
$E$
. The fields displayed from top to bottom are temperature
 $\langle \unicode[STIX]{x1D703}-\unicode[STIX]{x1D703}_{o}\rangle$
with the colour bar in K, followed by down-front velocity
$\langle \unicode[STIX]{x1D703}-\unicode[STIX]{x1D703}_{o}\rangle$
with the colour bar in K, followed by down-front velocity
 $\langle v\rangle$
, cross-front velocity
$\langle v\rangle$
, cross-front velocity
 $\langle u\rangle$
and vertical velocity
$\langle u\rangle$
and vertical velocity
 $\langle w\rangle$
. In the far field the
$\langle w\rangle$
. In the far field the
 $\langle u(x,z),v(x,z)\rangle$
currents are equivalent to the homogeneous currents for the east wind shown in figure 1. Colour bars for the velocity fields are in units of
$\langle u(x,z),v(x,z)\rangle$
currents are equivalent to the homogeneous currents for the east wind shown in figure 1. Colour bars for the velocity fields are in units of
 $\text{m}~\text{s}^{-1}$
. The averaging operator
$\text{m}~\text{s}^{-1}$
. The averaging operator
 $\langle \cdot \rangle$
is defined in § 5, and the
$\langle \cdot \rangle$
is defined in § 5, and the
 $\unicode[STIX]{x1D703}$
nudging, described in § 3.3, has been applied for 1.8 h before
$\unicode[STIX]{x1D703}$
nudging, described in § 3.3, has been applied for 1.8 h before
 $t=2$
. For clarity, contour lines of
$t=2$
. For clarity, contour lines of
 $\langle w\rangle$
are not shown in figures 3(d), 4(d) and 5(d).
$\langle w\rangle$
are not shown in figures 3(d), 4(d) and 5(d).

Figure 4. Average fields at
 $t=2~\text{h}$
for simulation
$t=2~\text{h}$
for simulation
 $N$
. The fields displayed from top to bottom are temperature
$N$
. The fields displayed from top to bottom are temperature
 $\langle \unicode[STIX]{x1D703}-\unicode[STIX]{x1D703}_{o}\rangle$
with the colour bar in K, followed by down-front velocity
$\langle \unicode[STIX]{x1D703}-\unicode[STIX]{x1D703}_{o}\rangle$
with the colour bar in K, followed by down-front velocity
 $\langle v\rangle$
, cross-front velocity
$\langle v\rangle$
, cross-front velocity
 $\langle u\rangle$
and vertical velocity
$\langle u\rangle$
and vertical velocity
 $\langle w\rangle$
. In the far field the
$\langle w\rangle$
. In the far field the
 $\langle u(x,z),v(x,z)\rangle$
currents are equivalent to the homogeneous currents for the north wind shown in figure 1. Colour bars for the velocity fields are in units of
$\langle u(x,z),v(x,z)\rangle$
currents are equivalent to the homogeneous currents for the north wind shown in figure 1. Colour bars for the velocity fields are in units of
 $\text{m}~\text{s}^{-1}$
.
$\text{m}~\text{s}^{-1}$
.

Figure 5. Average fields at
 $t=2~\text{h}$
for simulation
$t=2~\text{h}$
for simulation
 $C$
. The fields displayed from top to bottom are temperature
$C$
. The fields displayed from top to bottom are temperature
 $\langle \unicode[STIX]{x1D703}-\unicode[STIX]{x1D703}_{o}\rangle$
with the colour bar in K, followed by down-front velocity
$\langle \unicode[STIX]{x1D703}-\unicode[STIX]{x1D703}_{o}\rangle$
with the colour bar in K, followed by down-front velocity
 $\langle v\rangle$
, cross-front velocity
$\langle v\rangle$
, cross-front velocity
 $\langle u\rangle$
and vertical velocity
$\langle u\rangle$
and vertical velocity
 $\langle w\rangle$
. The fields are symmetric about
$\langle w\rangle$
. The fields are symmetric about
 $x=0$
within sampling error. In the far field the currents
$x=0$
within sampling error. In the far field the currents
 $\langle u(x,z),v(x,z)\rangle =0$
match the average currents for a homogeneous OBL driven by surface cooling. Colour bars for the velocity fields are in units of
$\langle u(x,z),v(x,z)\rangle =0$
match the average currents for a homogeneous OBL driven by surface cooling. Colour bars for the velocity fields are in units of
 $\text{m}~\text{s}^{-1}$
.
$\text{m}~\text{s}^{-1}$
.
Snapshots of the average flow fields in an
 $x{-}z$
plane for simulations
$x{-}z$
plane for simulations
 $(E,N,C)$
are shown in figures 3–5, respectively. The visualization depicts the main features of the initialization: a cold dense filament of total width
$(E,N,C)$
are shown in figures 3–5, respectively. The visualization depicts the main features of the initialization: a cold dense filament of total width
 $2L\sim 4~\text{km}$
fills the boundary layer to a depth of
$2L\sim 4~\text{km}$
fills the boundary layer to a depth of
 ${\sim}-66~\text{m}$
. The density anomaly is partly balanced by down-front currents
${\sim}-66~\text{m}$
. The density anomaly is partly balanced by down-front currents
 $\langle v\rangle$
with large (negative, positive) side lobes (left, right) of the front centreline
$\langle v\rangle$
with large (negative, positive) side lobes (left, right) of the front centreline
 $x=0$
. Secondary currents
$x=0$
. Secondary currents
 $\langle u,w\rangle$
develop in the boundary layer that feature a broad central downwelling jet with weaker upwelling in the far field with opposing cross-front branches left and right of the front centreline in the surface layer. Also, figures 3 and 4 show significant asymmetry in the horizontal currents and temperature field about the filament centreline because of wind forcing. The vertical velocity
$\langle u,w\rangle$
develop in the boundary layer that feature a broad central downwelling jet with weaker upwelling in the far field with opposing cross-front branches left and right of the front centreline in the surface layer. Also, figures 3 and 4 show significant asymmetry in the horizontal currents and temperature field about the filament centreline because of wind forcing. The vertical velocity
 $w$
is well resolved in the LES but its fluctuations
$w$
is well resolved in the LES but its fluctuations
 $w^{\prime }$
vary rapidly over small scales with amplitude nearly 10 times
$w^{\prime }$
vary rapidly over small scales with amplitude nearly 10 times
 $\langle w\rangle$
. Thus the apparent ‘noise’ in figures 3(d), 4(d), 5(d) is simply random error resulting from limited down-front
$\langle w\rangle$
. Thus the apparent ‘noise’ in figures 3(d), 4(d), 5(d) is simply random error resulting from limited down-front
 $y$
averaging. These small-scale fluctuations are damped by averaging over an even wider
$y$
averaging. These small-scale fluctuations are damped by averaging over an even wider
 $y$
domain.
$y$
domain.
Secondary circulations (or cells) are a key staple of TTW and significantly influence our interpretation of frontogenetic evolution with OBL turbulence. They can be inferred from the secondary currents
 $\langle u,w\rangle$
, but to identify them more clearly in our simulations we present contours of the non-divergent ageostrophic two-dimensional streamfunction
$\langle u,w\rangle$
, but to identify them more clearly in our simulations we present contours of the non-divergent ageostrophic two-dimensional streamfunction
 $\unicode[STIX]{x1D713}$
computed from
$\unicode[STIX]{x1D713}$
computed from
 $\langle u\rangle$
for the different simulations at
$\langle u\rangle$
for the different simulations at
 $t=2~\text{h}$
in figures 6(a), 7(a), and 8(a). Here
$t=2~\text{h}$
in figures 6(a), 7(a), and 8(a). Here
 $$\begin{eqnarray}\unicode[STIX]{x1D713}(x,z)=\int _{H}^{z}\langle u\rangle (x,z^{\prime })\,\text{d}z^{\prime },\end{eqnarray}$$
with the lower boundary condition
 $\unicode[STIX]{x1D713}(x,H)=0$
. It is now readily apparent that as part of the turbulent filament initialization a pair of coherent SC emerge (left, right) of the filament centreline at
$\unicode[STIX]{x1D713}(x,H)=0$
. It is now readily apparent that as part of the turbulent filament initialization a pair of coherent SC emerge (left, right) of the filament centreline at
 $t=2~\text{h}$
independent of the external forcing. Because the cross-front
$t=2~\text{h}$
independent of the external forcing. Because the cross-front
 $\langle u\rangle$
current is an order of magnitude larger than the downwelling
$\langle u\rangle$
current is an order of magnitude larger than the downwelling
 $\langle w\rangle$
current, combined with the wide horizontal and thin vertical scales, the rotational pattern of the secondary circulations take on a vertically thin elliptical shape.
$\langle w\rangle$
current, combined with the wide horizontal and thin vertical scales, the rotational pattern of the secondary circulations take on a vertically thin elliptical shape.

Figure 6. Contours of the two-dimensional ageostrophic overturning streamfunction
 $\unicode[STIX]{x1D713}$
in the
$\unicode[STIX]{x1D713}$
in the
 $x{-}z$
plane computed from the average velocity
$x{-}z$
plane computed from the average velocity
 $\langle u\rangle$
at three different time stamps for the simulation with cross-front winds
$\langle u\rangle$
at three different time stamps for the simulation with cross-front winds
 $E$
.
$E$
.
 $t=2~\text{h}$
(a),
$t=2~\text{h}$
(a),
 $t_{m}=4.50~\text{h}$
time of maximum vertical vorticity (b),
$t_{m}=4.50~\text{h}$
time of maximum vertical vorticity (b),
 $t=9~\text{h}$
a late time past the peak vorticity (c). In (a) the horizontal vectors indicate the flow direction at the top of the secondary circulation. The colour bar is in units of
$t=9~\text{h}$
a late time past the peak vorticity (c). In (a) the horizontal vectors indicate the flow direction at the top of the secondary circulation. The colour bar is in units of
 $\text{m}^{2}\text{s}^{-1}$
.
$\text{m}^{2}\text{s}^{-1}$
.

Figure 7. Contours of the two-dimensional ageostrophic overturning streamfunction
 $\unicode[STIX]{x1D713}$
in the
$\unicode[STIX]{x1D713}$
in the
 $x{-}z$
plane as in figure 6 but for the simulation with down-front winds
$x{-}z$
plane as in figure 6 but for the simulation with down-front winds
 $N$
.
$N$
.
 $t=2~\text{h}$
(a),
$t=2~\text{h}$
(a),
 $t_{m}=5.02~\text{h}$
time of maximum vertical vorticity (b),
$t_{m}=5.02~\text{h}$
time of maximum vertical vorticity (b),
 $t=9~\text{h}$
a late time past the peak vorticity (c). The colour bar is in units of
$t=9~\text{h}$
a late time past the peak vorticity (c). The colour bar is in units of
 $\text{m}^{2}\text{s}^{-1}$
.
$\text{m}^{2}\text{s}^{-1}$
.

Figure 8. Contours of the two-dimensional ageostrophic overturning streamfunction
 $\unicode[STIX]{x1D713}$
in the
$\unicode[STIX]{x1D713}$
in the
 $x{-}z$
plane as in figure 6 but for the simulation driven by surface cooling
$x{-}z$
plane as in figure 6 but for the simulation driven by surface cooling
 $C$
.
$C$
.
 $t=2~\text{h}$
(a),
$t=2~\text{h}$
(a),
 $t_{m}=6.13~\text{h}$
time of maximum vertical vorticity (b),
$t_{m}=6.13~\text{h}$
time of maximum vertical vorticity (b),
 $t=9~\text{h}$
a late time past the peak vorticity. The colour bar is in units of
$t=9~\text{h}$
a late time past the peak vorticity. The colour bar is in units of
 $\text{m}^{2}\text{s}^{-1}$
.
$\text{m}^{2}\text{s}^{-1}$
.
It is important to notice that the amplitude and streamline pattern of the secondary circulations with surface cooling (no wind stress), shown in figures 5 and 8, are qualitatively similar to those in
 $(E,N)$
. Remarkably, starting from fully developed (convective) turbulence with no net vertical momentum flux in
$(E,N)$
. Remarkably, starting from fully developed (convective) turbulence with no net vertical momentum flux in
 $C$
, a coherent secondary circulation and non-zero resolved turbulent vertical momentum fluxes
$C$
, a coherent secondary circulation and non-zero resolved turbulent vertical momentum fluxes
 $\langle u^{\prime }w^{\prime },v^{\prime }w^{\prime }\rangle$
are generated by turbulence–filament interactions as shown in figure 9. With no wind stress, these fluxes approach zero at
$\langle u^{\prime }w^{\prime },v^{\prime }w^{\prime }\rangle$
are generated by turbulence–filament interactions as shown in figure 9. With no wind stress, these fluxes approach zero at
 $z=0$
and are odd-symmetric about the filament centreline. The maximum absolute values occur in the upper OBL, near
$z=0$
and are odd-symmetric about the filament centreline. The maximum absolute values occur in the upper OBL, near
 $z\sim -20~\text{m}$
and are noticeably offset left and right of
$z\sim -20~\text{m}$
and are noticeably offset left and right of
 $x=0$
. For
$x=0$
. For
 $z>-20~\text{m}$
the divergence
$z>-20~\text{m}$
the divergence
 $-\unicode[STIX]{x2202}_{z}\langle v^{\prime }w^{\prime }\rangle$
generates (positive, negative) secondary
$-\unicode[STIX]{x2202}_{z}\langle v^{\prime }w^{\prime }\rangle$
generates (positive, negative) secondary
 $u$
currents on the (left, right) sides of the filament centreline according to (5.1b
); also see figures 5 and 9. Thus, near the water surface turbulent momentum fluxes generate converging
$u$
currents on the (left, right) sides of the filament centreline according to (5.1b
); also see figures 5 and 9. Thus, near the water surface turbulent momentum fluxes generate converging
 $u$
currents at the filament centreline. For
$u$
currents at the filament centreline. For
 $z<-20~\text{m}$
, the divergence
$z<-20~\text{m}$
, the divergence
 $-\unicode[STIX]{x2202}_{z}\langle v^{\prime }w^{\prime }\rangle$
changes sign causing the cross-front currents to flow away from the filament centreline. The cross-front flux
$-\unicode[STIX]{x2202}_{z}\langle v^{\prime }w^{\prime }\rangle$
changes sign causing the cross-front currents to flow away from the filament centreline. The cross-front flux
 $\langle u^{\prime }w^{\prime }\rangle$
is smaller in amplitude compared to its down-front counterpart, and the flux divergence
$\langle u^{\prime }w^{\prime }\rangle$
is smaller in amplitude compared to its down-front counterpart, and the flux divergence
 $\unicode[STIX]{x2202}_{z}\langle u^{\prime }w^{\prime }\rangle$
tends to oppose the geostrophic current
$\unicode[STIX]{x2202}_{z}\langle u^{\prime }w^{\prime }\rangle$
tends to oppose the geostrophic current
 $v_{g}$
on either side of the filament; hence turbulence re-enforces the imbalance
$v_{g}$
on either side of the filament; hence turbulence re-enforces the imbalance
 $\langle v\rangle \neq v_{g}$
. The spatial pattern of
$\langle v\rangle \neq v_{g}$
. The spatial pattern of
 $\langle w\rangle (x,z)$
follows from (5.1c
). At
$\langle w\rangle (x,z)$
follows from (5.1c
). At
 $t=2~\text{h}$
, the spatial distribution of
$t=2~\text{h}$
, the spatial distribution of
 $\langle u^{\prime }w^{\prime },v^{\prime }w^{\prime }\rangle$
for
$\langle u^{\prime }w^{\prime },v^{\prime }w^{\prime }\rangle$
for
 $(E,N)$
are qualitatively similar to those in
$(E,N)$
are qualitatively similar to those in
 $C$
(not shown).
$C$
(not shown).

Figure 9. Resolved turbulent fluxes
 $\langle u^{\prime }w^{\prime }\rangle$
(a) and
$\langle u^{\prime }w^{\prime }\rangle$
(a) and
 $\langle v^{\prime }w^{\prime }\rangle$
(b) from simulation
$\langle v^{\prime }w^{\prime }\rangle$
(b) from simulation
 $C$
at
$C$
at
 $t=2~\text{h}$
. Fluxes are normalized by
$t=2~\text{h}$
. Fluxes are normalized by
 $w_{\ast }^{2}$
, and the colour bar is in non-dimensional units. A vertical profile of the turbulent flux averaged between
$w_{\ast }^{2}$
, and the colour bar is in non-dimensional units. A vertical profile of the turbulent flux averaged between
 $-250<x<-600~\text{m}$
(solid lines) and
$-250<x<-600~\text{m}$
(solid lines) and
 $250>x>600~\text{m}$
(dashed lines) is shown in the right frame. The fluxes on the right side of the front are multiplied by
$250>x>600~\text{m}$
(dashed lines) is shown in the right frame. The fluxes on the right side of the front are multiplied by
 $-$
1 to better compare with the left side.
$-$
1 to better compare with the left side.
Within sampling error, the
 $\langle \boldsymbol{u},\unicode[STIX]{x1D703}\rangle$
fields in the cooling simulation
$\langle \boldsymbol{u},\unicode[STIX]{x1D703}\rangle$
fields in the cooling simulation
 $C$
display appropriate odd–even symmetries about
$C$
display appropriate odd–even symmetries about
 $x=0$
, i.e.
$x=0$
, i.e.
 $\langle u,v\rangle$
are odd functions while
$\langle u,v\rangle$
are odd functions while
 $\langle w,\unicode[STIX]{x1D703}\rangle$
are even functions. In contrast, in the simulations with cross-front and down-front winds
$\langle w,\unicode[STIX]{x1D703}\rangle$
are even functions. In contrast, in the simulations with cross-front and down-front winds
 $(E,N)$
the magnitudes and patterns of the
$(E,N)$
the magnitudes and patterns of the
 $\langle u,v\rangle$
currents are noticeably asymmetrical, exhibiting a wind direction dependence about the filament centreline. To a first approximation this broken symmetry can be understood as a superposition of secondary circulations, as in
$\langle u,v\rangle$
currents are noticeably asymmetrical, exhibiting a wind direction dependence about the filament centreline. To a first approximation this broken symmetry can be understood as a superposition of secondary circulations, as in
 $C$
, and Ekman boundary-layer currents (see also McWilliams et al.
Reference McWilliams, Gula, Molemaker, Renault and Shchepetkin2015). To expand on this idea, consider the horizontal mean currents
$C$
, and Ekman boundary-layer currents (see also McWilliams et al.
Reference McWilliams, Gula, Molemaker, Renault and Shchepetkin2015). To expand on this idea, consider the horizontal mean currents
 $(\overline{u},\overline{v})$
in figure 1 from our spatially homogeneous boundary layers used to initiate the frontal simulations. Inspection of these curves shows the expected results for a homogeneous OBL (e.g. McWilliams et al.
Reference McWilliams, Sullivan and Moeng1997). With cross-front winds the Ekman
$(\overline{u},\overline{v})$
in figure 1 from our spatially homogeneous boundary layers used to initiate the frontal simulations. Inspection of these curves shows the expected results for a homogeneous OBL (e.g. McWilliams et al.
Reference McWilliams, Sullivan and Moeng1997). With cross-front winds the Ekman
 $\overline{v}$
current is negative, rotated to the right of the wind and decays monotonically with depth. Meanwhile, its companion Ekman
$\overline{v}$
current is negative, rotated to the right of the wind and decays monotonically with depth. Meanwhile, its companion Ekman
 $\overline{u}$
current spirals with depth;
$\overline{u}$
current spirals with depth;
 $\overline{u}$
is positive and surface intensified for
$\overline{u}$
is positive and surface intensified for
 $0>z>0.25h$
but crosses over to negative values near
$0>z>0.25h$
but crosses over to negative values near
 $z\sim 0.25h$
so that the bulk integral
$z\sim 0.25h$
so that the bulk integral
 $\int \overline{u}\,\text{d}z=0$
. Both
$\int \overline{u}\,\text{d}z=0$
. Both
 $(\overline{u},\overline{v})$
decay to zero near
$(\overline{u},\overline{v})$
decay to zero near
 $h$
. Because of symmetries in the forcing,
$h$
. Because of symmetries in the forcing,
 $(\overline{v},-\overline{u})$
for
$(\overline{v},-\overline{u})$
for
 $N$
$N$
 $=$
$=$
 $(\overline{u},\overline{v})$
for
$(\overline{u},\overline{v})$
for
 $E$
.
$E$
.
Further comparison of the streamfunction patterns in figures 6 and 7 shows cross-front Ekman transport in the far field away from the filament in
 $(E,N)$
especially in the down-front wind simulation. However, near the filament the coherent cells significantly modify the Ekman flow. In
$(E,N)$
especially in the down-front wind simulation. However, near the filament the coherent cells significantly modify the Ekman flow. In
 $N$
, the secondary circulations are slightly offset vertically with the cell centre on the right-hand side lying closer to the water surface. Apparently the boundary-layer Ekman flow and secondary circulations work constructively/destructively on the left-/right-hand side of the filament. It is interesting to trace the complex trajectory of near-surface streamlines in the down-front wind simulation. For example, on the far left-hand side of the domain near
$N$
, the secondary circulations are slightly offset vertically with the cell centre on the right-hand side lying closer to the water surface. Apparently the boundary-layer Ekman flow and secondary circulations work constructively/destructively on the left-/right-hand side of the filament. It is interesting to trace the complex trajectory of near-surface streamlines in the down-front wind simulation. For example, on the far left-hand side of the domain near
 $z\sim -25~\text{m}$
the streamlines are initially squeezed in the vertical direction as they approach the filament centre, a consequence of the enhanced
$z\sim -25~\text{m}$
the streamlines are initially squeezed in the vertical direction as they approach the filament centre, a consequence of the enhanced
 $u$
current in the secondary circulations. Then the streamlines smoothly cross the filament axis, dive deep into the boundary layer tracking out a trajectory below the secondary circulations on the right-hand side and finally re-surface well to the east of the secondary circulation. Notice that in the region
$u$
current in the secondary circulations. Then the streamlines smoothly cross the filament axis, dive deep into the boundary layer tracking out a trajectory below the secondary circulations on the right-hand side and finally re-surface well to the east of the secondary circulation. Notice that in the region
 $0<x<3000~\text{m}$
, the cross-front flow is near zero or slightly negative in the upper boundary layer, i.e. the return current from the secondary circulation blocks the cross-front Ekman boundary-layer transport, also see figure 10. In the
$0<x<3000~\text{m}$
, the cross-front flow is near zero or slightly negative in the upper boundary layer, i.e. the return current from the secondary circulation blocks the cross-front Ekman boundary-layer transport, also see figure 10. In the
 $E$
case, the boundary-layer
$E$
case, the boundary-layer
 $v$
current favours/opposes the geostrophic current
$v$
current favours/opposes the geostrophic current
 $v_{g}$
left/right of
$v_{g}$
left/right of
 $x=0$
over the entire mixed layer. At the same time, the boundary-layer
$x=0$
over the entire mixed layer. At the same time, the boundary-layer
 $u$
current acts in a differential manner, it (strengthens, weakens) the secondary
$u$
current acts in a differential manner, it (strengthens, weakens) the secondary
 $u$
circulation in the surface layer, but has an opposite effect below
$u$
circulation in the surface layer, but has an opposite effect below
 $z<0.25h$
.
$z<0.25h$
.

Figure 10. Average currents
 $\langle u,v\rangle$
indicated by (red, blue) lines (a–c), and average temperature
$\langle u,v\rangle$
indicated by (red, blue) lines (a–c), and average temperature
 $\langle \unicode[STIX]{x1D703}-\unicode[STIX]{x1D703}_{o}\rangle$
(d–f) near the water surface
$\langle \unicode[STIX]{x1D703}-\unicode[STIX]{x1D703}_{o}\rangle$
(d–f) near the water surface
 $0<-z<5~\text{m}$
. Profiles are shown at
$0<-z<5~\text{m}$
. Profiles are shown at
 $t=0~\text{h}$
(dotted lines) and time
$t=0~\text{h}$
(dotted lines) and time
 $t_{m}$
where the peak vertical vorticity
$t_{m}$
where the peak vertical vorticity
 $\langle \unicode[STIX]{x1D701}\rangle _{p}$
is a maximum (solid lines). The currents in simulations
$\langle \unicode[STIX]{x1D701}\rangle _{p}$
is a maximum (solid lines). The currents in simulations
 $(E,N,C)$
are normalized by
$(E,N,C)$
are normalized by
 $(u_{\ast },u_{\ast },w_{\ast })$
, respectively, and the temperature is normalized by the temperature jump between the far field and the filament centre
$(u_{\ast },u_{\ast },w_{\ast })$
, respectively, and the temperature is normalized by the temperature jump between the far field and the filament centre
 $|\unicode[STIX]{x1D6FF}\unicode[STIX]{x1D703}_{o}|=0.48~\text{K}$
(see appendix A).
$|\unicode[STIX]{x1D6FF}\unicode[STIX]{x1D703}_{o}|=0.48~\text{K}$
(see appendix A).
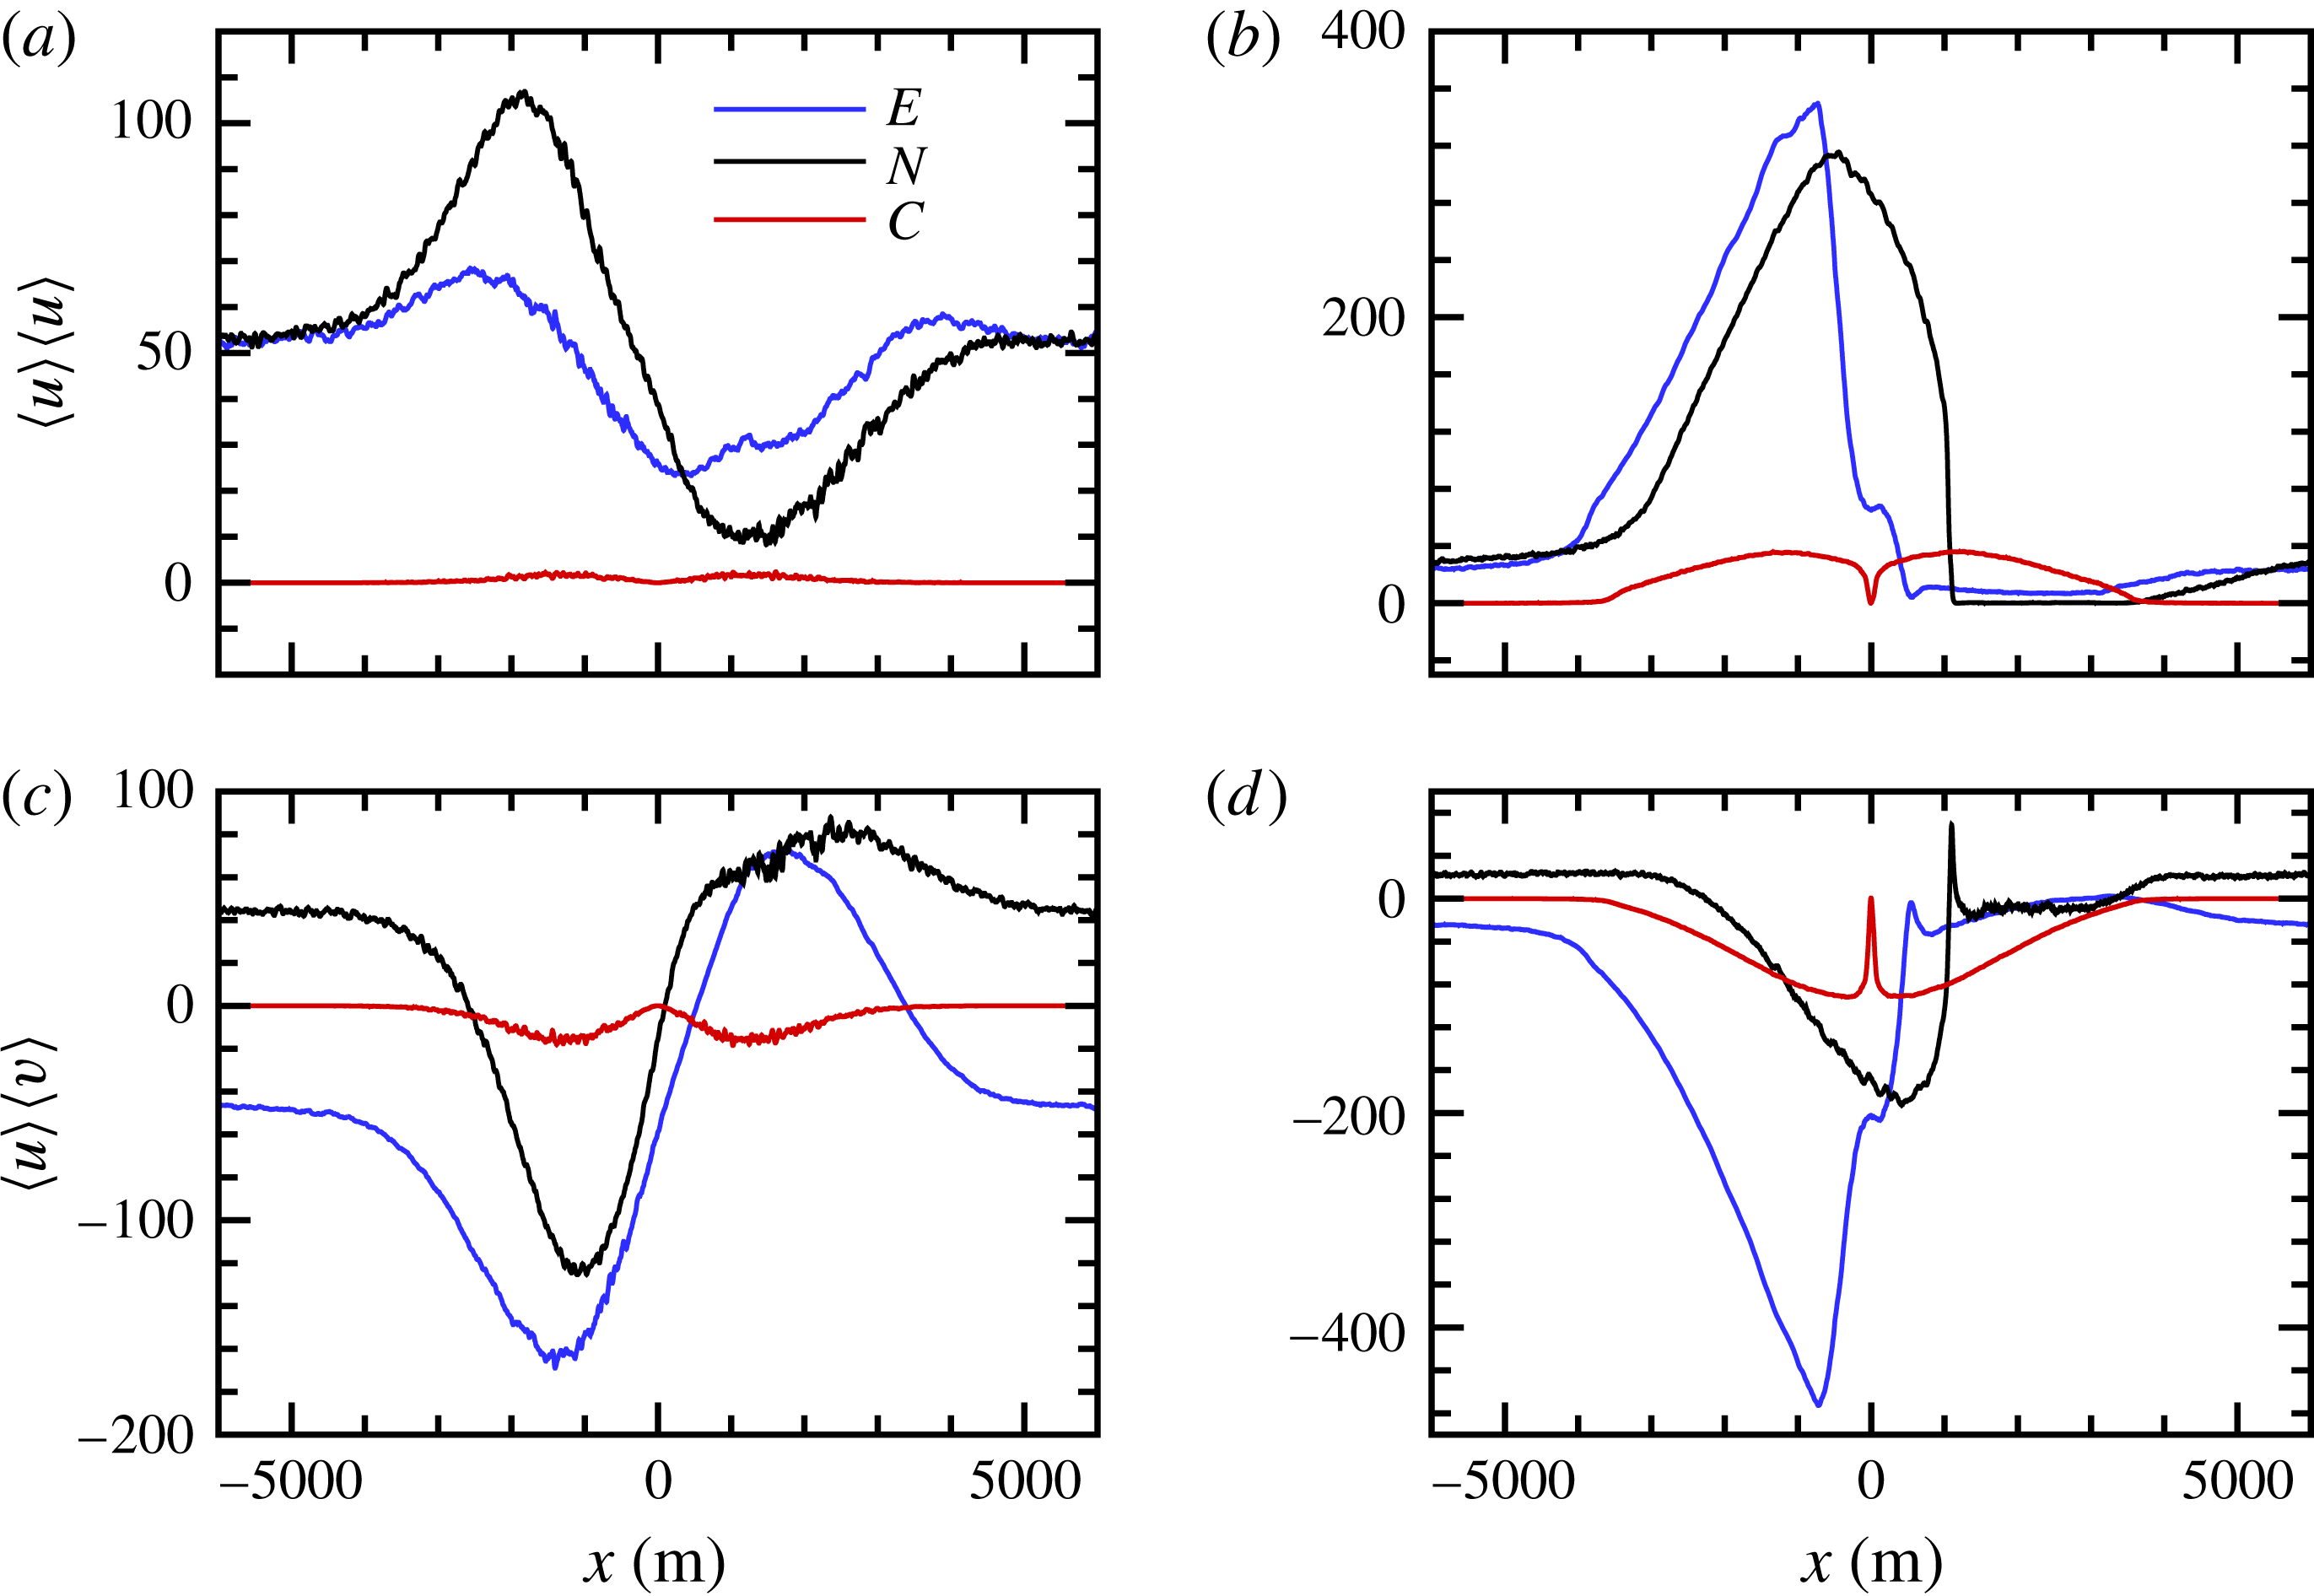
Figure 11. Average fluxes
 $\langle u\rangle \langle u\rangle$
(a,b) and
$\langle u\rangle \langle u\rangle$
(a,b) and
 $\langle u\rangle \langle v\rangle$
(c,d) for simulations
$\langle u\rangle \langle v\rangle$
(c,d) for simulations
 $(E,N,C)$
, indicated by (blue, black, red) lines, respectively. (a,c) Compare results at
$(E,N,C)$
, indicated by (blue, black, red) lines, respectively. (a,c) Compare results at
 $t=0$
and (b,d) at the time of maximum
$t=0$
and (b,d) at the time of maximum
 $\langle \unicode[STIX]{x1D701}\rangle _{p}$
. Fluxes in simulations
$\langle \unicode[STIX]{x1D701}\rangle _{p}$
. Fluxes in simulations
 $(E,N,C)$
are normalized by
$(E,N,C)$
are normalized by
 $(u_{\ast }^{2},u_{\ast }^{2},w_{\ast }^{2})$
, respectively.
$(u_{\ast }^{2},u_{\ast }^{2},w_{\ast }^{2})$
, respectively.
The mean currents
 $\langle u,v\rangle$
and their momentum fluxes in a near-surface layer of depth
$\langle u,v\rangle$
and their momentum fluxes in a near-surface layer of depth
 $-5<z<0~\text{m}$
at
$-5<z<0~\text{m}$
at
 $t=0$
are presented as line plots in figures 10 and 11; they add further support to our interpretation of the streamfunction patterns. Because
$t=0$
are presented as line plots in figures 10 and 11; they add further support to our interpretation of the streamfunction patterns. Because
 $\langle u\rangle \langle u\rangle$
and
$\langle u\rangle \langle u\rangle$
and
 $\langle u\rangle \langle v\rangle$
are nonlinear products the mean current fluxes are even more strongly asymmetrical functions about
$\langle u\rangle \langle v\rangle$
are nonlinear products the mean current fluxes are even more strongly asymmetrical functions about
 $x=0$
with notably bigger amplitude compared to the currents; consequently the cross-front
$x=0$
with notably bigger amplitude compared to the currents; consequently the cross-front
 $x$
divergence and time tendencies in (4.3) are also larger on the left side of the filament. The imbalances between the left and right sides at
$x$
divergence and time tendencies in (4.3) are also larger on the left side of the filament. The imbalances between the left and right sides at
 $t=0$
hold, independent of the wind direction
$t=0$
hold, independent of the wind direction
 $E$
or
$E$
or
 $N$
, because each involves some Ekman flow from west to east. The asymmetry, of course, would be shifted to the right side of a filament for an east-to-west cross-front wind or a north-to-south down-front wind.
$N$
, because each involves some Ekman flow from west to east. The asymmetry, of course, would be shifted to the right side of a filament for an east-to-west cross-front wind or a north-to-south down-front wind.
The constructive–destructive superposition of the Ekman flow and secondary circulations has important consequences. Because of the competing effects, the horizontal buoyancy flux is asymmetrical but directed inwards from both filament edges towards the cool filament centre, i.e. the boundary layer re-stratifies from both edges. The mean transport of warm water is strong/weak from the left/right filament edges. This is an opposite result compared to the findings reported by Thomas & Lee (Reference Thomas and Lee2005), Skyllingstad & Samelson (Reference Skyllingstad and Samelson2012), Thomas et al. (Reference Thomas, Ferrari and Joyce2013), Hamlington et al. (Reference Hamlington, Van Roekel, Fox-Kemper, Julien and Chini2014) and others who find that their filament edges are stable and unstable because of Ekman buoyancy flux for weak warm filaments. From a stratification perspective, the turbulent flow near the water surface is in a weakly stable (left side) or marginally stable (right side) regime because of the vigorous secondary circulations induced by turbulence at
 $t=0$
. Potent SC inhibit convective overturning at a filament edge and thus fundamentally alter the type of instability that leads to arrest and decay in cold filament frontogenesis driven by cross-front or down-front winds or surface cooling, see §§ 5.2 and 5.3.
$t=0$
. Potent SC inhibit convective overturning at a filament edge and thus fundamentally alter the type of instability that leads to arrest and decay in cold filament frontogenesis driven by cross-front or down-front winds or surface cooling, see §§ 5.2 and 5.3.
A scaling estimate of the competition between Ekman buoyancy flux and the TTW SC can be made based on the estimates in McWilliams (Reference McWilliams2017). For an Ekman layer depth comparable to the mixed layer depth (figure 1), the cross-front Ekman velocity
 ${\sim}u_{\ast }^{2}/f|h|$
, while the linear TTW balance velocity is
${\sim}u_{\ast }^{2}/f|h|$
, while the linear TTW balance velocity is
 ${\sim}\unicode[STIX]{x1D708}_{v}v_{g}/fh^{2}$
, where
${\sim}\unicode[STIX]{x1D708}_{v}v_{g}/fh^{2}$
, where
 $h$
is the mixed layer depth,
$h$
is the mixed layer depth,
 $v_{g}$
is the geostrophic down-front velocity, and
$v_{g}$
is the geostrophic down-front velocity, and
 $\unicode[STIX]{x1D708}_{v}$
is the diagnosed vertical eddy viscosity,
$\unicode[STIX]{x1D708}_{v}$
is the diagnosed vertical eddy viscosity,
 $-\langle \boldsymbol{u}^{\prime }\boldsymbol{w}^{\prime }\rangle \cdot \unicode[STIX]{x2202}_{z}\langle \boldsymbol{u}\rangle /(\unicode[STIX]{x2202}_{z}\langle \boldsymbol{u}\rangle )^{2}$
. With characteristic values of
$-\langle \boldsymbol{u}^{\prime }\boldsymbol{w}^{\prime }\rangle \cdot \unicode[STIX]{x2202}_{z}\langle \boldsymbol{u}\rangle /(\unicode[STIX]{x2202}_{z}\langle \boldsymbol{u}\rangle )^{2}$
. With characteristic values of
 $u_{\ast }=0.01~\text{m}~\text{s}^{-1}$
,
$u_{\ast }=0.01~\text{m}~\text{s}^{-1}$
,
 $f=0.9\times 10^{-4}~\text{s}^{-1}$
,
$f=0.9\times 10^{-4}~\text{s}^{-1}$
,
 $h=-70~\text{m}$
,
$h=-70~\text{m}$
,
 $v_{g}=0.25~\text{m}~\text{s}^{-1}$
and
$v_{g}=0.25~\text{m}~\text{s}^{-1}$
and
 $\unicode[STIX]{x1D708}_{v}=0.1~\text{m}^{2}~\text{s}^{-1}$
, the Ekman velocity estimate is
$\unicode[STIX]{x1D708}_{v}=0.1~\text{m}^{2}~\text{s}^{-1}$
, the Ekman velocity estimate is
 ${\approx}0.02~\text{m}~\text{s}^{-1}$
, while the TTW velocity estimate is a larger value of
${\approx}0.02~\text{m}~\text{s}^{-1}$
, while the TTW velocity estimate is a larger value of
 ${\approx}0.06~\text{m}~\text{s}^{-1}$
. Thus, for stronger frontal velocity and turbulent mixing and weaker wind stress, the SC can block Ekman buoyancy flux, as in the cases here (figures 6–8), even when the wind is down-front (case N) and the Ekman transport is nominally across the front (case N). In general because of SC the standard (far-field) 1-D Ekman momentum and volume transport balances do not hold near the filament.
${\approx}0.06~\text{m}~\text{s}^{-1}$
. Thus, for stronger frontal velocity and turbulent mixing and weaker wind stress, the SC can block Ekman buoyancy flux, as in the cases here (figures 6–8), even when the wind is down-front (case N) and the Ekman transport is nominally across the front (case N). In general because of SC the standard (far-field) 1-D Ekman momentum and volume transport balances do not hold near the filament.
Another widely discussed feature of a down-front wind is an extraction of potential vorticity by the surface stress and vertical momentum mixing, leading to negative potential vorticity, symmetric (or centrifugal) instability and enhanced turbulence (Thomas Reference Thomas2005; Taylor & Ferrari Reference Taylor and Ferrari2009). Figure 12 shows the Ertel potential vorticity associated with the
 $y$
-averaged fields,
$y$
-averaged fields,
 $$\begin{eqnarray}\langle q\rangle =\left(\,f+\frac{\unicode[STIX]{x2202}\langle v\rangle }{\unicode[STIX]{x2202}x}\right)\frac{\unicode[STIX]{x2202}\langle b\rangle }{\unicode[STIX]{x2202}z}-\frac{\unicode[STIX]{x2202}\langle v\rangle }{\unicode[STIX]{x2202}z}\frac{\unicode[STIX]{x2202}\langle b\rangle }{\unicode[STIX]{x2202}x},\end{eqnarray}$$
at
 $t=2~\text{h}$
for all three cases. As expected
$t=2~\text{h}$
for all three cases. As expected
 $\langle q\rangle$
is smaller in the boundary layer than in the pycnocline below. The action of turbulent overturning motions and entrainment is also evident at the base of the boundary layer. Case
$\langle q\rangle$
is smaller in the boundary layer than in the pycnocline below. The action of turbulent overturning motions and entrainment is also evident at the base of the boundary layer. Case
 $N$
is distinguished by a modestly negative region near the surface under the northward jet (i.e. the one with a down-front wind). This confirms the expected potential vorticity extraction and sets up a sufficient condition for linear, inviscid symmetric instability. However, the latter is not clearly evident in our case
$N$
is distinguished by a modestly negative region near the surface under the northward jet (i.e. the one with a down-front wind). This confirms the expected potential vorticity extraction and sets up a sufficient condition for linear, inviscid symmetric instability. However, the latter is not clearly evident in our case
 $N$
simulation, implying that the other sources of turbulence are dominant here and perhaps that strong mixing inhibits its occurrence. As frontogenesis proceeds even this degree of
$N$
simulation, implying that the other sources of turbulence are dominant here and perhaps that strong mixing inhibits its occurrence. As frontogenesis proceeds even this degree of
 $\langle q\rangle <0$
abates in all three cases.
$\langle q\rangle <0$
abates in all three cases.

Figure 12. Average potential vorticity (PV) estimated from (5.3) at
 $t=2~\text{h}$
for cases
$t=2~\text{h}$
for cases
 $(E,N,C)$
shown in panels (a–c), respectively. The colour bar for PV is in units of
$(E,N,C)$
shown in panels (a–c), respectively. The colour bar for PV is in units of
 $\text{s}^{-3}\times 10^{8}$
.
$\text{s}^{-3}\times 10^{8}$
.
5.2 Frontogenetic progression
Section 5.1 shows that in the onset phase a coherent secondary circulation develops and persists in the LES against a background of fully developed OBL turbulence. A next step is then to examine the impact of fully resolved turbulent momentum and buoyancy fluxes on the sharpening of the cross-filament buoyancy and horizontal velocity gradients and the evolution of secondary circulations. To describe the dynamics of frontogenesis beyond
 $t>2~\text{h}$
we need to include time tendency and cross-front divergences in (4.3) in our discussion. Assuming fine grids and hence small SGS contributions, the important new terms to consider are then the following:
$t>2~\text{h}$
we need to include time tendency and cross-front divergences in (4.3) in our discussion. Assuming fine grids and hence small SGS contributions, the important new terms to consider are then the following:
 $$\begin{eqnarray}\displaystyle & \displaystyle \frac{\unicode[STIX]{x2202}}{\unicode[STIX]{x2202}t}\langle u\rangle \sim -\frac{\unicode[STIX]{x2202}}{\unicode[STIX]{x2202}x}(\langle u\rangle \langle u\rangle +\langle u^{\prime }u^{\prime }\rangle )+\cdots \,, & \displaystyle\end{eqnarray}$$
 $$\begin{eqnarray}\displaystyle & \displaystyle \frac{\unicode[STIX]{x2202}}{\unicode[STIX]{x2202}t}\langle v\rangle \sim -\frac{\unicode[STIX]{x2202}}{\unicode[STIX]{x2202}x}(\langle u\rangle \langle v\rangle +\langle u^{\prime }v^{\prime }\rangle )+\cdots \,, & \displaystyle\end{eqnarray}$$
 $$\begin{eqnarray}\displaystyle & \displaystyle \frac{\unicode[STIX]{x2202}}{\unicode[STIX]{x2202}t}\langle w\rangle \sim -\frac{\unicode[STIX]{x2202}}{\unicode[STIX]{x2202}x}(\langle u\rangle \langle w\rangle +\langle u^{\prime }w^{\prime }\rangle )+\cdots \,, & \displaystyle\end{eqnarray}$$
 $$\begin{eqnarray}\displaystyle & \displaystyle \frac{\unicode[STIX]{x2202}}{\unicode[STIX]{x2202}t}\langle b\rangle \sim -\frac{\unicode[STIX]{x2202}}{\unicode[STIX]{x2202}x}(\langle u\rangle \langle b\rangle +\langle u^{\prime }b^{\prime }\rangle )+\cdots \,. & \displaystyle\end{eqnarray}$$
The lifecycle of frontal onset, arrest and decay in our simulations
 $(E,N,C)$
is demonstrated in figure 2. Here we follow Capet et al. (Reference Capet, McWilliams, Molemaker and Shchepetkin2008), Gula et al. (Reference Gula, Molemaker and McWilliams2014) and McWilliams et al. (Reference McWilliams, Gula, Molemaker, Renault and Shchepetkin2015) and use vertical vorticity as an informative metric for frontal tendency. Figure 2 compares the temporal variation of the peak vertical vorticity
$(E,N,C)$
is demonstrated in figure 2. Here we follow Capet et al. (Reference Capet, McWilliams, Molemaker and Shchepetkin2008), Gula et al. (Reference Gula, Molemaker and McWilliams2014) and McWilliams et al. (Reference McWilliams, Gula, Molemaker, Renault and Shchepetkin2015) and use vertical vorticity as an informative metric for frontal tendency. Figure 2 compares the temporal variation of the peak vertical vorticity
 $\langle \unicode[STIX]{x1D701}\rangle _{p}(t)=\unicode[STIX]{x2202}_{x}\langle v\rangle /f$
(or peak local Rossby number), its cross-front location
$\langle \unicode[STIX]{x1D701}\rangle _{p}(t)=\unicode[STIX]{x2202}_{x}\langle v\rangle /f$
(or peak local Rossby number), its cross-front location
 $x_{p}(t)$
and the resolved turbulent kinetic energy
$x_{p}(t)$
and the resolved turbulent kinetic energy
 $(\text{TKE}=\langle u_{i}^{\prime }u_{i}^{\prime }\rangle /2)$
at the time and location of
$(\text{TKE}=\langle u_{i}^{\prime }u_{i}^{\prime }\rangle /2)$
at the time and location of
 $\langle \unicode[STIX]{x1D701}\rangle _{p}$
over the time period
$\langle \unicode[STIX]{x1D701}\rangle _{p}$
over the time period
 $0<t<15~\text{h}$
. These are surface layer statistics obtained by
$0<t<15~\text{h}$
. These are surface layer statistics obtained by
 $y$
-averaging along with spatial averaging over a shallow layer
$y$
-averaging along with spatial averaging over a shallow layer
 $-5<z<0~\text{m}$
. To illustrate changes to the OBL properties away from the surface we also track the temporal evolution of the minimum downwelling amplitude
$-5<z<0~\text{m}$
. To illustrate changes to the OBL properties away from the surface we also track the temporal evolution of the minimum downwelling amplitude
 $\langle w\rangle _{min}$
at
$\langle w\rangle _{min}$
at
 $\langle \unicode[STIX]{x1D701}\rangle _{p}$
near the mid-OBL depth
$\langle \unicode[STIX]{x1D701}\rangle _{p}$
near the mid-OBL depth
 $z\sim -30~\text{m}$
in figure 13.
$z\sim -30~\text{m}$
in figure 13.

Figure 13. Minimum average vertical velocity
 $\langle w\rangle _{min}$
in the middle of the OBL
$\langle w\rangle _{min}$
in the middle of the OBL
 $z\sim -30~\text{m}$
at the time and spatial location of
$z\sim -30~\text{m}$
at the time and spatial location of
 $\langle \unicode[STIX]{x1D701}\rangle _{p}$
in figure 2. Results for simulations
$\langle \unicode[STIX]{x1D701}\rangle _{p}$
in figure 2. Results for simulations
 $(E,N,C)$
are indicated by (blue, black, red) lines, and the vertical velocity is normalized by
$(E,N,C)$
are indicated by (blue, black, red) lines, and the vertical velocity is normalized by
 $(u_{\ast },u_{\ast },w_{\ast })$
, respectively. The open circle on each line marks the time of maximum vertical vorticity
$(u_{\ast },u_{\ast },w_{\ast })$
, respectively. The open circle on each line marks the time of maximum vertical vorticity
 $t_{m}$
in figure 2.
$t_{m}$
in figure 2.
During the onset phase
 $0<t<2~\text{h}$
,
$0<t<2~\text{h}$
,
 $\langle \unicode[STIX]{x1D701}\rangle _{p}(t)$
is relatively flat or shows a modest rise, it then undergoes rapid intensification reaching maximum values
$\langle \unicode[STIX]{x1D701}\rangle _{p}(t)$
is relatively flat or shows a modest rise, it then undergoes rapid intensification reaching maximum values
 ${>}80$
in the time period
${>}80$
in the time period
 $2<t<6.0~\text{h}$
for
$2<t<6.0~\text{h}$
for
 $(N,C)$
. A much longer quasi-steady arrest and decay over the next 10 h follows the onset phase. The explosive growth of
$(N,C)$
. A much longer quasi-steady arrest and decay over the next 10 h follows the onset phase. The explosive growth of
 $\langle \unicode[STIX]{x1D701}\rangle _{p}$
demonstrates that frontogenesis occurs in each simulation, but the time
$\langle \unicode[STIX]{x1D701}\rangle _{p}$
demonstrates that frontogenesis occurs in each simulation, but the time
 $t_{m}$
of the maximum vertical vorticity and its location
$t_{m}$
of the maximum vertical vorticity and its location
 $x_{p}(t_{m})$
depend on the external forcing. In the onset phase,
$x_{p}(t_{m})$
depend on the external forcing. In the onset phase,
 $x_{p}(t)$
is nearly constant and shifted to the east in
$x_{p}(t)$
is nearly constant and shifted to the east in
 $(E,N)$
compared to the no-wind simulation
$(E,N)$
compared to the no-wind simulation
 $C$
; this cross-front drift of the upper OBL is also apparent in figures 14–16. As time advances
$C$
; this cross-front drift of the upper OBL is also apparent in figures 14–16. As time advances
 $t>t_{m}$
,
$t>t_{m}$
,
 $x_{p}(t)$
continues to drift eastward in simulation
$x_{p}(t)$
continues to drift eastward in simulation
 $N$
and is evidence of bulk mixed layer cross-front transport during frontogenesis.
$N$
and is evidence of bulk mixed layer cross-front transport during frontogenesis.

Figure 14. Average fields at
 $t_{m}=4.5~\text{h}$
for simulation
$t_{m}=4.5~\text{h}$
for simulation
 $E$
(cf. figure 3). The fields displayed from top to bottom are temperature
$E$
(cf. figure 3). The fields displayed from top to bottom are temperature
 $\langle \unicode[STIX]{x1D703}-\unicode[STIX]{x1D703}_{o}\rangle$
with the colour bar in K, followed by down-front current
$\langle \unicode[STIX]{x1D703}-\unicode[STIX]{x1D703}_{o}\rangle$
with the colour bar in K, followed by down-front current
 $\langle v\rangle$
, cross-front current
$\langle v\rangle$
, cross-front current
 $\langle u\rangle$
and vertical velocity
$\langle u\rangle$
and vertical velocity
 $\langle w\rangle$
. Colour bars for the velocity fields are in units of
$\langle w\rangle$
. Colour bars for the velocity fields are in units of
 $\text{m}~\text{s}^{-1}$
.
$\text{m}~\text{s}^{-1}$
.

Figure 15. Average fields at
 $t_{m}=5.02~\text{h}$
for simulation
$t_{m}=5.02~\text{h}$
for simulation
 $N$
(cf. figure 4). The fields displayed from (a) to (d) are temperature
$N$
(cf. figure 4). The fields displayed from (a) to (d) are temperature
 $\langle \unicode[STIX]{x1D703}-\unicode[STIX]{x1D703}_{o}\rangle$
with the colour bar in K, followed by down-front current
$\langle \unicode[STIX]{x1D703}-\unicode[STIX]{x1D703}_{o}\rangle$
with the colour bar in K, followed by down-front current
 $\langle v\rangle$
, cross-front current
$\langle v\rangle$
, cross-front current
 $\langle u\rangle$
and vertical velocity
$\langle u\rangle$
and vertical velocity
 $\langle w\rangle$
. Colour bars for the velocity fields are in units of
$\langle w\rangle$
. Colour bars for the velocity fields are in units of
 $\text{m}~\text{s}^{-1}$
.
$\text{m}~\text{s}^{-1}$
.

Figure 16. Average fields at
 $t_{m}=6.13~\text{h}$
for simulation
$t_{m}=6.13~\text{h}$
for simulation
 $C$
(cf. figure 5). The fields displayed from top to bottom are temperature
$C$
(cf. figure 5). The fields displayed from top to bottom are temperature
 $\langle \unicode[STIX]{x1D703}-\unicode[STIX]{x1D703}_{o}\rangle$
with the colour bar in K, followed by down-front current
$\langle \unicode[STIX]{x1D703}-\unicode[STIX]{x1D703}_{o}\rangle$
with the colour bar in K, followed by down-front current
 $\langle v\rangle$
, cross-front current
$\langle v\rangle$
, cross-front current
 $\langle u\rangle$
and vertical velocity
$\langle u\rangle$
and vertical velocity
 $\langle w\rangle$
. Colour bars for the velocity fields are in units of
$\langle w\rangle$
. Colour bars for the velocity fields are in units of
 $\text{m}~\text{s}^{-1}$
.
$\text{m}~\text{s}^{-1}$
.
Broadly, the lifecycles of
 $\text{TKE}(t)$
and
$\text{TKE}(t)$
and
 $\langle w\rangle _{min}(t)$
, statistics evaluated at
$\langle w\rangle _{min}(t)$
, statistics evaluated at
 $x_{p}(t)$
, are similar for each simulation. Notice that
$x_{p}(t)$
, are similar for each simulation. Notice that
 $-\langle w\rangle _{min}$
and
$-\langle w\rangle _{min}$
and
 $\langle \unicode[STIX]{x1D701}\rangle _{p}$
are positively correlated over the entire lifecycle hinting that amplification of vertical vorticity is closely linked to the strength and coherence of the downwelling in the secondary circulation.
$\langle \unicode[STIX]{x1D701}\rangle _{p}$
are positively correlated over the entire lifecycle hinting that amplification of vertical vorticity is closely linked to the strength and coherence of the downwelling in the secondary circulation.
 $\text{TKE}$
and
$\text{TKE}$
and
 $\langle \unicode[STIX]{x1D701}\rangle _{p}$
are temporally well correlated up to
$\langle \unicode[STIX]{x1D701}\rangle _{p}$
are temporally well correlated up to
 $t_{m}$
, but with the maximum TKE slightly time delayed compared to
$t_{m}$
, but with the maximum TKE slightly time delayed compared to
 $\langle \unicode[STIX]{x1D701}\rangle _{p}$
. Quantitatively, the statistics in figure 2 are, however, dependent on the particular external forcing, and thus implicitly on the turbulence.
$\langle \unicode[STIX]{x1D701}\rangle _{p}$
. Quantitatively, the statistics in figure 2 are, however, dependent on the particular external forcing, and thus implicitly on the turbulence.
The four panel plots of the average flow fields
 $\langle \boldsymbol{u},\unicode[STIX]{x1D703}\rangle$
in figures 14–16, and also the line plots in figure 10, highlight the rapid changes to the flow fields that occur during frontogenesis for the different simulations at
$\langle \boldsymbol{u},\unicode[STIX]{x1D703}\rangle$
in figures 14–16, and also the line plots in figure 10, highlight the rapid changes to the flow fields that occur during frontogenesis for the different simulations at
 $t=t_{m}$
. First, when the filament width narrows to
$t=t_{m}$
. First, when the filament width narrows to
 $\ell <100~\text{m}$
, the frontal dynamics, secondary circulations and turbulence act as a closely coupled system. The left and right secondary circulations feedback on each other as they both enhance the central downwelling jet which then further intensifies the surface return currents. The temperature and velocity fields in
$\ell <100~\text{m}$
, the frontal dynamics, secondary circulations and turbulence act as a closely coupled system. The left and right secondary circulations feedback on each other as they both enhance the central downwelling jet which then further intensifies the surface return currents. The temperature and velocity fields in
 $C$
retain their even–odd symmetry about
$C$
retain their even–odd symmetry about
 $x=0$
, but now the secondary circulations are amplified while separated by sharp gradients over a narrow horizontal distance. Steep vertical gradients in the temperature and velocity fields are also observed at the thermocline. Based on figures 14 and 15, (and also 10) we can infer the increasing importance of secondary circulations in CFF with surface winds. Since the wind stress, and hence the far-field Ekman flow, is held constant in time the increased amplitude of the currents left and right of the filament must result from an intensification of the secondary currents. On the right-hand side of the filament the
$x=0$
, but now the secondary circulations are amplified while separated by sharp gradients over a narrow horizontal distance. Steep vertical gradients in the temperature and velocity fields are also observed at the thermocline. Based on figures 14 and 15, (and also 10) we can infer the increasing importance of secondary circulations in CFF with surface winds. Since the wind stress, and hence the far-field Ekman flow, is held constant in time the increased amplitude of the currents left and right of the filament must result from an intensification of the secondary currents. On the right-hand side of the filament the
 $u$
currents in all simulations become more negative under the action of frontogenesis. Thus, the cross-front Ekman flow at
$u$
currents in all simulations become more negative under the action of frontogenesis. Thus, the cross-front Ekman flow at
 $t=t_{m}$
is further inhibited compared to the results at
$t=t_{m}$
is further inhibited compared to the results at
 $t=2~\text{h}$
. The streamfunctions at
$t=2~\text{h}$
. The streamfunctions at
 $t=t_{m}$
, shown in figure 6(b), 7(b) and 8(b), support our hypothesis of boundary-layer-induced horizontal frontogenesis. The secondary cells remain very coherent and elongated in the
$t=t_{m}$
, shown in figure 6(b), 7(b) and 8(b), support our hypothesis of boundary-layer-induced horizontal frontogenesis. The secondary cells remain very coherent and elongated in the
 $x$
direction, and are now confined entirely within the OBL
$x$
direction, and are now confined entirely within the OBL
 $-z<|h|$
; their cross-front separation has also noticeably narrowed. Observe that in simulation
$-z<|h|$
; their cross-front separation has also noticeably narrowed. Observe that in simulation
 $N$
, the cross-front flow from the secondary circulation on the right-hand side of the filament
$N$
, the cross-front flow from the secondary circulation on the right-hand side of the filament
 $x_{p}<x<3000~\text{m}$
opposes and blocks the far-field Ekman flow. Overall these changes in the secondary circulations mimic the intensification in
$x_{p}<x<3000~\text{m}$
opposes and blocks the far-field Ekman flow. Overall these changes in the secondary circulations mimic the intensification in
 $\langle \unicode[STIX]{x1D701}\rangle _{p}$
and furthermore imply an intensification of turbulence according to a TTW balance (5.1), also see § 5.3.
$\langle \unicode[STIX]{x1D701}\rangle _{p}$
and furthermore imply an intensification of turbulence according to a TTW balance (5.1), also see § 5.3.
The secondary circulations also impact the buoyancy (temperature) in the cold filament. Figure 10(d–f) shows that during frontogenesis the cold centre warms from both filament edges, but the amount of warming is asymmetrical for cases driven by surface winds. As might be expected based on the cross-front current profiles, the warming of the left filament edge in
 $E$
and
$E$
and
 $N$
is greater than the warming from the right-hand side. Again this implies that the filament edges are primarily in a regime of (weak) stable stratification for
$N$
is greater than the warming from the right-hand side. Again this implies that the filament edges are primarily in a regime of (weak) stable stratification for
 $(E,N,C)$
. Also, one clearly observes how turbulent mixing has weakened the initial buoyancy anomaly both in terms of its width and strength at
$(E,N,C)$
. Also, one clearly observes how turbulent mixing has weakened the initial buoyancy anomaly both in terms of its width and strength at
 $t=t_{m}$
.
$t=t_{m}$
.
McWilliams et al. (Reference McWilliams, Gula, Molemaker, Renault and Shchepetkin2015) (see (13)) shows that the time tendency of
 $\langle \unicode[STIX]{x1D701}\rangle _{p}$
depends on horizontal advection, and thus we next examine the cross-front variation of the mean horizontal currents and their fluxes in our solutions at time
$\langle \unicode[STIX]{x1D701}\rangle _{p}$
depends on horizontal advection, and thus we next examine the cross-front variation of the mean horizontal currents and their fluxes in our solutions at time
 $t_{m}$
, see figures 10 and 11. As expected, the amplitudes of both horizontal currents undergo amplification left and right of the filament centreline, but the most outstanding feature is the significant sharpening of their cross-front gradients during the onset phase
$t_{m}$
, see figures 10 and 11. As expected, the amplitudes of both horizontal currents undergo amplification left and right of the filament centreline, but the most outstanding feature is the significant sharpening of their cross-front gradients during the onset phase
 $0<t<t_{m}$
. In horizontally induced frontogenesis the cross-front phase relationship between
$0<t<t_{m}$
. In horizontally induced frontogenesis the cross-front phase relationship between
 $\langle u\rangle$
and
$\langle u\rangle$
and
 $\langle v\rangle$
is critical as the currents and secondary circulations contribute to nonlinear horizontal fluxes
$\langle v\rangle$
is critical as the currents and secondary circulations contribute to nonlinear horizontal fluxes
 $\langle u\rangle \langle u\rangle$
and
$\langle u\rangle \langle u\rangle$
and
 $\langle u\rangle \langle v\rangle$
in (5.4a
), (5.4b
). For example, at time
$\langle u\rangle \langle v\rangle$
in (5.4a
), (5.4b
). For example, at time
 $t_{m}$
the currents are in phase such that the fluxes
$t_{m}$
the currents are in phase such that the fluxes
 $\langle u\rangle \langle u\rangle$
and
$\langle u\rangle \langle u\rangle$
and
 $\langle u\rangle \langle v\rangle$
have steep (negative, positive) slopes, respectively, just left of the filament centreline in all three simulations, i.e. the divergences
$\langle u\rangle \langle v\rangle$
have steep (negative, positive) slopes, respectively, just left of the filament centreline in all three simulations, i.e. the divergences
 $-\unicode[STIX]{x2202}_{x}\langle u\rangle \langle u\rangle$
and
$-\unicode[STIX]{x2202}_{x}\langle u\rangle \langle u\rangle$
and
 $-\unicode[STIX]{x2202}_{x}\langle u\rangle \langle v\rangle$
are frontogenetic inducing (positive, negative) time tendencies
$-\unicode[STIX]{x2202}_{x}\langle u\rangle \langle v\rangle$
are frontogenetic inducing (positive, negative) time tendencies
 $\unicode[STIX]{x2202}_{t}\langle u\rangle$
and
$\unicode[STIX]{x2202}_{t}\langle u\rangle$
and
 $\unicode[STIX]{x2202}_{t}\langle v\rangle$
on the left-hand side of the filament. These time tendencies result in positive feedback to the mean currents re-enforcing the frontogenesis. Also observe that the mean co-variance flux
$\unicode[STIX]{x2202}_{t}\langle v\rangle$
on the left-hand side of the filament. These time tendencies result in positive feedback to the mean currents re-enforcing the frontogenesis. Also observe that the mean co-variance flux
 $\langle u\rangle \langle v\rangle$
in simulation
$\langle u\rangle \langle v\rangle$
in simulation
 $C$
is lower in amplitude than in simulation
$C$
is lower in amplitude than in simulation
 $E$
, which at first blush seems counterintuitive given the higher values of
$E$
, which at first blush seems counterintuitive given the higher values of
 $\langle \unicode[STIX]{x1D701}\rangle _{p}$
for
$\langle \unicode[STIX]{x1D701}\rangle _{p}$
for
 $C$
shown in figure 2. However, the cross-front distribution of
$C$
shown in figure 2. However, the cross-front distribution of
 $\langle u\rangle \langle v\rangle$
is identically symmetric in
$\langle u\rangle \langle v\rangle$
is identically symmetric in
 $C$
; this same flux for simulation
$C$
; this same flux for simulation
 $E$
is very asymmetrical. Recall
$E$
is very asymmetrical. Recall
 $\unicode[STIX]{x2202}_{x}\langle u\rangle \langle v\rangle$
impacts
$\unicode[STIX]{x2202}_{x}\langle u\rangle \langle v\rangle$
impacts
 $\unicode[STIX]{x2202}_{t}\langle v\rangle$
and hence indirectly
$\unicode[STIX]{x2202}_{t}\langle v\rangle$
and hence indirectly
 $\langle \unicode[STIX]{x1D701}\rangle _{p}$
. As supporting evidence for our conjecture that mean current flux symmetry is important, we analysed the spatial distribution of the down-front vorticity
$\langle \unicode[STIX]{x1D701}\rangle _{p}$
. As supporting evidence for our conjecture that mean current flux symmetry is important, we analysed the spatial distribution of the down-front vorticity
 $\langle \unicode[STIX]{x1D709}\rangle =(\unicode[STIX]{x2202}_{z}\langle u\rangle -\unicode[STIX]{x2202}_{x}\langle w\rangle )/f$
. We find regions where the magnitude of
$\langle \unicode[STIX]{x1D709}\rangle =(\unicode[STIX]{x2202}_{z}\langle u\rangle -\unicode[STIX]{x2202}_{x}\langle w\rangle )/f$
. We find regions where the magnitude of
 $|\unicode[STIX]{x1D709}|\sim \langle \unicode[STIX]{x1D701}\rangle$
, and with cross-front winds
$|\unicode[STIX]{x1D709}|\sim \langle \unicode[STIX]{x1D701}\rangle$
, and with cross-front winds
 $\unicode[STIX]{x1D709}$
has a larger amplitude on the left side of the filament compared to the right-hand side especially near the water surface. This leads to the speculation that a pair of closely matched secondary circulations of similar amplitude in a warm–cold cold–warm filament is more effective in creating a coherent downwelling jet thus leading to enhanced frontogenetic amplification. In a cold filament, mismatched SC cells of different strength, as created by a cross-front wind, leads to lower values of
$\unicode[STIX]{x1D709}$
has a larger amplitude on the left side of the filament compared to the right-hand side especially near the water surface. This leads to the speculation that a pair of closely matched secondary circulations of similar amplitude in a warm–cold cold–warm filament is more effective in creating a coherent downwelling jet thus leading to enhanced frontogenetic amplification. In a cold filament, mismatched SC cells of different strength, as created by a cross-front wind, leads to lower values of
 $\langle \unicode[STIX]{x1D701}\rangle _{p}$
.
$\langle \unicode[STIX]{x1D701}\rangle _{p}$
.
5.3 Frontal arrest, decay and instability
What is the frontal arrest dynamics? The classic work by Hoskins & Bretherton (Reference Hoskins and Bretherton1972) proposes strain-induced frontogenesis must ultimately be arrested by a spontaneous transition to a Kelvin–Helmholtz (K–H) instability at small scales. The analysis of an LES solution of an unforced growing baroclinic wave by Samelson & Skyllingstad (Reference Samelson and Skyllingstad2016) tends to support this idea, although the authors state the frontal collapse in their solution likely occurs through a combination of explicitly resolved turbulence, enhanced SGS diffusivities and numerical filtering. Taylor & Ferrari (Reference Taylor and Ferrari2009) also conclude a secondary spontaneous K–H instability forms in a symmetrically unstable front. Thomas et al. (Reference Thomas, Ferrari and Joyce2013) and Hamlington et al. (Reference Hamlington, Van Roekel, Fox-Kemper, Julien and Chini2014) are less clear about arrest mechanics, but their analysis seems to implicate convective overturning and symmetric instabilities as the primary mechanisms for arrest. In all these calculations the authors adopt geostrophic balance at leading order, i.e. implicitly they assume weak (negligible) turbulence and downplay the role of the OBL and TTW at the onset. At larger scales, Capet et al. (Reference Capet, McWilliams, Molemaker and Shchepetkin2008) and Gula et al. (Reference Gula, Molemaker and McWilliams2014) analyse several case studies of one-sided fronts and filaments, respectively, and identify submesoscale spatial meandering and vortex fragmentation in the down-front direction. They also quantify the energy transfer dynamics during the frontogenetic arrest and decay, but rely on the KPP boundary-layer mixing scheme. For single-sided fronts (Capet et al.
Reference Capet, McWilliams, Molemaker and Shchepetkin2008) the dominant source of submesoscale perturbation kinetic energy is the conversion of perturbation potential to kinetic energy
 $\langle w^{\prime }b^{\prime }\rangle$
, i.e. a baroclinic instability. Gula et al. (Reference Gula, Molemaker and McWilliams2014) analyse cold filament dynamics, similar to our study, and finds that submesoscale perturbations grow primarily because of horizontal shear, i.e. a barotropic instability. Gula et al. (Reference Gula, Molemaker and McWilliams2014) conclude that the barotropic instability is dominant over the baroclinic instability because of the stronger horizontal gradients induced by a filament compared to a one-sided front.
$\langle w^{\prime }b^{\prime }\rangle$
, i.e. a baroclinic instability. Gula et al. (Reference Gula, Molemaker and McWilliams2014) analyse cold filament dynamics, similar to our study, and finds that submesoscale perturbations grow primarily because of horizontal shear, i.e. a barotropic instability. Gula et al. (Reference Gula, Molemaker and McWilliams2014) conclude that the barotropic instability is dominant over the baroclinic instability because of the stronger horizontal gradients induced by a filament compared to a one-sided front.
In general terms we do not know what controls the arrest scale. It occurs when the frontal instability growth rate exceeds the frontogenetic sharpening rate, as shown for an idealized linear instability problem in McWilliams et al. (Reference McWilliams, Molemaker and Olafsdottir2009b ) where the dominant instability type was baroclinic. Both frontogenesis and inviscid horizontal shear instability are scale-free dynamics.
Our analysis shows turbulence is important for boundary-layer-induced frontogenesis. At early times turbulence appears to stabilize baroclinic wave development at the filament edges, and it initiates potent secondary circulations that lead to frontogenetic sharpening of the horizontal momentum and buoyancy gradients, which continues until an arrest occurs in the OBL in finite time. At
 $t=t_{m}$
, the magnitude of the normalized TKE can exceed 50 times the surface (wind stress, cooling), the downwelling jet near the filament centre reaches its maximum value, and visualization of the flow fields shows the cross-front scale at the time of arrest shrinks to
$t=t_{m}$
, the magnitude of the normalized TKE can exceed 50 times the surface (wind stress, cooling), the downwelling jet near the filament centre reaches its maximum value, and visualization of the flow fields shows the cross-front scale at the time of arrest shrinks to
 $O(100~\text{m})$
or less. The results also show the growth of the TKE does not appear space–time episodic as might occur in a K–H instability. Admittedly averaging can disguise local events, but the TKE in figure 2 appears to grow rapidly but continuously in time from its initial state. Recall, the turbulence dynamics at 100 m scale is well resolved in our simulations as the horizontal and vertical resolutions are fine
$O(100~\text{m})$
or less. The results also show the growth of the TKE does not appear space–time episodic as might occur in a K–H instability. Admittedly averaging can disguise local events, but the TKE in figure 2 appears to grow rapidly but continuously in time from its initial state. Recall, the turbulence dynamics at 100 m scale is well resolved in our simulations as the horizontal and vertical resolutions are fine
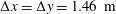 $\unicode[STIX]{x0394}x=\unicode[STIX]{x0394}y=1.46~\text{m}$
and
$\unicode[STIX]{x0394}x=\unicode[STIX]{x0394}y=1.46~\text{m}$
and
 $\unicode[STIX]{x0394}z\sim O(0.5~\text{m})$
.
$\unicode[STIX]{x0394}z\sim O(0.5~\text{m})$
.

Figure 17. Space–time evolution of turbulent down-front velocity
 $v^{\prime }/u_{\ast }$
from simulation
$v^{\prime }/u_{\ast }$
from simulation
 $E$
with cross-front winds at
$E$
with cross-front winds at
 $z=-1.25~\text{m}$
. Time increases from (a) to (d),
$z=-1.25~\text{m}$
. Time increases from (a) to (d),
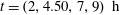 $t=(2,4.50,7,9)~\text{h}$
with the time of maximum vertical vorticity
$t=(2,4.50,7,9)~\text{h}$
with the time of maximum vertical vorticity
 $t_{m}=4.50~\text{h}$
shown in (b). The images are centred on the cross-front location
$t_{m}=4.50~\text{h}$
shown in (b). The images are centred on the cross-front location
 $x_{p}$
of the peak vertical vorticity, which drifts to the east with increasing time. The range of the colour bar and the extent of the
$x_{p}$
of the peak vertical vorticity, which drifts to the east with increasing time. The range of the colour bar and the extent of the
 $x$
axis are chosen to highlight the turbulent boundary-layer streaks that are present left and right of the cold filament axis. The aspect ratio of the images is not unity as the
$x$
axis are chosen to highlight the turbulent boundary-layer streaks that are present left and right of the cold filament axis. The aspect ratio of the images is not unity as the
 $y$
scale is greater than the
$y$
scale is greater than the
 $x$
scale. Notice at
$x$
scale. Notice at
 $x=x_{p}$
the scale of the down-front fluctuations grows for
$x=x_{p}$
the scale of the down-front fluctuations grows for
 $t>t_{m}$
in figures 17–19.
$t>t_{m}$
in figures 17–19.

Figure 18. Space–time evolution of turbulent down-front velocity
 $v^{\prime }/u_{\ast }$
from simulation
$v^{\prime }/u_{\ast }$
from simulation
 $N$
with down-front winds at
$N$
with down-front winds at
 $z=-1.25~\text{m}$
. Time increases from (a) to (d),
$z=-1.25~\text{m}$
. Time increases from (a) to (d),
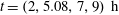 $t=(2,5.08,7,9)~\text{h}$
with the time of maximum vertical vorticity
$t=(2,5.08,7,9)~\text{h}$
with the time of maximum vertical vorticity
 $t_{m}=5.08~\text{h}$
shown in (b). The images are centred on the cross-front location
$t_{m}=5.08~\text{h}$
shown in (b). The images are centred on the cross-front location
 $x_{p}$
of the peak vertical vorticity, which drifts to the east with increasing time. The range of the colour bar and the extent of the
$x_{p}$
of the peak vertical vorticity, which drifts to the east with increasing time. The range of the colour bar and the extent of the
 $x$
axis are chosen to highlight the turbulent boundary-layer streaks that are present left and right of the cold filament axis. The aspect ratio of the images is not unity as the
$x$
axis are chosen to highlight the turbulent boundary-layer streaks that are present left and right of the cold filament axis. The aspect ratio of the images is not unity as the
 $y$
scale is greater than the
$y$
scale is greater than the
 $x$
scale.
$x$
scale.

Figure 19. Space–time evolution of turbulent down-front velocity
 $v^{\prime }/u_{\ast }$
from simulation
$v^{\prime }/u_{\ast }$
from simulation
 $C$
driven by cooling at
$C$
driven by cooling at
 $z=-1.25~\text{m}$
. Time increases from (a) to (d),
$z=-1.25~\text{m}$
. Time increases from (a) to (d),
 $t=(2,6.25,7,9)~\text{h}$
with the time of maximum vertical vorticity
$t=(2,6.25,7,9)~\text{h}$
with the time of maximum vertical vorticity
 $t_{m}=6.25~\text{h}$
shown in (b). The images are centred on the cross-front location
$t_{m}=6.25~\text{h}$
shown in (b). The images are centred on the cross-front location
 $x_{p}\sim 0$
of the peak vertical vorticity for simulation
$x_{p}\sim 0$
of the peak vertical vorticity for simulation
 $C$
. The range of the colour bar and the extent of the
$C$
. The range of the colour bar and the extent of the
 $x$
axis are chosen to highlight the development of the lateral instability. The aspect ratio of the images is not unity as the
$x$
axis are chosen to highlight the development of the lateral instability. The aspect ratio of the images is not unity as the
 $y$
scale is greater than the
$y$
scale is greater than the
 $x$
scale.
$x$
scale.
In our computations, the arresting turbulence appears to originate with the fluctuating down-front current
 $v^{\prime }$
. As examples, the space–time evolution of
$v^{\prime }$
. As examples, the space–time evolution of
 $v^{\prime }$
at
$v^{\prime }$
at
 $z=-1.25~\text{m}$
over the time period
$z=-1.25~\text{m}$
over the time period
 $2<t<9~\text{h}$
for simulations
$2<t<9~\text{h}$
for simulations
 $(E,N,C)$
is depicted in figures 17–19, respectively. Each panel shows contours over the entire
$(E,N,C)$
is depicted in figures 17–19, respectively. Each panel shows contours over the entire
 $y$
domain, but in a narrow
$y$
domain, but in a narrow
 $x$
strip centred on the front location
$x$
strip centred on the front location
 $x_{p}$
; recall
$x_{p}$
; recall
 $x_{p}$
drifts to the east with increasing time for
$x_{p}$
drifts to the east with increasing time for
 $(E,N)$
as shown in figure 2. Inspection of the images shows the expected boundary-layer turbulence at an early time
$(E,N)$
as shown in figure 2. Inspection of the images shows the expected boundary-layer turbulence at an early time
 $t=2~\text{h}$
. For example, in
$t=2~\text{h}$
. For example, in
 $(E,N)$
the fluctuation extremes relative to
$(E,N)$
the fluctuation extremes relative to
 $u_{\ast }$
are modest,
$u_{\ast }$
are modest,
 $|v^{\prime }|/u_{\ast }\leqslant 3$
and the west–east
$|v^{\prime }|/u_{\ast }\leqslant 3$
and the west–east
 $(E)$
and south–north
$(E)$
and south–north
 $(N)$
elongated patterns of scale
$(N)$
elongated patterns of scale
 $\ell _{y}\leqslant 100~\text{m}$
are the signatures of coherent low-speed streaks typical of a wall-bounded turbulent flow (Sullivan, McWilliams & Melville Reference Sullivan, McWilliams and Melville2004; Adrian Reference Adrian2007). In
$\ell _{y}\leqslant 100~\text{m}$
are the signatures of coherent low-speed streaks typical of a wall-bounded turbulent flow (Sullivan, McWilliams & Melville Reference Sullivan, McWilliams and Melville2004; Adrian Reference Adrian2007). In
 $C$
, convective plumes are the dominant coherent structure similar to the atmospheric boundary layer (e.g. Schmidt & Schumann Reference Schmidt and Schumann1989; Sullivan & Patton Reference Sullivan and Patton2011) and near the surface they are arranged in a spoke-like pattern (not shown) with the amplitude of the horizontal velocity components
$C$
, convective plumes are the dominant coherent structure similar to the atmospheric boundary layer (e.g. Schmidt & Schumann Reference Schmidt and Schumann1989; Sullivan & Patton Reference Sullivan and Patton2011) and near the surface they are arranged in a spoke-like pattern (not shown) with the amplitude of the horizontal velocity components
 $|u^{\prime },v^{\prime }|/w_{\ast }\leqslant 1$
.
$|u^{\prime },v^{\prime }|/w_{\ast }\leqslant 1$
.
At
 $t\geqslant t_{m}$
, the amplitude and patterns in all simulations are dramatically changed under the vigorous action of sharpening horizontal gradients
$t\geqslant t_{m}$
, the amplitude and patterns in all simulations are dramatically changed under the vigorous action of sharpening horizontal gradients
 $\unicode[STIX]{x2202}_{x}\langle u,v\rangle$
. The fluctuation extremes in
$\unicode[STIX]{x2202}_{x}\langle u,v\rangle$
. The fluctuation extremes in
 $(E,N)$
relative to
$(E,N)$
relative to
 $u_{\ast }$
are large
$u_{\ast }$
are large
 $|v^{\prime }|/u_{\ast }\geqslant 5$
, and in
$|v^{\prime }|/u_{\ast }\geqslant 5$
, and in
 $C$
$C$
 $|v^{\prime }|/w_{\ast }\geqslant 5$
. The orientation of the fluctuations in
$|v^{\prime }|/w_{\ast }\geqslant 5$
. The orientation of the fluctuations in
 $N$
is clearly in the down-front direction, but surprisingly the scale of the fluctuations differs noticeably left and right of the filament centreline. For all simulations the horizontal scales of the fluctuations near the filament centreline are strongly anisotropic with
$N$
is clearly in the down-front direction, but surprisingly the scale of the fluctuations differs noticeably left and right of the filament centreline. For all simulations the horizontal scales of the fluctuations near the filament centreline are strongly anisotropic with
 $\ell _{y}>\ell _{x}$
; note the scales in figures 17–19 are distorted by the non-unity vertical–horizontal aspect ratio. Extensive visualization and analysis of the flow fields shows that for
$\ell _{y}>\ell _{x}$
; note the scales in figures 17–19 are distorted by the non-unity vertical–horizontal aspect ratio. Extensive visualization and analysis of the flow fields shows that for
 $t>t_{m}$
,
$t>t_{m}$
,
 $v^{\prime }$
exhibits a similar spatially growing down-front instability irrespective of the surface wind direction and forcing type. This is confirmed by 1-D power spectra computed for varying down-front wavenumber
$v^{\prime }$
exhibits a similar spatially growing down-front instability irrespective of the surface wind direction and forcing type. This is confirmed by 1-D power spectra computed for varying down-front wavenumber
 $k_{y}$
. As the images show, in the early period
$k_{y}$
. As the images show, in the early period
 $0<t<t_{m}$
the development of CFF is dependent on the state of the incoming turbulence, and the orientation of the coherent structures relative to the secondary circulations. Further analysis of frontal turbulence and its interaction with the down-front instability and homogeneous OBL turbulence is reported in Sullivan & McWilliams (Reference Sullivan and McWilliams2017). The developing down-front instability in the LES solutions is similar to that observed by Gula et al. (Reference Gula, Molemaker and McWilliams2014) and predicted using a linear model by McWilliams et al. (Reference McWilliams, Molemaker and Olafsdottir2009b
) (note that whether the frontogenetic instability is primarily due to vertical or horizontal shear depends on the frontal shape).
$0<t<t_{m}$
the development of CFF is dependent on the state of the incoming turbulence, and the orientation of the coherent structures relative to the secondary circulations. Further analysis of frontal turbulence and its interaction with the down-front instability and homogeneous OBL turbulence is reported in Sullivan & McWilliams (Reference Sullivan and McWilliams2017). The developing down-front instability in the LES solutions is similar to that observed by Gula et al. (Reference Gula, Molemaker and McWilliams2014) and predicted using a linear model by McWilliams et al. (Reference McWilliams, Molemaker and Olafsdottir2009b
) (note that whether the frontogenetic instability is primarily due to vertical or horizontal shear depends on the frontal shape).
Our interpretation of the arresting dynamics is guided by flow visualization, as in figures 17–19 and the down-front average equations. Examination of (5.4) shows the candidate terms responsible for arresting the frontogenetic tendencies
 $\unicode[STIX]{x2202}_{t}\langle u,v\rangle$
are horizontal turbulent currents
$\unicode[STIX]{x2202}_{t}\langle u,v\rangle$
are horizontal turbulent currents
 $(u^{\prime },v^{\prime })$
, and specifically the cross-front divergences of horizontal turbulent variances and co-variances
$(u^{\prime },v^{\prime })$
, and specifically the cross-front divergences of horizontal turbulent variances and co-variances
 $-\unicode[STIX]{x2202}_{x}\langle u^{\prime }u^{\prime }\rangle$
and
$-\unicode[STIX]{x2202}_{x}\langle u^{\prime }u^{\prime }\rangle$
and
 $-\unicode[STIX]{x2202}_{x}\langle u^{\prime }v^{\prime }\rangle$
. Selected low-order statistics of the horizontal and vertical fluctuations for the time period
$-\unicode[STIX]{x2202}_{x}\langle u^{\prime }v^{\prime }\rangle$
. Selected low-order statistics of the horizontal and vertical fluctuations for the time period
 $t>t_{m}$
for
$t>t_{m}$
for
 $(E,N,C)$
are compared in figures 20–22.
$(E,N,C)$
are compared in figures 20–22.

Figure 20. Average horizontal turbulent variance
 $\langle u^{\prime }u^{\prime }\rangle$
(a,c,e) and co-variance
$\langle u^{\prime }u^{\prime }\rangle$
(a,c,e) and co-variance
 $\langle u^{\prime }v^{\prime }\rangle$
(b,d,f) for simulations
$\langle u^{\prime }v^{\prime }\rangle$
(b,d,f) for simulations
 $(E,N,C)$
at the time of maximum vertical vorticity in figure 2. The variances are normalized by
$(E,N,C)$
at the time of maximum vertical vorticity in figure 2. The variances are normalized by
 $(u_{\ast }^{2},u_{\ast }^{2},w_{\ast }^{2})$
, respectively. The horizontal axis is referenced to the location of maximum vertical vorticity
$(u_{\ast }^{2},u_{\ast }^{2},w_{\ast }^{2})$
, respectively. The horizontal axis is referenced to the location of maximum vertical vorticity
 $x_{p}(t_{m})$
for each simulation. Note a wider
$x_{p}(t_{m})$
for each simulation. Note a wider
 $x$
range is used for simulation
$x$
range is used for simulation
 $E$
.
$E$
.

Figure 21. Variances
 $\langle u^{\prime }u^{\prime },v^{\prime }v^{\prime },w^{\prime }w^{\prime }\rangle /u_{\ast }^{2}$
denoted by (red, blue, black) lines, respectively, at the time and location of peak average vertical vorticity in figure 2. The thin vertical line in each panel marks the time of maximum vertical vorticity. The variances are normalized by
$\langle u^{\prime }u^{\prime },v^{\prime }v^{\prime },w^{\prime }w^{\prime }\rangle /u_{\ast }^{2}$
denoted by (red, blue, black) lines, respectively, at the time and location of peak average vertical vorticity in figure 2. The thin vertical line in each panel marks the time of maximum vertical vorticity. The variances are normalized by
 $(u_{\ast }^{2},u_{\ast }^{2},w_{\ast }^{2})$
for simulations
$(u_{\ast }^{2},u_{\ast }^{2},w_{\ast }^{2})$
for simulations
 $(E,N,C)$
, respectively. ((a–c), (d–f)) Correspond to vertical averages over 5 m centred on
$(E,N,C)$
, respectively. ((a–c), (d–f)) Correspond to vertical averages over 5 m centred on
 $z=-(2.5,30)~\text{m}$
, respectively.
$z=-(2.5,30)~\text{m}$
, respectively.

Figure 22. Co-variances
 $-\langle u^{\prime }v^{\prime },u^{\prime }w^{\prime },v^{\prime }w^{\prime }\rangle$
denoted by (black, red, blue) lines, respectively, at the time and location of peak average vertical vorticity in figure 2. The thin vertical line in each panel marks the time of maximum vertical vorticity. The co-variances are normalized by
$-\langle u^{\prime }v^{\prime },u^{\prime }w^{\prime },v^{\prime }w^{\prime }\rangle$
denoted by (black, red, blue) lines, respectively, at the time and location of peak average vertical vorticity in figure 2. The thin vertical line in each panel marks the time of maximum vertical vorticity. The co-variances are normalized by
 $(u_{\ast }^{2},u_{\ast }^{2},w_{\ast }^{2})$
for simulations
$(u_{\ast }^{2},u_{\ast }^{2},w_{\ast }^{2})$
for simulations
 $(E,N,C)$
, respectively. ((a–c), (d–f)) Correspond to vertical averages over 5 m centred on
$(E,N,C)$
, respectively. ((a–c), (d–f)) Correspond to vertical averages over 5 m centred on
 $z=-(2.5,30)~\text{m}$
, respectively. Note the different scale range of the vertical axis in the upper and lower panels.
$z=-(2.5,30)~\text{m}$
, respectively. Note the different scale range of the vertical axis in the upper and lower panels.
The amplitude and
 $x{-}z$
spatial patterns of
$x{-}z$
spatial patterns of
 $\langle u^{\prime }u^{\prime },u^{\prime }v^{\prime }\rangle$
at the time of maximum vertical vorticity are shown in figure 20; each contour plot is a zoom centred on
$\langle u^{\prime }u^{\prime },u^{\prime }v^{\prime }\rangle$
at the time of maximum vertical vorticity are shown in figure 20; each contour plot is a zoom centred on
 $x-x_{p}$
over the mixed layer. The horizontal variances and co-variances are spatially coherent in the
$x-x_{p}$
over the mixed layer. The horizontal variances and co-variances are spatially coherent in the
 $x{-}z$
plane spanning the depth of the mixed layer but with a cross-front width dependent on the forcing. The maximum values near the water surface are more than an order of magnitude larger than
$x{-}z$
plane spanning the depth of the mixed layer but with a cross-front width dependent on the forcing. The maximum values near the water surface are more than an order of magnitude larger than
 $u_{\ast }^{2}$
(for
$u_{\ast }^{2}$
(for
 $E$
and
$E$
and
 $N$
) or
$N$
) or
 $w_{\ast }^{2}$
(for
$w_{\ast }^{2}$
(for
 $C$
). Visual comparison of the contours shows that the magnitude and spatial distribution of the horizontal variances and co-variances for simulations
$C$
). Visual comparison of the contours shows that the magnitude and spatial distribution of the horizontal variances and co-variances for simulations
 $N$
and
$N$
and
 $C$
are much more similar compared to
$C$
are much more similar compared to
 $E$
; noticeable differences are the cross-front extent of the arrest is 100 m or less for
$E$
; noticeable differences are the cross-front extent of the arrest is 100 m or less for
 $(N,C)$
while it is greater than 300 m for
$(N,C)$
while it is greater than 300 m for
 $E$
. Also
$E$
. Also
 $\langle u^{\prime }u^{\prime }\rangle$
is noticeably larger in
$\langle u^{\prime }u^{\prime }\rangle$
is noticeably larger in
 $E$
compared to
$E$
compared to
 $(N,C)$
, whereas the co-variance
$(N,C)$
, whereas the co-variance
 $\langle u^{\prime }v^{\prime }\rangle$
is more important for
$\langle u^{\prime }v^{\prime }\rangle$
is more important for
 $(N,C)$
at
$(N,C)$
at
 $t=t_{m}$
. These differences are a consequence of the mismatched secondary circulations in
$t=t_{m}$
. These differences are a consequence of the mismatched secondary circulations in
 $E$
and the state of the incoming turbulence. The secondary circulations and Ekman currents are additive on the left side of the filament in
$E$
and the state of the incoming turbulence. The secondary circulations and Ekman currents are additive on the left side of the filament in
 $E$
with a maximum left of
$E$
with a maximum left of
 $x_{p}$
, which leads to enhanced
$x_{p}$
, which leads to enhanced
 $\langle u^{\prime }u^{\prime }\rangle$
, see § 5.4.
$\langle u^{\prime }u^{\prime }\rangle$
, see § 5.4.
Figures 21 and 22, which are companions to figure 2, compare time series of the three component variances
 $\langle u^{\prime 2},v^{\prime 2},w^{\prime 2}\rangle$
of the TKE, and the horizontal and vertical co-variances
$\langle u^{\prime 2},v^{\prime 2},w^{\prime 2}\rangle$
of the TKE, and the horizontal and vertical co-variances
 $\langle u^{\prime }v^{\prime },u^{\prime }w^{\prime },v^{\prime }w^{\prime }\rangle$
. The time series are collected near the water surface
$\langle u^{\prime }v^{\prime },u^{\prime }w^{\prime },v^{\prime }w^{\prime }\rangle$
. The time series are collected near the water surface
 $z=-2.5$
and in the mid-OBL
$z=-2.5$
and in the mid-OBL
 $z=-30~\text{m}$
; in addition to
$z=-30~\text{m}$
; in addition to
 $y$
averaging the statistics are further smoothed by averaging over a 5 m depth. At
$y$
averaging the statistics are further smoothed by averaging over a 5 m depth. At
 $t=t_{m}$
and beyond, the elevated TKE shown in figure 2 is clearly dominated by horizontal variances, especially near the water surface where the vertical variance
$t=t_{m}$
and beyond, the elevated TKE shown in figure 2 is clearly dominated by horizontal variances, especially near the water surface where the vertical variance
 $\langle w^{\prime 2}\rangle$
is at least one order of magnitude smaller than
$\langle w^{\prime 2}\rangle$
is at least one order of magnitude smaller than
 $\langle v^{\prime 2}\rangle$
and
$\langle v^{\prime 2}\rangle$
and
 $\langle u^{\prime 2}\rangle$
. The horizontal variances are nearly 50 times larger than the wind stress in
$\langle u^{\prime 2}\rangle$
. The horizontal variances are nearly 50 times larger than the wind stress in
 $(E,N)$
. There are important time trend differences between the horizontal and vertical variances. Notice that
$(E,N)$
. There are important time trend differences between the horizontal and vertical variances. Notice that
 $\langle w^{\prime }w^{\prime }\rangle$
, near the water surface and at mid-depth, tends to closely track the variation of the vertical vorticity reaching a maximum value at
$\langle w^{\prime }w^{\prime }\rangle$
, near the water surface and at mid-depth, tends to closely track the variation of the vertical vorticity reaching a maximum value at
 $t_{m}$
followed by a steady decay for
$t_{m}$
followed by a steady decay for
 $t>t_{m}$
. This is anticipated based on the variation of the minimum vertical velocity shown in figure 13 as the central downwelling jet of the secondary circulations reaches its maximum strength at
$t>t_{m}$
. This is anticipated based on the variation of the minimum vertical velocity shown in figure 13 as the central downwelling jet of the secondary circulations reaches its maximum strength at
 $t=t_{m}$
and subsequently decays. Meanwhile, the horizontal variances increase rapidly during the frontogenetic onset, reach a maximum near
$t=t_{m}$
and subsequently decays. Meanwhile, the horizontal variances increase rapidly during the frontogenetic onset, reach a maximum near
 $t_{m}$
, and then
$t_{m}$
, and then
 $v^{\prime 2}$
decays slowly. These trends follow the growing instability in the down-front current (figures 17–19), which emerges from the arrest process. The (increased, decreased) levels of (vertical, horizontal) variance in the mid-OBL compared to their counterparts near the surface suggest that there is energy transfer from horizontal to vertical components in the interior of the mixed layer.
$v^{\prime 2}$
decays slowly. These trends follow the growing instability in the down-front current (figures 17–19), which emerges from the arrest process. The (increased, decreased) levels of (vertical, horizontal) variance in the mid-OBL compared to their counterparts near the surface suggest that there is energy transfer from horizontal to vertical components in the interior of the mixed layer.
Time traces of the co-variance fluxes near the water surface and also in mid-OBL are shown in figure 22. At
 $t=0$
and during the early period of the frontogenetic onset, the normalized vertical momentum fluxes
$t=0$
and during the early period of the frontogenetic onset, the normalized vertical momentum fluxes
 $\langle u^{\prime }w^{\prime },v^{\prime }w^{\prime }\rangle$
are order unity (e.g. figure 9) while the horizontal co-variance
$\langle u^{\prime }w^{\prime },v^{\prime }w^{\prime }\rangle$
are order unity (e.g. figure 9) while the horizontal co-variance
 $\langle u^{\prime }v^{\prime }\rangle \sim 0$
. These values are typical for a spatially horizontally homogeneous OBL where the uniform surface forcing largely dictates the vertical transport (e.g. McWilliams et al.
Reference McWilliams, Sullivan and Moeng1997). As
$\langle u^{\prime }v^{\prime }\rangle \sim 0$
. These values are typical for a spatially horizontally homogeneous OBL where the uniform surface forcing largely dictates the vertical transport (e.g. McWilliams et al.
Reference McWilliams, Sullivan and Moeng1997). As
 $t\rightarrow t_{m}$
, the co-variance
$t\rightarrow t_{m}$
, the co-variance
 $\langle u^{\prime }v^{\prime }\rangle$
grows appreciably, and at
$\langle u^{\prime }v^{\prime }\rangle$
grows appreciably, and at
 $t=t_{m}$
it is clearly the dominant momentum flux with a normalized value
$t=t_{m}$
it is clearly the dominant momentum flux with a normalized value
 ${\sim}10$
in all simulations. Meanwhile, the vertical momentum fluxes
${\sim}10$
in all simulations. Meanwhile, the vertical momentum fluxes
 $\langle u^{\prime }w^{\prime },v^{\prime }w^{\prime }\rangle$
, remain nearly an order of magnitude smaller depending on the vertical location in the mixed layer.
$\langle u^{\prime }w^{\prime },v^{\prime }w^{\prime }\rangle$
, remain nearly an order of magnitude smaller depending on the vertical location in the mixed layer.
Flow visualization confirms that in the decay period the co-variance
 $\langle u^{\prime }v^{\prime }\rangle$
is spatially coherent, filling the upper 1/3 of the mixed layer. The large net negative values of horizontal flux at
$\langle u^{\prime }v^{\prime }\rangle$
is spatially coherent, filling the upper 1/3 of the mixed layer. The large net negative values of horizontal flux at
 $t\geqslant t_{m}$
result from well-organized anti-correlated turbulent fluctuations between
$t\geqslant t_{m}$
result from well-organized anti-correlated turbulent fluctuations between
 $u^{\prime }$
and
$u^{\prime }$
and
 $v^{\prime }$
, i.e. the large-scale fluctuations in figures 17–19 are not signatures of horizontal wave disturbances.
$v^{\prime }$
, i.e. the large-scale fluctuations in figures 17–19 are not signatures of horizontal wave disturbances.

Figure 23. Mean kinetic energy and TKE conversion terms averaged over the upper 40 m of the OBL at
 $t=t_{m}$
for cases
$t=t_{m}$
for cases
 $(E,N,C)$
. In each panel,
$(E,N,C)$
. In each panel,
 ${\mathcal{P}}_{\bot }$
is the black line,
${\mathcal{P}}_{\bot }$
is the black line,
 ${\mathcal{P}}_{\Vert }$
is the blue line,
${\mathcal{P}}_{\Vert }$
is the blue line,
 $B_{m}$
is the orange line and
$B_{m}$
is the orange line and
 $B_{t}$
is the green line. In
$B_{t}$
is the green line. In
 $N$
, the maximum value of
$N$
, the maximum value of
 $B_{m}\times 0.005\sim 4.54$
. Terms are normalized in
$B_{m}\times 0.005\sim 4.54$
. Terms are normalized in
 $(E,N)$
by
$(E,N)$
by
 $u_{\ast }^{3}/|h_{i}|$
and in
$u_{\ast }^{3}/|h_{i}|$
and in
 $C$
by
$C$
by
 $w_{\ast }^{3}/|h_{i}|$
. The location of peak vertical vorticity
$w_{\ast }^{3}/|h_{i}|$
. The location of peak vertical vorticity
 $x_{p}\sim (354,845,0)~\text{m}$
for
$x_{p}\sim (354,845,0)~\text{m}$
for
 $(E,N,C)$
, respectively.
$(E,N,C)$
, respectively.
5.4 Eddy mean energetics
For the range of scales considered in our simulations, the turbulence is three-dimensional and the energy cascade is forward, i.e. downscale. This is supported by the computation of 1-D power spectra (not shown). To further investigate the energy cascade in physical space and uncover the source of the elevated turbulence in figures 21 and 22 we next examine terms in the mean kinetic energy and TKE equations (e.g. Tennekes & Lumley Reference Tennekes and Lumley1972, p. 59). The mean kinetic energy equation is constructed using standard steps by expanding the dot product
 $\langle \boldsymbol{u}\rangle \boldsymbol{\cdot }\unicode[STIX]{x2202}_{t}\langle \boldsymbol{u}\rangle$
; here the time tendency of the mean flow is given by (4.3). Neglecting SGS terms but including buoyancy, the LES resolved-scale mean kinetic energy equation is
$\langle \boldsymbol{u}\rangle \boldsymbol{\cdot }\unicode[STIX]{x2202}_{t}\langle \boldsymbol{u}\rangle$
; here the time tendency of the mean flow is given by (4.3). Neglecting SGS terms but including buoyancy, the LES resolved-scale mean kinetic energy equation is
 $$\begin{eqnarray}\frac{\unicode[STIX]{x2202}}{\unicode[STIX]{x2202}t}\frac{\langle u_{i}\rangle \langle u_{i}\rangle }{2}=-\langle u_{j}\rangle \frac{\unicode[STIX]{x2202}}{\unicode[STIX]{x2202}x_{j}}\frac{\langle u_{i}\rangle \langle u_{i}\rangle }{2}+\frac{\unicode[STIX]{x2202}}{\unicode[STIX]{x2202}x_{j}}\langle u_{i}\rangle \unicode[STIX]{x1D70E}_{ij}-\unicode[STIX]{x1D70E}_{ij}\unicode[STIX]{x1D61A}_{ij}+\langle w\rangle \langle b\rangle ,\end{eqnarray}$$
where the total stress and strain tensors are, respectively,
 $$\begin{eqnarray}\unicode[STIX]{x1D70E}_{ij}=-\frac{\langle p\rangle }{\unicode[STIX]{x1D70C}_{o}}\unicode[STIX]{x1D6FF}_{ij}-\langle u_{i}^{\prime }u_{j}^{\prime }\rangle \quad \text{and}\quad \unicode[STIX]{x1D61A}_{ij}=\frac{1}{2}\left(\frac{\unicode[STIX]{x2202}\langle u_{i}\rangle }{\unicode[STIX]{x2202}x_{j}}+\frac{\unicode[STIX]{x2202}\langle u_{j}\rangle }{\unicode[STIX]{x2202}x_{i}}\right).\end{eqnarray}$$
In (5.5),
 $$\begin{eqnarray}B_{m}=\langle w\rangle \langle b\rangle\end{eqnarray}$$
represents the conversion between filament mean potential energy and mean kinetic energy while the transfer of mean kinetic energy to turbulence is accomplished by resolved turbulent shear stresses acting on mean gradients, i.e. by turbulence production
 $$\begin{eqnarray}{\mathcal{P}}=-\langle u_{i}^{\prime }u_{j}^{\prime }\rangle \unicode[STIX]{x1D61A}_{ij}.\end{eqnarray}$$
 ${\mathcal{P}}$
, of course, is a sink in (5.5) but a source in the TKE equation.
${\mathcal{P}}$
, of course, is a sink in (5.5) but a source in the TKE equation.
Because our mean flow is spatially inhomogeneous in
 $(x,z)$
, the production given by (5.8) can be further partitioned into horizontal (vertical) shear contributions
$(x,z)$
, the production given by (5.8) can be further partitioned into horizontal (vertical) shear contributions
 ${\mathcal{P}}_{\bot }({\mathcal{P}}_{\Vert })$
, respectively:
${\mathcal{P}}_{\bot }({\mathcal{P}}_{\Vert })$
, respectively:
 $$\begin{eqnarray}\displaystyle & \displaystyle {\mathcal{P}}_{\bot }=-(\langle u^{\prime }u^{\prime }\rangle \unicode[STIX]{x2202}_{x}\langle u\rangle +\langle u^{\prime }v^{\prime }\rangle \unicode[STIX]{x2202}_{x}\langle v\rangle +\langle u^{\prime }w^{\prime }\rangle \unicode[STIX]{x2202}_{x}\langle w\rangle ), & \displaystyle\end{eqnarray}$$
 $$\begin{eqnarray}\displaystyle & \displaystyle {\mathcal{P}}_{\Vert }=-(\langle u^{\prime }w^{\prime }\rangle \unicode[STIX]{x2202}_{z}\langle u\rangle +\langle v^{\prime }w^{\prime }\rangle \unicode[STIX]{x2202}_{z}\langle v\rangle +\langle w^{\prime }w^{\prime }\rangle \unicode[STIX]{x2202}_{z}\langle w\rangle ). & \displaystyle\end{eqnarray}$$
 $$\begin{eqnarray}B_{t}=\langle w^{\prime }b^{\prime }\rangle\end{eqnarray}$$
represents the conversion of fluctuating potential energy to TKE and can be either a source or sink for TKE in stratified flows. Viscous dissipation, which is parameterized in high Reynolds number LES (e.g. Deardorff Reference Deardorff and Haugen1972b
; Moeng & Wyngaard Reference Moeng and Wyngaard1988), is the final sink of TKE. Gula et al. (Reference Gula, Molemaker and McWilliams2014) analyses the energy conversion terms in (5.7), (5.9) and (5.10) using the KKP mixing scheme but neglects the contributions from the spatial gradients of
 $\langle w\rangle$
in (5.9) consistent with the hydrostatic assumption used in ROMS.
$\langle w\rangle$
in (5.9) consistent with the hydrostatic assumption used in ROMS.
Selected kinetic energy conversion terms are shown in figure 23 for simulations
 $(E,N,C)$
at
$(E,N,C)$
at
 $t=t_{m}$
near the filament centreline
$t=t_{m}$
near the filament centreline
 $x_{p}$
. These bulk statistics are averaged over the upper 40 m of the OBL where turbulence is mainly produced as shown in figure 20. In all simulations, the filament gains mean kinetic energy from the conversion term
$x_{p}$
. These bulk statistics are averaged over the upper 40 m of the OBL where turbulence is mainly produced as shown in figure 20. In all simulations, the filament gains mean kinetic energy from the conversion term
 $B_{m}$
. And mean kinetic energy is converted into TKE primarily through shear production
$B_{m}$
. And mean kinetic energy is converted into TKE primarily through shear production
 ${\mathcal{P}}$
. Turbulent buoyant production
${\mathcal{P}}$
. Turbulent buoyant production
 $B_{t}$
is both small and generally negative, i.e. turbulence does not appear to grow because of baroclinic instabilities.
$B_{t}$
is both small and generally negative, i.e. turbulence does not appear to grow because of baroclinic instabilities.
Detailed inspection of the spatial
 $x{-}z$
distribution of all six production terms in (5.9) shows that in
$x{-}z$
distribution of all six production terms in (5.9) shows that in
 $(N,C)$
TKE is mainly produced by horizontal shear production
$(N,C)$
TKE is mainly produced by horizontal shear production
 ${\mathcal{P}}_{\bot }\approx -\langle u^{\prime }v^{\prime }\rangle \unicode[STIX]{x2202}_{x}\langle v\rangle$
, i.e. by a barotropic instability. A similar result is reported by Gula et al. (Reference Gula, Molemaker and McWilliams2014). In our simulations,
${\mathcal{P}}_{\bot }\approx -\langle u^{\prime }v^{\prime }\rangle \unicode[STIX]{x2202}_{x}\langle v\rangle$
, i.e. by a barotropic instability. A similar result is reported by Gula et al. (Reference Gula, Molemaker and McWilliams2014). In our simulations,
 ${\mathcal{P}}_{\bot }$
is concentrated in a narrow horizontal zone centred on
${\mathcal{P}}_{\bot }$
is concentrated in a narrow horizontal zone centred on
 $x_{p}$
, is a maximum at the water surface, and smoothly decays with depth tending towards zero for
$x_{p}$
, is a maximum at the water surface, and smoothly decays with depth tending towards zero for
 $z<-30~\text{m}$
. Also,
$z<-30~\text{m}$
. Also,
 ${\mathcal{P}}_{\bot }$
tends to be symmetric about the filament centreline. Large horizontal shear production
${\mathcal{P}}_{\bot }$
tends to be symmetric about the filament centreline. Large horizontal shear production
 $-\langle u^{\prime }v^{\prime }\rangle \unicode[STIX]{x2202}_{x}\langle v\rangle$
is a consequence of the high amplitude vertical vorticity shown in figure 2 combined with the substantial horizontal momentum flux
$-\langle u^{\prime }v^{\prime }\rangle \unicode[STIX]{x2202}_{x}\langle v\rangle$
is a consequence of the high amplitude vertical vorticity shown in figure 2 combined with the substantial horizontal momentum flux
 $-\langle u^{\prime }v^{\prime }\rangle$
shown in figure 22. The latter has roots in the growing lateral instability depicted in figures 17–19.
$-\langle u^{\prime }v^{\prime }\rangle$
shown in figure 22. The latter has roots in the growing lateral instability depicted in figures 17–19.
However, uniform surface winds in
 $(E,N)$
couple with the secondary circulations leading to mean currents
$(E,N)$
couple with the secondary circulations leading to mean currents
 $\langle u,v\rangle$
that are spatially asymmetrical about the filament axis. This asymmetry enhances vertical shear production
$\langle u,v\rangle$
that are spatially asymmetrical about the filament axis. This asymmetry enhances vertical shear production
 ${\mathcal{P}}_{\Vert }$
, and in particular the production terms
${\mathcal{P}}_{\Vert }$
, and in particular the production terms
 $(-\langle u^{\prime }w^{\prime }\rangle \unicode[STIX]{x2202}_{z}\langle u\rangle ,-\langle v^{\prime }w^{\prime }\rangle \unicode[STIX]{x2202}_{z}\langle v\rangle )$
. In contrast to horizontal shear production
$(-\langle u^{\prime }w^{\prime }\rangle \unicode[STIX]{x2202}_{z}\langle u\rangle ,-\langle v^{\prime }w^{\prime }\rangle \unicode[STIX]{x2202}_{z}\langle v\rangle )$
. In contrast to horizontal shear production
 ${\mathcal{P}}_{\Vert }$
is asymmetrical about the filament axis. In
${\mathcal{P}}_{\Vert }$
is asymmetrical about the filament axis. In
 $E$
,
$E$
,
 $-\langle u^{\prime }w^{\prime }\rangle \unicode[STIX]{x2202}_{z}\langle u\rangle$
is dominant but with a maximum clearly shifted to the left of the filament centre. Recall the cross-front Ekman current and secondary circulation are additive on the left side of the filament resulting in a local surface maximum situated near
$-\langle u^{\prime }w^{\prime }\rangle \unicode[STIX]{x2202}_{z}\langle u\rangle$
is dominant but with a maximum clearly shifted to the left of the filament centre. Recall the cross-front Ekman current and secondary circulation are additive on the left side of the filament resulting in a local surface maximum situated near
 $x\approx -600~\text{m}$
, see figures 10 and 14. Also
$x\approx -600~\text{m}$
, see figures 10 and 14. Also
 $\langle u\rangle \approx 0$
at the filament centre. As a result,
$\langle u\rangle \approx 0$
at the filament centre. As a result,
 $\unicode[STIX]{x2202}_{z}\langle u\rangle$
and vertical shear production of turbulence
$\unicode[STIX]{x2202}_{z}\langle u\rangle$
and vertical shear production of turbulence
 ${\mathcal{P}}_{\Vert }$
are maximized near the water surface in a region left of the filament centre, i.e. not at
${\mathcal{P}}_{\Vert }$
are maximized near the water surface in a region left of the filament centre, i.e. not at
 $x_{p}$
. In
$x_{p}$
. In
 $N$
,
$N$
,
 $-\langle v^{\prime }w^{\prime }\rangle \unicode[STIX]{x2202}_{z}\langle v\rangle$
is the dominant term in
$-\langle v^{\prime }w^{\prime }\rangle \unicode[STIX]{x2202}_{z}\langle v\rangle$
is the dominant term in
 ${\mathcal{P}}_{\Vert }$
, with a maximum slightly left of the filament axis but located deep in the water,
${\mathcal{P}}_{\Vert }$
, with a maximum slightly left of the filament axis but located deep in the water,
 $z-[20,30]~\text{m}$
. The vertical gradient
$z-[20,30]~\text{m}$
. The vertical gradient
 $\unicode[STIX]{x2202}_{z}\langle v\rangle$
attains a maximum in this region, which can be inferred from figure 15, and thus
$\unicode[STIX]{x2202}_{z}\langle v\rangle$
attains a maximum in this region, which can be inferred from figure 15, and thus
 ${\mathcal{P}}_{\Vert }$
has a maximum in mid-OBL with a smaller contribution near the water surface.
${\mathcal{P}}_{\Vert }$
has a maximum in mid-OBL with a smaller contribution near the water surface.
Detailed flow visualization of the
 $(u^{\prime },v^{\prime })$
fields also shows that the growth of the shear production terms left of the filament centreline results from an interaction between coherent structures in the boundary layer and secondary circulations (Sullivan & McWilliams Reference Sullivan and McWilliams2017). It is well documented that persistent low-speed streaks roughly aligned with the mean flow direction are one of the building blocks of shear dominated boundary layers (e.g. Moeng & Sullivan Reference Moeng and Sullivan1994; Sullivan et al.
Reference Sullivan, McWilliams and Melville2004; Adrian Reference Adrian2007; Hutchins & Marusic Reference Hutchins and Marusic2007). Low-speed streaks near the water surface are observed in the wind driven simulations
$(u^{\prime },v^{\prime })$
fields also shows that the growth of the shear production terms left of the filament centreline results from an interaction between coherent structures in the boundary layer and secondary circulations (Sullivan & McWilliams Reference Sullivan and McWilliams2017). It is well documented that persistent low-speed streaks roughly aligned with the mean flow direction are one of the building blocks of shear dominated boundary layers (e.g. Moeng & Sullivan Reference Moeng and Sullivan1994; Sullivan et al.
Reference Sullivan, McWilliams and Melville2004; Adrian Reference Adrian2007; Hutchins & Marusic Reference Hutchins and Marusic2007). Low-speed streaks near the water surface are observed in the wind driven simulations
 $(E,N)$
.
$(E,N)$
.
6 Summary and conclusions
The lifecycle of a submesoscale dense (cold) filament undergoing cold filament frontogenesis (CFF) in the upper OBL is examined using fine mesh, turbulence resolving, three-dimensional LES. The initially imposed filament is two-dimensional (spatial variations in the
 $x{-}z$
directions) with buoyancy
$x{-}z$
directions) with buoyancy
 $b$
and geostrophic current
$b$
and geostrophic current
 $v_{g}$
fields typical of cold filaments found in larger-scale submesoscale calculations. Large horizontal spatial domains with fine grid resolution are used to capture the interaction between submesoscale and boundary-layer turbulence: the grid mesh is
$v_{g}$
fields typical of cold filaments found in larger-scale submesoscale calculations. Large horizontal spatial domains with fine grid resolution are used to capture the interaction between submesoscale and boundary-layer turbulence: the grid mesh is
 $6.4\times 10^{9}$
grid points and the computational domain is
$6.4\times 10^{9}$
grid points and the computational domain is
 $(L_{x},L_{y},L_{z})=(12,4.5,0.25)~\text{km}$
. The ratios of
$(L_{x},L_{y},L_{z})=(12,4.5,0.25)~\text{km}$
. The ratios of
 $(L_{x},L_{y},L_{z})$
to the initial boundary-layer depth
$(L_{x},L_{y},L_{z})$
to the initial boundary-layer depth
 $h_{i}=-66.5~\text{m}$
are
$h_{i}=-66.5~\text{m}$
are
 $(L_{x},L_{y},L_{z})/|h_{i}|=(180,68,3.76)$
; near the water surface the grid spacing is
$(L_{x},L_{y},L_{z})/|h_{i}|=(180,68,3.76)$
; near the water surface the grid spacing is
 $(\unicode[STIX]{x0394}x,\unicode[STIX]{x0394}y,\unicode[STIX]{x0394}z)/|h_{i}|\sim (0.02,0.02,0.0075)$
. All simulations are initiated from fully developed homogeneous boundary-layer turbulence generated by uniform and constant surface forcing. Three types of forcing are considered: cross-front winds (viz. west–east winds
$(\unicode[STIX]{x0394}x,\unicode[STIX]{x0394}y,\unicode[STIX]{x0394}z)/|h_{i}|\sim (0.02,0.02,0.0075)$
. All simulations are initiated from fully developed homogeneous boundary-layer turbulence generated by uniform and constant surface forcing. Three types of forcing are considered: cross-front winds (viz. west–east winds
 $E$
), down-front winds (viz. south–north winds
$E$
), down-front winds (viz. south–north winds
 $N$
) and surface cooling
$N$
) and surface cooling
 $C$
(no winds): in the wind driven cases the friction velocity
$C$
(no winds): in the wind driven cases the friction velocity
 $u_{\ast }=0.01~\text{m}~\text{s}^{-1}$
and in the cooling simulation the convective velocity scale
$u_{\ast }=0.01~\text{m}~\text{s}^{-1}$
and in the cooling simulation the convective velocity scale
 $w_{\ast }=0.0137~\text{m}~\text{s}^{-1}$
. The initial conditions for the simulations approximately satisfy turbulent thermal wind (TTW), i.e. a balance between Coriolis force, pressure gradients and vertical turbulent mixing in the OBL. The simulations are carried forward for more than 20 h which spans the onset, arrest, and partial decay of CFF. Time varying mean and turbulence statistics are computed in the
$w_{\ast }=0.0137~\text{m}~\text{s}^{-1}$
. The initial conditions for the simulations approximately satisfy turbulent thermal wind (TTW), i.e. a balance between Coriolis force, pressure gradients and vertical turbulent mixing in the OBL. The simulations are carried forward for more than 20 h which spans the onset, arrest, and partial decay of CFF. Time varying mean and turbulence statistics are computed in the
 $x{-}z$
plane by decomposing flow variables into a mean
$x{-}z$
plane by decomposing flow variables into a mean
 $\langle \cdot \rangle$
and fluctuation
$\langle \cdot \rangle$
and fluctuation
 $(\cdot )^{\prime }$
using down-front averaging. Major findings from the study are as follows:
$(\cdot )^{\prime }$
using down-front averaging. Major findings from the study are as follows:
(i) The lifecycle of CFF is captured by all simulations. For the amplitude and scale of the cold filaments considered, the horizontal velocity and buoyancy gradients sharpen quickly with the average peak vertical vorticity
 $\langle \unicode[STIX]{x1D701}\rangle _{p}$
reaching a maximum in less than 6 h. The amplitude, time
$t_{m}$
, and cross-front location
$x_{p}$
of the maximum
$\langle \unicode[STIX]{x1D701}\rangle _{p}$
and the quantitative lifecycle path of CFF are all surface-forcing dependent. Post arrest
$\langle \unicode[STIX]{x1D701}\rangle _{p}$
and the near-surface turbulent kinetic energy (TKE) decay slowly with time.
$\langle \unicode[STIX]{x1D701}\rangle _{p}$
reaching a maximum in less than 6 h. The amplitude, time
$t_{m}$
, and cross-front location
$x_{p}$
of the maximum
$\langle \unicode[STIX]{x1D701}\rangle _{p}$
and the quantitative lifecycle path of CFF are all surface-forcing dependent. Post arrest
$\langle \unicode[STIX]{x1D701}\rangle _{p}$
and the near-surface turbulent kinetic energy (TKE) decay slowly with time.(ii) Turbulence is a key ingredient of TTW and kick starts frontogenesis by creating vertical momentum fluxes
$\langle u^{\prime }w^{\prime },v^{\prime }w^{\prime }\rangle$
that couple the horizontal currents
$\langle u,v\rangle$
resulting in net secondary circulations
$\langle u,w\rangle$
in an
$x{-}z$
plane. Secondary circulations (SC) are robust structures and develop with either cross-front or down-front winds or surface cooling. The SC in the surface boundary layer are frontogenetic and remain coherent against a background of fully developed turbulence for both wind and surface cooling. With surface cooling
$C$
the strength of the SC left and right of the filament centreline at
$t=t_{m}$
are approximately equal and they combine to create maximum
$\langle \unicode[STIX]{x1D701}\rangle _{p}$
. With cross-front and down-front winds the SC are asymmetric, with the secondary cell on the left side of the filament stronger resulting in weaker
$\langle \unicode[STIX]{x1D701}\rangle _{p}$
.(iii) The combination of SC and Ekman boundary-layer currents is constructive (destructive) on the left (right) side of the filament for cross-front and down-front wind forcing. The SC intensify under frontogenesis and in
$E$
and
$N$
are sufficiently powerful to block the near-surface Ekman currents and spoil the usual Ekman balances found in a homogeneous OBL. Secondary circulations are crucial as they alter the filament stratification. Near the water surface, the left and right edges of the cold filament are stably stratified, because of SC, and as frontogenesis progresses the core of the cold filament re-stratifies (warms) from both filament edges. SC inhibit the Ekman buoyancy flux of cold core water towards the filament warm edge, and thus convective instabilities, reported in previous studies, are not readily found.(iv) Turbulence plays a dual role in CFF: it initiates frontogenesis through SC but under intense sharpening of the horizontal velocity gradients it also amplifies and ultimately arrests the frontogenetic tendency. The arresting turbulence does not appear space–time episodic as in a Kelvin–Helmholtz instability, but primarily develops from a down-front horizontal shear instability resulting in submesoscale meandering in the down-front
$y$
direction. The instability, which develops on a background of OBL turbulence, first appears vigorously in the down-front fluctuating velocity component
$v^{\prime }$
at the time of arrest and generates large horizontal co-variance
$-\langle u^{\prime }v^{\prime }\rangle$
, horizontal variances
$\langle u^{\prime }u^{\prime },v^{\prime }v^{\prime }\rangle$
and
$\text{TKE}=\langle u^{\prime }u^{\prime }\rangle /2$
; TKE is nearly 40 (50) times
$(u_{\ast }^{2},w_{\ast }^{2})$
in
$N(C)$
. At
$t=t_{m}$
, the cross-front scale of the arresting turbulence is less than 100 m for
$N$
and
$C$
, but of larger horizontal scale with an amplitude bias towards the left side of the filament for
$E$
. The down-front scale of the turbulence
$\ell _{y}$
is much larger than
$|h_{i}|$
.(v) In the arrest–decay phase
$t\geqslant t_{m}$
, the horizontal variances and co-variances are depth coherent, filling the upper 2/3 of the OBL, and decay slowly with time. At the end of the simulations the down-front variances still exceed 20 times the wind stress and the horizontal scales of the turbulence continue to grow. (We have not yet integrated long enough in time to see the final disappearance of the frontal anomaly and its circulation.)(vi) Potential energy stored in the cold filament is converted to mean kinetic energy and drives CFF. At the time of arrest
$t=t_{m}$
, the energetics show large amplitude TKE in
$(N,C)$
is generated mainly by horizontal shear production
$-\langle u^{\prime }v^{\prime }\rangle \unicode[STIX]{x2202}_{x}\langle v\rangle$
, i.e. a barotropic shear instability. Compared to
$N,C$
, the TKE generation in
$E$
is lower, shifted to the left of the filament axis, and is largely produced by vertical shear production
$-\langle u^{\prime }w^{\prime }\rangle \unicode[STIX]{x2202}_{z}\langle u\rangle$
. This is a consequence of constructive coupling between cross-front currents and secondary circulations near the water surface. The perturbation potential to TKE conversion
$\langle w^{\prime }b^{\prime }\rangle$
is small for all cases, thus the arresting turbulence does not result from baroclinic instabilities.(vii) Down-front fluctuations resulting from lateral shear instabilities gradually evolve into large-scale anisotropic turbulence with horizontal scales
$\ell _{y}>\ell _{x}$
and
$\ell _{y}\gg |h_{i}|$
. The energy cascade is forward, and the turbulence is broadband, not two-dimensional, with no clear scale separation between submesoscale turbulence and boundary-layer turbulence for
$t>t_{m}$
.


The
 $C$
case seems particularly simple and consistent with our prior ideas and expectations about frontogenesis and arrest associated with TTW and frontal instability, although the enhanced boundary-layer turbulence is not yet captured in current mixing parameterizations. The
$C$
case seems particularly simple and consistent with our prior ideas and expectations about frontogenesis and arrest associated with TTW and frontal instability, although the enhanced boundary-layer turbulence is not yet captured in current mixing parameterizations. The
 $N$
and
$N$
and
 $E$
cases, while still showing essentially similar behaviours, go beyond our present fluid dynamical understanding about the interactions of frontal dynamics and turbulence; but neither do they match in a simple way the extant ideas about the effects of down-front winds, symmetric instability and Ekman buoyancy flux. This is new territory needing further exploration.
$E$
cases, while still showing essentially similar behaviours, go beyond our present fluid dynamical understanding about the interactions of frontal dynamics and turbulence; but neither do they match in a simple way the extant ideas about the effects of down-front winds, symmetric instability and Ekman buoyancy flux. This is new territory needing further exploration.
Oceanic science is going through a prolific stage of discovery about submesoscale currents, their effects on material distributions in the upper ocean, their unique dynamics with intermediate values of Rossby (
 $V/fL$
) and Froude (
$V/fL$
) and Froude (
 $V/Nh$
) numbers, and their interaction with boundary-layer turbulence as well as internal and surface gravity waves (McWilliams Reference McWilliams2016). This paper provides evidence for the strong relations among the frontogenesis that shrinks the (transverse) scale of submesoscale currents, the boundary-layer turbulence that foments the frontogenesis, and the frontal instability, arrest and decay processes that further strongly couple the submesoscale and boundary layer. This suggests the diagram in figure 24, a sketch of the relations of the kinetic energy and its horizontal spectral fluxes among mesoscale eddies (ME), submesoscale currents (SM), and boundary layer turbulence (BL). It is deliberately not drawn as an energy wavenumber spectrum because we want to blur the distinctions between what is happening locally in a front or filament (this study) and what is happening in a broader spatial view over many eddies and fronts (the usual spectral view).
$V/Nh$
) numbers, and their interaction with boundary-layer turbulence as well as internal and surface gravity waves (McWilliams Reference McWilliams2016). This paper provides evidence for the strong relations among the frontogenesis that shrinks the (transverse) scale of submesoscale currents, the boundary-layer turbulence that foments the frontogenesis, and the frontal instability, arrest and decay processes that further strongly couple the submesoscale and boundary layer. This suggests the diagram in figure 24, a sketch of the relations of the kinetic energy and its horizontal spectral fluxes among mesoscale eddies (ME), submesoscale currents (SM), and boundary layer turbulence (BL). It is deliberately not drawn as an energy wavenumber spectrum because we want to blur the distinctions between what is happening locally in a front or filament (this study) and what is happening in a broader spatial view over many eddies and fronts (the usual spectral view).
The transfer of energy from ME to SM is well documented (e.g. by baroclinic instability and frontogenesis), as are the tendencies both for inverse energy cascade within the ME and larger SM ranges for flows close to geostrophic balance and for at least some instances of forward energy cascade in the smaller-scale end of the SM range. What is less well known are the processes terminating the SM range at its small-scale end and the fate of its forward-cascaded energy. In this paper the forward cascade is caused by frontogenesis by the secondary circulation supported by the boundary-layer turbulence through TTW balance, and by the frontal instability arrest and subsequent frontal decay cause a strong enhancement of both SM energy at scales comparable to the front and a further energization of BL. The simulations focus on the downscale energy transfers regime shown in the far left of figure 24. Further work is needed to appropriately quantify these processes and assess their generality in the ocean.

Figure 24. Schematic diagram of the distribution with horizontal length scale
 $L$
of the TKE associated with non-wave currents in the upper ocean. The dashed line denotes a historical conceptual straw man with peaks only for mesoscale eddies (ME) at
$L$
of the TKE associated with non-wave currents in the upper ocean. The dashed line denotes a historical conceptual straw man with peaks only for mesoscale eddies (ME) at
 $L\gtrsim R_{d}$
(the first baroclinic deformation radius,
$L\gtrsim R_{d}$
(the first baroclinic deformation radius,
 ${\sim}40~\text{km}$
) and for boundary-layer (BL) turbulence at
${\sim}40~\text{km}$
) and for boundary-layer (BL) turbulence at
 $L\lesssim h$
(the boundary-layer depth,
$L\lesssim h$
(the boundary-layer depth,
 ${\sim}50~\text{m}$
). In between the peaks there is a conspicuous scale gap with little non-wave TKE. Thick arrows denote the directions of energy flux (cascade): inverse for ME and forward for BL, down to dissipation at the Kolmogorov scale
${\sim}50~\text{m}$
). In between the peaks there is a conspicuous scale gap with little non-wave TKE. Thick arrows denote the directions of energy flux (cascade): inverse for ME and forward for BL, down to dissipation at the Kolmogorov scale
 $\unicode[STIX]{x1D702}$
(
$\unicode[STIX]{x1D702}$
(
 ${\sim}0.01~\text{m}$
). The solid line is an expanded conception both with the submesoscale range (SM), due to extraction of energy from ME by various instabilities and frontogenesis, and with enhanced energization of BL by frontal instability, arrest (FA), and decay in the intermittent places where they occur. The energy flux directions are inverse at large
${\sim}0.01~\text{m}$
). The solid line is an expanded conception both with the submesoscale range (SM), due to extraction of energy from ME by various instabilities and frontogenesis, and with enhanced energization of BL by frontal instability, arrest (FA), and decay in the intermittent places where they occur. The energy flux directions are inverse at large
 $L$
and forward at small
$L$
and forward at small
 $L$
, with a reversal somewhere within the SM range. SM and BL energy exchanges with surface and internal waves may also occur.
$L$
, with a reversal somewhere within the SM range. SM and BL energy exchanges with surface and internal waves may also occur.
Acknowledgements
P.P.S. was supported by the Office of Naval Research (ONR) through the Physical Oceanography Program award number N00014-12-1-0105, the Scientific Discovery through Advanced Computation (SciDAC) sponsored by the Department of Energy award number DE-SC0012605, and by the National Science Foundation through the National Center for Atmospheric Research (NCAR). J.C.M. acknowledges support from ONR grant N00014-14-1-0626. This research benefited greatly from computer resources provided by the NCAR Strategic Capability program managed by the NCAR Computational Information Systems Laboratory http://n2t.net/ark:/85065/d7wd3xhc, the Department of Defense High Performance Computing Modernization Program, and the Department of Energy.
Appendix A
The specific formulas and constants used to define the horizontal and vertical structure of the two-dimensional dense filament in the LES are based on those outlined by McWilliams et al. (Reference McWilliams, Gula, Molemaker, Renault and Shchepetkin2015). In this recipe the initial state of the filament consists of two vertically separated layers with an intermediate blended layer connecting the upper and lower layers. The (upper, lower) layers are nominally defined as the regions
 $(z>-h_{o},z<-h_{3})$
, respectively. The mean buoyancy field in an
$(z>-h_{o},z<-h_{3})$
, respectively. The mean buoyancy field in an
 $x{-}z$
plane is then
$x{-}z$
plane is then
 $$\begin{eqnarray}b(x,z)=[b_{s}(x)-b_{3}]F(\unicode[STIX]{x1D709})+b_{3},\end{eqnarray}$$
where
 $b_{s}(x)(b_{3})$
are the buoyancy distributions in the upper (lower) layers, respectively. The blending function
$b_{s}(x)(b_{3})$
are the buoyancy distributions in the upper (lower) layers, respectively. The blending function
 $F(\unicode[STIX]{x1D709})$
is defined below. In the upper (surface) layer
$F(\unicode[STIX]{x1D709})$
is defined below. In the upper (surface) layer
 $z>-h_{o}$
, the surface buoyancy and mixed layer depth are given by the formulas
$z>-h_{o}$
, the surface buoyancy and mixed layer depth are given by the formulas
 $$\begin{eqnarray}\left.\begin{array}{@{}c@{}}b_{s}(x)=b_{so}-\unicode[STIX]{x1D6FF}b_{o}\exp [-(x/L)^{2}],\\ h(x)=h_{o}+\unicode[STIX]{x1D6FF}h_{o}\exp [-(x/L)^{2}],\end{array}\right\}\end{eqnarray}$$
where
 $\unicode[STIX]{x1D6FF}b_{o}$
is the amplitude of the dense water anomaly relative to the background state
$\unicode[STIX]{x1D6FF}b_{o}$
is the amplitude of the dense water anomaly relative to the background state
 $b_{so}$
. Similarly,
$b_{so}$
. Similarly,
 $\unicode[STIX]{x1D6FF}h_{o}$
is the increase in mixed layer depth relative to the background value
$\unicode[STIX]{x1D6FF}h_{o}$
is the increase in mixed layer depth relative to the background value
 $h_{o}$
directly below the central front region. The horizontal width of the dense filament is determined by the scale
$h_{o}$
directly below the central front region. The horizontal width of the dense filament is determined by the scale
 $L$
, and
$L$
, and
 $x=0$
is taken to be the centreline of the front. Note these definitions generate an initially symmetric front. In the lower layer
$x=0$
is taken to be the centreline of the front. Note these definitions generate an initially symmetric front. In the lower layer
 $z<-h_{3}$
, the buoyancy is
$z<-h_{3}$
, the buoyancy is
 $$\begin{eqnarray}b_{3}=b(-h_{3})=N_{o}^{2}(H-h_{3}),\end{eqnarray}$$
where the background stratification is
 $N_{o}^{2}$
and the depth of the computational domain is
$N_{o}^{2}$
and the depth of the computational domain is
 $H$
.
$H$
.
The smooth blending function between the upper and lower layers is
 $$\begin{eqnarray}F(\unicode[STIX]{x1D709})=\frac{\text{e}^{a(1-\unicode[STIX]{x1D709}^{\unicode[STIX]{x1D707}})}-1}{\text{e}^{a}-1},\quad \unicode[STIX]{x1D709}=\frac{-z-h(x)}{h_{3}-h(x)}.\end{eqnarray}$$
The function
 $a(x)$
that appears in (A 4) satisfies a derivative continuity condition at the bottom of the intermediate layer
$a(x)$
that appears in (A 4) satisfies a derivative continuity condition at the bottom of the intermediate layer
 $$\begin{eqnarray}\frac{\unicode[STIX]{x1D707}a}{\text{e}^{a}-1}=N_{o}^{2}\frac{h_{3}-h(x)}{b_{s}(x)-b_{3}}.\end{eqnarray}$$
Once parameters are picked in (A 5),
 $a(x)$
is found by iteration. The parameter
$a(x)$
is found by iteration. The parameter
 $\unicode[STIX]{x1D707}$
regulates how strongly the pycnocline is concentrated just below the boundary layer (see McWilliams et al.
Reference McWilliams, Gula, Molemaker, Renault and Shchepetkin2015). The constants used in the above formulas are
$\unicode[STIX]{x1D707}$
regulates how strongly the pycnocline is concentrated just below the boundary layer (see McWilliams et al.
Reference McWilliams, Gula, Molemaker, Renault and Shchepetkin2015). The constants used in the above formulas are
 $$\begin{eqnarray}\left.\begin{array}{@{}c@{}}H=250~\text{m},\quad N_{o}^{2}=3.44\times 10^{-5}~\text{s}^{-2},\quad h_{3}=130~\text{m},\\ b_{3}=4.13\times 10^{-3}~\text{m}~\text{s}^{-2},\quad b_{so}=8.51\times 10^{-3}~\text{m}~\text{s}^{-2},\\ \unicode[STIX]{x1D6FF}b_{o}=0.785\times 10^{-3}~\text{m}~\text{s}^{-2},\quad L=2.0~\text{km},\quad h_{o}=60~\text{m},\\ \unicode[STIX]{x1D6FF}h_{o}=10~\text{m},\quad \unicode[STIX]{x1D707}=1.1.\end{array}\right\}\end{eqnarray}$$
Because of the smaller horizontal domain used in the LES,
 $L_{x}=12~\text{km}$
, the magnitude of the cool anomaly
$L_{x}=12~\text{km}$
, the magnitude of the cool anomaly
 $\unicode[STIX]{x1D6FF}b_{o}$
, the frontal width scale
$\unicode[STIX]{x1D6FF}b_{o}$
, the frontal width scale
 $L$
, and the perturbation to the mixed layer depth
$L$
, and the perturbation to the mixed layer depth
 $\unicode[STIX]{x1D6FF}h_{o}$
are reduced compared to the values used by McWilliams et al. (Reference McWilliams, Gula, Molemaker, Renault and Shchepetkin2015) which used
$\unicode[STIX]{x1D6FF}h_{o}$
are reduced compared to the values used by McWilliams et al. (Reference McWilliams, Gula, Molemaker, Renault and Shchepetkin2015) which used
 $L=3.5~\text{km}$
. For reference, our values of
$L=3.5~\text{km}$
. For reference, our values of
 $(b_{so},\unicode[STIX]{x1D6FF}b_{o})=(8.51,0.785)\times 10^{-3}~\text{m}~\text{s}^{-2}$
correspond to a surface temperature difference and a temperature jump
$(b_{so},\unicode[STIX]{x1D6FF}b_{o})=(8.51,0.785)\times 10^{-3}~\text{m}~\text{s}^{-2}$
correspond to a surface temperature difference and a temperature jump
 $(\unicode[STIX]{x1D703}_{so}-\unicode[STIX]{x1D703}_{o},\unicode[STIX]{x1D6FF}\unicode[STIX]{x1D703}_{o})=(5.2,-0.48)~\text{K}$
based on an expansion coefficient
$(\unicode[STIX]{x1D703}_{so}-\unicode[STIX]{x1D703}_{o},\unicode[STIX]{x1D6FF}\unicode[STIX]{x1D703}_{o})=(5.2,-0.48)~\text{K}$
based on an expansion coefficient
 $\unicode[STIX]{x1D6FD}=1.668\times 10^{-4}~\text{K}^{-1}$
. The reference temperature
$\unicode[STIX]{x1D6FD}=1.668\times 10^{-4}~\text{K}^{-1}$
. The reference temperature
 $\unicode[STIX]{x1D703}_{o}=10\,^{\circ }\text{C}$
.
$\unicode[STIX]{x1D703}_{o}=10\,^{\circ }\text{C}$
.


