


INTRODUCTION
Shockwaves (SWs) generated from laser induced optical breakdown of materials have found many applications like laser spark ignition for fuel-air mixtures, internal combustion engines, pulse detonations engines etc. (Schwarz et al., Reference Schwarz, Gross, Fischer, Muri, Tauer and Wintner2010), laser shock peening (Ding & Ye, Reference Ding and Ye2006) as it is used to treat many aerospace products such as turbine blades and rotor components, discs, gear shafts and bearing components, surface cleaning (Luk'yanchuk, Reference Luk'yanchuk2002), laser propulsion (Phipps et al., Reference Phipps, Reilly and Campbell2000; Wang et al., Reference Wang, Komurasaki, Yamaguchi, Shimamura and Arakawa2010), spectroscopic applications like laser induced breakdown spectroscopy (LIBS) (Miziolek et al., Reference Miziolek, Palleschi and Schechter2006; Kumar et al., Reference Kumar, Sreedhar, Barman, Dingari, Rao, Kiran, Tewari and Kumar2011), understanding the formation of atmospheric oxides in the natural lightening (Hill et al., Reference Hill, Rinker and Wilson1980; Sobral et al., Reference Sobral, Villagran-Muniz, Navarro-Gonzalez and Raga2000), gas dynamic flow (Jeong et al., Reference Jeong and Russo1998), ablation of surfaces (Kudryashov et al., Reference Kudryashov, Paul, Lyon and Allen2011; Batani et al., Reference Batani, Stabile, Ravasio, Lucchini, Strati, Desai, Ullschmied, Krousky, Skala, Juha, Kralikova, Pfeifer, Kadlec, Mocek, Präg, Nishimura and Ochi2003; Bigoni et al., Reference Bigoni, Milani, Jafer, Liberatore, Tarazi, Antonelli and Batani2010), spray and micro-jet formation from liquid droplets (Thoroddsen et al., Reference Thoroddsen, Takehara, Etoh and Ohl2009) to name a few. Biological applications involve SW lithotripsy used for the treatment of kidney stones (Kawahara et al., Reference Kawahara, Ioritani, Kambe, Orikasa and Takayama1991) and gall bladder diseases, treatment of pancreatic and salivary stones and also in orthopedics (Delius et al., Reference Delius1994). In almost all the processes and applications, understanding of the conversion of laser energy to kinetic energy propagating as a SW is essential. The crucial issue involved in efficient conversion of optical energy into kinetic energy is the interaction of high power laser beams with materials, which is an intriguing field of research owing to the nonlinear optical properties coming to the fore during laser-matter interaction. In applications involving the laser interaction with gaseous and liquid media, the spatial deposition of laser energy plays a crucial role in generating plasma induced SW that converts laser energy into kinetic energy driving the ambient medium to attain shocked state. While in applications involving laser-solid surface interactions ablative pressure at the surface due to the plasma plays an important role in launching a SW into the material of interest (Batani et al., Reference Batani, Balducci, Beretta, Bernardinello, Lower, Koeing, Benuzzi, Faral and Hall2000). When a short laser pulse is focused in a medium (solid, liquid, or gas (air, in this case)) due to the associated high electric field, the medium ionizes resulting in production of free electrons, which gains energy from the laser electric field and yield to further ionization resulting in an avalanche breakdown of the medium. This catastrophic ionization of the medium results in plasma formation that expands with supersonic velocities producing strong SWs in the ambient medium. The plasma while trying to reach equilibrium with surroundings releases energy in the form of an electromagnetic radiation and also in the form of a SW travelling into the ambient media. Laser induced SWs (LISW) were characterized by several optical methods such as schlieren, shadowgraphy (SHW) (Thiyagarajan et al., Reference Thiyagarajan and Scharer2008), phase-measurements i.e., interferometry and holography (Marti-Lopez et al., Reference Marti-Lopez, Ocana, Porro, Morales and Ocana2009), refractive fringe diagnostics (Siano et al., Reference Siano, Pacini, Pini and Salimbeni1998) to understand the spatio-temporal nature of SWs (Sobral et al., Reference Sobral, Villagran-Muniz, Navarro-Gonzalez and Raga2000), energy conversion for propulsion (Wang et al., Reference Wang, Komurasaki, Yamaguchi, Shimamura and Arakawa2010), temperature of the plasma (Thiyagarajan et al., Reference Thiyagarajan and Scharer2008), density of plasma (Siano et al., Reference Siano, Pacini, Pini and Salimbeni1998).
The existing literature considers the laser plasma produced SWs emanate from a single point source in space. In most of the studies, though different wavelengths from ultraviolet (193 nm) to infrared (1053, 1064 nm) were used to generate LISWs, the diagnostic used to capture the SW is a gated ICCD with a minimum gate width of 10 ns (Thiyagarajan et al., Reference Thiyagarajan and Scharer2008). The laser energy is observed to be deposited at a single region in space as an extended source (Wang et al., 2010) and been modeled as being generated from a single source (Dors et al., Reference Dors and Parigger2003). Although several authors have observed the jet formation (Ghosh & Mahesh, Reference Ghosh and Mahesh2008) and hot core plasma (HCP) dynamics (Thiyagarajan et al., Reference Thiyagarajan and Scharer2008), during the vibrant laser-plasma dynamics of air, the study of the complete dynamics from the initial breakdown of the medium to the time scales of 1200 µs are sparsely available. We present our results on the LISWs in ambient air trying to gain insight into the spatio-temporal deposition of laser energy around the breakdown region from the initiation of breakdown (t = 0) to a very large time scales of 1200 µs with the help of SHW technique with a minimum spatial and temporal resolution of 13 µm and 1.5 ns, respectively. The position of shock front (SF) at different delays from the laser pulse allowed us to experimentally measure the shock velocity (V SW) and estimate the nature of the SWs using counter pressure corrected point strong explosion theory (CPC-PSET) (Zel'dovich et al., Reference Zel'dovich and Raizer2002). The novel aspects of (1) the presence of two distinct sources of ionization along the laser propagation direction modifying the nature of SWs around the focal plane and (2) the interaction of these two sources leading to the transition of HCP analogous to that of a cavitation bubble in fluids are presented. The results were discussed in view of the existing literature emphasizing the need to understand the laser propagation characteristics on laser generated SWs for variety of applications.
EXPERIMENTAL DETAILS
The dynamics of SW and HCP were studied using time resolved SHW imaging technique. The experimental schematic is illustrated in Figure 1a. Laser pulses from second harmonic of Nd: YAG laser (INNOLAS Spitlight-1200) (532 nm, 7 ns, 10 Hz) focused using a plano-convex lens of 80 mm focal length in f/#10 geometry were used to generate laser induced plasma (LIP) in air launching SWs into quiescent atmospheric air. The input laser energy is varied in the range of 25–200 mJ per pulse in steps of 25 mJ. The beam diameter at the focal plane below the breakdown threshold is measured to be 140 ± 10 µm. The maximum laser intensity used is 1.85 × 10¹¹ W/cm2. He-Ne laser beam (632.8 nm, CW, 25 mW, Thorlabs) was used as probe beam (PB) to capture the evolution of SW's and HCP into the ambient atmosphere. The PB expanded to 15 mm captures the laser induced micro-plasma plume and the region surrounding it. As the PB passes through the plume, it gets refracted by a region with high density gradients (as in the case of a SW) causing dark and bright areas in the shadowgraphs. The variations created by evolving LIP in ambient air were captured by PB using an ICCD camera. An ICCD camera (ANDOR DH-734) with a minimum gate width or temporal resolution (duration over which photocathode is open) of 1.5 ns and spatial resolution of 13 µm over 1024 × 1024 pixel array was synchronized with the laser by triggering delay generator (SRS DG535) with Pockel's cell (PC) sync pulse from Nd: YAG laser. The dimension of the laser induced micro-plasma plume is measured by capturing the self-emission with the help of CCD camera (OPHIR-SPIRICON SP620U) and was matching with HCP images taken with SHW technique. The effective scan area of ICCD used for the current experiment is 11 mm × 11 mm with a resolution of 13 µm ensuring that the entire plasma extent was well with in the area covered by PB. The horizontal extent of the plasma is 2 mm and 6 mm at 25 mJ and 200 mJ of input laser energies, respectively. The output from delay generator was used to trigger ICCD camera to ensure capturing LIP created by every laser pulse and starts acquiring images, allowing shadowgraphs to be taken at any desired time delay. The delay between laser pulse and ICCD gate width was adjusted by using delay generator. The beginning of the laser pulse is taken as t = 0. PC pulse (C1), gate width of the ICCD (C3), laser pulse (C2), and the delay of the ICCD gate width from t = 0, were monitored using an oscilloscope (YOKOGAWA DL9240L, 1.5 GHz, 10 GS/s). A band-pass filter transparent to PB is placed in front of the camera to eliminate background illumination due to ns laser pulses. The images were captured at various time delays with an initial time delay of 200 ns for a laser energy varied in the range of 25 mJ to 200 mJ. Figure 1b shows the SW expansion model used for understanding the evolution of SWs. The SWs were analyzed in two different ways. In the first method, the focal point of the laser in vacuum is set as origin for all expansion directions. While in the second one, the two distinct ionization centers observed were considered as the sources of SWs. The SWs expanding in the +Z and −Z direction of laser propagation are taken as right and left propagating SWs, respectively. While the SWs captured in the direction perpendicular to laser propagation direction are taken to be expanding along +Y and −Y from the origin and considered as top and bottom propagating SWs, respectively. From the series of the shadowgraphs, the displacement of the SF at a given time radius (R SW) and velocity (V SW) of the SW was calculated. R SW and V SW were calculated for the SWs expanding in all the four directions ±Z, ±Y. The characteristics of the HCP were studied by measuring its expansion in terms of radius (RHCP) along Z and Y directions.

Fig. 1. (Color online) (a) Experimental schematic of shadowgraphy and synchronization of ICCD camera with the laser pulse. (b) Schematic of shock wave expansion.
RESULTS AND DISCUSSIONS
Shock Wave Measurements along the Laser Propagation (−Z and +Z) Direction
Figure 2a–2l show shadowgraphs over a spatial extent of 11 mm × 11mm at input laser energy of 50 mJ and time delays of 0.4, 3.2, 4.2, 6.2, 7.4, 20, 80, 160, 200, 340, 580, and 1100 µs from t = 0. The laser propagation direction is from left to right (−Z to +Z). Most of the absorbed laser energy is irreversibly converted in to heat and kinetic energy and remains deposited around the focal volume. Two sets of fine fringes located internally and externally with respect to the SW (a dark ring in Fig. 3) were observed. Dark layer in the images is due to the changes in the refractive index caused mainly by the high density and temperature gradients. The interference between undisturbed probe rays passing out of the SW and those deflected by the shock rear produces the internal fine fringes, while the external ones are due to the interference between the slightly perturbed rays and those deflected by the shock leading front (Siano et al., Reference Siano, Pini, Salimbeni and Vannini1996). The emergence of fringes was observed until a time delay of 3 to 4.2 µs after which SF (dark layer) gets detached from HCP (bright ring of Fig. 2d, Fig. 3). The HCP is observed to oscillate and last until greater delays up to 200 µs from t = 0. DHCP indicates the diameter of the HCP. Continuously evolving fringes indicate the density variations around the focal volume where the laser energy is being converted in to SW energy via plasma dynamics. The SF gets detached from the HCP at around 3.2 µs and 4.2 µs at 25 and 200 mJ input laser energies, respectively, and propagates into the ambient medium. The disappearance of the fringes at time delays of 3 to 4.2 µs around the focal plane and the propagation of a single dark layer indicates the complete conversion of laser energy in to SW (kinetic energy). The appearance of two distinct sources located toward left and right of the focal plane of lens lasted up to 3.2 µs for laser energies of 25 to 75 mJ beyond which the two sources can be clearly seen until 4.2 µs (Figs. 3a, 3b, and 3c at 0.8 µs and Fig. 3d, 3e, and 3f at 1.6 µs for 50, 75, and 150 mJ laser energies). The separation between the left and right sources increased with increasing laser energy. At earlier time delays up to 3.2 µs, the interaction of SWs from two distinct sources leading to “distinct” structure around the focal plane of the laser pulse is observed (Fig. 2a, Figs. 3a–3f). With increasing laser energy “distinct” structure has developed in to a clear layer distinguishing the two shock centers (labeled as shock interaction layer in Fig. 3c and Fig. 3f). The Moire like pattern observed around the focal plane of the lens at the initial delays from t = 0 in (Fig. 2a, Fig. 3) developed into separating layer at later time delays. The separating layer is due to the interaction of two counter propagating plasmas induced SWs leading to higher pressure and temperature gradients (Cooper, Reference Cooper1996; Gupta et al., Reference Gupta, Pandey and Thareja2013).

Fig. 2. (Color online) Shadowgraphs showing temporal evolution of SW and HCP of air at (a) 0.4 µs, (b) 3.2 µs, (c) 4.2 µs, (d) 6.2 µs, (e) 7.4 µs, (f) 20 µs, (g) 80 µs, (h) 160 µs, (i) 200 µs, (j) 340 µs, (k) 580 µs, and (l) 1100 µs at 50 mJ input laser energy. Each image represents a spatial extent of 11× 11 mm with a resolution of 13 × 13 µm.
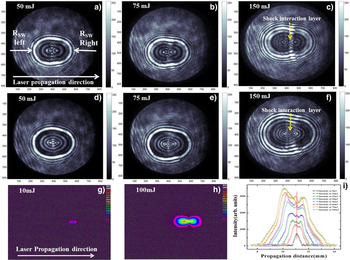
Fig. 3. (Color online) Shadowgraphs showing SW and HCP of air for input laser energies of 50, 75, and 150 mJ at a time delay of 0.8 µs (a, b, c) and 1.6 µs (d, e, f), respectively. CCD image of the self-emission from air at input laser energy of (g) 10 mJ, (h) 100 mJ, and (i) corresponding horizontal intensity profile of the self-emission.
In general, two/multiple point sources appear because of multiple breakdown regions if a biconvex lens is used for focusing the laser pulses. The separation between these two/multiple sources also depends on the thickness of the lens and the focusing geometry used (Evans & Morgan, Reference Evans and Morgan1969). However, in our experiments a plano-convex lens is used. If the two sources are due to the aberration of focusing lens, the separation between them should not change with increasing laser energy and contribution due to both sources has to appear at the breakdown threshold of the medium. To confirm this, self-emission from the LIP is captured using a CCD camera with a spatial resolution of 4.4 µm. The captured images of self-emission and their intensity profiles as a function of incident laser energy are shown as Figures 3g, 3h, and 3i. Around the breakdown threshold of air, the on-axis self-emission intensity profile is symmetric around the focal plane (Fig. 3i). With increasing laser energy, the evolution of two dominant ionization centers with plasma plume expanding more toward the focusing lens and the continuously increasing separation between them is obvious. With increasing laser energy beyond the breakdown threshold, the leading edge of the ns pulse will have sufficient intensity to create the plasma even before the peak of the pulse. The peak and the trailing edge of the pulse will interact with the plasma created by the leading edge and lead to creation of two dominant centers. Moreover, the leading and the trailing edge of a propagating laser pulse are well-known to get focused at different points along propagation axis as they see different refractive index and electron density profiles (Shen, Reference Shen1984). Hence, the origin of two dominant sources is attributed to the vibrant ns laser-plasma interaction within the pulse duration and initial stages of plasma evolution. The same was observed in the shadowgraphs in terms of the evolving dark and bright layers observed around the focal plane until 3–4 µs from t = 0, which disappear once the SW detached itself from the HCP leading to the oscillations of HCP.
The SW's emanating from the focal plane of lens along −Z and +Z directions are denoted as R SW left and R SW right SW's. The position of SF is measured from these respective sources. Each of the images capturing evolution of SW was processed using MATLAB® to extract radial position of shock front. Spherical SWs are observed along −Z and +Z directions from the two distinct sources at all laser energies used in the study. The expanding SW is observed for times up to 10 µs. Later, SW leaves the probe beam's field of view. The measured R SW from the shadowgraphs at different time delays is used to get an insight into the evolution of the parameters behind the SF using Sedov-Taylor's theory (Sedov, Reference Sedov1993). Sedov-Taylor's theory also known as point strong explosion theory (PSET) gives an insight into the gas density travelling at supersonic velocity behind the shock front and assumes that SW originates from the instantaneous release of immense energy E at a certain spatial point in a gas of undisturbed density (ρ0) (Zel'dovich et al., Reference Zel'dovich and Raizer2002). In our case, as the experiment was performed in ambient air, counter pressure corrected PSET (CPC-PSET) is adapted to take care of the counter propagation of ambient gas toward the HCP. Following the CPC-PSET the R SW, (Sedov, Reference Sedov1993; Jeong et al., Reference Jeong and Russo1998), as a function of time is given as R SW = Φ0 [ESt2/ρ]1/5, where E S is the energy released in the explosion (Jeong et al., Reference Jeong and Russo1998) that drives the SW, t is the time elapsed since the origin of the disturbance that generated the SW, ρ is the density of the ambient medium (1.184 kg/m3) and Φ0 is a constant dependent upon the specific heat ratio, γ (1.4), of the ambient medium, given as
 $${\rm \Phi }_{\rm o}=\left[{\displaystyle{{{\rm 75 }\left({{\rm {\rm \gamma} } - {\rm 1}} \right)\left({{\rm {\rm \gamma} }+{\rm 1}} \right)^{\rm 2} } \over {{\rm 16{\rm \pi} }\left({{\rm 3{\rm \gamma} } - {\rm 1}} \right)}}} \right]^{\displaystyle{{\rm 1} \over {\rm 5}}}$$
Experimentally measured R SW is fitted with E S as a fitting parameter. The evolution of R SW was observed to follow two different slopes with time which clearly indicate the presence of two different stages of SW evolution rates. Until a delay of 3–4.2 µs the SW appeared to grow slowly beyond which the SW was found to be accelerating (Fig. 4). At the time of increased acceleration, the SW was found to be detaching itself from the HCP following different slope and propagate into ambient medium (Fig. 2b). This is termed as first collapse of HCP (Fig. 4) launching SW into ambient medium. The time of first collapse was observed to increase with increasing laser energy from 3–4.2 µs. The different slopes observed were fitted with CPC-PSET independently. The velocity of the SF is extracted using temporal evolution of R SW. The evolution of the SW follows Taylor spherical solution individually before and after first collapse. For input laser energies of 25 and 50 mJ, the right SW propagates faster than the left SW (Fig. 4a). At 75 mJ laser energy, both left and right SW's propagates with the same speed (Fig. 4b). Above 75 mJ, left SW propagates faster than the right SW (Fig. 4c). The same is clear from the shadowgraphs (Fig. 3a–3f) corroborating with higher deposition of laser energy before the geometrical focus of the focusing optics (Monot et al., Reference Monot, Auguste, Lompre, Mainfray and Manus1992; Schwarz et al., Reference Schwarz, Gross, Fischer, Muri, Tauer and Wintner2010) and with the observed on-axis self-emission intensity profiles (Fig. 3i).

Fig. 4. (Color online) Left and right SW location data showing radius of curvature of shock front (R SW) along the horizontal direction at (a) 50 mJ, (b) 75 mJ, and (c) 150 mJ laser energies. Solid lines in the figure are the curve fit to Taylor solution for spherical shock wave. First collapse of HCP is shown by an arrow.
The energy content of a hemispherical SW (E h) (E h= 0.5 E s) induced by laser heating of air is one-half of the value predicted from temporal evolution of R SW, which was derived for the propagation of a spherical SW (Porneala et al., Reference Porneala and Willis2009). With increasing laser energy or when going beyond the breakdown threshold the low dense plasma created around the focal plane interacts with the laser pulse leading to deposition of energy at different positions along the propagation direction analogous to self-focusing, a phenomenon well-known for high-power laser beams propagating in air (Shen, Reference Shen1984; Monot et al., Reference Monot, Auguste, Lompre, Mainfray and Manus1992; Schwarz et al., Reference Schwarz, Gross, Fischer, Muri, Tauer and Wintner2010). Figure 4 shows R SW as a function of delay from the laser pulse for 50, 75, and 150 mJ laser energies. Maximum and minimum R SW observed to be 3 and 1 mm, respectively, over a delay of 8 µs. By assuming that the ambient pressure is negligible with respect to the pressure behind the SW, the gas motion is determined by two-dimensional parameters, the energy of the explosion (E s) and the initial density (ρ0= 1.184 kg/m3). The maximum V SW rapidly decays from a value of 7.4 km/s to approximately 0.4 km/s in the range of input laser energies used (Fig. 5). The V SW is found to increase with increasing laser energy. From V SW, pressure behind the SF (P SW) is calculated using  $P_{SW}={2/ {\left({{\rm \gamma}+1} \right)}}{\rm \rho} _o V_{SW} ^2 $ where γ (1.4) is the specific heat ratio of the ambient medium (Zel'dovich et al., Reference Zel'dovich and Raizer2002). The P SW was observed to be increasing with increasing laser energy. The maximum P SW in the compressed air rapidly decays from a value of 57 MPa to approximately 0.1 MPa (ambient atmospheric pressure) within 10 µs in the range of input laser energies used (Fig. 6). The compressed gas behind SW expands and cools, the pressure and temperature of air behind the SW comes close to ambient. Most of the absorbed laser energy is irreversibly converted in to heat and remains deposited in a small region close to the center for duration of around 10 µs from t = 0.

Fig. 5. (Color online) Velocities of the SW (V SW) in left and right directions at (a) 50 mJ, (b) 75 mJ, and (c) 150 mJ input laser energies.

Fig. 6. (Color online) Pressure behind the SF (PSW) in left and right directions at (a) 50 mJ, (b) 75 mJ, and (c) 150 mJ input laser energies.
Shock Wave Measurements Assuming A Single Point Source
Though the previous measurements (Wang et al., Reference Wang, Komurasaki, Yamaguchi, Shimamura and Arakawa2010; Thiyagarajan et al., Reference Thiyagarajan and Scharer2008; Ghosh & Mahesh, Reference Ghosh and Mahesh2008), show that the evolution of SW originates from a single source in an ellipsoidal propagation, our experiments indicate the presence of two distinct centers. To confirm this, the SW propagation is analyzed along the +Z, −Z, and +Y, −Y direction assuming the focal point of the lens as a single source of SW. Experimentally measured R SW is fitted using Taylor theory with E S as a fitting parameter. Figures 7a and 7b shows the evolution of R SW as a function of delay from the laser pulse in −Z and +Z directions. The evolution of R SW is different in both the directions though it is spherical in nature clearly indicating the asymmetric distribution of laser energy around the focal plane. The evolution of the SW follows Taylor solution at longer time scales >2.1 µs. Maximum and minimum R SW was observed to be 1.95 and 3.5 mm in the left direction and 1.88 and 3.64 mm in the right direction, respectively, over a delay of 8.4 µs. Though the PSET is able to explain the propagation of SW at larger distances from the origin, it fails to explain the nature of SW's close to the source of explosion (around the focal volume of the lens) due to the asymmetric nature of initial plasma plume (Figs. 7a and 7b). Figure 7c shows the evolution of R SW as a function of delay from the laser pulse in +Y (top) and −Y (bottom) directions. The SW's were observed to evolve with a planar nature in the plane perpendicular to laser propagation direction. The interaction of spherical SWs from two distinct shock sources along the laser propagation direction seems to be leading to the planar expansion of the SWs along +Y and −Y direction. This indicates that the LISW need to be considered as a two center problem instead of a single center problem and has a lot of scope for generating SWs of required nature by varying laser parameters and controlling the onset of self-focusing in the medium appropriately.

Fig. 7. (Color online) (a) Left and (b) Right SW location data showing radius of curvature of shock front (R SW) along the horizontal direction at 75 mJ input laser energy. Solid lines in the figure are the curve fit to Taylor solution for spherical shock wave. (c) Radius of curvature of shock front (R SW) along the vertical direction at 75 mJ input laser energy. Solid lines in the figure are the curve fit to Taylor solution for planar shock wave.
Hot Core Plasma Dynamics
Evolution of HCP, reservoir for the SWs is studied for time delays up to 1200 µs from t = 0. The HCP is observed to behave in a non-spherical fashion at smaller and longer delays from t = 0. At smaller time delays, the HCP appeared as an oblate along the Z-direction until 3.2 µs (Figs. 2a–2e). Once the SW is observed to detach from HCP at 3.2 µs, the HCP is observed to become almost spherical during 3.2 µs to 20 µs time delays. Beyond 20 µs, the HCP starts to assume a prolate shape along Y-direction (Fig. 2g). At 3.2 µs, when the SW detaches from the HCP due to gas heating with a more symmetrical spherical shape and continues to expand until 6 µs and then cool leading to the first collapse of the HCP at 6.2 µs (Fig. 8b). In our case, the expanding SW is seen for times up to 10 µs. Later, the SW leaves the field of view. The R HCP is observed to vary from 1.17–2.44 mm along Z direction (Horizontal direction) and 1.26–3.42 mm along Y direction (Figs. 8a) and Figure 8b shows expanded view of Fig. 8a clearly indicating the eccentricity (Figs. 8c and 8d). After the first collapse the HCP rebounds due to the counter pressure from ambient atmosphere and oscillates while trying to reach equilibrium with surrounding atmosphere. The evolution of HCP is explained using eccentricity (e), defined as the ratio of diameter of HCP along Z- and Y-directions. The observed dynamics of HCP are closer to that of a cavitation bubble in fluids (Petkovsek et al., Reference Petkovsek and Gregorcic2007; Marmottant et al., Reference Marmottant and Hilgenfeldt2003; Lauterborn et al., Reference Lauterborn and Koch1987; Reference Lauterborn, Kurz, Geisler, Schanz and Lindau2007; Herbert et al., Reference Herbert, Balibar and Caupin2006; Nath & Khare, Reference Nath and Khare2008; Reference Nath and Khare2011). At times from 0.4–9.6 µs HCP is oblate with e > 1 corresponding to t/t OSC of 0.06–1.54 (Fig. 8c) and becomes spherical by 9.8 µs (t/tOSC of 1.58). t OSC is taken ~6.2 µs as the oscillation time of the HCP. Beyond 20 µs the HCP becomes prolate (e < 1) analogous to that of a non-spherical bubble observed in fluids (Lim et al., Reference Lim, Quinto-Su, Klaseboer, Khoo, Venugopalan and Ohl2010). The novel transition of HCP analogous to that of a cavitation bubble (CB) is explained using the presence of the two distinct shock sources along the laser propagation axis. The interaction of counter propagating (colliding) SWs from two sources at the interaction zone is known to increase the SW parameters in a nonlinear way (Cooper, Reference Cooper1996). In addition, the temperature gradients, electron density are observed to evolve over longer times in case of colliding/interacting plasma plumes (Gupta et al., Reference Gupta, Pandey and Thareja2013). Hence, within the interaction zone, the pressure and temperature will be higher for a longer duration allowing HCP to expand more in the ±Y direction and persist for up to 1100 µs. The observed dominant expansion and oscillations of HCP along the Y-direction compared to Z-direction (Fig. 8b) concur with the presence of higher pressure and temperature in the interaction zone. Hence, the transition of HCP to CB is attributed to the higher pressure and temperature in the shock interaction zone that follows the resultant planar SW propagating along Y-direction.

Fig. 8. (Color online) (a) Evolution of radius of the Hot Core Plasma (R HCP) at 50 mJ input laser energy showing the first collapse. (b) Evolution of R HCP during equilibrium phase (oscillation phase). Eccentricity (e) of HCP at (c) initial, and (d) later oscillation times. Lines are guide to the eye.
At later time scales of 160 µs, we see that the jet formation (Fig. 2g) and subsequent penetration of colder ambient air in to the HCP leading to the rapid oscillations of the HCP, until 1100 µs eventually leading to bubble breakdown (Ghosh & Mahesh, Reference Ghosh and Mahesh2008). The jet formation and the toroid shape of the plasma are well-observed and explained for laser induced sparks of different gaseous mixtures (Ghosh & Mahesh, Reference Ghosh and Mahesh2008; Chen et al., Reference Chen and Lewis2001; Dors et al., Reference Dors, Parigger and Lewis2000; Bradley et al., Reference Bradley, Sheppard, Suardjaja and Woolley2004). As the pressure due to the SW is higher toward the focusing lens (−Z direction), the pressure gradient is countered by the ambient gas propagating from +Z toward −Z direction in order to bring the medium back to ambient pressure essentially leading to the jet formation. Typical time taken for the equilibration of pressures i.e., formation of jet is observed to be around 140–200 µs depending on the medium. Jet formation essentially takes place due to hydrodynamic interactions between the hot ionized gas and the ambient atmosphere.
Since the behavior of HCP is the same as bubble observed in fluids, we tried to fit radial position of the bubble (R b-max) as a function of E i using the allometric equation of the form R b-max = aE ib where a and b being the fit parameters. Figures 9a and 9b represent the maximum radius and energy of HCP, respectively, with incident laser energy (Chen et al., Reference Chen, Xu, Shen, Lu and Ni2004). These characteristic parameters increase with increase of laser energy. In the range of input laser energy from 25–200 mJ, the maximum HCP radius along the horizontal direction varied from 2.06–3.11 mm and in the vertical direction from 1.98–2.9 mm. The HCP energy along the horizontal direction varies from 1.84–6.28 mJ and from 1.62–5.17 mJ along the vertical direction.

Fig. 9. (Color online) (a) Maximum bubble radius (R b-max) and (b) Hot core plasma energy (E b) as a function of laser energy.
SUMMARY
SHW imaging is used to study the LISW and laser induced HCP dynamics in air with ns temporal resolution. The evolution and propagation characteristics of the LISW's give a valuable insight into the laser induced phase explosion of the materials and gas dynamic flow. The maximum V SW and maximum P SW are measured to be 7.4 km/s and 57 MPa, respectively. Although the SW's were found to be expanding spherically along the laser propagating direction, the rapidly expanding hot core of the plasma, reservoir of shock pressure has shown a clear asymmetry analogous to that of an elliptical cavitation bubbles observed in fluids, both while expanding and cooling down to the equilibrium state. In view of the results, and existing models explaining the expansion of LISWs from a single source, one need to consider the LISW problem as a two or a multi-center problem to account for the asymmetric evolution of SWs in different directions. Moreover oscillation of HCP analogous to that of a cavitation bubble in fluids evokes interest especially considering the presence of two interacting plasma sources coexisting around the focal plane.
ACKNOWLEDGEMENT
The authors thank DRDO, Government of India for funding.


