Introduction
Soil degradation due to increasingly intensive farming has drawn researchers’ attention in recent years (Mekonnen et al., Reference Mekonnen, Keesstra, Stroosnijder, Baartman and Maroulis2015; Khaledian et al., Reference Khaledian, Kiani, Ebrahimi, Brevik and Aitkenhead-Peterson2017). It has been reported that approximately 60% of the soil ecosystem services have undergone soil degradation by varying degrees since the 1950s (Lal, Reference Lal2015), with agricultural activity being one of the principal factors (Oldeman et al., Reference Oldeman, Hakkeling and Sombroek2017). Consequently, taking action to minimize the loss of soil fertility and improve soil structure is a priority (Khaledian et al., Reference Khaledian, Kiani, Ebrahimi, Brevik and Aitkenhead-Peterson2017). Crop management practices greatly influence soil properties by changing microbial activity and carbon (C) sequestration (Zuber et al., Reference Zuber, Behnke, Nafziger and Villamil2018). Crop diversification has been treated as an implementable practice to enhance crop production, soil quality (Cook, Reference Cook2017) and agricultural sustainability (Congreves et al., Reference Congreves, Hayes, Verhallen and Van Eerd2015; Yadav et al., Reference Yadav, Parihar, Jat, Singh, Kumar, Pooniya, Parihar, Saveipune, Parmar and Jat2016).
Increasing diversity cropping system has the potential to maintain or improve soil quality with the help of increased crop residue and varied root systems, thereby increasing and diversifying the microbial activity (Studdert, Reference Studdert2000). A number of studies have reported that crop diversity increased soil water storage, wet soil aggregate stability (WAS), plant available nutrients, C cycling and soil enzyme activity compared to less intensive crop management systems (mono-cropping or fallow) (Dick, Reference Dick1984; Tiemann et al., Reference Tiemann, Grandy, Atkinson, Marin-Spiotta and McDaniel2015; Zuber et al., Reference Zuber, Behnke, Nafziger and Villamil2015; Nunes et al., Reference Nunes, van Es, Schindelbeck, Ristow and Ryan2018). It was reported by Karlen et al. (Reference Karlen, Hurley, Andrews, Cambardella, Meek, Duffy and Mallarino2006) that crop diversity decreased soil bulk density (BD), resulting in increased crop yield when compared to the continuous corn (Smith et al., Reference Smith, Gross and Robertson2008).
Further, crop diversity can enhance soil nitrogen (N) concentrations, which is considered the main nutrient for plant growth (Stanger and Lauer, Reference Stanger and Lauer2008), and increase microbial biomass C (MBC), which is an important index of soil quality (McDaniel et al., Reference McDaniel, Tiemann and Grandy2014). Crop diversity can reduce pest pathogens by breaking the pest cycle (Rusch et al., Reference Rusch, Bommarco, Jonsson, Smith and Ekbom2013) and making full use of nutrients in different soil layers with different crop root systems (O'Rourke et al., Reference O'Rourke, Liebman and Rice2014). Crop diversity can increase soil C content, which makes a great contribution to recovering, creating and binding soil aggregate structure (Chateil et al., Reference Chateil, Goldringer, Tarallo, Kerbiriou, Le Viol, Ponge, Salmon, Gachet and Porcher2013; McDaniel et al., Reference McDaniel, Tiemann and Grandy2014; Tiemann et al., Reference Tiemann, Grandy, Atkinson, Marin-Spiotta and McDaniel2015). Soil organic C (SOC), one of the most important soil quality components, has a significant impact on physical, chemical and biological properties (King and Blesh, Reference King and Blesh2018). Soil property responses to crop diversity may vary due to different soil types, topography, climate, tillage intensity, irrigation and fertilizer rate (Al-Kaisi et al., Reference Al-Kaisi, Yin and Licht2005; Gál et al., Reference Gál, Vyn, Michéli, Kladivko and McFee2007). Therefore, an improved understanding of soil physical, chemical and biological properties as impacted by crop diversification is important. Several studies have compared soil quality from a crop grown in crop diversity with a similar crop grown in mono-cropping (Tiemann et al., Reference Tiemann, Grandy, Atkinson, Marin-Spiotta and McDaniel2015; Zuber et al., Reference Zuber, Behnke, Nafziger and Villamil2015; Nunes et al., Reference Nunes, van Es, Schindelbeck, Ristow and Ryan2018).
Corn (Zea mays L.) and soybean (Glycine max L.) sequence is the most common agricultural practice in many places worldwide (Hoss et al., Reference Hoss, Behnke, Davis, Nafziger and Villamil2018). However, interest in adopting crop diversity has been increasing among producers to enhance crop production. Farming practices have changed from conventional systems to continuous cropping with a variety of cropping systems (Sindelar et al., Reference Sindelar, Schmer, Gesch, Forcella, Eberle, Thom and Archer2017). Including cover crops (CC) in a diverse system has the potential to relieve soil compaction, erosion, nutrient leaching, and alter C cycling and microbial activity, and could therefore regulate the ecosystem functioning and soil structure maintenance (Schipanski et al., Reference Schipanski, Barbercheck, Douglas, Finney, Haider, Kaye, Kemanian, Mortensen, Ryan and Tooker2014; Lewis et al., Reference Lewis, Burke, Keeling, McCallister, DeLaune and Keeling2018). Utilizing leguminous crops in arable cropping systems was suggested as an implementable practice to enhance soil C and N sequestration in rainfed areas (Bhattacharyya et al., Reference Bhattacharyya, Prakash, Kundu, Srivastva and Gupta2009; Zhou et al., Reference Zhou, Berruti, Greenhalf and Henry2017).
There are few studies investigating the effect of crop diversity on soil quality from different crop species within the system. Therefore, the objective of this research was to investigate the impacts of the crop diversity that are part of a rotation on some selected soil chemical, physical and biological properties. It was hypothesized that diverse cropping system would improve soil quality due to the inputs of the below and aboveground biomass, thus increasing soil C content, microbial biomass, soil enzymes activity and soil quality.
Materials and methods
Experimental site
This study was initiated in 2011 at the Dickinson Research Extension Center located near Dickinson, North Dakota (46°53′N, 102°49′W). Soils data for this study were collected in 2016–2017. The site consists of 18 uniform rectangular 1.74 ha (31.3 ha in total) plots. This experimental site was established to investigate the soil quality responses to the adoption of diversified cropping (DC) system under a no-till system. Soils of the study site are Vebar Series (coarse-loamy, mixed, superactive, frigid Typic Haplustolls) and Savage Series (fine, smectitic, frigid Vertic Argiustolls). To minimize the impact of soil on the data analysis, two replicates were assigned to Savage Series and the third replicate was assigned to Vebar Series for each treatment (Abagandura et al., Reference Abagandura, Şentürklü, Singh, Kumar, Landblom and Ringwall2019). The treatments were laid out in a randomized complete block design with three replications. Additional details of the site were described in Abagandura et al. (Reference Abagandura, Şentürklü, Singh, Kumar, Landblom and Ringwall2019).
The cropping system investigated here included mono-cropping (MC) system [wheat (Triticum aestivum L.)] grown continuously for 5 years and 5-year crop sequences [wheat–cover crop (CC)–corn (Z. mays L.)–pea (Pisum sativum L.)/barley (Hordeum vulgare L.)–sunflower (Helianthus annuus L.)]. Wheat, sunflower and corn were used as cash crops, while legumes (pea/barley) was used to increase nutrient and organic matter inputs, CC was used to supply nutrients for the following crop, balance the soil moisture and reduce soil erosion. Each crop was present every year. The cropping sequence over the study period is presented in Fig. 1. Cover crop species used in this study are listed in online Supplementary Table S1. Crop agronomic information, including planting time, planting population, row spacing and seeding depth is listed in Table 1. Wheat was harvested in August and the other crops were harvested between October and November. No fertilizer was applied in 2016 and 2017 according to the soil test results from North Dakota State University Laboratory, and pesticides were applied as needed to control pests. All crops were grown under rainfed conditions, and no irrigation was applied. Average minimum and maximum air temperature and total precipitation (mm) for 2016 and 2017 (online Supplementary Fig. S1) were collected from a weather station located approximately 25 km from the field (Abagandura et al., Reference Abagandura, Şentürklü, Singh, Kumar, Landblom and Ringwall2019). Climate is between dry season and semi-arid climate, caused by low precipitation and a monthly mean temperature of −8.7°C in January and 20°C in July. Average (30-year) air temperature at the site was 6.2°C, and mean annual precipitation was 610 mm (Abagandura et al., Reference Abagandura, Şentürklü, Singh, Kumar, Landblom and Ringwall2019).

Fig. 1. Colour online. Layout of the crop sequences used in this study from 2011 to 2017. The cropping systems investigated in this study included continuous wheat, and five crop sequences (wheat–cover crop–corn–pea/barley–sunflower).
Table 1. Agronomic management information at the study site performed during 2016 and 2017 (adapted from Abagandura et al., Reference Abagandura, Şentürklü, Singh, Kumar, Landblom and Ringwall2019)

Sample collection and laboratory analysis
Soil samples were collected in June 2010 to measure the baseline values at the research site prior to the establishment of treatments. Although a 5-year rotation cycle was completed in 2015 (Fig. 1), yet, it was not possible to take soil samples after harvesting in 2015 due to the cold weather in the study area. When the snow melted around May 2016, soil samples were taken in June 2016 to represent the end of the 5-year rotation cycle. Soil samples were also collected when a new cycle of the 5-year rotation began in 2016. Again it was not possible to take soil samples after harvesting in 2016; therefore, soil samples were taken in June 2017 to represent the beginning of the second cycle of the 5-year rotation.
Soil samples were collected from six random spots from 0–5 cm depth in 2010 and from 0–5, 5–15, 15–30, 30–45 and 45–60 cm depths in 2016 and 2017 using a soil auger (3.2 cm diam.) from each plot. In addition, a separate soil core (5 cm i.d.) was taken from each plot for soil water retention (SWR) and BD analyses in 2016 and 2017. All the soil samples were kept in plastic zip-lock bags, transported to the lab and stored in a cold room (4°C) for further analysis. Soil samples for all depths were air dried, ground and sieved to pass through a 2 mm sieve. A total of 10 g of soil was placed in a centrifuge tube with 10 ml of distilled water (the ratio of soil to water being 1:1), the suspension was stirred with a vortex mixer for 30 s, and then a pH and EC meter (Thermo Scientific Orion, model-Orion Star A215) was used to measure the soil pH (Kalra, Reference Kalra1995). Electrical conductivity (EC) was measured with 1:2.5 of soil:water slurry through pH and EC meter. Total C and N were determined using the TruSpec CHN analyser (LECO Corporation, St. Joseph, MI, USA) with the dry combustion method. Inorganic C was determined for all the soil samples by reaction with hydrochloric acid (Schumacher, Reference Schumacher2002). Soil organic C was calculated by subtracting the soil inorganic C from total C. There were not sufficient samples in 2010; therefore, the following analyses were conducted on 2016 and 2017 soil samples only.
Labile C and N fractions [cold water-extractable C (CWC), cold water-extractable N (CWN), hot water-extractable C (HWC), hot water-extractable N (HWN) and microbial biomass C (MBC)] were determined in this study. Labile C and N fractions (except for MBC) were extracted for 0–5 and 5–15 cm depths using cold water and hot water extraction methods (Ghani et al., Reference Ghani, Dexter and Perrott2003) and analysed with the TOC-L analyser (Shimadzu Corporation, Columbia, MD, USA, model-TNM-L-ROHS). To summarize the methodology, 3 g of soil and 30 ml of distilled water were taken into 50 ml centrifuge tubes, then moved to an end-over-end shaker for 30 min at 40 rpm. The suspension was centrifuged at 3000 rpm for 25 min, and the supernatant was subsequently separated from the soil with 0.45 μm pore-size filter paper to get CWC and CWN. Thirty millilitres of distilled water was added to the leftover suspension and kept in a water bath at 80°C for 12 h, centrifuged at 3000 rpm for 25 min and filtered to get HWC and HWN. The microbial biomass C was determined for 0–5 cm depth by chloroform fumigation direct extraction method (Beck et al., Reference Beck, Joergensen, Kandeler, Makeschin, Nuss, Oberholzer and Scheu1997).
For SWR measurements, a cheesecloth was fixed at the bottom of the intact cores with a rubber band, then the soil core was saturated with water for 1–3 days. Soil water retention was measured for 0–5 cm depth at seven different matric potentials; 0, −0.4, −1.0, −2.5 and −5 kPa using the tension table and −10 and −30 kPa using the ceramic pressure plate. After this, soil cores were oven dried at 105°C for at least 48 h to get the dry mass for measuring soil BD. This dry mass was divided by the known soil volume. The WAS was measured for the top two depths (0–5 and 5–15 cm) using the method described by Kemper and Rosenau (Reference Kemper and Rosenau1986). Three grams of 1–2 mm air-dry soil were saturated with a cold vapour machine, then transferred to shaking slots for 5 min to get unstable aggregates, the sonicator breaking down the remaining soil particles to get the stable aggregates. Then, the soil suspension was kept in the oven to dry overnight at 105°C to get to a constant weight. The percentage of soil stable aggregates was calculated by dividing the oven dry stable aggregates by the stable and unstable aggregates weight.
To study the microbial activity response to the cropping systems, urease and β-glucosidase enzymes activity were analysed for 0–5 cm depth for both years. Urease enzymes activity was ascertained with the colorimetric determination of ammonium method described by Kandeler and Gerber (Reference Kandeler and Gerber1988) using the following equation:

where NCS is the NH4-N concentration of the sample average (μg NH4-N/ml), NCC is the NH4-N content of the control (μg NH4-N/ml), DF is dilution factor (10), V is the volume of urea solution used (2.5 ml), T is incubation time (2 h), and DW is the dry weight of the soil taken (5 g). The β-glucosidase enzyme activity was determined with the method described by Eivazi and Tabatabai (Reference Eivazi and Tabatabai1988) using the following equation:

where NCS is the p-nitrophenol content of sample average (μg NH4-N/ml), NCC is the p-nitrophenol content of control (μg NH4-N/ml), V is the volume of p-nitrophenyl-β-D-glucosidase solution used (1 ml), T is incubation time (1 h), and DW is the dry weight of soil taken (1 g).
Statistical analysis
Data were normal (Skewness and Kurtosis's tests) and homogeneous (Levene's test) for all the soil parameters. Data in 2016 and 2017 were analysed using the MIXED model, with replication considering as a random effect, treatments and year considering as fixed effects. Four orthogonal linear contrasts were conducted: (1) mono-cropping (MC: which refers to the continuous wheat) compared to diverse cropping system (DC: wheat in diversified cropping system, CC, corn, pea/barley, and sunflower) (MC v. DC); (2) MC compared to wheat in diversified cropping system present in 2016 and 2017 (DC(w)) (MC v. DC(w)); (3) the CC present in 2016 and 2017 (CC) compared to the non-cover crops (NCC: wheat in diversified cropping system, corn, pea/barley and sunflower) (CC v. NCC); and (4) the legume present in 2016 and 2017 (LG) compared to non-legume crops (NLG: wheat in diversified cropping system, CC, corn and sunflower) (LG v. NLG). Mean values were separated by using pairwise differences method (adjusted by Tukey) using the GLIMMIX procedure. To evaluate the effect of crop rotation on certain soil properties, data on 2010, 2016 and 2017 were analysed using a Student's test. Differences were considered significant at 0.05 probability. All analyses were performed using SAS 9.4 software (SAS Institute Inc., Cary, NC, USA).
Results
Data on soil pH under different cropping systems at 0–5, 5–15, 15–30, 30–45 and 45–60 cm depths in 2016 and 2017 are summarized in online Supplementary Table S2. Soil pH ranged from 5.2 to 7.9 in 2016 and from 5.4 to 7.9 in 2017. The effect of cropping systems on soil pH was not significant in either year (online Supplementary Table S2). Data on SOC (g/kg) under different cropping systems for the five depths in 2016 and 2017 are represented in Fig. 2. There is a significant difference for the SOC values between 2016 and 2017, especially under CC (Fig. 2). Comparing CC and NCC at the 5–15 and 15–30 cm depths in 2017 indicated that SOC was higher under CC than NCC (Fig. 2). The other cropping system did not affect SOC at any depth in 2016 and 2017 (Fig. 7). Cold water C, CWN, HWC and HWN under different cropping systems for the 0–5 and 5–15 cm depths in 2016 and 2017 are listed in Table 2. The means for these soil C and N fractions had similar performance within each contrast group (Table 2). Data on MBC (g/kg) under different cropping systems at 0–5 cm depth in 2016 and 2017 are shown in Fig. 3. Although the MBC values (regardless of the cropping system) seem to be higher in 2016 than in 2017, no significant differences (P ≥ 0.05) on MBC between years were recorded. The effects of cropping system on MBC were significant for MC v. DC, MC v. DC(w) and LG v. NLG contrasts in both years (Fig. 3). Comparing MC to DC and MC to DC(w) showed that the mean MBC under MC was significantly lower than that under DC and DC(w) in both years (Fig. 3). The contrast of LG v. NLG indicated that LG recorded significantly lower MBC than that of the NLG in 2016; however, the trend was opposite in 2017 with LG recording higher MBC than NLG (Fig. 3). Data on soil TN (g/kg) at all five depths in both years are presented in online Supplementary Table S3. Total N values range from 0.8 to 2.4 g/kg across all depths. The effect of the cropping systems was not significant at any depth in either year (online Supplementary Table S3). Thus, TN results will not be discussed any further.

Fig. 2. Colour online. Mean value of soil organic carbon (SOC g/kg) under different cropping systems. MC, mono-cropping (continuous wheat); DC, diversified cropping system (wheat, cover crop, corn, pea/barley and sunflower); DC(w), wheat in diversified cropping system; CC, cover crop; NCC, no cover crop (wheat, corn, pea/barley and sunflower); LG, legume; NLG, no legume (wheat, cover crop, corn and sunflower). Different letters in the graphs at each depth indicate significant differences at that depth. Horizontal bars indicate standard errors of the means.

Fig. 3. Colour online. Mean value of soil microbial biomass carbon (MBC mg/kg) at 0–5 cm depth under different cropping systems in 2016 and 2017. MC, mono-cropping (continuous wheat); DC, diversified cropping system (wheat, cover crop, corn, pea/barley and sunflower); DC(w), wheat in diversified cropping system; CC, cover crop; NCC, no cover crop (wheat, corn, pea/barley and sunflower); LG, legume; NLG, no legume (wheat, cover crop, corn and sunflower). Vertical bars indicate standard errors of the means. Different letters in the graphs at each depth indicate the significant differences at that depth.
Table 2. Soil cold water-extractable C (CWC, μg/g), cold water-extractable N (CWN, μg/g), hot water-extractable C (HWC, μg/g) and hot water- extractable N (HWN, μg/g) at 0–5 and 5–15 cm depths under different treatments in 2016 and 2017

MC, mono-cropping (continuous wheat); DC, diverse cropping system (average of wheat, cover crop, corn, pea/barley and sunflower); DR(w), wheat in the diverse system; CC, cover crop; NCC, average of wheat, corn, pea/barley and sunflower; LG, legume; NLG, average of wheat, cover crop, corn and sunflower.
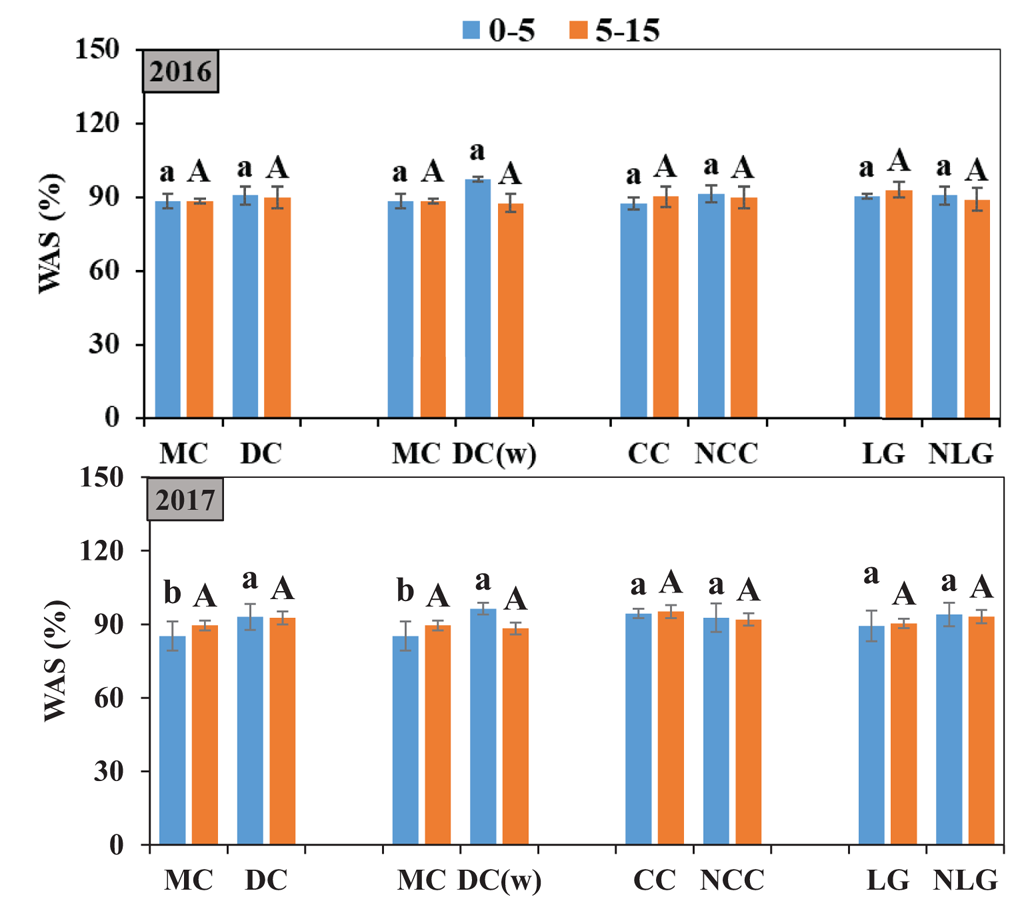
Data on BD (mg/m3) under different cropping systems at five depths in 2016 and 2017 are shown in Fig. 4. The effects of the cropping systems on BD were significant only for the MC and DC(w) contrasts at 0–5 and 30–45 cm depths in 2016 (Fig. 4), with MC recording significantly higher BD than DC(w) at these depths (Fig. 3). Data on SWR (m3/m3) under different cropping systems at 0.0, −0.4, −1.0, −2.5, −5.0, −10.0 and −30.0 kPa in 2016 and 2017 are represented in online Supplementary Fig. S2. No differences were observed on the SWR for any pressures among all comparisons of each contrast group for either year. Data on WAS (%) under different cropping systems for the 0–5 and 5–15 cm depths in 2016 and 2017 are represented in Fig. 5. No differences were observed on WAS at either depth for any contrast group treatment in 2016. However, the contrast between MC v. DC and MC v. DC(w) in 2017 showed that DC and DC(w) had higher WAS compared to MC at the 0–5 cm depth (Fig. 5).

Fig. 4. Colour online. Average soil bulk density (BD, mg/m3) at 0–5, 5–15, 15–30, 30–45 and 45–60 cm depths under different cropping systems in 2016 and 2017. MC, mono-cropping (continuous wheat); DC, diversified cropping system (wheat, cover crop, corn, pea/barley and sunflower); DC(w), wheat in diversified cropping system; CC, cover crop; NCC, no cover crop (wheat, corn, pea/barley and sunflower); LG, legume; NLG, no legume (wheat, cover crop, corn and sunflower). Vertical bars indicate standard errors of the means. Different letters in the graphs at each depth indicate the significant differences at that depth.

Fig. 5. Colour online. Average soil wet soil aggregate stability (WAS %) at 0–5 and 5–15 cm depths under different cropping systems in 2016 and 2017. MC, mono-cropping (continuous wheat); DC, diversified cropping system (wheat, cover crop, corn, pea/barley and sunflower); DC(w), wheat in diversified cropping system; CC, cover crop; NCC, no cover crop (wheat, corn, pea/barley and sunflower); LG, legume; NLG, no legume (wheat, cover crop, corn and sunflower). Vertical bars indicate standard errors of the means. Different small letters indicate significance at 0–5 cm depth, and different capital letters indicate a significant difference at 5–15 cm depth.
Data on urease and β-glucosidase (μg/g/h) under different cropping systems at 0–5 cm depth in both years are shown in Fig. 6. Regardless of the cropping system, both urease and β-glucosidase were lower (P values ≥0.05) in 2016 than in 2017 (Fig. 6). No significant differences were observed in urease among each contrast group in 2016 (Fig. 6). However, the results of MC v. DC and MC v. DC(w) contrasts in 2017 showed that DC and DC(w) had higher urease than MC (Fig. 6). The effects of cropping systems on β-glucosidase were significant for MC v. DC contrast in 2017 and for MC v. DC(w) contrast in 2016, with β-glucosidase being higher under DC compared to MC in 2017 and under DC(w) compared to MC in 2016 (Fig. 6).

Fig. 6. Colour online. Average soil urease (μg/g/h) and β-glucosidase (μg/g/h) enzymes activity at 0–5 cm depth under different cropping systems in 2016 and 2017. MC, mono-cropping (continuous wheat); DC, diversified cropping system (wheat, cover crop, corn, pea/barley and sunflower); DC(w), wheat in diversified cropping system; CC, cover crop; NCC, no cover crop (wheat, corn, pea/barley and sunflower); LG, legume; NLG, no legume (wheat, cover crop, corn and sunflower). Vertical bars indicate standard errors of the means. Different letters in the graphs at each depth indicate the significant differences at that depth.
Comparison of pH, EC and TN measured in 2016 and 2017 to baseline values at the research site prior to the establishment of treatments is represented in Fig. 7. Although only three parameters were included, it gave an overall picture of the soil quality changes over time. Soil pH and TN values in 2010 were similar to the average of 2016 and 2017 (Fig. 7). However, EC in 2010 was significantly higher compared to the average of 2016 and 2017 (Fig. 7).

Fig. 7. Colour online. Average values of soil pH, electrical conductivity (EC, ds/m) and total nitrogen (TN, g/kg) under different cropping systems for 2010, and 2016–2017 at 0–5 cm depth. Vertical bars indicate standard errors of the means. Different letters in the graphs indicate significant differences.
Discussion
The absence of significant effects due to crop diversity on soil pH in the current study (online Supplementary Table S2) may be due to the strong buffering capacity of the soil of the present study. Soils with a high amount of clay have a larger number of surface sites, and thus can hold hydrogen ions and resist changes in hydrogen ion concentration in the soil solution (Weaver et al., Reference Weaver, Kissel, Chen, West, Adkins, Rickman and Luvall2004; McCauley et al., Reference McCauley, Jones and Olson-Rutz2017). Similarly, Sharma et al. (Reference Sharma, Irmak and Padhi2018) conducted a study on silt loam soil and reported that CC with corn or soybean recorded similar soil pH as that with corn or soybean without CC over the 4 years of the experiment. Roldán et al. (Reference Roldán, Caravaca, Hernández, Garcıa, Sánchez-Brito, Velásquez and Tiscareño2003) also reported that the pH of sandy loam soil did not change with or without leguminous Vici asp. and leguminous P. vulgaris. However, Zuber et al. (Reference Zuber, Behnke, Nafziger and Villamil2015) reported that soil pH after 15–20 years of rotation was significantly different from that of the MC for clay loam soil.
Soil organic C is an essential indicator of soil quality and fertility (Lal, Reference Lal2015; Fu et al., Reference Fu, Wang, Sainju and Liu2017). Crop diversity is considered one of the management practices that can best increase SOC by increasing soil aggregate, soil moisture, nutrient cycling and biological activities (Studdert, Reference Studdert2000; Karlen et al., Reference Karlen, Hurley, Andrews, Cambardella, Meek, Duffy and Mallarino2006; Aller et al., Reference Aller, Mazur, Moore, Hintz, Laird and Horton2017). The large increments in SOC from 2016 to 2017 may be due to the increase in β-glucosidase activity in the latter compared to the former (Fig. 6), which can enhance C storage (Adetunji et al., Reference Adetunji, Lewu, Mulidzi and Ncube2017). Similar SOC between DC and DC(w) and MC were recorded at the time when a 5-year rotation cycle was completed and even when a new rotation cycle began afterwards (Fig. 2). Significant changes in SOC may need long-term study to be detected. Van Eerd et al. (Reference Van Eerd, Congreves, Hayes, Verhallen and Hooker2014) conducted a study for 11 years and reported no SOC differences were observed between continuous corn, continuous soybean, soybean-corn, soybean–wheat, and soybean–wheat–corn systems. Jarecki et al. (Reference Jarecki, Grant, Smith, Deen, Drury, VanderZaag, Qian, Yang and Wagner-Riddle2018) found that corn grown with oats (Avena sativa L.)–alfalfa (Medicago sativa) in a sequence for 57 years recorded higher SOC than continuous corn. Diverse cropping systems input more crop residues than MC (Gál et al., Reference Gál, Vyn, Michéli, Kladivko and McFee2007), resulting in higher SOC. However, CC increased SOC compared to NCC in 2017 (Fig. 2), which may be associated with diversified microbial communities more present in CC than in NCC plots (Sainju and Singh, Reference Sainju and Singh1997; Dabney et al., Reference Dabney, Delgado and Reeves2001; Kabir and Koide, Reference Kabir and Koide2002; Sarrantonio and Gallandt, Reference Sarrantonio and Gallandt2003) and rapid decay of the CC residues compared to the other crops (Buchanan and King, Reference Buchanan and King1993). This finding suggested that alternating long-term CC has the potential to increase SOC (Poeplau et al., Reference Poeplau, Aronsson, Myrbeck and Kätterer2015). There were no noticeable SOC changes between LG and NLG in this study (Fig. 2), which was in agreement with Drinkwater et al. (Reference Drinkwater, Wagoner and Sarrantonio1998), who reported that the C storage was not quantitatively different among legume-based and conventional (corn–soybean) treatments.
Total soil C and N pools consist of the labile and stable C and N (Liu et al., Reference Liu, Yan, Mei, Zhang and Fan2013). The labile C and N breakdown faster and active food source for microorganisms (Juan et al., Reference Juan, Zhao, Li, Jiang and Bing2008; Ciampitti et al., Reference Ciampitti, García, Picone and Rubio2011; Uchida et al., Reference Uchida, Nishimura and Akiyama2012). The stable C cannot be directly used by microbes, but makes a great contribution in soil aggregation, water holding capacity, the maintenance of soil structure and soil C sequestration (Li et al., Reference Li, Wen, Li, Li, Yang, Lin, Song, Cooper and Zhao2018). Labile C and N fractions are considered a sensitive index of changes in soil quality due to the fast turnover rate (Soon et al., Reference Soon, Arshad, Haq and Lupwayi2007). Compared with CWC and CWN, HWC and HWN have higher biodegradability rate and can supply higher nutrients and energy for plant and microbes (Gregorich et al., Reference Gregorich, Beare, Stoklas and St-Georges2003). The findings in the current study showed that all labile C and N fractions under all cropping systems had similar performance in both years (Table 2), also associated with the turnover rate of labile C and N fractions (Jandl and Sollins, Reference Jandl and Sollins1997; Zhang et al., Reference Zhang, Han, Yu, Wang and Cheng2017). These findings are consistent with the results of a long-term study in the USA conducted by Alhameid et al. (Reference Alhameid, Ibrahim, Kumar, Sexton and Schumacher2017) who reported that DC did not impact soil C and N fractions compared to MC under similar weather conditions. Another long-term study conducted in Canada indicated that crop diversity [pea–wheat–canola (Brassica rapa L.)–wheat] did not affect CWC compared to continuous wheat, which was attributed to the unstable character of CWC (Soon et al., Reference Soon, Arshad, Haq and Lupwayi2007). A study conducted in Mexico showed that including the leguminous P. vulgaris CC did not make significant changes regarding the water-soluble C (Roldán et al., Reference Roldán, Caravaca, Hernández, Garcıa, Sánchez-Brito, Velásquez and Tiscareño2003).
Microbial biomass C is an important living component of soil labile C, which directly involves crop nutrient supply and cycling (Moore et al., Reference Moore, Klose and Tabatabai2000; Guimarães et al., Reference Guimarães, Gonzaga, da Silva, da Silva, da Silva Dias and Matias2013; Bongiorno et al., Reference Bongiorno, Bünemann, Oguejiofor, Meier, Gort, Comans, Mäder, Brussaard and de Goede2019). Numerous studies have reported that MBC is easily affected by crop management and cultural treatments (de Moraes Sá et al., Reference de Moraes Sá, Carlos, Cerri, Dick, Lal, Solismar Filho, Piccolo and Feigl2001; Chu et al., Reference Chu, Lin, Fujii, Morimoto, Yagi, Hu and Zhang2007; Chen et al., Reference Chen, Hou, Gong, Li, Fan and Kuzyakov2009; Liang et al., Reference Liang, Chen, Gong, Fan, Yang, Lal and Kuzyakov2012). In the current study, MBC under MC was lower than that under DC and DC(w) at the 0–5 cm depth in both years (Fig. 3), likely because crop diversity can increase quantity and health of plant residues entering the soil, thus accelerating the growth of microorganisms. Several studies have reported that crop diversity increased MBC compared to MC (Moore et al., Reference Moore, Klose and Tabatabai2000; Balota et al., Reference Balota, Colozzi Filho, Andrade and Dick2004a; Govaerts et al., Reference Govaerts, Mezzalama, Unno, Sayre, Luna-Guido, Vanherck, Dendooven and Deckers2007). Cover crops can stimulate soil microbial activity and can change the amount of soil microbial biomass (Wang et al., Reference Wang, Li and Klassen2007; Frasier et al., Reference Frasier, Noellemeyer, Figuerola, Erijman, Permingeat and Quiroga2016). However, CC did not affect MBC compared to NCC in this reported study (Fig. 3). Based on published literature, the effects of CC on MBC are not consistent because of several factors, including climate conditions, CC type, soil temperature and moisture, pH, and aeration (Finney et al., Reference Finney, Buyer and Kaye2017; Kumar et al., Reference Kumar, Kundu, Ghorai, Mitra and Singh2018). For example, Garcia et al. (Reference Garcia, Li and Rosolem2013) reported that a high C content or C:N ratio in CC may inhibit soil microbial activity. Although the MBC values (regardless of the cropping system) seem to be higher in 2016 than in 2017, no significant differences in MBC between years were recorded. The reasons for higher MBC from NLG compared to LG in 2016 were not known in this study. As it was expected LG increased MBC compared to NLG in 2017, supporting the results of Loeppmann et al. (Reference Loeppmann, Blagodatskaya, Pausch and Kuzyakov2016) and Soon et al. (Reference Soon, Arshad, Haq and Lupwayi2007), who reported that residues from legumes have a higher N content, which can enhance MBC. The increase in microbial activity under one cropping system compared to another in this study was not always accompanied with differences in C between these systems as seen in the SOC results. Increasing microbial activity can increase C and N mineralization, which may cause an increase in the loss of C into the atmosphere (Bardgett et al., Reference Bardgett, Freeman and Ostle2008).
Soil BD is an indispensable indicator of soil quality and productivity, which reflects the degree of soil compaction and influences the air, water and nutrient movement and retention (De Vos et al., Reference De Vos, Van Meirvenne, Quataert, Deckers and Muys2005; Rodríguez-Lado et al., Reference Rodríguez-Lado, Rial, Taboada and Cortizas2015; Chen et al., Reference Chen, Richer-de-Forges, Saby, Martin, Walter and Arrouays2018). Crop diversity is one of the most important managements that can influence BD (Calonego and Rosolem, Reference Calonego and Rosolem2008; Nascente et al., Reference Nascente, Li and Crusciol2015; Rorick and Kladivko, Reference Rorick and Kladivko2017). Crop diversity decreased BD compared to MC when a 5-year rotation cycle was completed (Fig. 4), supporting the results reported by Feng et al. (Reference Feng, Sharratt and Young2011) and Shrestha et al. (Reference Shrestha, McConkey, Smith, Desjardins, Campbell, Grant and Miller2013). A study conducted by Garcia et al. (Reference Garcia, Li and Rosolem2013) recommended DC as a management practice to reduce soil BD. This reduced BD in DC is likely related to greater aggregate stability and greater residue accumulation from DC compared to MC (Kazula et al., Reference Kazula, Lauer and Arriaga2017). However, this decrease in BD from DC compared to MC was not observed when a new rotation cycle began afterwards (Fig. 5). Differences in weather conditions between 2016 and 2017 (Fig. 2) may result in differences in the response of BD to the cropping systems in these 2 years.
Soil water retention is an important hydraulic property associated with soil porosity; therefore, it can influence water and nutrient transport and storage and crop usage efficiency (Saxton and Rawls, Reference Saxton and Rawls2006; Kazula et al., Reference Kazula, Lauer and Arriaga2017). Crop diversity may indirectly impact SWR by altering the soil porosity, soil C content and its turnover rate (McVay et al., Reference McVay, Budde, Fabrizzi, Mikha, Rice, Schlegel, Peterson, Sweeney and Thompson2006). However, the findings in the current study showed that the SWR was not affected by crop diversity (online Supplementary Fig. 2S). The non-significant effect from crop diversity on SOC at the surface depth may explain the lack of effect on SWR from crop diversity. Irmak et al. (Reference Irmak, Sharma, Mohammed and Djaman2018) reported that CC–corn system did not impact SWR compared to corn without CC. However, Qi et al. (Reference Qi, Helmers and Kaleita2011) reported that in the USA, the corn–soybean system with winter rye as a CC increased the SWR compared with the corn–soybean system without CC.
Diversifying the cropping system is considered one of the agricultural practices that can best increase soil C and ultimately improve aggregate development (Wright and Anderson, Reference Wright and Anderson2000; Kazula et al., Reference Kazula, Lauer and Arriaga2017). Soils with weak aggregate structure are highly susceptible to wind and water erosion (Williams et al., Reference Williams, Reardon, Wuest and Long2018). The findings in the current study showed that WAS under MC and DC and DC(w) were similar when a 5-year rotation cycle was completed, but it was expected WAS under MC was lower compared to DC and DC(w) when a new rotation cycle began afterwards (Fig. 5). Increasing the underground biomass production through crop diversity can loosen soil and improve soil structure (Holeplass et al., Reference Holeplass, Singh and Lal2004). Nouwakpo et al. (Reference Nouwakpo, Song and Gonzalez2018) reported that soybean under corn–soybean system recorded significantly higher WAS compared to continuous soybean at 0–15 and 15–30 cm depths. Alhameid et al. (Reference Alhameid, Ibrahim, Kumar, Sexton and Schumacher2017) reported that corn–soybean–wheat and corn–soybean–wheat–oat systems had significantly increased WAS compared with corn–soybean system at 0–15 cm depth. Cover crop root exudates alter the quality and quantity of SOC, biological activity and environment (Congreves et al., Reference Congreves, Hayes, Verhallen and Van Eerd2015); however, CC did not affect WAS compared to NCC in this study. Rorick and Kladivko (Reference Rorick and Kladivko2017) reported that corn–soybean system with CC increased the WAS compared with NCC systems at 0–10 and 10–20 cm depths after 4-year rye CC application. As discussed above, CC effects on soil properties may be influenced by climate conditions and CC type.
Compared to soil physical and chemical properties, soil biological properties such as microbial activity are easier to change (Ajwa et al., Reference Ajwa, Dell and Rice1999; Wang et al., Reference Wang, Dorodnikov, Yang, Zhang, Filley, Turco, Zhang, Xu, Li and Jiang2015). Therefore, microbiological properties such as soil enzyme activity can be used as a sensitive potential index for maintaining soil biological diversity and soil quality. Urease can promote the hydrolysis of urea in soil, thus supplying nutrients to plants (Lloyd and Sheaffe, Reference Lloyd and Sheaffe1973; Dharmakeerthi and Thenabadu, Reference Dharmakeerthi and Thenabadu2013). The β-glucosidase is considered a sensitive soil biological indicator which reflects short-term changes in soil quality (Melero et al., Reference Melero, López-Bellido, López-Bellido, Muñoz-Romero, Moreno and Murillo2011; Sanaullah et al., Reference Sanaullah, Razavi, Blagodatskaya and Kuzyakov2016). Higher precipitation was received in May of 2017 compared to May of 2016 (online Supplementary Fig. S1) which caused an increase in soil moisture in June of 2017 compared to 2016 (data not showed), thus increasing decomposition rate and microbial activities, perhaps explaining why both urease and β-glucosidase were lower in 2016 than in 2017 in this study. Soil moisture is the major factor influencing enzyme activity as reported by Brockett et al. (Reference Brockett, Prescott and Grayston2012).
The results reported here showed that urease activity was similar under DC and DC(w) compared to MC at the time when a 5-year rotation cycle was completed, but as it was expected, urease activity was higher under DC and DC(w) compared to MC when a new rotation cycle began afterwards (Fig. 6), due to the fact that lower diversity crops had less soil C and underground biomass inputs (Eivazi et al., Reference Eivazi, Bayan and Schmidt2003). A study conducted by Balota et al. (Reference Balota, Kanashiro, Colozzi Filho, Andrade and Dick2004b) reported that crop diversity with a high input and diversity of organic materials can directly influence the activity of microbial populations and enzymes in soils compared with MC systems. Similarly, Klose and Tabatabai (Reference Klose and Tabatabai2000) reported that the urease activity was higher in 4-year oats–meadow systems as compared to continuous corn. In addition, Zhong et al. (Reference Zhong, Huicai and Zhiqiang2015) reported that banana–papaya (Carica) system had higher urease activity than banana MC.
Lower β-glucosidase under MC compared to DC(w) at the time when a 5-year rotation cycle was completed under MC compared to DC when a new rotation cycle began afterwards (Fig. 6) can be attributed to the fact that DC can modify the soil C content and, thereby, increasing the available energy source for crop growth (Acosta-Martínez et al., Reference Acosta-Martínez, Zobeck, Gill and Kennedy2003; Qin et al., Reference Qin, Yeboah, Cao, Zhang, Shi and Liu2017). Differences in weather conditions between 2016 and 2017 (Fig. 2) may result in differences in the response of β-glucosidase to the cropping system in these 2 years as discussed earlier. Zhang et al. (Reference Zhang, Li, Ren, Tian, Wang, He and Tian2014) reported that the bacterial community and β-glucosidase activity under corn–soybean system and continuous corn treatment were similar. The effect of CC and legumes on urease and β-glucosidase activity was not observed in the current study (Fig. 6). However, Mbuthia et al. (Reference Mbuthia, Acosta-Martínez, DeBruyn, Schaeffer, Tyler, Odoi, Mpheshea, Walker and Eash2015) found that cropping systems including CC (vetch) significantly increased the β-glucosidase content compared to treatments without CC, most likely because different quantities of SOC input and microbial respiration are produced by different types of CC. Liang et al. (Reference Liang, Grossman and Shi2014) found that the Austria winter pea had a significantly positive effect on β-glucosidase compared to NCC and other types of CC (hairy vetch and crimson). The different results between these cited studies and the current study may be attributed to the different kinds of legumes and CC utilized.
In this study, comparison of data measured to baseline values in this study at the research site prior to the establishment of treatments revealed that crop rotation did not affect pH and TN, but decreased EC over time (Fig. 7). The results of soil pH and TN were consistent with that reported by Neugschwandtner et al. (Reference Neugschwandtner, Száková, Pachtrog, Tlustoš, Černý, Kulhánek, Kaul, Euteneuer, Moitzi and Wagentristl2020) that observed no significant difference in soil pH and TN after 15 years of different crop rotation managements. However, salt levels in the soil were decreased over time. This reduction over time can be attributed to the removal of nutrients by crops (Drury et al., Reference Drury, Yang, Reynolds and Tan2004), supporting the results reported by Gura and Mnkeni (Reference Gura and Mnkeni2019), who found that crop rotation had positive effects in reducing salinity levels.
Conclusions
This study was conducted to explore the response of soil quality to crop diversity under no-till system. Soil properties were compared between DC and MC, DC(w) and MC, CC and NCC, and LG and NLG for 2 years. The soil pH, SWR, TN, CWC, CWN, HWC and HWN were not affected by cropping systems for both years. Crop diversity improved SOC, MBC, WAS and urease and β-glucosidase activity, and lowered BD. Crop diversity, especially cropping systems including cover crops, can sustain soil quality by enhancing SOC and reducing soil BD, making a great contribution for agroecosystems sustainable for soils. Future studies are needed to characterize the long-term crop diversity influence on soil quality.
Supplementary material
The supplementary material for this article can be found at https://doi.org/10.1017/S0021859620000994
Financial support
This work was supported by the USDA National Institute of Food and Agriculture, Coordinated Agricultural Projects (CAP) (Award No. 2016-68004-24768) and the project entitled ‘Back to the Future: Enhancing food security and farm production with integrated crop-livestock production systems’.
Conflict of interest
None.
Ethical standards
Not applicable.