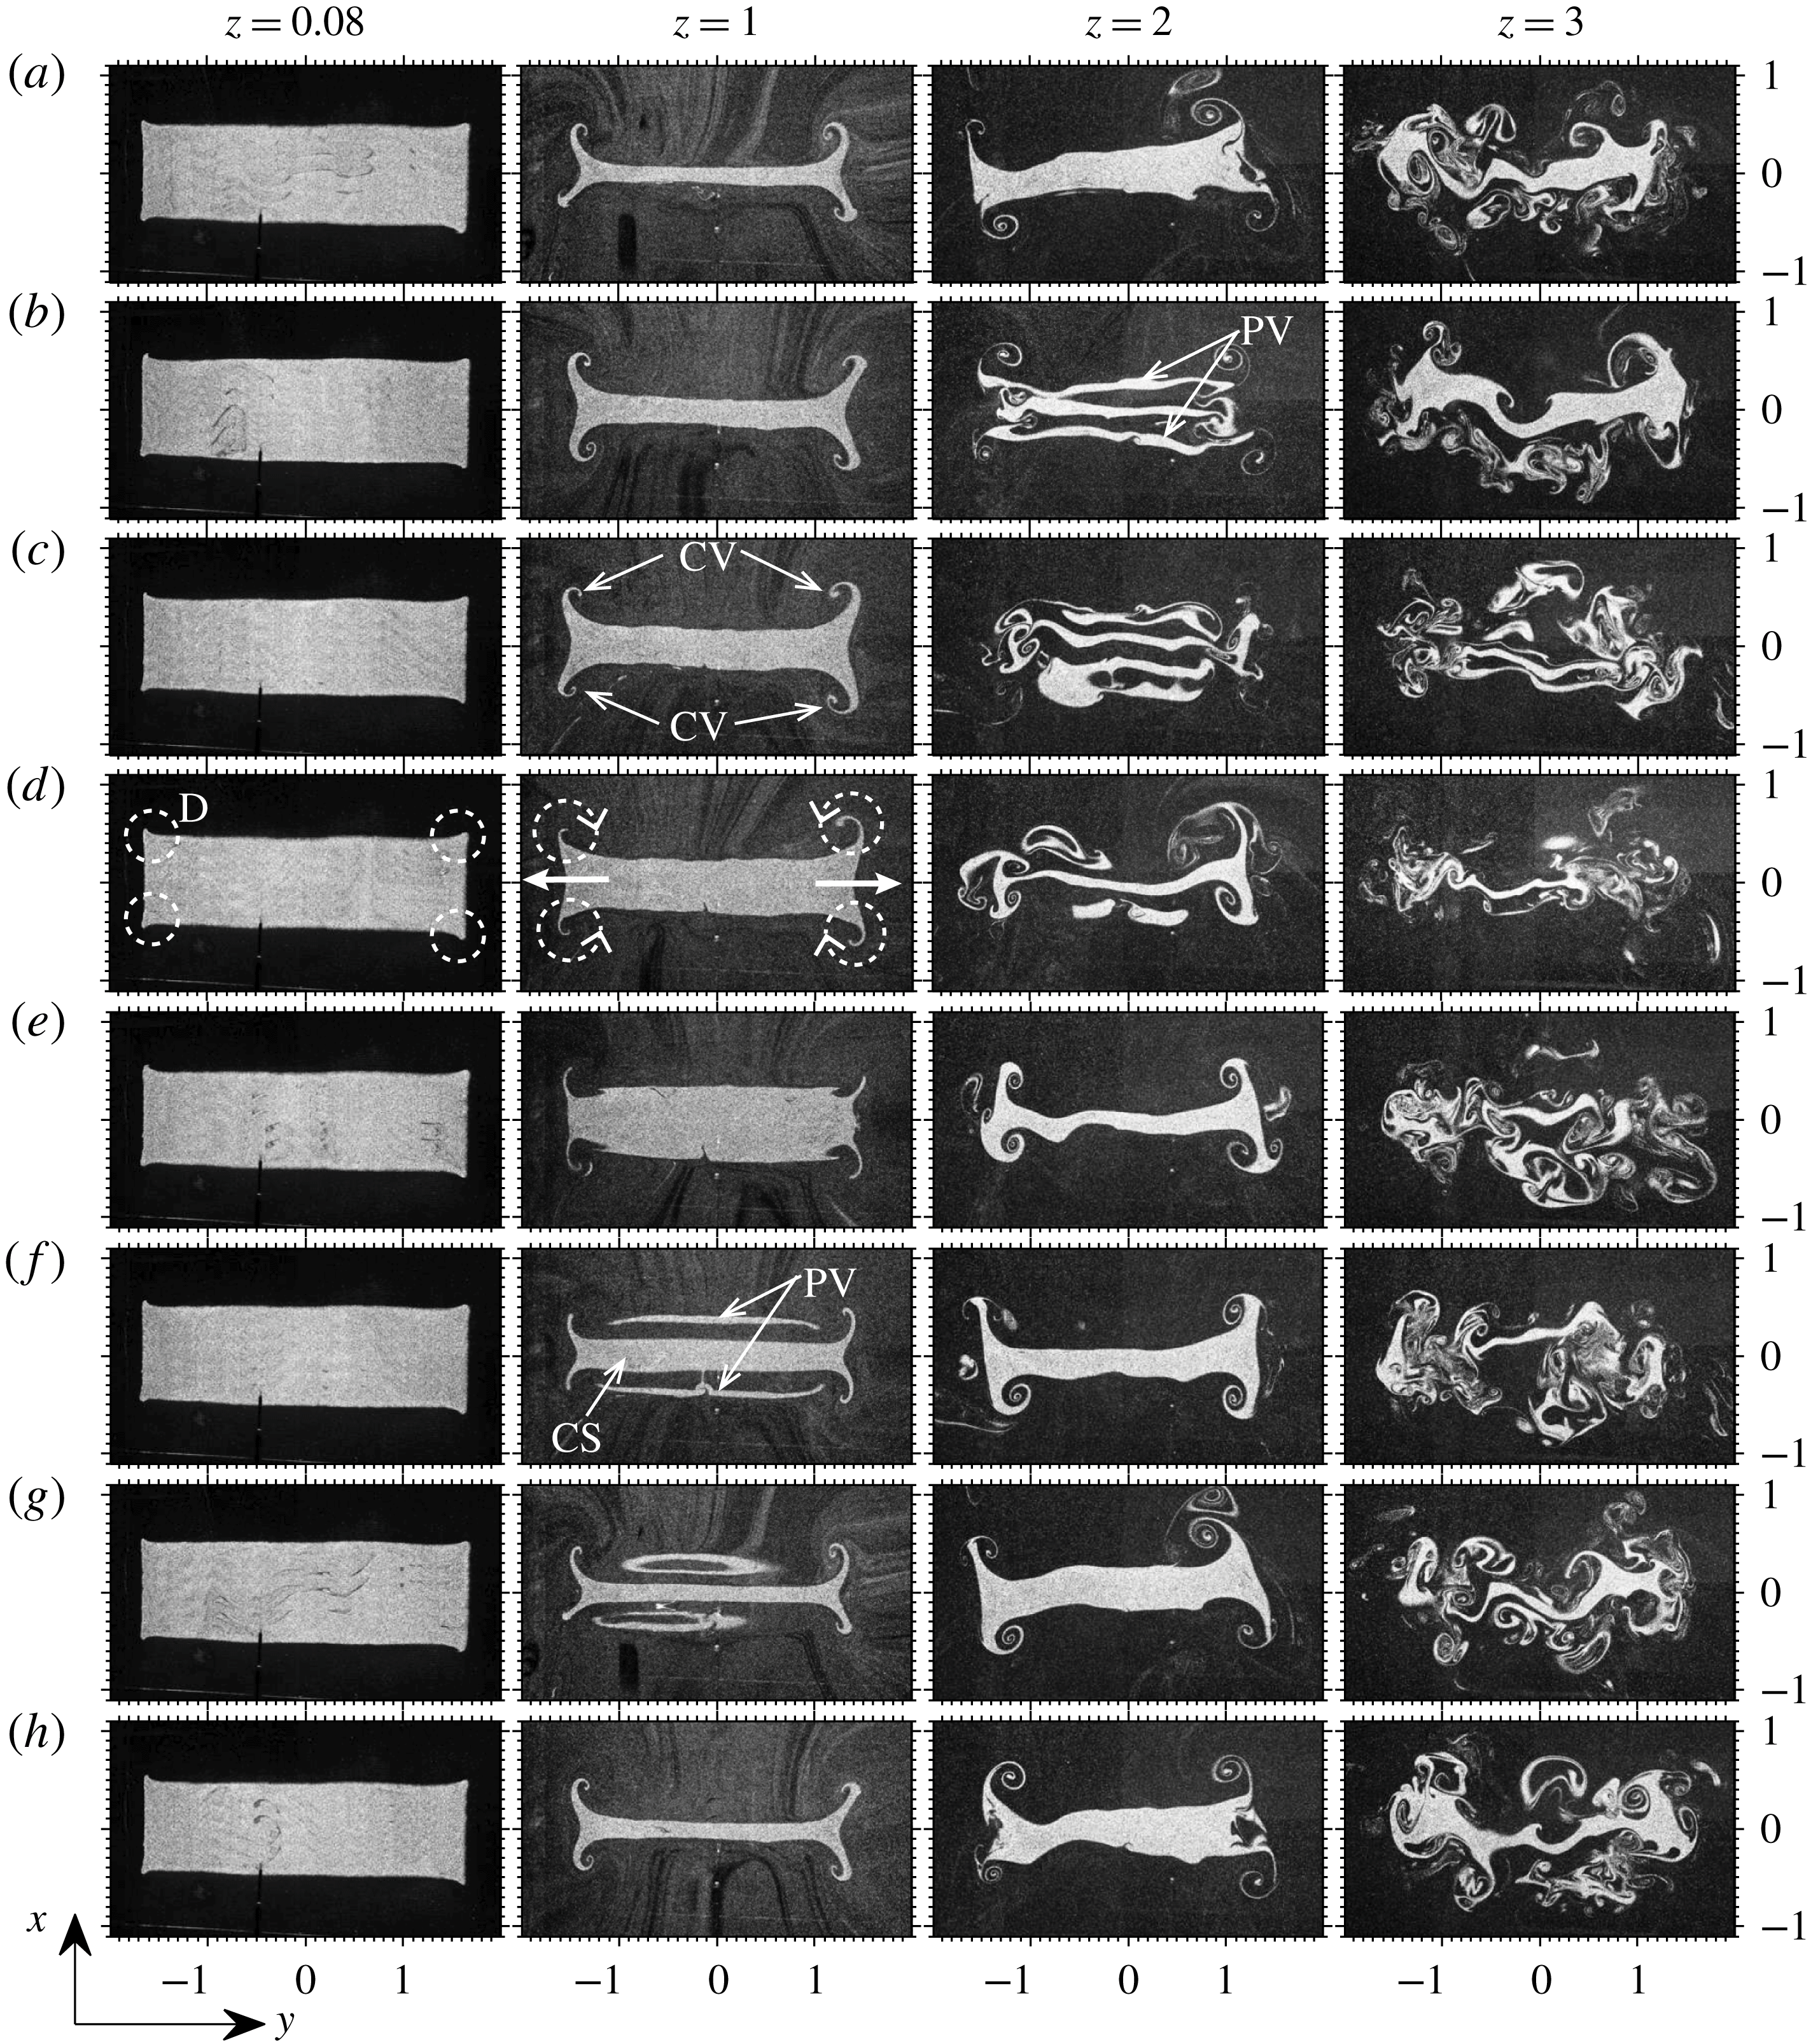
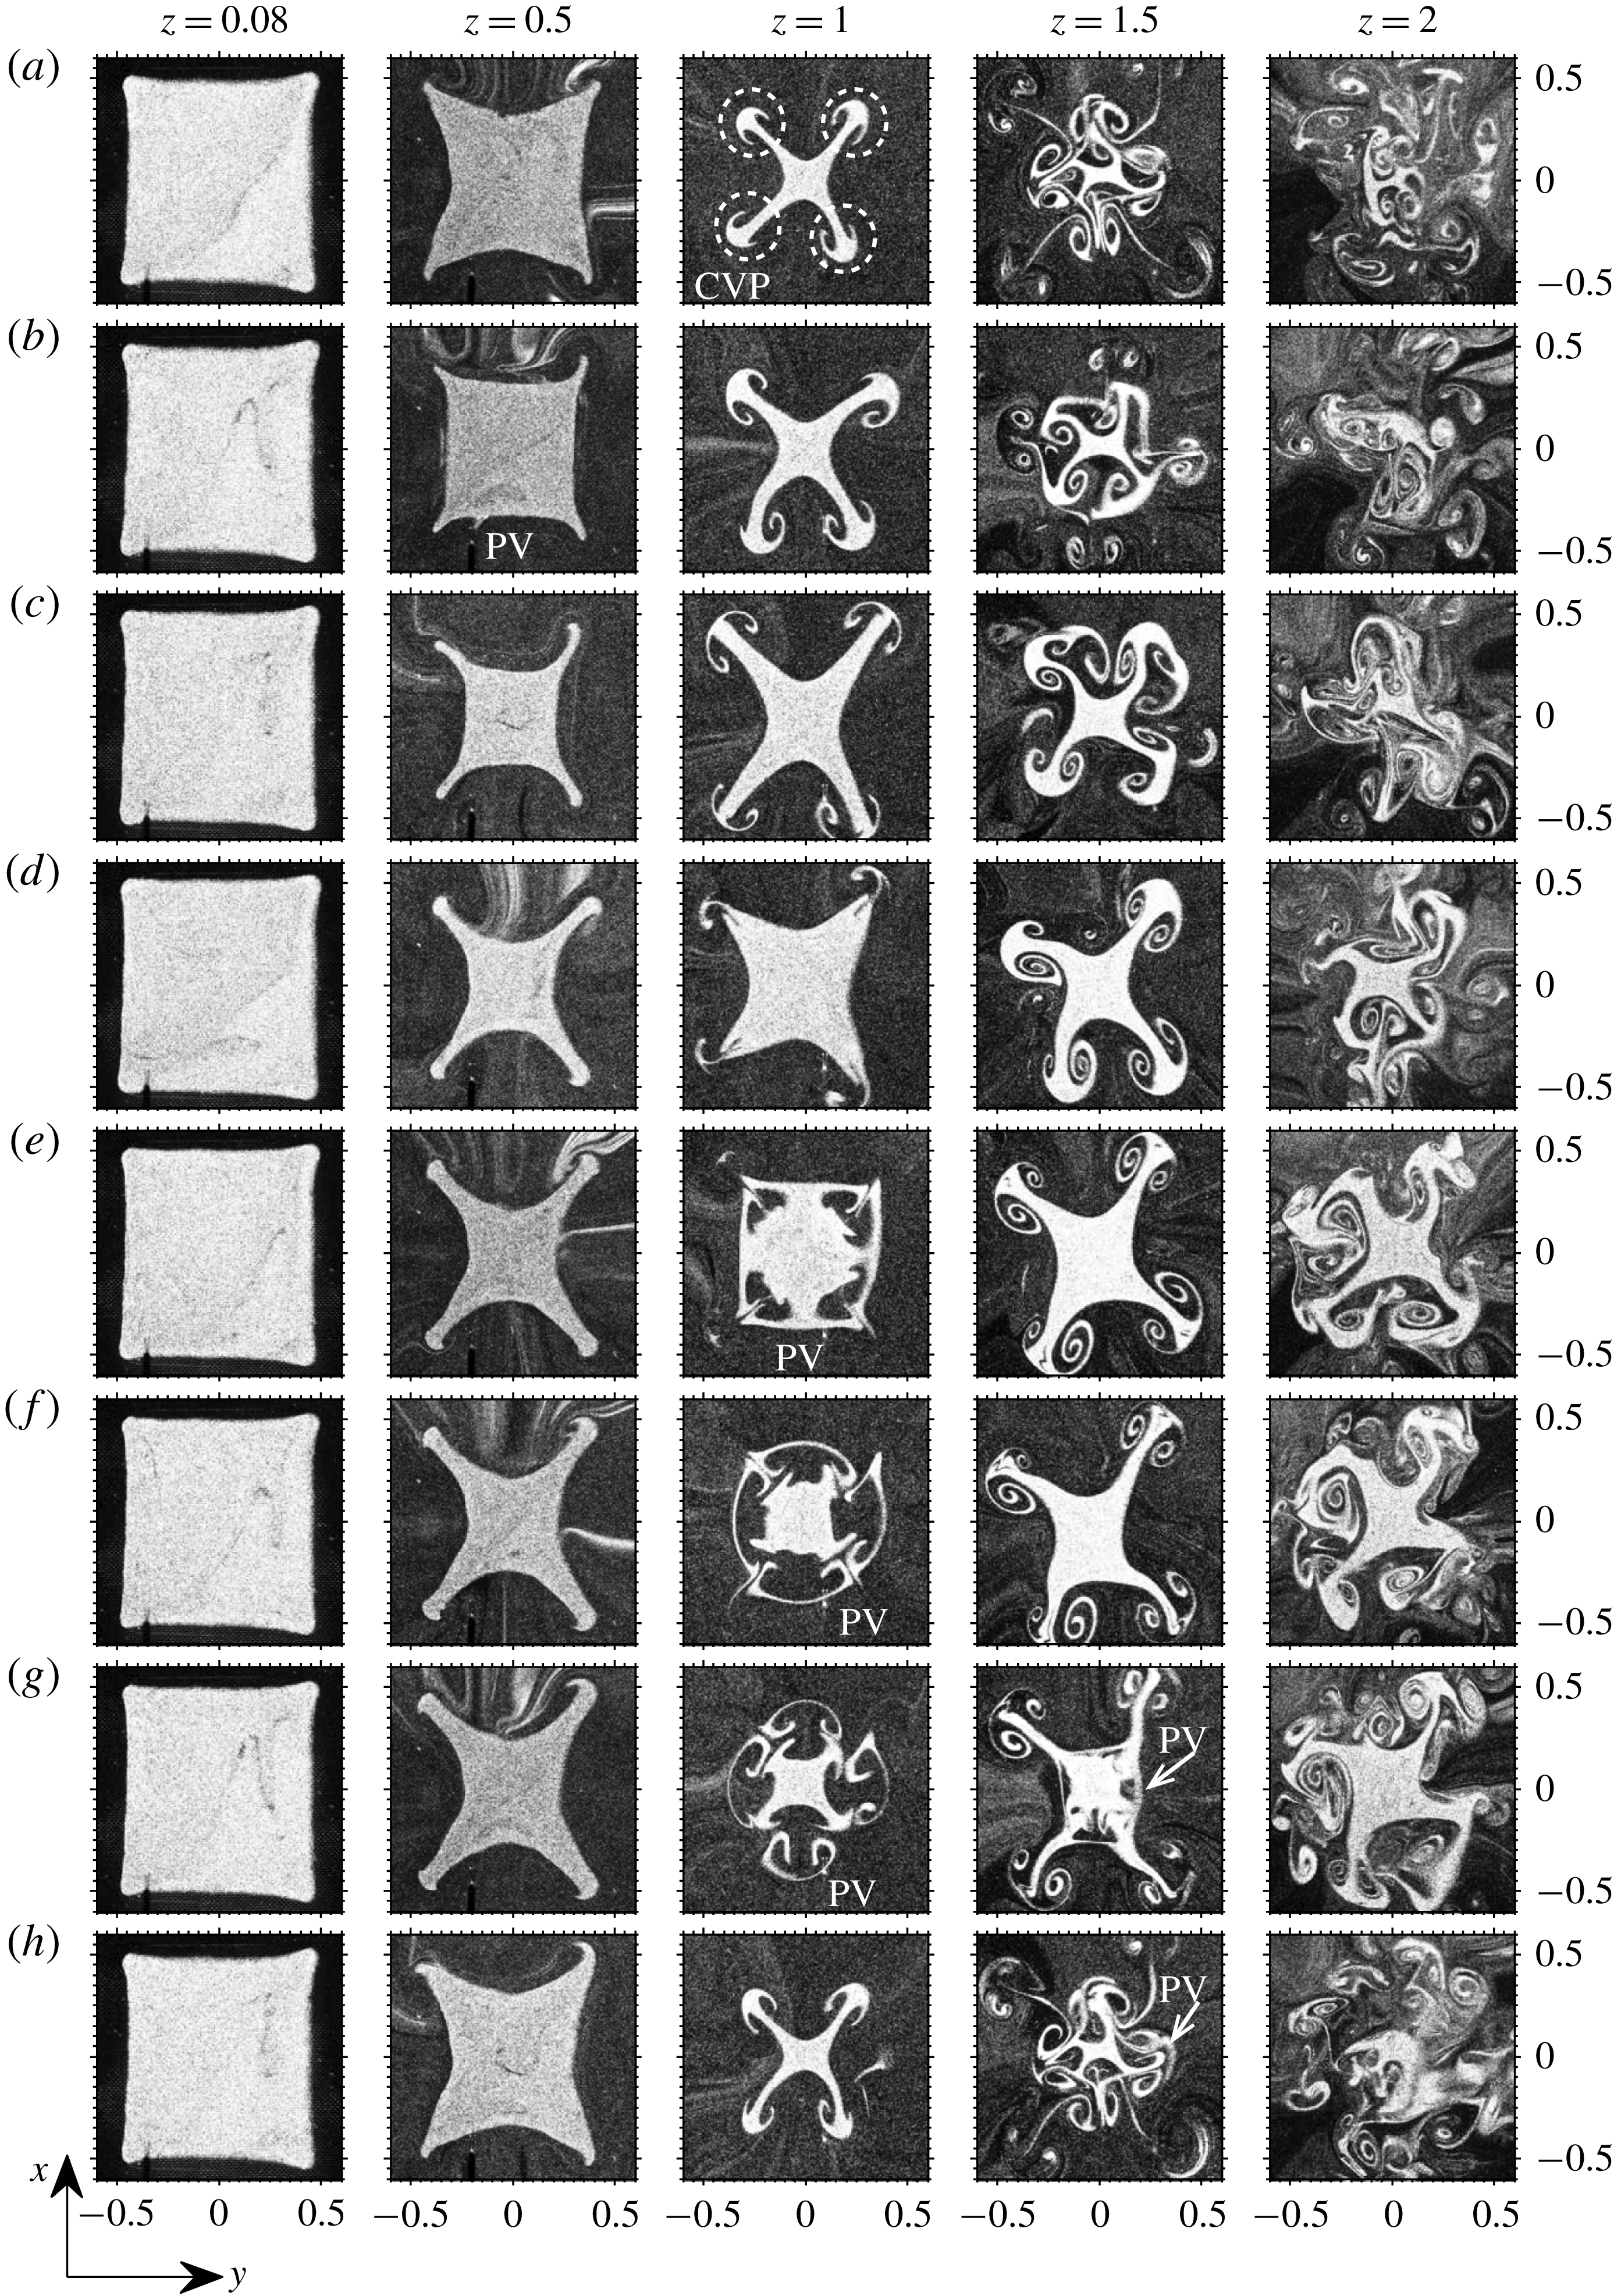
1 Introduction
A low-density fluid ejecting out vertically with an initial momentum into a high-density quiescent environment is termed a buoyant plume when the buoyancy dominates the inertial forces at its source. Under certain conditions, these buoyant plumes exhibit self-excited oscillations nearer to their sources, which involve repetitive formation and shedding of vortical structures at a prescribed frequency. This phenomenon, observed in both reacting and non-reacting plumes, is termed puffing (Malalasekera, Versteeg & Gilchrist Reference Malalasekera, Versteeg and Gilchrist1996; Tieszen Reference Tieszen2001). The study of puffing in low-density gas plumes has received considerable attention since the vortical structures that arise from puffing play an active role in near-field entrainment and mixing. In reacting plumes, puffing enhances oxygen supply and thereby directly controls combustion nearer to the source.
Among the various inlet configurations, the study of puffing in plumes emanating from circular sources has received wide attention. The onset of puffing, flow features, oscillation frequency correlations and mechanisms responsible for puffing were extensively investigated in circular plumes by employing experiments (Subbarao & Cantwell Reference Subbarao and Cantwell1992; Cetegen & Ahmed Reference Cetegen and Ahmed1993; Cetegen & Kasper Reference Cetegen and Kasper1996; Cetegen Reference Cetegen1997), numerical simulations (Jiang & Luo Reference Jiang and Luo2000a ,Reference Jiang and Luo b ) and linear stability analysis (Bharadwaj & Das Reference Bharadwaj and Das2017; Chakravarthy, Lesshafft & Huerre Reference Chakravarthy, Lesshafft and Huerre2018). In our recent study (Bharadwaj & Das Reference Bharadwaj and Das2017), we performed a comprehensive parametric investigation to examine the effect of various non-dimensional parameters and inlet conditions on puffing instability in circular plumes. Using global instability analysis, we identified instability modes, delineated regions of global instability, obtained frequency scaling laws for these globally unstable modes and identified mechanisms responsible for puffing. While our study addressed the puffing instability in helium–air plumes, Chakravarthy et al. (Reference Chakravarthy, Lesshafft and Huerre2018) investigated puffing in thermal plumes by employing both local and global instability analysis. Overall, these instability studies revealed that puffing occurs in buoyant plumes as a result of linear global instability. Similar to circular plumes, puffing is also observed in two-dimensional (2D) line plumes (Soteriou, Dong & Cetegen Reference Soteriou, Dong and Cetegen2002) and plumes that arise out of rectangular sources (Cetegen, Dong & Soteriou Reference Cetegen, Dong and Soteriou1998). In these planar inlet configurations, this instability is characterized by the periodic formation, growth and downstream convection of a symmetric line vortex pair of opposite circulations (i.e. varicose mode). While circular plumes have received considerable attention, the planar plumes lack a parametric investigation which forms the motivation for the present study. Thus, the present work aims to investigate the puffing behaviour observed in plumes emanating from planar configurations following an approach similar to that of our earlier work (Bharadwaj & Das Reference Bharadwaj and Das2017), by employing both BiGlobal linear stability analysis and experiments.
The earlier investigations of planar plumes were largely carried out by Cetegen and co-authors. Cetegen et al. (Reference Cetegen, Dong and Soteriou1998) investigated the planar plumes of helium and helium–air mixtures emanating into air from rectangular nozzles of aspect ratios (ARs) varying in the range
![]() $2.9\leqslant \text{AR}\leqslant 10$
. In Richardson number range
$2.9\leqslant \text{AR}\leqslant 10$
. In Richardson number range
![]() $1<Ri<100$
, they found that the plume oscillation frequencies correlate well in terms of non-dimensional parameters
$1<Ri<100$
, they found that the plume oscillation frequencies correlate well in terms of non-dimensional parameters
![]() $St$
and
$St$
and
![]() $Ri$
with a power law
$Ri$
with a power law
![]() $St=0.55Ri^{\,0.45}$
, which is different from that of circular plumes. Also, they demarcated the non-puffing and puffing regions on the
$St=0.55Ri^{\,0.45}$
, which is different from that of circular plumes. Also, they demarcated the non-puffing and puffing regions on the
![]() $Re{-}S$
plane, ignoring the effect of Froude number (
$Re{-}S$
plane, ignoring the effect of Froude number (
![]() $Fr$
) similar to their circular plume experiments (Cetegen Reference Cetegen1997). In their later work, Soteriou et al. (Reference Soteriou, Dong and Cetegen2002) performed Lagrangian simulations in 2D line plumes of helium and helium–air mixtures. They ascertained that
$Fr$
) similar to their circular plume experiments (Cetegen Reference Cetegen1997). In their later work, Soteriou et al. (Reference Soteriou, Dong and Cetegen2002) performed Lagrangian simulations in 2D line plumes of helium and helium–air mixtures. They ascertained that
![]() $Fr$
plays a significant role in plume transition, and therefore cannot be ignored. Using simulations, they demarcated regions of puffing and non-puffing on the
$Fr$
plays a significant role in plume transition, and therefore cannot be ignored. Using simulations, they demarcated regions of puffing and non-puffing on the
![]() $Re{-}S$
plane for plumes of
$Re{-}S$
plane for plumes of
![]() $Fr$
in the range
$Fr$
in the range
![]() $0.1\leqslant Fr\leqslant 0.3$
. They further identified the buoyancy to be the main mechanism responsible for puffing instability. From the vorticity equation, they derived a condition for circulation variation in stable planar plumes. While these studies pertain to buoyant plumes with an initial source momentum (i.e.
$0.1\leqslant Fr\leqslant 0.3$
. They further identified the buoyancy to be the main mechanism responsible for puffing instability. From the vorticity equation, they derived a condition for circulation variation in stable planar plumes. While these studies pertain to buoyant plumes with an initial source momentum (i.e.
![]() $1<Ri<\infty$
), the onset mechanism and characteristics of near-field oscillations that arise in pure thermal plumes (i.e. free convection plumes,
$1<Ri<\infty$
), the onset mechanism and characteristics of near-field oscillations that arise in pure thermal plumes (i.e. free convection plumes,
![]() $Ri=\infty$
) are investigated in the works of Hattori et al. (Reference Hattori, Bartos, Norris, Kirkpatrick and Armfield2013a
,Reference Hattori, Norris, Kirkpatrick and Armfield
b
,Reference Hattori, Norris, Kirkpatrick and Armfield
c
).
$Ri=\infty$
) are investigated in the works of Hattori et al. (Reference Hattori, Bartos, Norris, Kirkpatrick and Armfield2013a
,Reference Hattori, Norris, Kirkpatrick and Armfield
b
,Reference Hattori, Norris, Kirkpatrick and Armfield
c
).
The linear stability investigations in planar plumes are confined to the far-field regime where the plume fluid attains Boussinesq behaviour and exhibits self-similarity. The local spatial and temporal linear stability analyses in planar plumes (Pera & Gebhart Reference Pera and Gebhart1971; Yang Reference Yang1992; Ravier et al. Reference Ravier, Abid, Amielh and Anselmet2006) reveal that their far-field, self-similar region is convectively unstable to both symmetric (varicose) and asymmetric (sinuous) perturbations. However, the sinuous mode always exhibited larger growth rates than the varicose mode. The occurrence of the sinuous instability in the far field of planar plumes had been verified in experiments by Pera & Gebhart (Reference Pera and Gebhart1971) and in computations by Ravier et al. (Reference Ravier, Abid, Amielh and Anselmet2006). A review of the instability analysis in self-similar planar plumes is given in § 11.8 of Gebhart et al. (Reference Gebhart, Jaluria, Mahajan and Sammakia1988). The self-sustained oscillations that were observed in planar buoyant jets (Yu & Monkewitz Reference Yu and Monkewitz1993) were investigated theoretically using local spatio-temporal instability analysis (Raynal et al. Reference Raynal, Harion, Favre-Marinet and Binder1996; Ravier et al. Reference Ravier, Abid, Amielh and Anselmet2006). These studies revealed that both near and far fields of planar buoyant jets exhibit absolute instability only for varicose mode, while they remain absolutely stable for sinuous mode. However, such investigations are confined to buoyant jets which are momentum dominated at their inlet, whereas such investigations are rare for the buoyant plume regime.
Therefore, the present study aims to investigate the puffing instability in planar plumes using instability analysis and experiments. As shown in circular plumes by Chakravarthy et al. (Reference Chakravarthy, Lesshafft and Huerre2018), the parallel flow assumption is not valid in the plume regime, and hence the present work employs linear instability analysis for non-parallel, 2D base flow using the BiGlobal approach outlined in Theofilis (Reference Theofilis2003). Moreover, this approach has been successful in predicting the global transition in low-density He/N
![]() $_{2}$
jets (Coenen et al.
Reference Coenen, Lesshafft, Garnaud and Sevilla2017), hot jets and thermal plumes (Chakravarthy et al.
Reference Chakravarthy, Lesshafft and Huerre2018) and helium–air plumes (Bharadwaj & Das Reference Bharadwaj and Das2017) that arise out of circular sources. Here, using BiGlobal linear stability analysis, we investigated the effect of both symmetric (varicose) and anti-symmetric (sinuous) perturbations on global stability of planar plumes. The three inlet parameters have been independently varied in ranges of
$_{2}$
jets (Coenen et al.
Reference Coenen, Lesshafft, Garnaud and Sevilla2017), hot jets and thermal plumes (Chakravarthy et al.
Reference Chakravarthy, Lesshafft and Huerre2018) and helium–air plumes (Bharadwaj & Das Reference Bharadwaj and Das2017) that arise out of circular sources. Here, using BiGlobal linear stability analysis, we investigated the effect of both symmetric (varicose) and anti-symmetric (sinuous) perturbations on global stability of planar plumes. The three inlet parameters have been independently varied in ranges of
![]() $10\leqslant Re\leqslant 600$
,
$10\leqslant Re\leqslant 600$
,
![]() $0.03\leqslant Fr\leqslant 1$
and
$0.03\leqslant Fr\leqslant 1$
and
![]() $0.138\leqslant S\leqslant 0.967$
. The unstable modes have been identified and the corresponding transition diagrams and frequency scaling laws have been obtained for 2D modes (
$0.138\leqslant S\leqslant 0.967$
. The unstable modes have been identified and the corresponding transition diagrams and frequency scaling laws have been obtained for 2D modes (
![]() $\unicode[STIX]{x1D6FD}=0$
). Instability computations are also performed for non-zero spanwise wavenumbers (i.e.
$\unicode[STIX]{x1D6FD}=0$
). Instability computations are also performed for non-zero spanwise wavenumbers (i.e.
![]() $\unicode[STIX]{x1D6FD}>0$
) to investigate the effect of three-dimensional (3D) perturbations that are periodic in spanwise direction on plume BiGlobal instability.
$\unicode[STIX]{x1D6FD}>0$
) to investigate the effect of three-dimensional (3D) perturbations that are periodic in spanwise direction on plume BiGlobal instability.
In experiments, plumes are generated using helium and helium–air mixtures emanating from rectangular orifices of ARs 3.4, 4.1 and 5. The effect of AR on plume puffing frequencies and transition is investigated, and the results are compared with those obtained from instability analysis with 2D perturbations. Spanwise visualizations have been performed to investigate the three dimensionality in these low-AR plumes. Further, we also performed fewer experiments for plumes of
![]() $\text{AR}=1$
, i.e. square plumes. To the best of the authors’ knowledge, this is the first investigation that reports the puffing characteristics of square plumes. We obtained puffing frequency scaling for square plumes which deviates from that for rectangular plumes. We discuss the possible reasons for the differences regarding the plume transition and puffing frequencies observed between square and rectangular plumes in the light of our inferences from phase-locked streamwise and spanwise visualizations. In the end, we obtained a
$\text{AR}=1$
, i.e. square plumes. To the best of the authors’ knowledge, this is the first investigation that reports the puffing characteristics of square plumes. We obtained puffing frequency scaling for square plumes which deviates from that for rectangular plumes. We discuss the possible reasons for the differences regarding the plume transition and puffing frequencies observed between square and rectangular plumes in the light of our inferences from phase-locked streamwise and spanwise visualizations. In the end, we obtained a
![]() $St{-}Ri$
correlation based on the hydraulic diameter that is valid for both square and low-AR rectangular plumes from our experiments.
$St{-}Ri$
correlation based on the hydraulic diameter that is valid for both square and low-AR rectangular plumes from our experiments.
2 Problem formulation
The stability characteristics of isothermal, variable-density, 2D buoyant plumes of helium and helium–air mixtures with source density, velocity, viscosity and helium mass fraction of
![]() $\unicode[STIX]{x1D70C}_{0}$
,
$\unicode[STIX]{x1D70C}_{0}$
,
![]() $w_{0}$
,
$w_{0}$
,
![]() $\unicode[STIX]{x1D707}_{0}$
and
$\unicode[STIX]{x1D707}_{0}$
and
![]() $Y_{He0}$
respectively emanating into quiescent ambient air of density
$Y_{He0}$
respectively emanating into quiescent ambient air of density
![]() $\unicode[STIX]{x1D70C}_{\infty }$
and viscosity
$\unicode[STIX]{x1D70C}_{\infty }$
and viscosity
![]() $\unicode[STIX]{x1D707}_{\infty }$
are investigated in the present study. These correspond to the 2D line plumes of width
$\unicode[STIX]{x1D707}_{\infty }$
are investigated in the present study. These correspond to the 2D line plumes of width
![]() $B$
or plumes emanating from large-AR rectangular sources of length
$B$
or plumes emanating from large-AR rectangular sources of length
![]() $L$
and width
$L$
and width
![]() $B$
, where
$B$
, where
![]() $\text{AR}=L/B$
and
$\text{AR}=L/B$
and
![]() $L\gg B$
. Since the flow involves significant density gradients, the governing equations are the compressible equations simplified in the low-Mach-number limit (Nichols, Schmid & Riley Reference Nichols, Schmid and Riley2007; Chandler et al.
Reference Chandler, Juniper, Nichols and Schmid2012). These equations only account for the density variations due to the mixing of different species but neglect the density variations because of pressure. Thus, the plume is effectively modelled by the mass, momentum and species conservation equations given in their non-dimensional form as
$L\gg B$
. Since the flow involves significant density gradients, the governing equations are the compressible equations simplified in the low-Mach-number limit (Nichols, Schmid & Riley Reference Nichols, Schmid and Riley2007; Chandler et al.
Reference Chandler, Juniper, Nichols and Schmid2012). These equations only account for the density variations due to the mixing of different species but neglect the density variations because of pressure. Thus, the plume is effectively modelled by the mass, momentum and species conservation equations given in their non-dimensional form as
together with the state equation simplified under low-Mach-number approximation which relates the density to the helium mass fraction as
and Wilke’s (Reference Wilke1950) law that relates viscosity to helium mass fraction as
 $$\begin{eqnarray}\unicode[STIX]{x1D707}=\unicode[STIX]{x1D707}_{He/A}^{\ast }\frac{1}{1+{\displaystyle \frac{Y_{He0}^{-1}-Y_{He}}{Y_{He}}}\unicode[STIX]{x1D719}_{He-A}}+\frac{1}{1+{\displaystyle \frac{Y_{He}}{Y_{He0}^{-1}-Y_{He}}}\unicode[STIX]{x1D719}_{A-He}},\end{eqnarray}$$
where
![]() $\unicode[STIX]{x1D719}_{He-A}$
and
$\unicode[STIX]{x1D719}_{He-A}$
and
![]() $\unicode[STIX]{x1D719}_{A-He}$
are constants that depend on helium and air molar masses (see (2.5) in Bharadwaj & Das Reference Bharadwaj and Das2017). These equations are formulated over a domain chosen in Cartesian coordinates
$\unicode[STIX]{x1D719}_{A-He}$
are constants that depend on helium and air molar masses (see (2.5) in Bharadwaj & Das Reference Bharadwaj and Das2017). These equations are formulated over a domain chosen in Cartesian coordinates
![]() $(x,y,z)$
, with
$(x,y,z)$
, with
![]() $x$
,
$x$
,
![]() $y$
and
$y$
and
![]() $z$
axes aligned in lateral (i.e. along the width), spanwise (i.e. along the length) and streamwise directions respectively (figure 2). In these equations,
$z$
axes aligned in lateral (i.e. along the width), spanwise (i.e. along the length) and streamwise directions respectively (figure 2). In these equations,
![]() $\boldsymbol{v}=(u,u,w)$
,
$\boldsymbol{v}=(u,u,w)$
,
![]() $\unicode[STIX]{x1D70C}$
,
$\unicode[STIX]{x1D70C}$
,
![]() $p$
,
$p$
,
![]() $Y_{He}$
and
$Y_{He}$
and
![]() $\unicode[STIX]{x1D707}$
are dimensionless velocity, density, pressure, helium mass fraction and viscosity respectively. The primitive variables are scaled as follows and their dimensionless forms are obtained as
$\unicode[STIX]{x1D707}$
are dimensionless velocity, density, pressure, helium mass fraction and viscosity respectively. The primitive variables are scaled as follows and their dimensionless forms are obtained as
 $$\begin{eqnarray}\left.\begin{array}{@{}c@{}}\boldsymbol{v}={\displaystyle \frac{\tilde{\boldsymbol{v}}}{w_{0}}},\quad Y_{He}={\displaystyle \frac{{\tilde{Y}}_{He}}{Y_{He0}}},\quad p={\displaystyle \frac{\tilde{p}}{p_{\infty }}},\quad \unicode[STIX]{x1D70C}={\displaystyle \frac{\tilde{\unicode[STIX]{x1D70C}}}{\unicode[STIX]{x1D70C}_{\infty }}},\quad \unicode[STIX]{x1D707}={\displaystyle \frac{\tilde{\unicode[STIX]{x1D707}}}{\unicode[STIX]{x1D707}_{\infty }}},\\ \unicode[STIX]{x1D735}=B\tilde{\unicode[STIX]{x1D735}},\quad t={\displaystyle \frac{\tilde{t}w_{0}}{B}},\quad \boldsymbol{g}={\displaystyle \frac{\tilde{\boldsymbol{g}}}{\mathit{g}}}=-\boldsymbol{e}_{\boldsymbol{z}}.\end{array}\right\}\end{eqnarray}$$
The non-dimensional equations obtained using the above scalings yield the non-dimensional Reynolds number
![]() $Re$
, Froude number
$Re$
, Froude number
![]() $Fr$
, density ratio
$Fr$
, density ratio
![]() $S$
, viscosity ratio
$S$
, viscosity ratio
![]() $\unicode[STIX]{x1D707}^{\ast }$
and Schmidt number
$\unicode[STIX]{x1D707}^{\ast }$
and Schmidt number
![]() $Sc$
in the following form:
$Sc$
in the following form:
where
![]() $\mathit{g}$
and
$\mathit{g}$
and
![]() ${\mathcal{D}}$
are acceleration due to gravity and mass diffusivity respectively. The inlet density
${\mathcal{D}}$
are acceleration due to gravity and mass diffusivity respectively. The inlet density
![]() $\unicode[STIX]{x1D70C}_{0}$
depends on the mass fraction of helium injected as
$\unicode[STIX]{x1D70C}_{0}$
depends on the mass fraction of helium injected as
![]() $\unicode[STIX]{x1D70C}_{0}=[Y_{He0}/\unicode[STIX]{x1D70C}_{He}+(1-Y_{He0})/\unicode[STIX]{x1D70C}_{Air}]$
. The density ratio has been varied in range
$\unicode[STIX]{x1D70C}_{0}=[Y_{He0}/\unicode[STIX]{x1D70C}_{He}+(1-Y_{He0})/\unicode[STIX]{x1D70C}_{Air}]$
. The density ratio has been varied in range
![]() $0.138\leqslant S\leqslant 0.967$
by injecting the helium–air mixtures with inlet helium mass fractions as listed in table 1. At each density ratio, the Reynolds number and Froude number are varied independently in ranges
$0.138\leqslant S\leqslant 0.967$
by injecting the helium–air mixtures with inlet helium mass fractions as listed in table 1. At each density ratio, the Reynolds number and Froude number are varied independently in ranges
![]() $10\leqslant Re\leqslant 600$
and
$10\leqslant Re\leqslant 600$
and
![]() $0.03\leqslant S\leqslant 1$
respectively. The other two non-dimensional parameters,
$0.03\leqslant S\leqslant 1$
respectively. The other two non-dimensional parameters,
![]() $\unicode[STIX]{x1D707}^{\ast }$
and
$\unicode[STIX]{x1D707}^{\ast }$
and
![]() $Sc$
, which also depend on
$Sc$
, which also depend on
![]() $Y_{He0}$
, take the values listed in table 1 for each density ratio.
$Y_{He0}$
, take the values listed in table 1 for each density ratio.
Sometimes, it is a common practice to combine the parameters
![]() $Fr$
and
$Fr$
and
![]() $S$
into a single buoyancy parameter, the Richardson number,
$S$
into a single buoyancy parameter, the Richardson number,
![]() $Ri$
, though it is not directly obtained from the non-dimensional governing equations (2.1)–(2.5). The Richardson number is defined as
$Ri$
, though it is not directly obtained from the non-dimensional governing equations (2.1)–(2.5). The Richardson number is defined as
Here, we considered
![]() $Fr$
and
$Fr$
and
![]() $S$
separately in our analysis instead of combining them into
$S$
separately in our analysis instead of combining them into
![]() $Ri$
, without limiting the generality. However, the oscillation frequencies were found to correlate well with the combined parameter
$Ri$
, without limiting the generality. However, the oscillation frequencies were found to correlate well with the combined parameter
![]() $Ri$
(Cetegen et al.
Reference Cetegen, Dong and Soteriou1998; Soteriou et al.
Reference Soteriou, Dong and Cetegen2002). Therefore, we present the Strouhal number variation in terms of the combined parameter
$Ri$
(Cetegen et al.
Reference Cetegen, Dong and Soteriou1998; Soteriou et al.
Reference Soteriou, Dong and Cetegen2002). Therefore, we present the Strouhal number variation in terms of the combined parameter
![]() $Ri$
instead of
$Ri$
instead of
![]() $Fr$
and
$Fr$
and
![]() $S$
separately, to be consistent with the correlations obtained in earlier experiments. The
$S$
separately, to be consistent with the correlations obtained in earlier experiments. The
![]() $Fr$
and
$Fr$
and
![]() $S$
variation shown in table 1 results in an overall
$S$
variation shown in table 1 results in an overall
![]() $Ri$
variation in the range
$Ri$
variation in the range
![]() $0.03<Ri<960$
.
$0.03<Ri<960$
.
Table 1. Parameter space for the present instability analysis.

2.1 Base flows
The laminar base flow solutions
![]() $(\overline{u},\overline{w},\overline{p},\overline{Y}_{He})$
are obtained by solving the steady 2D version of the governing equations (2.1)–(2.5) using the finite volume code ANSYS Fluent, similar to the axisymmetric case in Bharadwaj & Das (Reference Bharadwaj and Das2017). A schematic of the planar domain chosen for obtaining the base flow is depicted in figure 1. The pressure and convective terms are discretized using a second-order scheme and the equations are solved using a pressure-based coupled algorithm (ANSYS, Inc. 2013) along with the boundary conditions shown in figure 1. At the inlet boundary, top-hat-shaped axial velocity and mass fraction profiles of the form
$(\overline{u},\overline{w},\overline{p},\overline{Y}_{He})$
are obtained by solving the steady 2D version of the governing equations (2.1)–(2.5) using the finite volume code ANSYS Fluent, similar to the axisymmetric case in Bharadwaj & Das (Reference Bharadwaj and Das2017). A schematic of the planar domain chosen for obtaining the base flow is depicted in figure 1. The pressure and convective terms are discretized using a second-order scheme and the equations are solved using a pressure-based coupled algorithm (ANSYS, Inc. 2013) along with the boundary conditions shown in figure 1. At the inlet boundary, top-hat-shaped axial velocity and mass fraction profiles of the form
are imposed as boundary conditions, where the initial shear layer momentum thickness is 1 % of the inlet half-width. Note that in the earlier (Cetegen & Kasper Reference Cetegen and Kasper1996; Cetegen et al.
Reference Cetegen, Dong and Soteriou1998) and present experiments, a flat mesh screen is placed across the plume inlets to attain uniform plug flow inlet conditions. Therefore, steeper top-hat velocity and mass fraction profiles have been used in the present instability analysis to simulate inlet conditions similar to those of the experiments. Along the centreline, the symmetry boundary condition has been imposed. The exit and radial far-field boundaries are specified as pressure outlets, where a Dirichlet condition is specified on pressure and the other flow variables on these boundaries are extrapolated from the interior. The steady-state calculations were performed using the pseudo-transient approach as outlined in § 8.8 of Versteeg & Malalasekera (Reference Versteeg and Malalasekera2007). This method uses an implicit under-relaxation in which the under-relaxation is controlled by a pseudo time step size. The equations are solved until the computations yielded a steady converged solution. The solution is considered to be converged when the scaled residuals ((26.13-4) in ANSYS, Inc. 2009) of continuity, momentum and helium mass fraction equations tend to attain values less than
![]() $10^{-6}$
.
$10^{-6}$
.
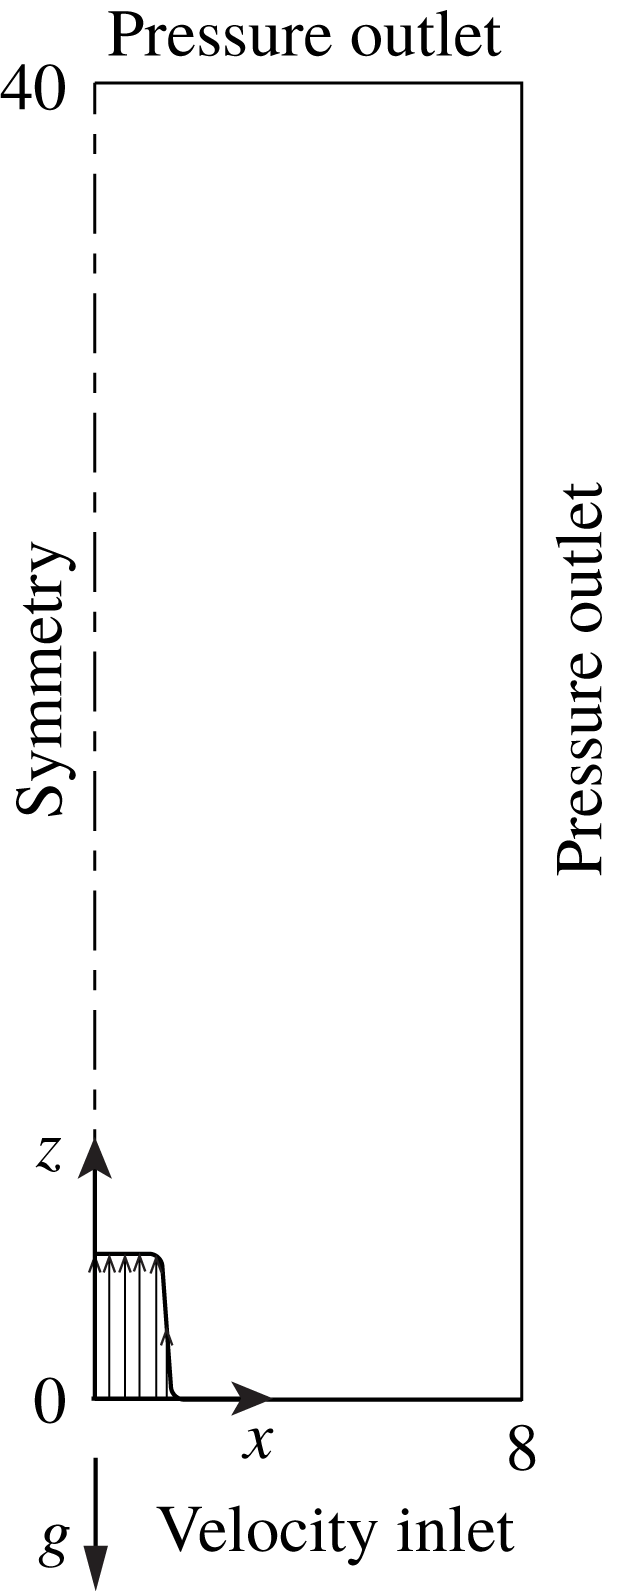
Figure 1. Schematic of 2D domain for steady base flow computations along with boundary conditions.
These solutions are obtained for a mesh size of 231 000 quadrilateral cells
![]() $(1540(z)\times 150(x))$
, where 150 000 cells are concentrated in the region
$(1540(z)\times 150(x))$
, where 150 000 cells are concentrated in the region
![]() $0<z<30$
and
$0<z<30$
and
![]() $0<x<1$
. The results are converged with respect to further mesh refinements. The independence of base flow solution on the domain size is also verified. A further increase in domain size in the lateral far field, i.e.
$0<x<1$
. The results are converged with respect to further mesh refinements. The independence of base flow solution on the domain size is also verified. A further increase in domain size in the lateral far field, i.e.
![]() $x>8$
, has negligible effect on the base flow solution. Similarly, it is verified that an increase in the box length does not impact the base flow solution for
$x>8$
, has negligible effect on the base flow solution. Similarly, it is verified that an increase in the box length does not impact the base flow solution for
![]() $z>40$
. To assess the effectiveness of the numerical model in accurately predicting the base flow solution, the velocity field measured using particle image velocimetry (PIV) in a typical laminar plume has been used to validate the numerically obtained base flow solution, whose details are given in appendix A.
$z>40$
. To assess the effectiveness of the numerical model in accurately predicting the base flow solution, the velocity field measured using particle image velocimetry (PIV) in a typical laminar plume has been used to validate the numerically obtained base flow solution, whose details are given in appendix A.
2.2 Linear BiGlobal modes
To perform the stability analysis, the flow variables are decomposed into a 2D steady base flow field and a 3D time-varying perturbation field as
where
![]() $q=[\boldsymbol{v},p,\unicode[STIX]{x1D70C},Y_{He},\unicode[STIX]{x1D707}]$
. Assuming infinitesimally smaller perturbations when compared to the base flow, the governing equations can be linearized in terms of the perturbations about the steady state, yielding the linearized perturbation equations (see equations (2.9)–(2.13) in Bharadwaj & Das Reference Bharadwaj and Das2017). Note that the perturbations
$q=[\boldsymbol{v},p,\unicode[STIX]{x1D70C},Y_{He},\unicode[STIX]{x1D707}]$
. Assuming infinitesimally smaller perturbations when compared to the base flow, the governing equations can be linearized in terms of the perturbations about the steady state, yielding the linearized perturbation equations (see equations (2.9)–(2.13) in Bharadwaj & Das Reference Bharadwaj and Das2017). Note that the perturbations
![]() $Y_{He}^{\prime }$
and
$Y_{He}^{\prime }$
and
![]() $\unicode[STIX]{x1D707}^{\prime }$
in the linearized equations can be eliminated by expressing them in terms of
$\unicode[STIX]{x1D707}^{\prime }$
in the linearized equations can be eliminated by expressing them in terms of
![]() $\unicode[STIX]{x1D70C}^{\prime }$
in the same way as in Bharadwaj & Das (Reference Bharadwaj and Das2017). Following normal mode approach, the perturbations are assumed to be of the form
$\unicode[STIX]{x1D70C}^{\prime }$
in the same way as in Bharadwaj & Das (Reference Bharadwaj and Das2017). Following normal mode approach, the perturbations are assumed to be of the form
where
![]() $\unicode[STIX]{x1D6FD}$
is the wavenumber in the spanwise coordinate,
$\unicode[STIX]{x1D6FD}$
is the wavenumber in the spanwise coordinate,
![]() $\unicode[STIX]{x1D714}=\unicode[STIX]{x1D714}_{r}+\text{i}\unicode[STIX]{x1D714}_{i}$
is the complex frequency and
$\unicode[STIX]{x1D714}=\unicode[STIX]{x1D714}_{r}+\text{i}\unicode[STIX]{x1D714}_{i}$
is the complex frequency and
![]() $\hat{q}(x,z)$
is the 2D complex-valued amplitude. The linearized equations obtained after substituting the ansatz constitute a 2D eigenvalue problem (EVP) of the form
$\hat{q}(x,z)$
is the 2D complex-valued amplitude. The linearized equations obtained after substituting the ansatz constitute a 2D eigenvalue problem (EVP) of the form
where
![]() $\hat{q}=[\hat{u} \quad \hat{v}\quad {\hat{w}}\quad \hat{p}\quad \hat{\unicode[STIX]{x1D70C}}]^{\text{T}}$
is the eigenfunction and
$\hat{q}=[\hat{u} \quad \hat{v}\quad {\hat{w}}\quad \hat{p}\quad \hat{\unicode[STIX]{x1D70C}}]^{\text{T}}$
is the eigenfunction and
![]() $A$
and
$A$
and
![]() $B$
are linear operators as given in appendix C. For a given steady base flow, linear temporal BiGlobal modes with
$B$
are linear operators as given in appendix C. For a given steady base flow, linear temporal BiGlobal modes with
![]() $\unicode[STIX]{x1D714}$
as eigenvalue and
$\unicode[STIX]{x1D714}$
as eigenvalue and
![]() $\hat{q}$
as corresponding eigenvector are obtained by discretizing and solving the EVP (2.12) along with perturbation boundary conditions (2.13)–(2.17). The linearized equations are discretized in space by a spectral method using Chebyshev polynomials in both streamwise and lateral coordinates. The collocation grid
$\hat{q}$
as corresponding eigenvector are obtained by discretizing and solving the EVP (2.12) along with perturbation boundary conditions (2.13)–(2.17). The linearized equations are discretized in space by a spectral method using Chebyshev polynomials in both streamwise and lateral coordinates. The collocation grid
![]() $N_{x}\times N_{z}$
has been mapped from the Chebyshev domain (
$N_{x}\times N_{z}$
has been mapped from the Chebyshev domain (
![]() $[1,-1]\times [1,-1]$
) to the physical domain (
$[1,-1]\times [1,-1]$
) to the physical domain (
![]() $[0,x_{max}]\times [0,z_{max}]$
) using the mapping functions. In the streamwise direction, the collocation points are mapped linearly from
$[0,x_{max}]\times [0,z_{max}]$
) using the mapping functions. In the streamwise direction, the collocation points are mapped linearly from
![]() $[1,-1]$
to
$[1,-1]$
to
![]() $[0,z_{max}]$
. In the lateral direction, the stretching function proposed by Lesshafft & Huerre (Reference Lesshafft and Huerre2007) has been used to map the collocation points from
$[0,z_{max}]$
. In the lateral direction, the stretching function proposed by Lesshafft & Huerre (Reference Lesshafft and Huerre2007) has been used to map the collocation points from
![]() $[1,-1]$
to
$[1,-1]$
to
![]() $[0,x_{max}]$
and to concentrate more points in the region
$[0,x_{max}]$
and to concentrate more points in the region
![]() $x<0.5$
. A detailed description regarding the discretization for instability computations can be found in § B.2 of Bharadwaj & Das (Reference Bharadwaj and Das2017).
$x<0.5$
. A detailed description regarding the discretization for instability computations can be found in § B.2 of Bharadwaj & Das (Reference Bharadwaj and Das2017).
The perturbation boundary conditions imposed over inlet, outlet and lateral far field are
Along the centreline, the boundary conditions depend upon the type of modes considered for instability analysis, i.e. varicose mode or sinuous mode:
After discretizing the differential operators in (2.12) and imposing boundary conditions according to the mode considered, the generalized EVP can be expressed as a set of linear algebraic equations as
where
![]() $\unicode[STIX]{x1D63C}$
and
$\unicode[STIX]{x1D63C}$
and
![]() $\unicode[STIX]{x1D63D}$
are matrices of size
$\unicode[STIX]{x1D63D}$
are matrices of size
![]() $5N_{x}N_{z}\times 5N_{x}N_{z}$
, in which
$5N_{x}N_{z}\times 5N_{x}N_{z}$
, in which
![]() $N_{x}$
and
$N_{x}$
and
![]() $N_{z}$
are the number of nodes in
$N_{z}$
are the number of nodes in
![]() $x$
and
$x$
and
![]() $z$
directions respectively. These matrices correspond to discretized versions of differential operators
$z$
directions respectively. These matrices correspond to discretized versions of differential operators
![]() $A$
and
$A$
and
![]() $B$
in (2.12) along with the boundary conditions. To recover BiGlobal modes, the EVP (2.18) has been solved using an iterative Arnoldi method by employing shift and invert strategy (Juniper, Hanifi & Theofilis Reference Juniper, Hanifi and Theofilis2014).
$B$
in (2.12) along with the boundary conditions. To recover BiGlobal modes, the EVP (2.18) has been solved using an iterative Arnoldi method by employing shift and invert strategy (Juniper, Hanifi & Theofilis Reference Juniper, Hanifi and Theofilis2014).
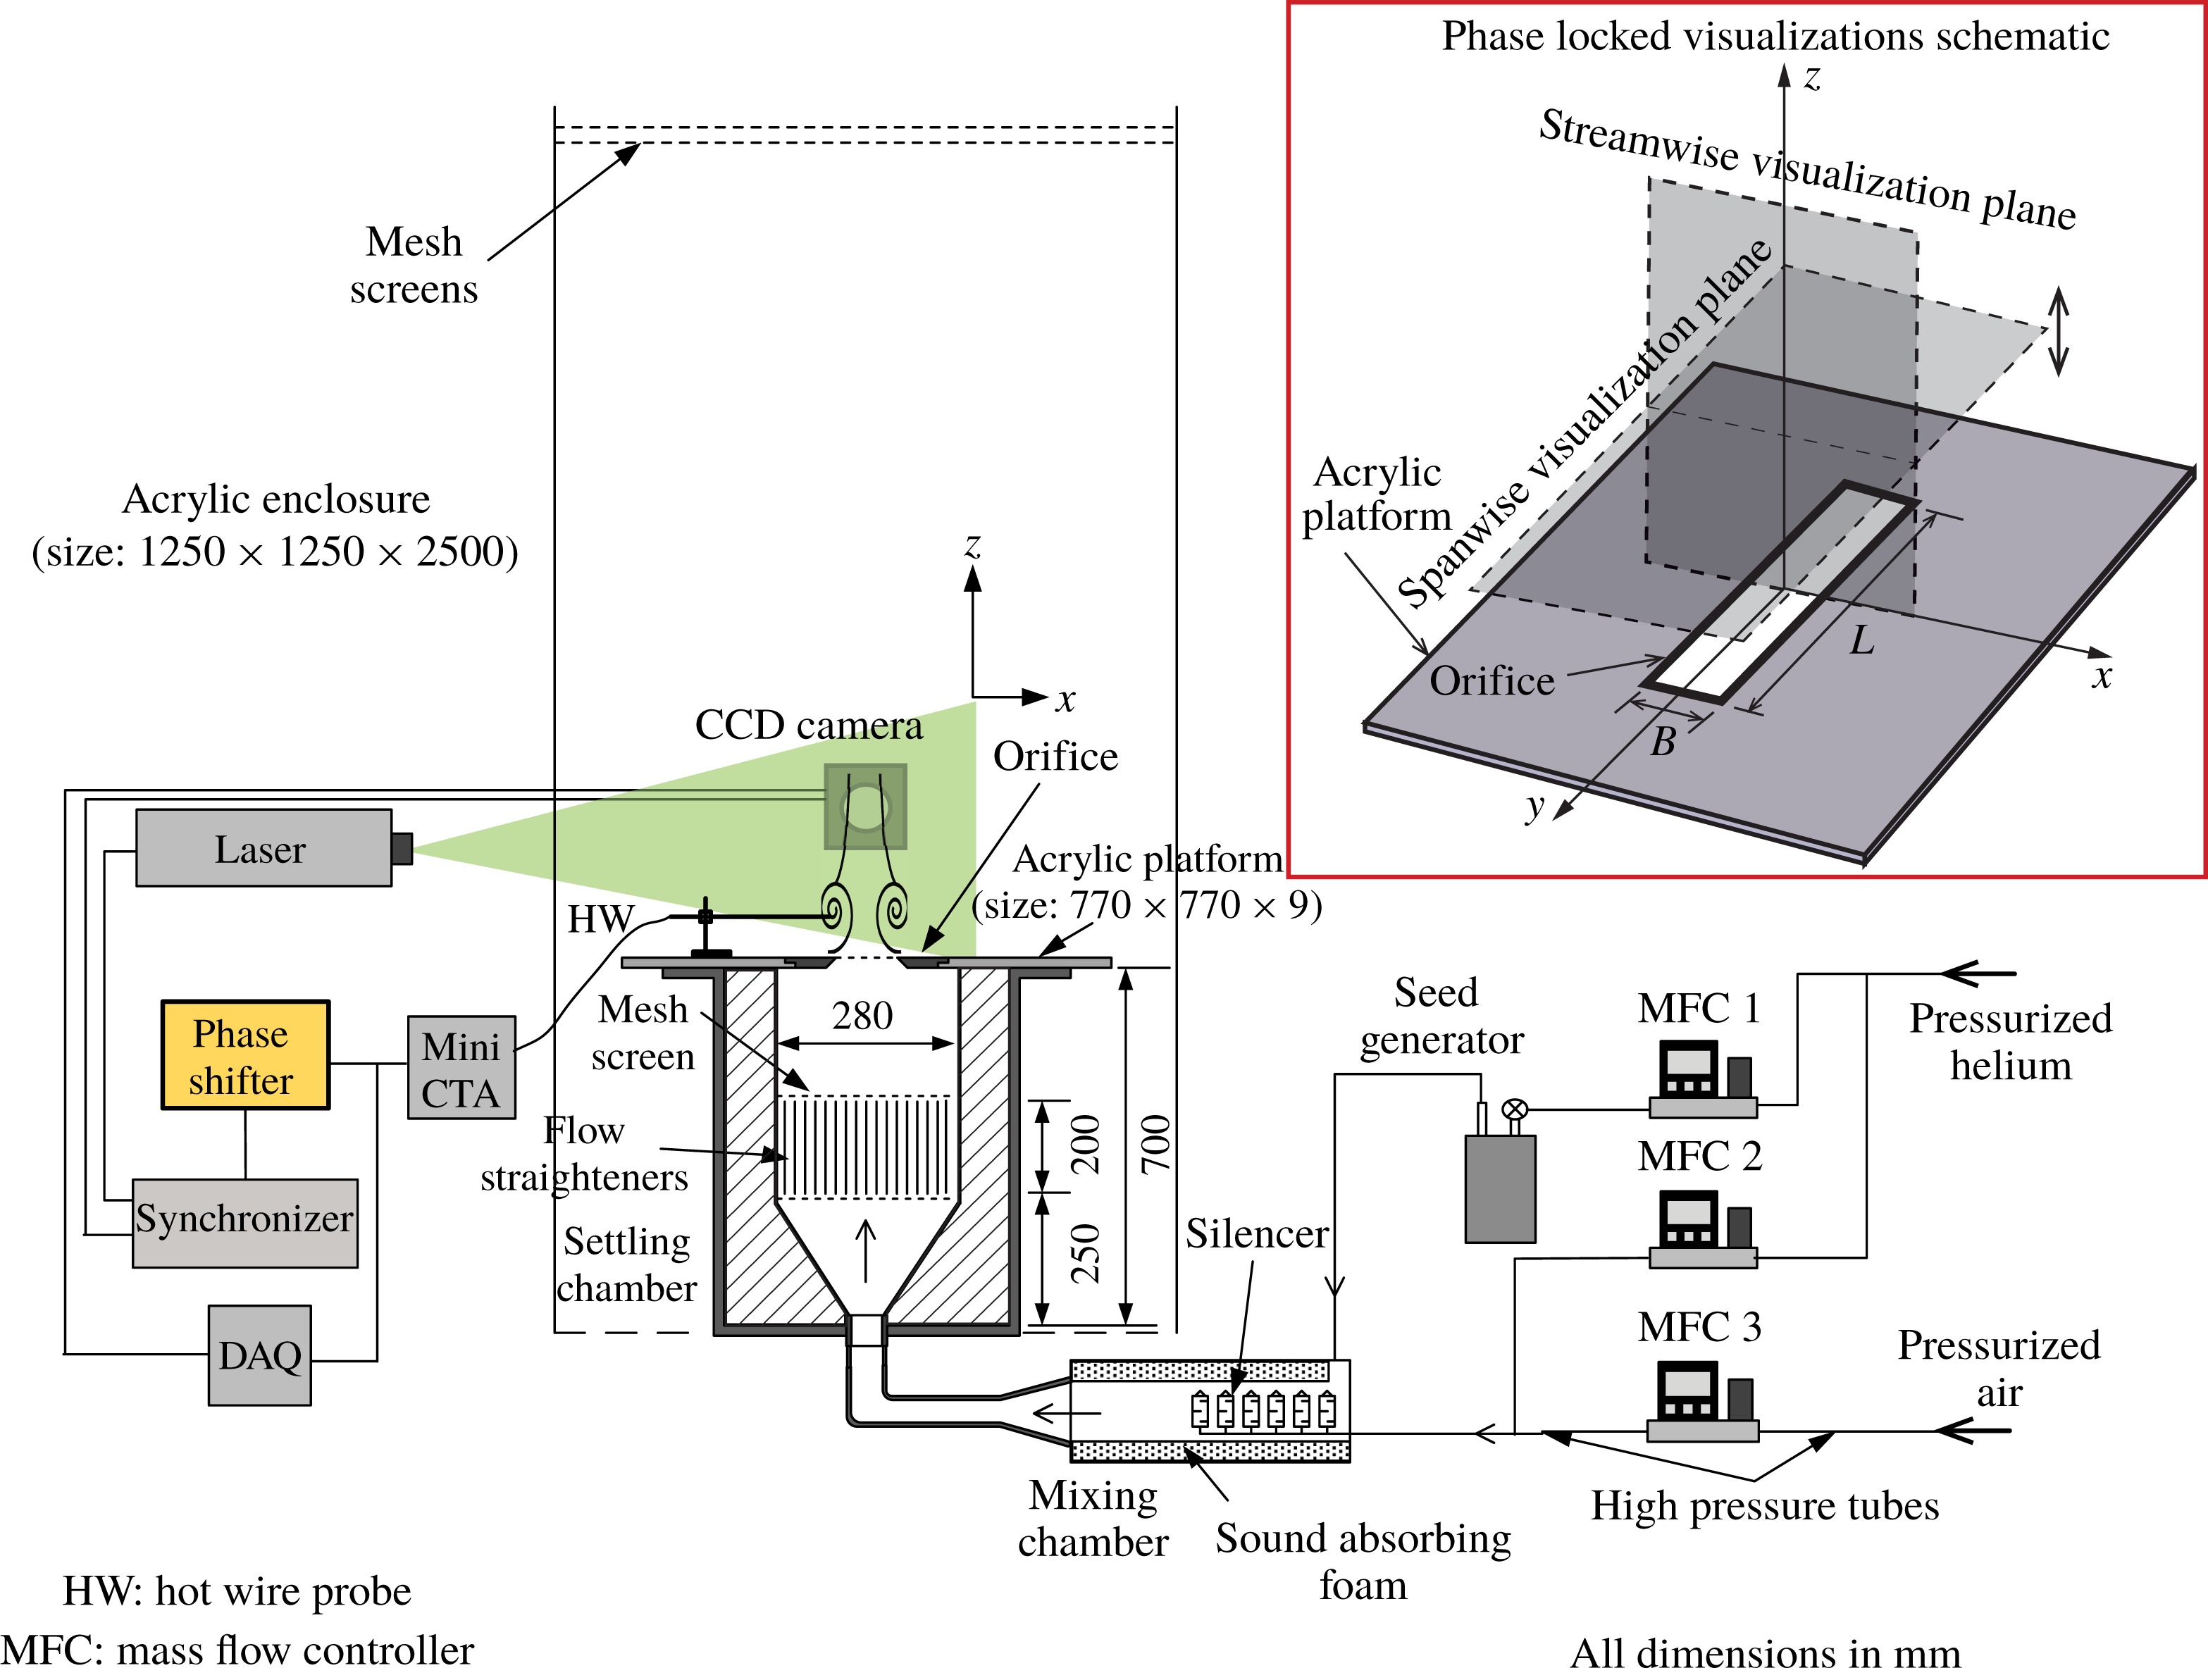
Figure 2. Schematic of the experimental set-up. The inset on the right shows the streamwise and spanwise planes in which flow visualizations are performed in a phase-locked manner.
3 Experimental set-up
Experiments are performed to verify the results obtained from the BiGlobal linear stability analysis and to investigate the effect of AR on puffing. Figure 2 shows a schematic of the experimental set-up. The experimental arrangement is the same as that used in our earlier study on circular plumes (see § 3 of Bharadwaj & Das (Reference Bharadwaj and Das2017) for a detailed description of the experimental set-up) in which the circular orifices have been replaced with rectangular or square ones. The set-up comprises pressurized sources of helium and air, three mass flow controllers, a mixing chamber which houses the silencers and sound-absorbing foam, a settling chamber with honeycomb section and screens, and a rectangular/square orifice through which the plume mixture ejects out. The helium and air mass flow rates are precisely set and controlled using three mass flow controllers to generate helium–air plumes of desired flow rates and densities. The dimensions of the orifices used are listed in table 2.
Table 2. Dimensions of orifices used for plume experiments.

It is known that planar plumes are prone to sinuous meandering in addition to puffing instability (Soteriou et al. Reference Soteriou, Dong and Cetegen2002). The velocity measurements performed at 50 Hz using PIV are used to characterize the near-field instabilities, segregate the puffing plumes from non-puffing ones and evaluate their puffing frequencies. Details regarding these PIV measurements, analysis and the uncertainties involved in the velocity estimation are presented in detail in Bharadwaj & Das (Reference Bharadwaj and Das2017).
Unlike the instability analysis which has been performed for 2D plumes that extend infinitely in the spanwise direction, real-world plumes possess a finite spanwise length
![]() $L$
where 3D effects may become important and may influence puffing. Earlier investigations in non-circular jets have revealed the presence of streamwise vortices aligned with the corners (Gutmark & Grinstein Reference Gutmark and Grinstein1999). Therefore, to further investigate the three-dimensionality in rectangular plumes, flow visualizations are performed in both streamwise and spanwise planes (see inset in figure 2). To obtain streamwise and spanwise visualizations at the same time instants, these visualizations have been performed in a phase-resolved manner. The puffing phenomenon is highly periodic in the near field. Therefore, taking the advantage of this near-field flow periodicity, a voltage signal, obtained from a hot-wire positioned nearer to the plume centreline at
$L$
where 3D effects may become important and may influence puffing. Earlier investigations in non-circular jets have revealed the presence of streamwise vortices aligned with the corners (Gutmark & Grinstein Reference Gutmark and Grinstein1999). Therefore, to further investigate the three-dimensionality in rectangular plumes, flow visualizations are performed in both streamwise and spanwise planes (see inset in figure 2). To obtain streamwise and spanwise visualizations at the same time instants, these visualizations have been performed in a phase-resolved manner. The puffing phenomenon is highly periodic in the near field. Therefore, taking the advantage of this near-field flow periodicity, a voltage signal, obtained from a hot-wire positioned nearer to the plume centreline at
![]() $(x,z)\approx (0.1B,0.5B)$
, is fed to a custom-designed phase shifter to resolve various phases/time instants during a single puffing cycle, and to perform streamwise and spanwise visualizations at similar puffing phases. The phase shifter could resolve different phases during a puffing cycle within an accuracy of
$(x,z)\approx (0.1B,0.5B)$
, is fed to a custom-designed phase shifter to resolve various phases/time instants during a single puffing cycle, and to perform streamwise and spanwise visualizations at similar puffing phases. The phase shifter could resolve different phases during a puffing cycle within an accuracy of
![]() $\pm 0.5~\text{ms}$
.
$\pm 0.5~\text{ms}$
.
4 Results and discussion
4.1 BiGlobal instability analysis
We first discuss the results obtained from the BiGlobal linear stability formulation presented earlier in § 2.2. In the parameter space listed in table 1, the eigenvalues and the corresponding eigenfunctions are evaluated at each discrete parameter set
![]() $(Re,Fr,S)$
for both varicose and sinuous modes and for the spanwise wavenumber
$(Re,Fr,S)$
for both varicose and sinuous modes and for the spanwise wavenumber
![]() $\unicode[STIX]{x1D6FD}=0$
, i.e. 2D perturbations. A brief discussion of 3D perturbations, i.e.
$\unicode[STIX]{x1D6FD}=0$
, i.e. 2D perturbations. A brief discussion of 3D perturbations, i.e.
![]() $\unicode[STIX]{x1D6FD}>0$
, follows in § 4.1.3.
$\unicode[STIX]{x1D6FD}>0$
, follows in § 4.1.3.
4.1.1 Instability modes
The eigenvalue spectrum for the 2D varicose perturbations for the plume case
![]() $(Re,Fr,S)=(180,0.5,0.276)$
is shown in figure 3(a). The spectrum contains an isolated unstable eigenvalue at
$(Re,Fr,S)=(180,0.5,0.276)$
is shown in figure 3(a). The spectrum contains an isolated unstable eigenvalue at
![]() $\unicode[STIX]{x1D714}=5.70+0.92\text{i}$
, and an arc branch with eigenvalues along the real frequency that are unstable in the range
$\unicode[STIX]{x1D714}=5.70+0.92\text{i}$
, and an arc branch with eigenvalues along the real frequency that are unstable in the range
![]() $9<\unicode[STIX]{x1D714}_{r}<20$
. In the earlier studies on the global instability of circular buoyant jets and plumes (Coenen et al.
Reference Coenen, Lesshafft, Garnaud and Sevilla2017; Chakravarthy et al.
Reference Chakravarthy, Lesshafft and Huerre2018), similar features were observed. These studies had shown that while the isolated eigenvalue is responsible for global instability, the eigenvalues of the arc branch are artifacts that arise because of domain truncation in the streamwise direction and resulting spurious pressure feedback from the outflow boundary. In a recent study, Lesshafft (Reference Lesshafft2018) showed that the growth rates of these unphysical arc branch modes can be reduced by adding an absorption layer near the outflow boundary.
$9<\unicode[STIX]{x1D714}_{r}<20$
. In the earlier studies on the global instability of circular buoyant jets and plumes (Coenen et al.
Reference Coenen, Lesshafft, Garnaud and Sevilla2017; Chakravarthy et al.
Reference Chakravarthy, Lesshafft and Huerre2018), similar features were observed. These studies had shown that while the isolated eigenvalue is responsible for global instability, the eigenvalues of the arc branch are artifacts that arise because of domain truncation in the streamwise direction and resulting spurious pressure feedback from the outflow boundary. In a recent study, Lesshafft (Reference Lesshafft2018) showed that the growth rates of these unphysical arc branch modes can be reduced by adding an absorption layer near the outflow boundary.
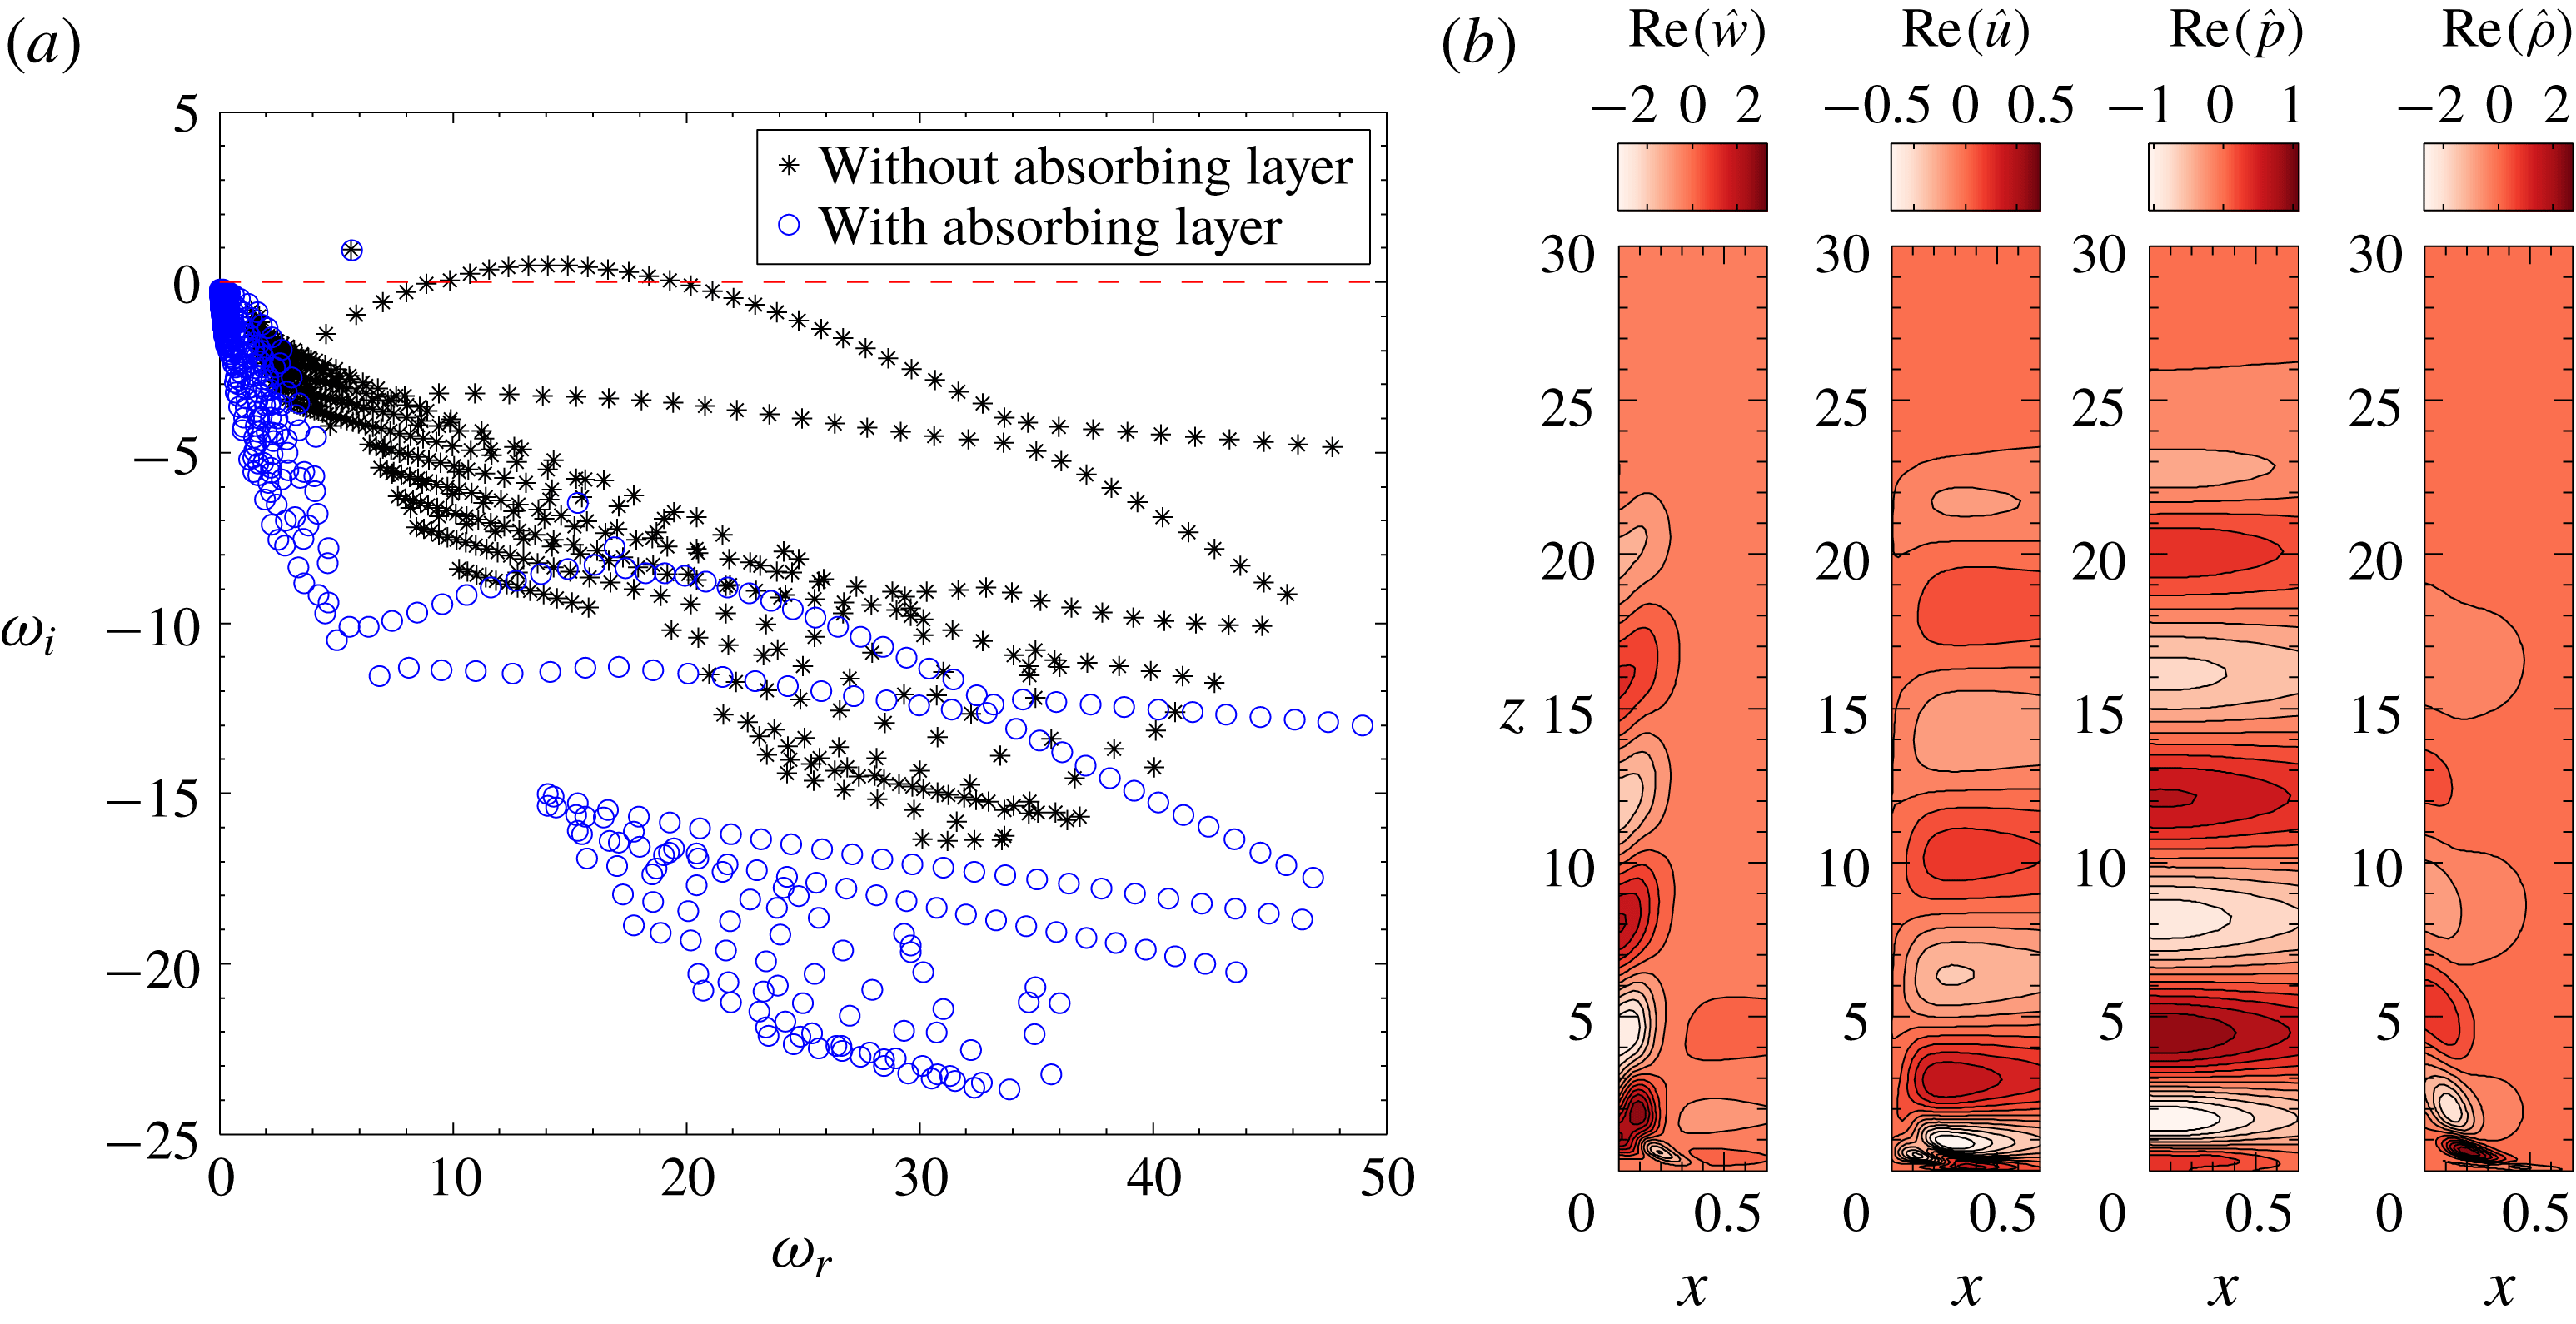
Figure 3. (a) BiGlobal eigenvalue spectrum for the case
![]() $(Re,Fr,S)=(180,0.5,0.276)$
obtained for 2D (
$(Re,Fr,S)=(180,0.5,0.276)$
obtained for 2D (
![]() $\unicode[STIX]{x1D6FD}=0$
) varicose perturbations. (b) Eigenfunctions of the isolated BiGlobal mode.
$\unicode[STIX]{x1D6FD}=0$
) varicose perturbations. (b) Eigenfunctions of the isolated BiGlobal mode.
In the present work, the absorption layer has been modelled by following an approach stated in Chakravarthy et al. (Reference Chakravarthy, Lesshafft and Huerre2018). The EVP has been solved by adding a damping term
![]() $-\unicode[STIX]{x1D706}(z)\hat{\boldsymbol{q}}$
on the left-hand side of (2.18). Following Chomaz (Reference Chomaz2003), the damping coefficient
$-\unicode[STIX]{x1D706}(z)\hat{\boldsymbol{q}}$
on the left-hand side of (2.18). Following Chomaz (Reference Chomaz2003), the damping coefficient
![]() $\unicode[STIX]{x1D706}(z)$
is set to zero for
$\unicode[STIX]{x1D706}(z)$
is set to zero for
![]() $z<z_{ab}$
, and it increases smoothly from 0 to
$z<z_{ab}$
, and it increases smoothly from 0 to
![]() $\unicode[STIX]{x1D706}_{max}$
over a streamwise distance
$\unicode[STIX]{x1D706}_{max}$
over a streamwise distance
![]() $z_{ab}<z<z_{max}$
as
$z_{ab}<z<z_{max}$
as
where
![]() $\unicode[STIX]{x1D706}_{max}$
is the maximum damping coefficient,
$\unicode[STIX]{x1D706}_{max}$
is the maximum damping coefficient,
![]() $z_{ab}$
is the streamwise distance where the absorption layer starts and
$z_{ab}$
is the streamwise distance where the absorption layer starts and
![]() $z_{max}$
is the outflow boundary. The eigenvalue spectra obtained by adding the absorption layer with damping parameters
$z_{max}$
is the outflow boundary. The eigenvalue spectra obtained by adding the absorption layer with damping parameters
![]() $\unicode[STIX]{x1D706}_{max}=10$
and
$\unicode[STIX]{x1D706}_{max}=10$
and
![]() $z_{ab}=20$
are presented in figure 3(a). With the absorption layer, the growth rates of the arc branch modes decrease and these eigenvalues recede to the stable half-plane as seen from figure 3(a). It can also be observed that the addition of the absorption layer has a negligible effect on the isolated mode. In the parameter space investigated, only one isolated symmetric mode has been observed. This is in contrast to the case of circular plumes where two such isolated modes had been observed in a similar parametric space (Bharadwaj & Das Reference Bharadwaj and Das2017).
$z_{ab}=20$
are presented in figure 3(a). With the absorption layer, the growth rates of the arc branch modes decrease and these eigenvalues recede to the stable half-plane as seen from figure 3(a). It can also be observed that the addition of the absorption layer has a negligible effect on the isolated mode. In the parameter space investigated, only one isolated symmetric mode has been observed. This is in contrast to the case of circular plumes where two such isolated modes had been observed in a similar parametric space (Bharadwaj & Das Reference Bharadwaj and Das2017).
Further, we performed instability computations for larger domain lengths to investigate the dependence of isolated BiGlobal mode and the arc branch modes on domain length, and to check if the addition of the absorption layer produces any unintended effects. These computations are performed for the plume case presented in figure 3(a) and the corresponding results are included in appendix B. The analysis reveals that the isolated BiGlobal mode is converged with respect to domain length (figure 21 a) and the use of an absorption layer does not affect its frequency and growth rate.
Figure 3(b) shows the real parts of eigenvectors obtained for the unstable BiGlobal mode in figure 3(a). These eigenvectors show spatially periodic structures which is a characteristic of oscillatory instability. The imaginary parts of these eigenfunctions are similar to the real parts with a phase shift of about
![]() $90^{\circ }$
, i.e. the zeros of the imaginary parts are located at the extrema of the corresponding real parts and vice versa. This phase shift indicates that these structures convect downstream as they grow. Overall, their characteristics are found to be similar to those of the global unstable modes of circular plumes (Bharadwaj & Das Reference Bharadwaj and Das2017; Chakravarthy et al.
Reference Chakravarthy, Lesshafft and Huerre2018).
$90^{\circ }$
, i.e. the zeros of the imaginary parts are located at the extrema of the corresponding real parts and vice versa. This phase shift indicates that these structures convect downstream as they grow. Overall, their characteristics are found to be similar to those of the global unstable modes of circular plumes (Bharadwaj & Das Reference Bharadwaj and Das2017; Chakravarthy et al.
Reference Chakravarthy, Lesshafft and Huerre2018).
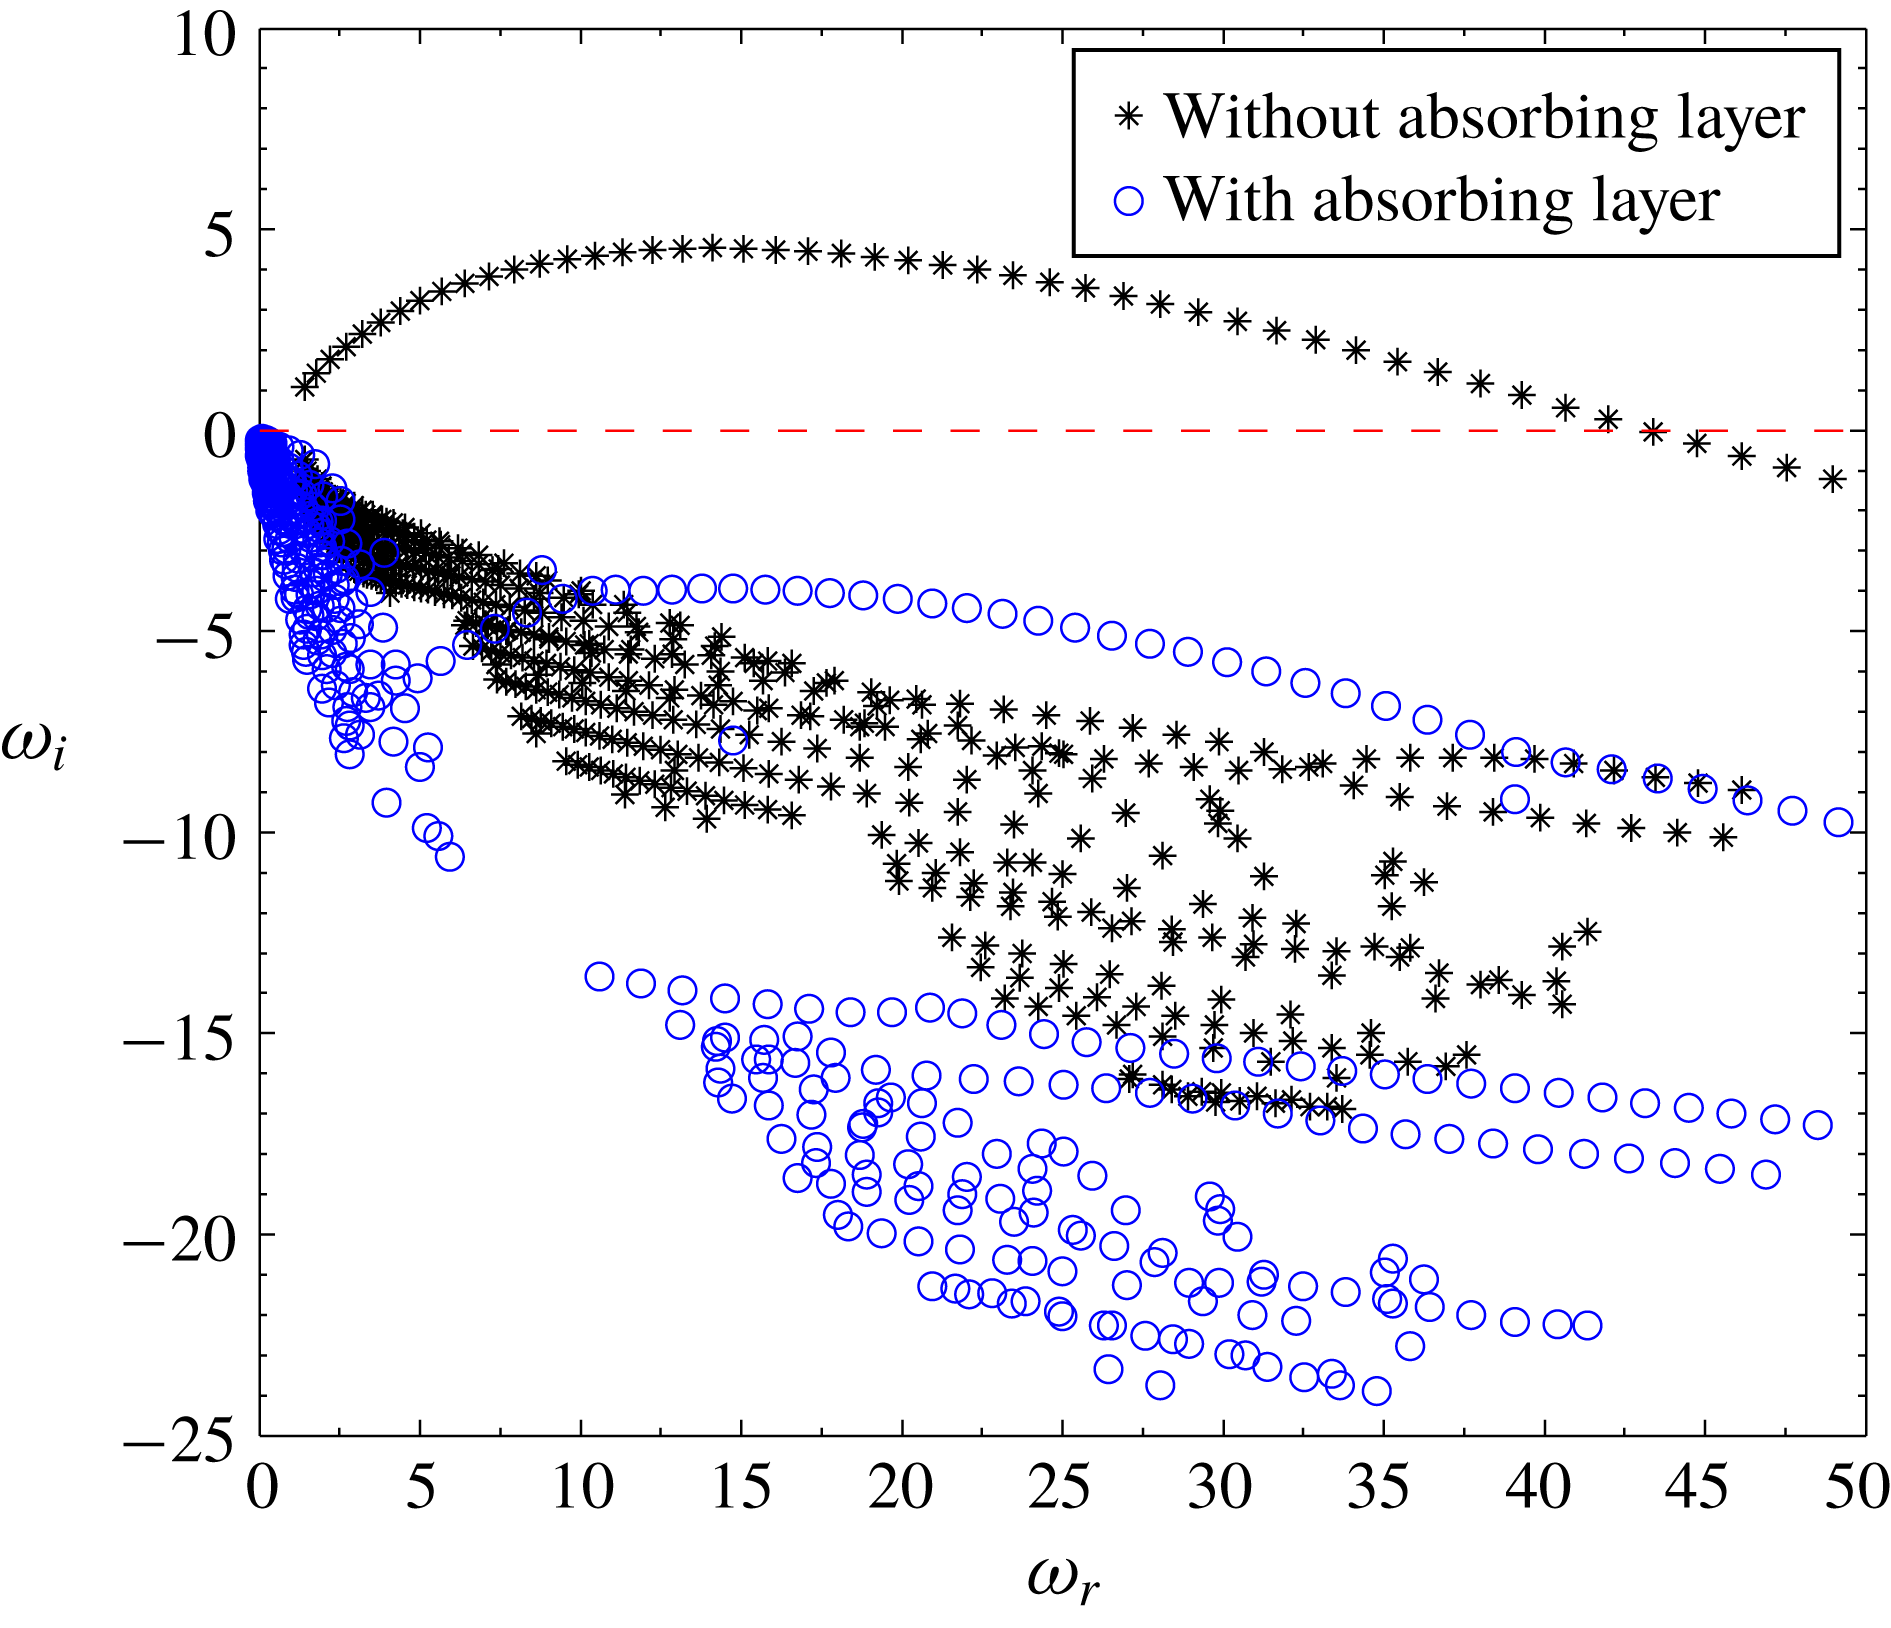
Figure 4. BiGlobal eigenvalue spectrum obtained for 2D (
![]() $\unicode[STIX]{x1D6FD}=0$
) sinuous perturbations for the case shown in figure 3(a).
$\unicode[STIX]{x1D6FD}=0$
) sinuous perturbations for the case shown in figure 3(a).
In the parameter space investigated, the eigenvalue spectra obtained for sinuous perturbations do not contain any isolated modes. However, they contain an unstable arc branch which stabilizes on the addition of an absorption layer near the outflow boundary, as shown in figure 4. Thus, the planar plumes are BiGlobally unstable only for varicose perturbations and are stable for sinuous perturbations. This observation is consistent with the earlier experimental and numerical works on planar plumes. Cetegen et al. (Reference Cetegen, Dong and Soteriou1998) and Soteriou et al. (Reference Soteriou, Dong and Cetegen2002) revealed that the planar plumes undergo an instability in their near field which is characterized by self-sustained periodic oscillations that involve formation, growth and shedding of a symmetric vortex pair from the plume source at a unique frequency. Since it is observed that the planar plumes are BiGlobally stable for asymmetric perturbations, we confine our further discussion to symmetric perturbations only. The frequencies
![]() $\unicode[STIX]{x1D714}_{r}$
and growth rates
$\unicode[STIX]{x1D714}_{r}$
and growth rates
![]() $\unicode[STIX]{x1D714}_{i}$
of the unstable BiGlobal symmetric mode, evaluated at each discrete parameter set
$\unicode[STIX]{x1D714}_{i}$
of the unstable BiGlobal symmetric mode, evaluated at each discrete parameter set
![]() $(Re,Fr,S)$
over the entire parameter space, are used to obtain the BiGlobal frequency scaling and transition diagrams respectively.
$(Re,Fr,S)$
over the entire parameter space, are used to obtain the BiGlobal frequency scaling and transition diagrams respectively.
4.1.2 Transition diagram and frequency scaling of the BiGlobal mode
The neutral curves obtained from the growth rates of the symmetric BiGlobal mode are presented in figure 5. These curves correspond to the contour lines of
![]() $\unicode[STIX]{x1D714}_{i}=0$
mapped in the
$\unicode[STIX]{x1D714}_{i}=0$
mapped in the
![]() $Re{-}Fr$
space, for each
$Re{-}Fr$
space, for each
![]() $S$
. The critical
$S$
. The critical
![]() $Re$
decreases with a decrease in
$Re$
decreases with a decrease in
![]() $Fr$
as well as with a decrease in
$Fr$
as well as with a decrease in
![]() $S$
. That is, plumes with larger buoyancy destabilize earlier at lower Reynolds numbers.
$S$
. That is, plumes with larger buoyancy destabilize earlier at lower Reynolds numbers.
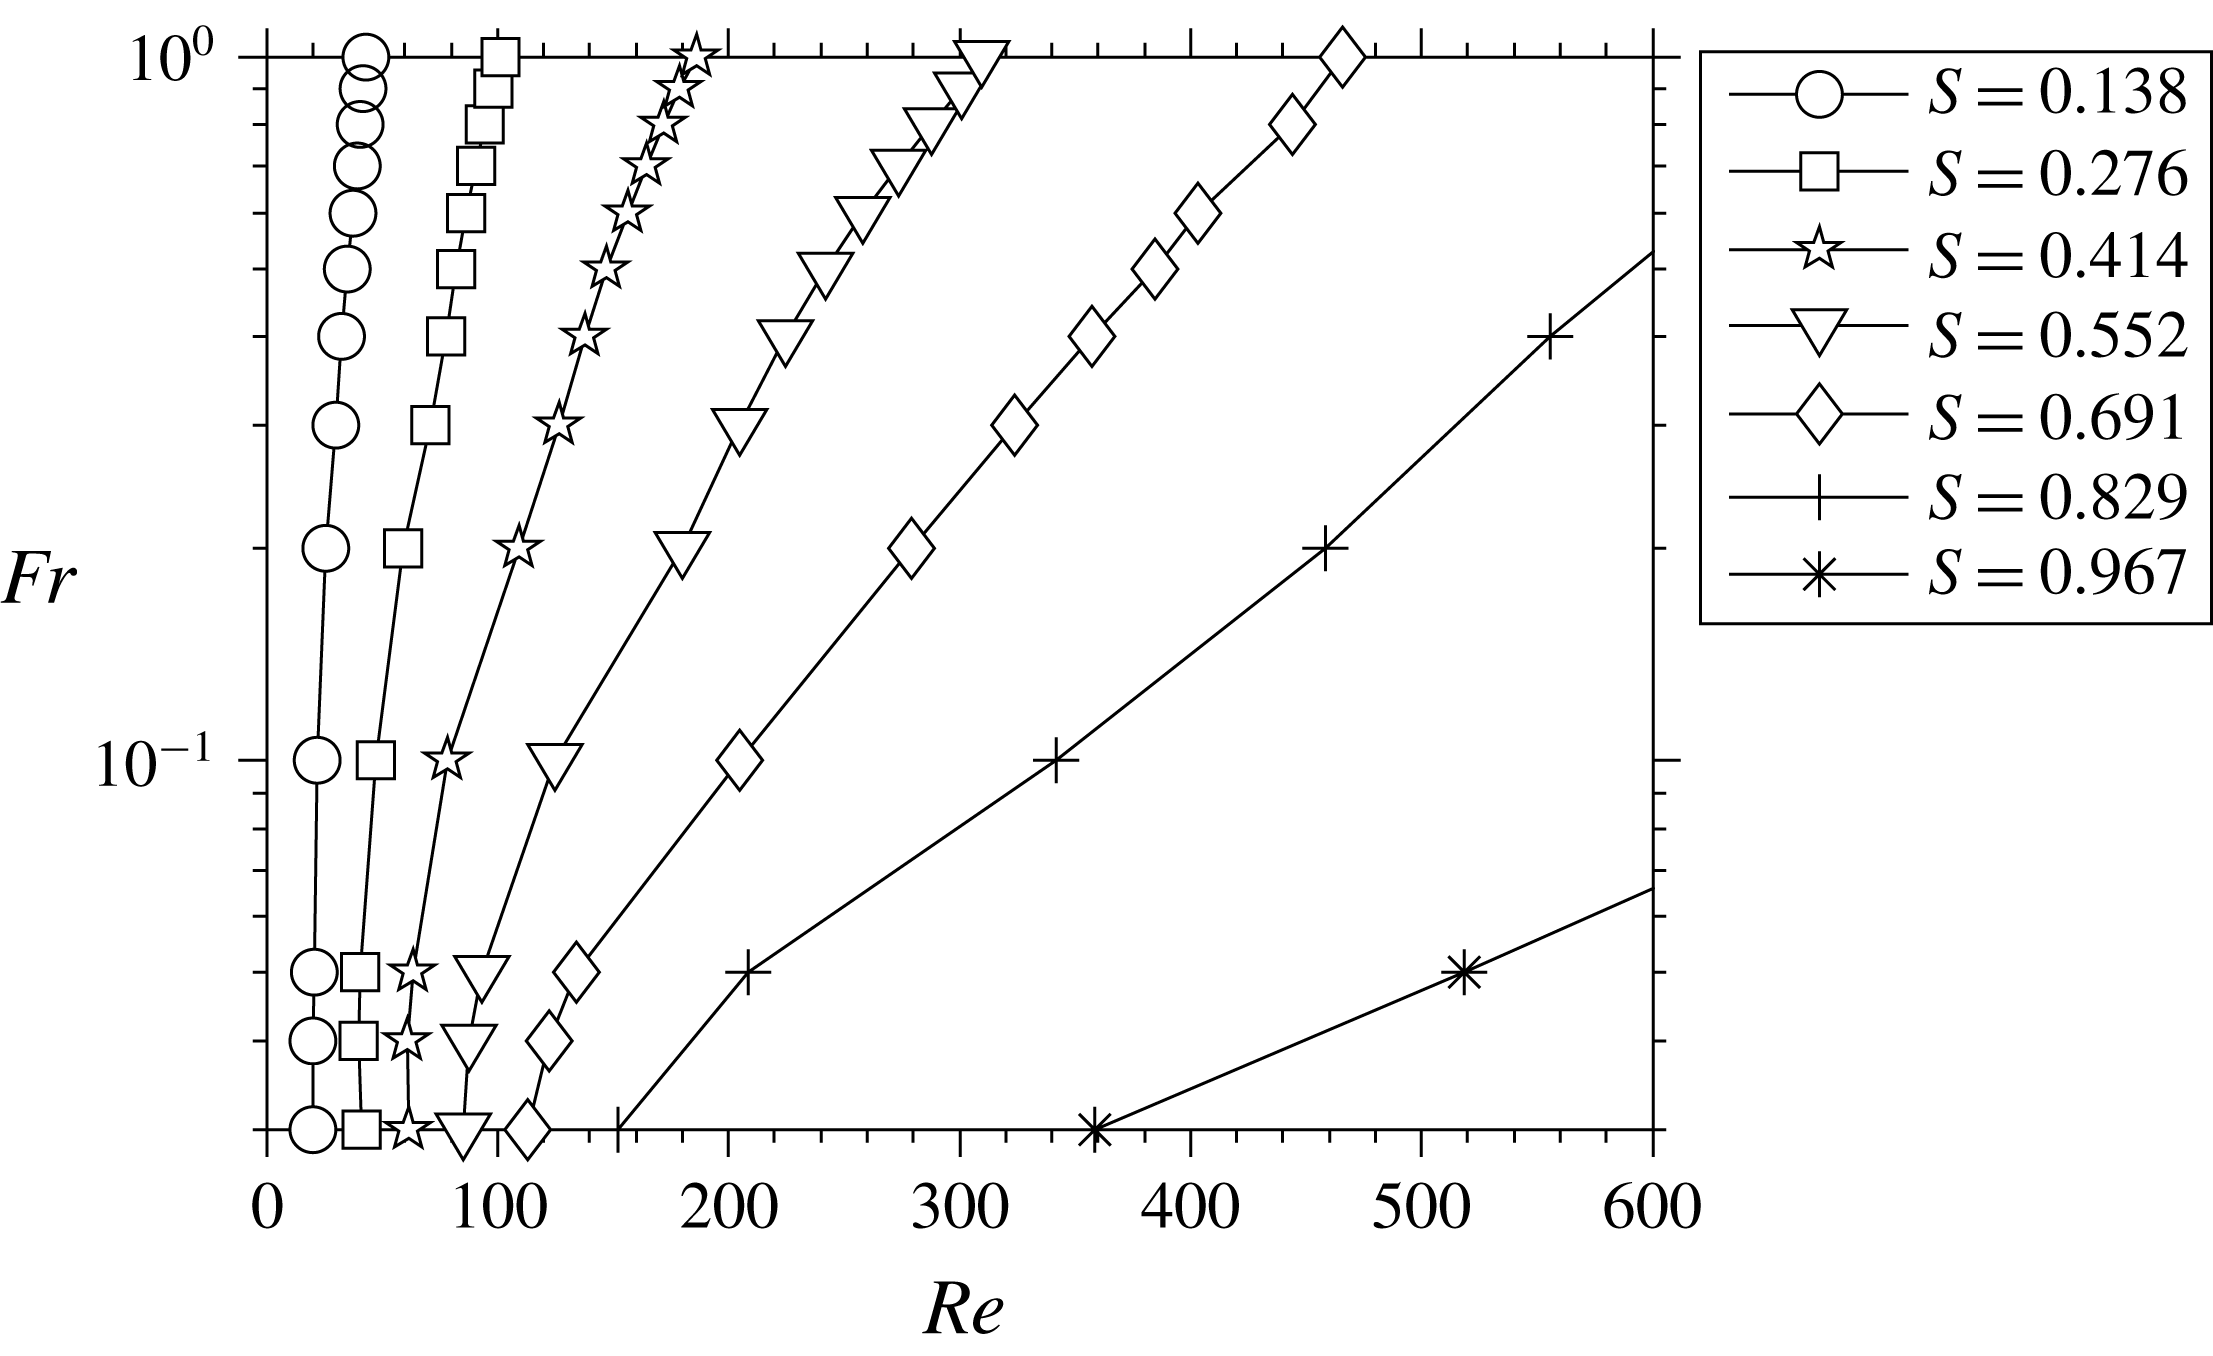
Figure 5. Neutral stability curves of the BiGlobal mode in
![]() $Re{-}Fr$
space for various density ratios, obtained for spanwise wavenumber
$Re{-}Fr$
space for various density ratios, obtained for spanwise wavenumber
![]() $\unicode[STIX]{x1D6FD}=0$
.
$\unicode[STIX]{x1D6FD}=0$
.
In earlier planar plume experiments, Cetegen et al. (Reference Cetegen, Dong and Soteriou1998) reported that the oscillatory plumes are not observed beyond a value of density ratio
![]() $S=0.5{-}0.6$
. However, similar to our observation in circular plumes, the present stability analysis shows that the planar plumes also exhibit the oscillatory instability beyond the threshold limit proposed by Cetegen et al. (Reference Cetegen, Dong and Soteriou1998). However, it is to be noted that with an increase in
$S=0.5{-}0.6$
. However, similar to our observation in circular plumes, the present stability analysis shows that the planar plumes also exhibit the oscillatory instability beyond the threshold limit proposed by Cetegen et al. (Reference Cetegen, Dong and Soteriou1998). However, it is to be noted that with an increase in
![]() $S$
, the unstable region gets confined to the plumes of higher
$S$
, the unstable region gets confined to the plumes of higher
![]() $Re$
and lower
$Re$
and lower
![]() $Fr$
. In § 4.5 of Bharadwaj & Das (Reference Bharadwaj and Das2017), we estimated that the perturbation growth rates are governed by the relative strengths of buoyancy and viscous forces as buoyancy/viscous diffusion
$Fr$
. In § 4.5 of Bharadwaj & Das (Reference Bharadwaj and Das2017), we estimated that the perturbation growth rates are governed by the relative strengths of buoyancy and viscous forces as buoyancy/viscous diffusion
![]() ${\sim}O(Re\unicode[STIX]{x1D707}^{\ast }/SFr^{2})$
. While the buoyancy tends to destabilize the plumes, the viscous diffusion tends to stabilize them. Therefore, plumes with higher
${\sim}O(Re\unicode[STIX]{x1D707}^{\ast }/SFr^{2})$
. While the buoyancy tends to destabilize the plumes, the viscous diffusion tends to stabilize them. Therefore, plumes with higher
![]() $S$
exhibit instability only at higher
$S$
exhibit instability only at higher
![]() $Re$
and lower
$Re$
and lower
![]() $Fr$
where buoyancy dominates the viscous diffusion. As the density difference vanishes, plumes become globally stable as shown by Garnaud et al. (Reference Garnaud, Lesshafft, Schmid and Huerre2013).
$Fr$
where buoyancy dominates the viscous diffusion. As the density difference vanishes, plumes become globally stable as shown by Garnaud et al. (Reference Garnaud, Lesshafft, Schmid and Huerre2013).
A plausible reason for the absence of puffing for plumes of
![]() $S>0.6$
in the experiments of Cetegen et al. (Reference Cetegen, Dong and Soteriou1998) is that their experiments would have been confined to low
$S>0.6$
in the experiments of Cetegen et al. (Reference Cetegen, Dong and Soteriou1998) is that their experiments would have been confined to low
![]() $Re$
and high
$Re$
and high
![]() $Fr$
, at higher
$Fr$
, at higher
![]() $S$
. While the
$S$
. While the
![]() $Fr$
range of Cetegen et al. (Reference Cetegen, Dong and Soteriou1998) is not readily available from their paper, their experiments were confined to
$Fr$
range of Cetegen et al. (Reference Cetegen, Dong and Soteriou1998) is not readily available from their paper, their experiments were confined to
![]() $Re<150$
(one can infer this from figures 6 and 7 of Cetegen et al.
Reference Cetegen, Dong and Soteriou1998). The neutral curves obtained from the present instability analysis (figure 5) show that the plumes of
$Re<150$
(one can infer this from figures 6 and 7 of Cetegen et al.
Reference Cetegen, Dong and Soteriou1998). The neutral curves obtained from the present instability analysis (figure 5) show that the plumes of
![]() $Re<150$
largely remain stable for density ratios higher than 0.6. Since the experiments of Cetegen et al. (Reference Cetegen, Dong and Soteriou1998) are confined to
$Re<150$
largely remain stable for density ratios higher than 0.6. Since the experiments of Cetegen et al. (Reference Cetegen, Dong and Soteriou1998) are confined to
![]() $Re<150$
, they did not observe puffing for
$Re<150$
, they did not observe puffing for
![]() $S>0.6$
. Nevertheless, the present study shows that plumes exhibit puffing at any density ratio until
$S>0.6$
. Nevertheless, the present study shows that plumes exhibit puffing at any density ratio until
![]() $S\approx 1$
.
$S\approx 1$
.
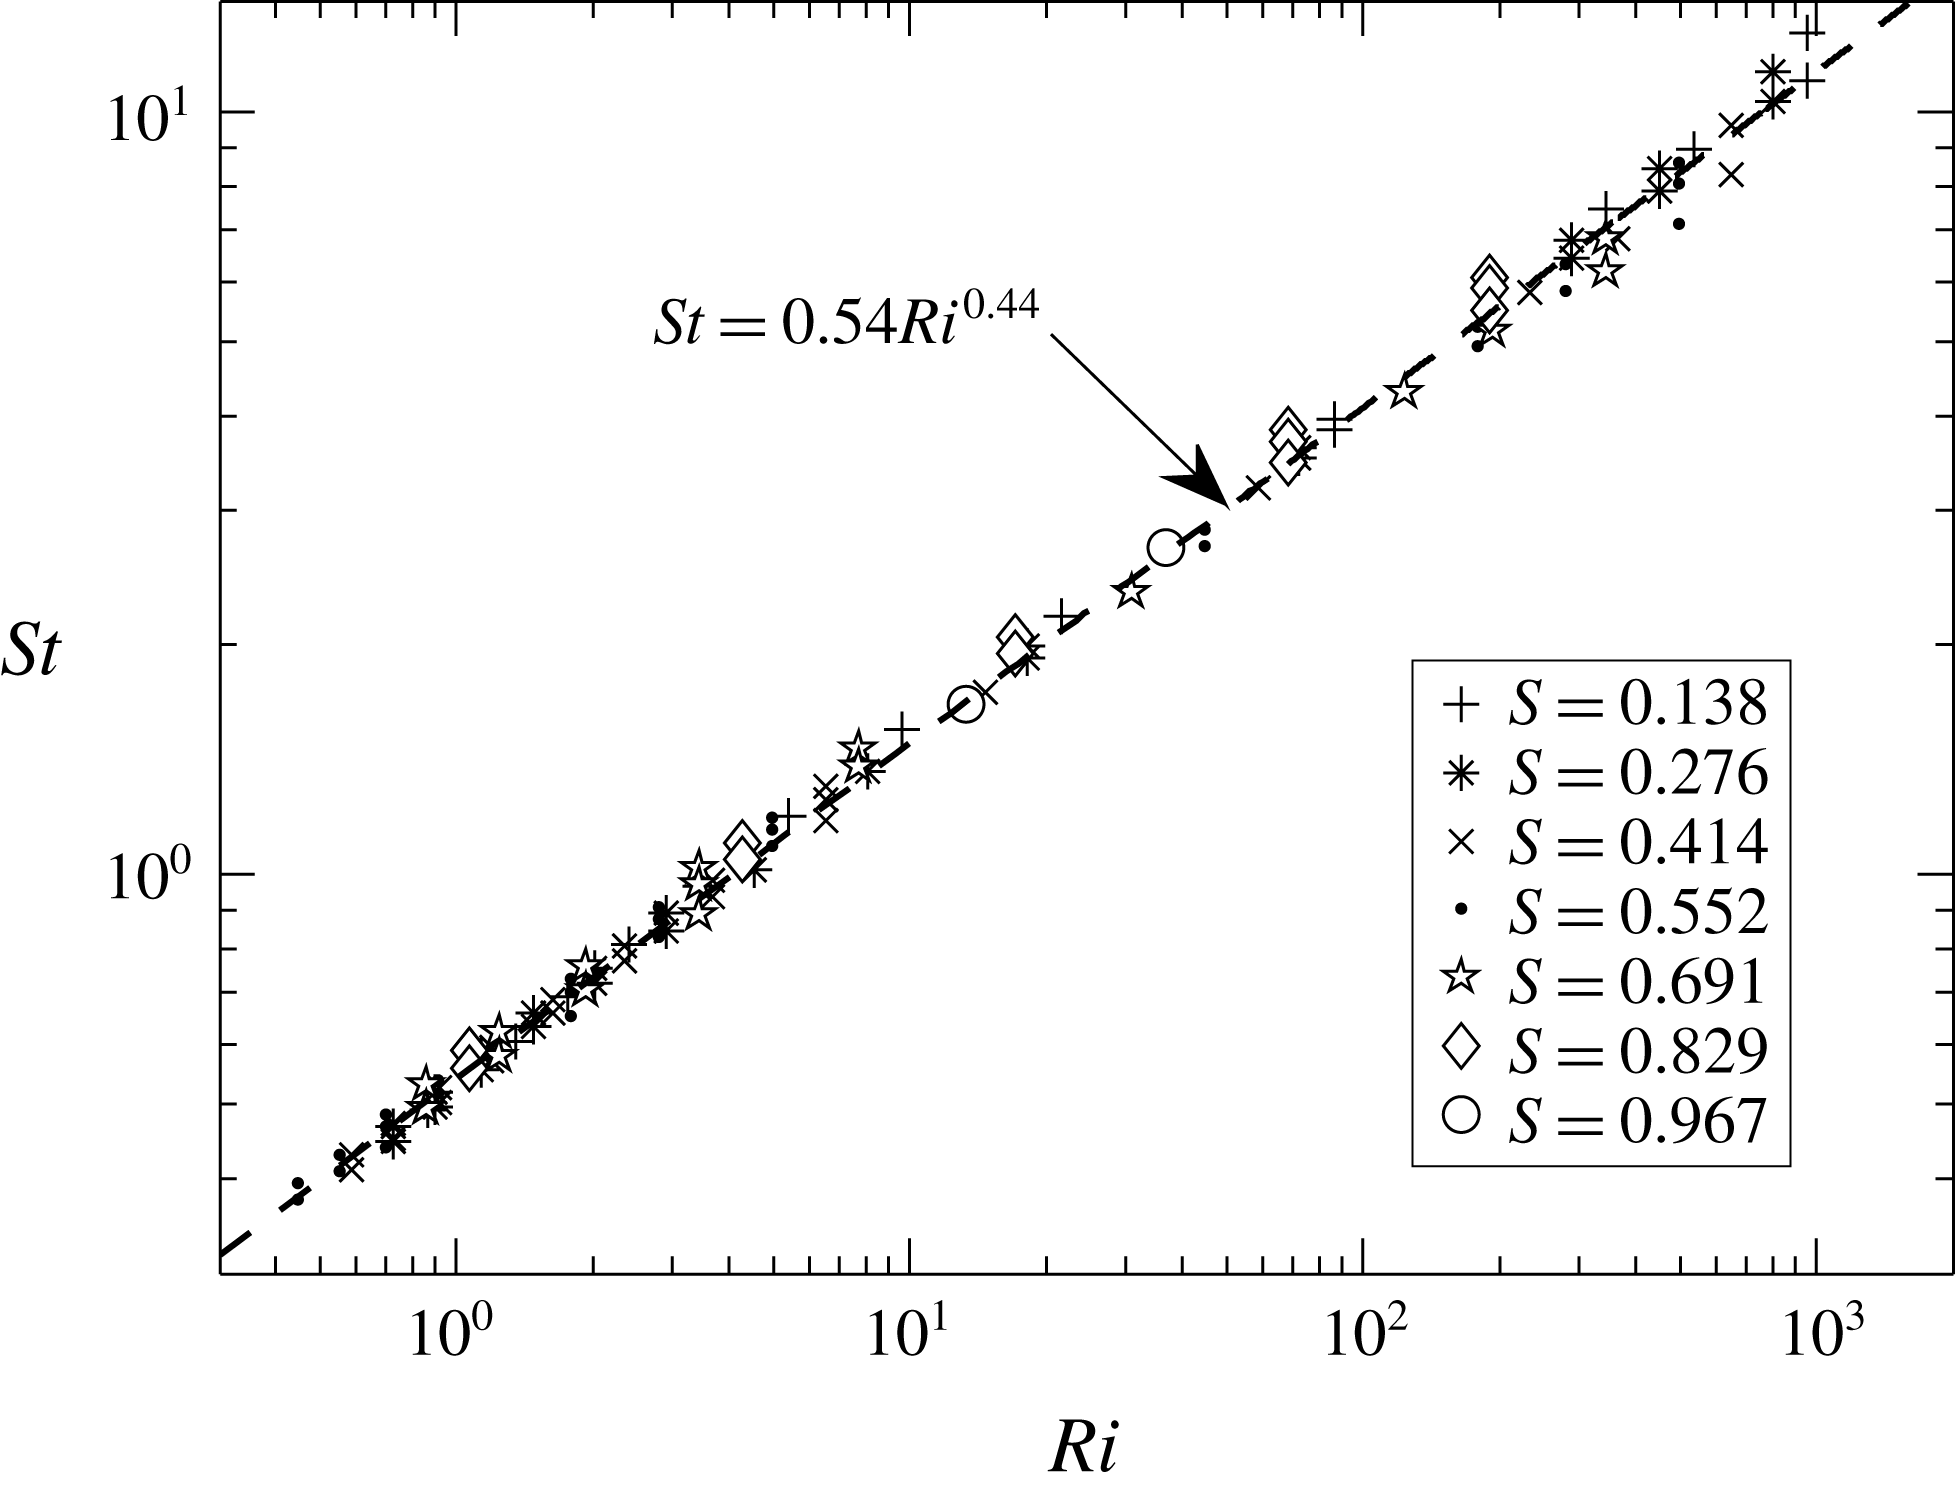
Figure 6. Variation of
![]() $St$
with
$St$
with
![]() $Ri$
for the unstable BiGlobal mode with spanwise wavenumber
$Ri$
for the unstable BiGlobal mode with spanwise wavenumber
![]() $\unicode[STIX]{x1D6FD}=0$
.
$\unicode[STIX]{x1D6FD}=0$
.
The non-dimensional frequency, or Strouhal number (
![]() $St=\unicode[STIX]{x1D714}_{r}/(2\unicode[STIX]{x03C0})$
), of the unstable BiGlobal mode, obtained for all the cases in the investigated parameter space, is plotted in figure 6 in terms of its variation with the plume source Richardson number,
$St=\unicode[STIX]{x1D714}_{r}/(2\unicode[STIX]{x03C0})$
), of the unstable BiGlobal mode, obtained for all the cases in the investigated parameter space, is plotted in figure 6 in terms of its variation with the plume source Richardson number,
![]() $Ri$
. The
$Ri$
. The
![]() $St$
correlates well with
$St$
correlates well with
![]() $Ri$
, and the least-squares fit to the data yields a power law
$Ri$
, and the least-squares fit to the data yields a power law
![]() $St=0.54Ri^{0.44}$
(
$St=0.54Ri^{0.44}$
(
![]() $R$
-square
$R$
-square
![]() $=$
0.998). Cetegen et al. (Reference Cetegen, Dong and Soteriou1998) measured oscillation frequencies in planar plumes of inlet
$=$
0.998). Cetegen et al. (Reference Cetegen, Dong and Soteriou1998) measured oscillation frequencies in planar plumes of inlet
![]() $Ri$
range 1–100 and obtained a frequency correlation
$Ri$
range 1–100 and obtained a frequency correlation
![]() $St=0.55Ri^{\,0.45}$
from their experiments. The frequency correlation of the BiGlobal mode obtained from the present instability analysis is in excellent agreement with that obtained in the earlier experiments (Cetegen et al.
Reference Cetegen, Dong and Soteriou1998).
$St=0.55Ri^{\,0.45}$
from their experiments. The frequency correlation of the BiGlobal mode obtained from the present instability analysis is in excellent agreement with that obtained in the earlier experiments (Cetegen et al.
Reference Cetegen, Dong and Soteriou1998).
4.1.3 Three-dimensional perturbations: effect of spanwise wavenumber
 $\unicode[STIX]{x1D6FD}$
The results presented above consider the perturbations to be 2D, i.e.
![]() $\unicode[STIX]{x1D6FD}=0$
. In this section, we briefly consider the effect of 3D perturbations, i.e. non-zero
$\unicode[STIX]{x1D6FD}=0$
. In this section, we briefly consider the effect of 3D perturbations, i.e. non-zero
![]() $\unicode[STIX]{x1D6FD}$
, on stability characteristics of planar plumes. To accomplish this, linear stability analysis has been performed by gradually increasing
$\unicode[STIX]{x1D6FD}$
, on stability characteristics of planar plumes. To accomplish this, linear stability analysis has been performed by gradually increasing
![]() $\unicode[STIX]{x1D6FD}$
, for plumes of three Froude numbers
$\unicode[STIX]{x1D6FD}$
, for plumes of three Froude numbers
![]() $Fr=0.1$
, 0.5 and 1, and keeping
$Fr=0.1$
, 0.5 and 1, and keeping
![]() $Re=180$
,
$Re=180$
,
![]() $S=0.276$
. The frequency and growth rate of the most unstable BiGlobal mode obtained for various
$S=0.276$
. The frequency and growth rate of the most unstable BiGlobal mode obtained for various
![]() $\unicode[STIX]{x1D6FD}$
are plotted in figure 7. The analysis reveals that an increase in the spanwise wavenumber
$\unicode[STIX]{x1D6FD}$
are plotted in figure 7. The analysis reveals that an increase in the spanwise wavenumber
![]() $\unicode[STIX]{x1D6FD}$
leads to a decrease in growth rates (figure 7
b) and eventually to stabilization of the plumes. However, its impact on the BiGlobal mode frequencies is negligible (figure 7
a). More importantly, this analysis shows that the 2D perturbations (i.e.
$\unicode[STIX]{x1D6FD}$
leads to a decrease in growth rates (figure 7
b) and eventually to stabilization of the plumes. However, its impact on the BiGlobal mode frequencies is negligible (figure 7
a). More importantly, this analysis shows that the 2D perturbations (i.e.
![]() $\unicode[STIX]{x1D6FD}=0$
) always exhibit higher growth rates than the 3D perturbations (i.e.
$\unicode[STIX]{x1D6FD}=0$
) always exhibit higher growth rates than the 3D perturbations (i.e.
![]() $\unicode[STIX]{x1D6FD}>0$
). Therefore, the natural transitions in planar plumes that lead to BiGlobal instability will always be 2D.
$\unicode[STIX]{x1D6FD}>0$
). Therefore, the natural transitions in planar plumes that lead to BiGlobal instability will always be 2D.
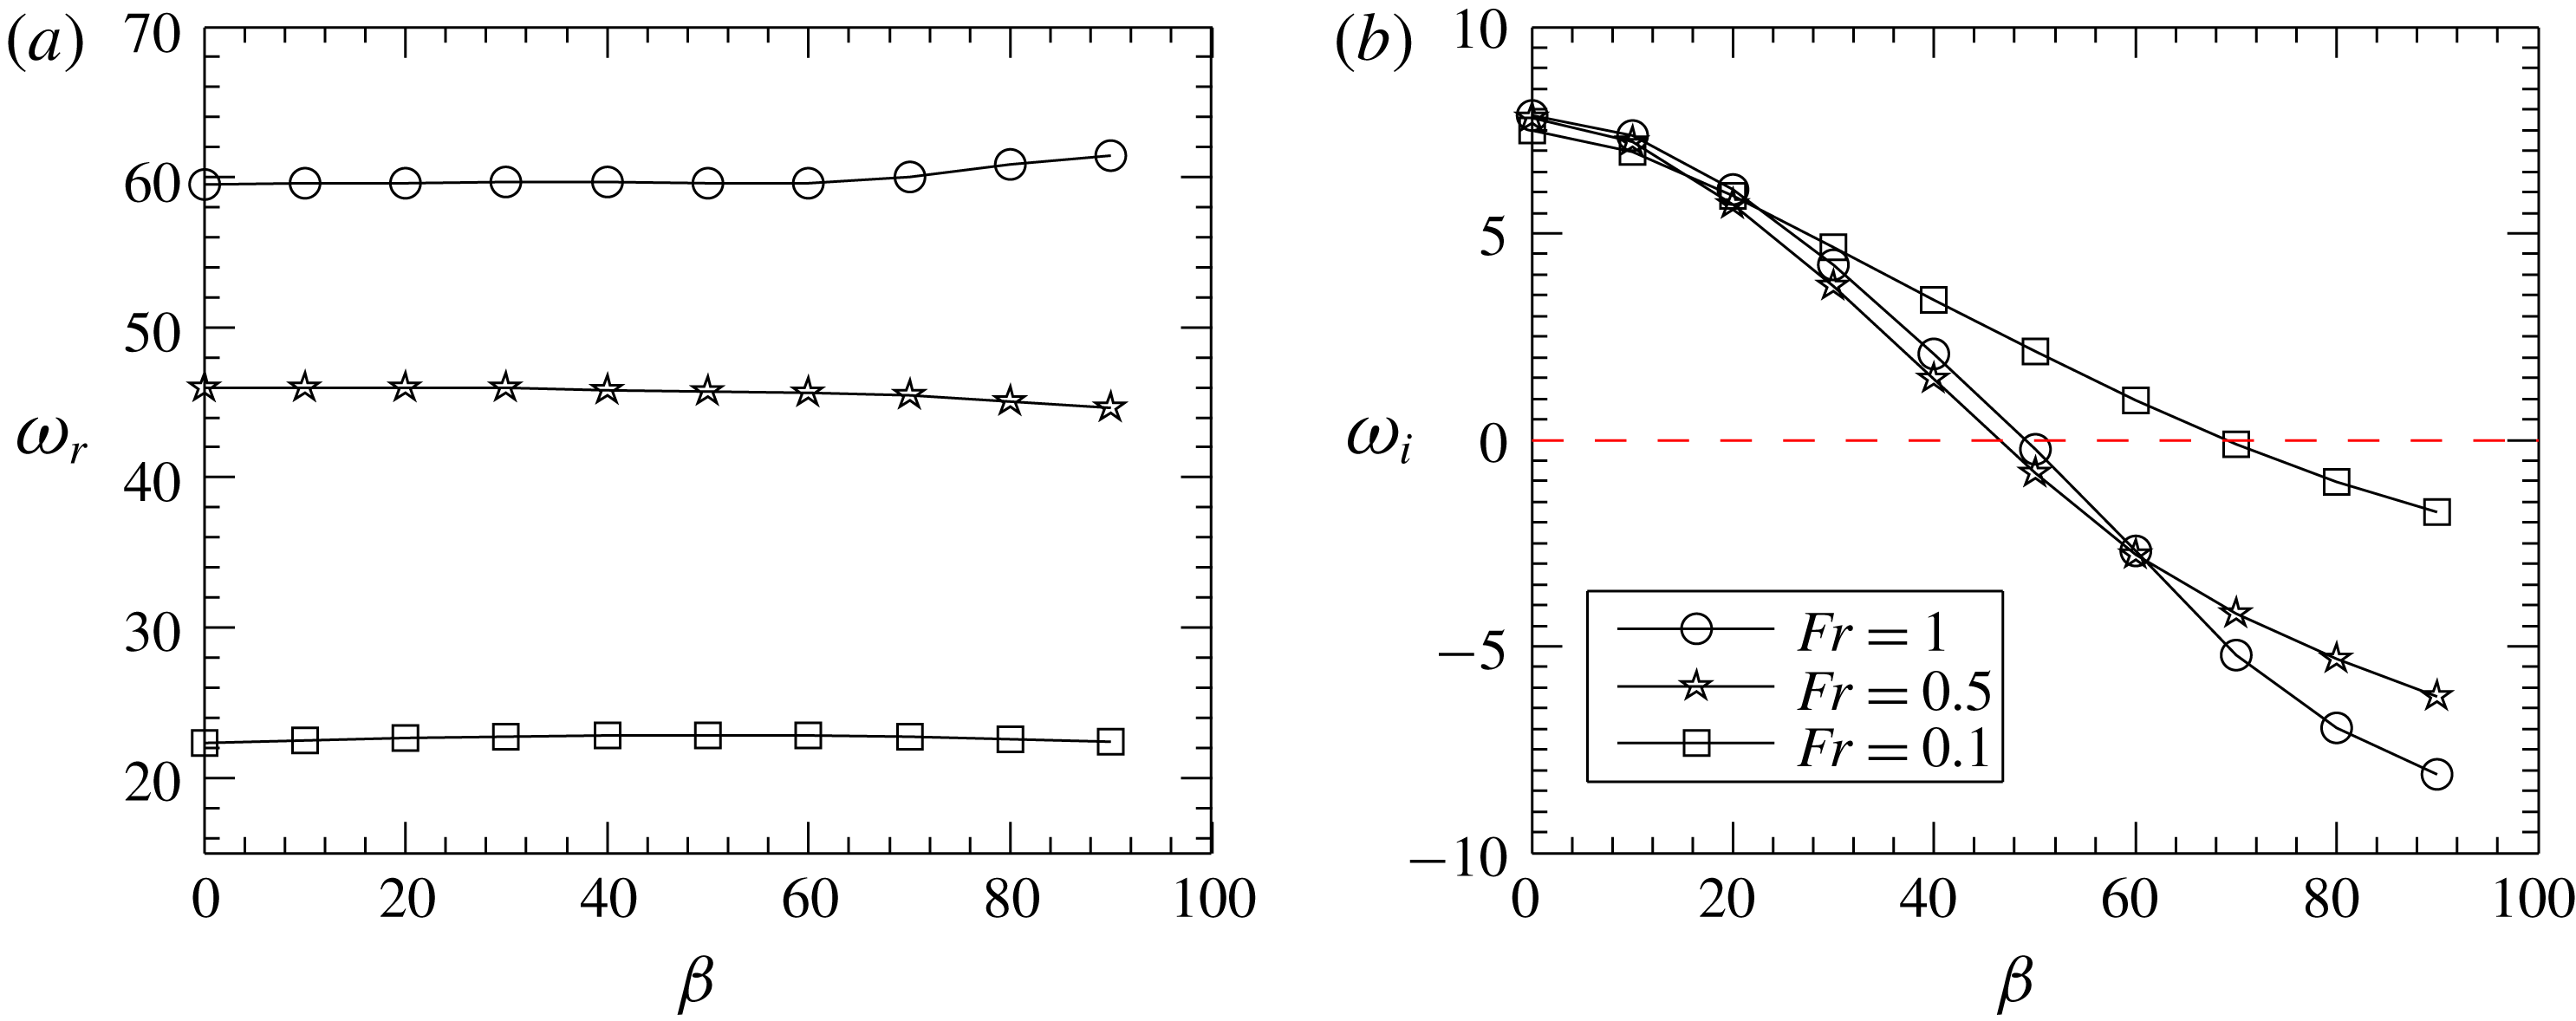
Figure 7. Variation of BiGlobal mode oscillation frequency and growth rate with spanwise wavenumber
![]() $\unicode[STIX]{x1D6FD}$
for plumes of
$\unicode[STIX]{x1D6FD}$
for plumes of
![]() $Re=180$
and
$Re=180$
and
![]() $S=0.276$
.
$S=0.276$
.
4.2 Experimental observations
Experiments are performed in plumes emanating from rectangular orifices of various finite ARs as listed in table 2 and their puffing dynamics is compared with the predictions from BiGlobal instability analysis with
![]() $\unicode[STIX]{x1D6FD}=0$
.
$\unicode[STIX]{x1D6FD}=0$
.
4.2.1 Onset of oscillatory instability in rectangular plumes
The evolution of a rectangular plume with increase in inlet velocity
![]() $w_{0}$
, i.e. increase in inlet
$w_{0}$
, i.e. increase in inlet
![]() $Re$
and
$Re$
and
![]() $Fr$
keeping
$Fr$
keeping
![]() $S$
constant, is presented to investigate the nature of instabilities that arise in these plumes. Velocity fields measured at 50 Hz using PIV are employed to characterize these instabilities, and the corresponding seed particle images are presented here as flow visualizations.
$S$
constant, is presented to investigate the nature of instabilities that arise in these plumes. Velocity fields measured at 50 Hz using PIV are employed to characterize these instabilities, and the corresponding seed particle images are presented here as flow visualizations.
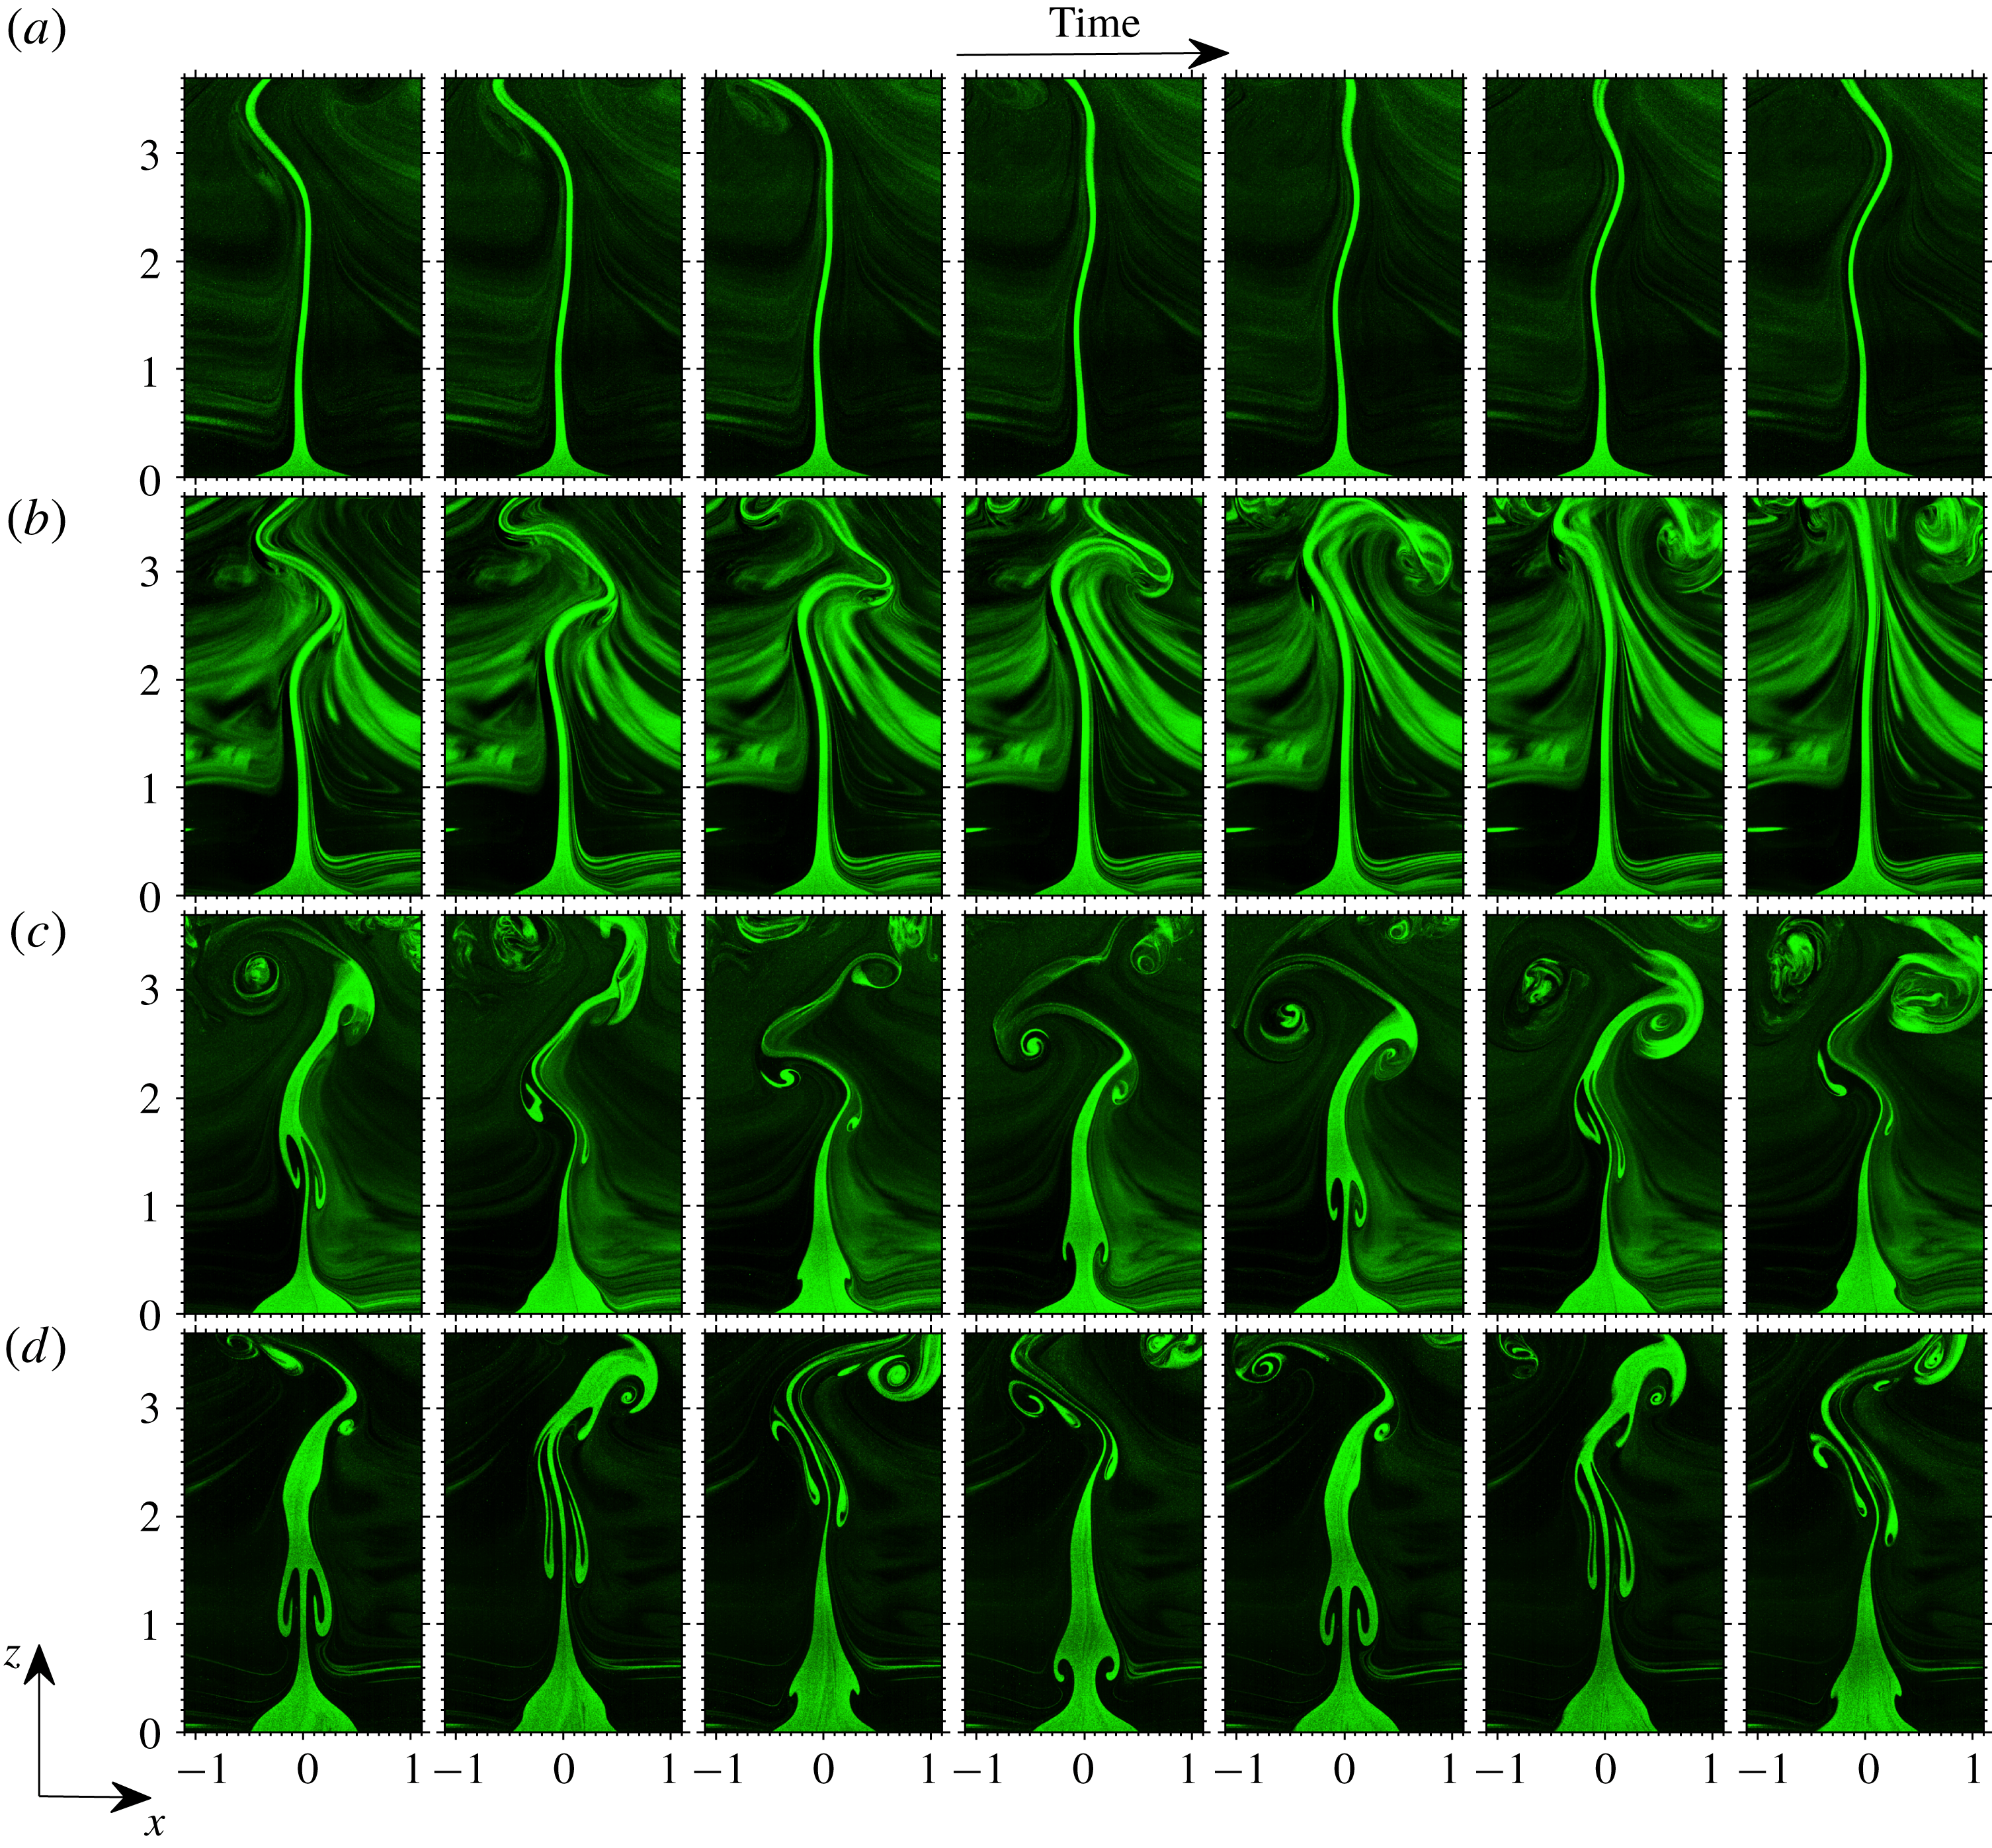
Figure 8. Evolution of a planar plume from non-puffing to puffing state with an increase in inlet velocity: (a)
![]() $w_{0}=0.032~\text{m}~\text{s}^{-1}$
(
$w_{0}=0.032~\text{m}~\text{s}^{-1}$
(
![]() $Re=22$
,
$Re=22$
,
![]() $Fr=0.05$
), (b)
$Fr=0.05$
), (b)
![]() $0.064~\text{m}~\text{s}^{-1}$
(
$0.064~\text{m}~\text{s}^{-1}$
(
![]() $Re=45$
,
$Re=45$
,
![]() $Fr=0.1$
), (c)
$Fr=0.1$
), (c)
![]() $0.128~\text{m}~\text{s}^{-1}$
(
$0.128~\text{m}~\text{s}^{-1}$
(
![]() $Re=86$
,
$Re=86$
,
![]() $Fr=0.2$
) and (d)
$Fr=0.2$
) and (d)
![]() $0.194~\text{m}~\text{s}^{-1}$
(
$0.194~\text{m}~\text{s}^{-1}$
(
![]() $Re=126$
,
$Re=126$
,
![]() $Fr=0.3$
). The plume emanates from a rectangular orifice of width
$Fr=0.3$
). The plume emanates from a rectangular orifice of width
![]() $B=0.042~\text{m}$
(
$B=0.042~\text{m}$
(
![]() $\text{AR}=5$
). Time gap between two successive snapshots is 0.04 s. The density ratio is kept constant at
$\text{AR}=5$
). Time gap between two successive snapshots is 0.04 s. The density ratio is kept constant at
![]() $S=0.276$
.
$S=0.276$
.
Figure 9. The time traces of streamwise velocity along the centreline (
![]() $x=0$
) at three different heights
$x=0$
) at three different heights
![]() $z=1$
, 2 and 3, and corresponding FFTs for the four planar plume cases shown in figure 8, i.e. (a)
$z=1$
, 2 and 3, and corresponding FFTs for the four planar plume cases shown in figure 8, i.e. (a)
![]() $w_{0}=0.032~\text{m}~\text{s}^{-1}$
, (b)
$w_{0}=0.032~\text{m}~\text{s}^{-1}$
, (b)
![]() $0.066\text{m}~\text{s}^{-1}$
, (c)
$0.066\text{m}~\text{s}^{-1}$
, (c)
![]() $0.128\text{m}~\text{s}^{-1}$
and (d)
$0.128\text{m}~\text{s}^{-1}$
and (d)
![]() $0.194\text{m}~\text{s}^{-1}$
.
$0.194\text{m}~\text{s}^{-1}$
.
Figure 8 shows the evolution of a plume emanating from a rectangular orifice of
![]() $B=0.042~\text{m}$
(
$B=0.042~\text{m}$
(
![]() $\text{AR}=5$
), with an increase in inlet velocity
$\text{AR}=5$
), with an increase in inlet velocity
![]() $w_{0}$
from 0.032 to
$w_{0}$
from 0.032 to
![]() $0.194~\text{m}~\text{s}^{-1}$
, resulting in a simultaneous variation of
$0.194~\text{m}~\text{s}^{-1}$
, resulting in a simultaneous variation of
![]() $Re$
and
$Re$
and
![]() $Fr$
in the ranges
$Fr$
in the ranges
![]() $22\leqslant Re\leqslant 126$
and
$22\leqslant Re\leqslant 126$
and
![]() $0.05\leqslant Fr\leqslant 0.3$
. At each inlet velocity, the behaviour of the plume with time is also presented to show its unsteady nature. At lower inlet velocities, the plume develops a long laminar column which is relatively steady near the inlet. It undergoes a whiplash-like instability away from the source which involves sinuous meandering (figure 8
a,b). With an increase in inlet velocity, beyond a critical value, the plume undergoes a periodic instability in the near field which involves shedding of a pair of symmetric vortices with opposite circulation, as observed in figure 8(c,d). Additionally, away from the plume source, the central stem exhibits asymmetric undulations similar to that observed at lower inlet velocities. Overall, we observe two types of instabilities in planar plumes: (1) asymmetric instability away from plume source which involves sinuous meandering and (2) symmetric instability near the plume source which involves periodic formation and shedding of vortex pairs of opposite circulation.
$0.05\leqslant Fr\leqslant 0.3$
. At each inlet velocity, the behaviour of the plume with time is also presented to show its unsteady nature. At lower inlet velocities, the plume develops a long laminar column which is relatively steady near the inlet. It undergoes a whiplash-like instability away from the source which involves sinuous meandering (figure 8
a,b). With an increase in inlet velocity, beyond a critical value, the plume undergoes a periodic instability in the near field which involves shedding of a pair of symmetric vortices with opposite circulation, as observed in figure 8(c,d). Additionally, away from the plume source, the central stem exhibits asymmetric undulations similar to that observed at lower inlet velocities. Overall, we observe two types of instabilities in planar plumes: (1) asymmetric instability away from plume source which involves sinuous meandering and (2) symmetric instability near the plume source which involves periodic formation and shedding of vortex pairs of opposite circulation.
To characterize these two behaviours, we follow the criterion proposed by Sreenivasan, Raghu & Kyle (Reference Sreenivasan, Raghu and Kyle1989) who investigated the instabilities in variable-density jets. Sreenivasan et al. (Reference Sreenivasan, Raghu and Kyle1989) differentiated the occurrence of absolute instability and convective instability in momentum-dominated variable-density jets by investigating their frequency spectra. They observed that the frequency spectrum of the absolute instability is characterized by very sharp peaks at a characteristic frequency and its harmonics. Whereas, the convective instability is characterized by a broadened spectrum, with much less prominent and distributed spectral peaks. Note that the absolute instability is a local analogue to the globally unstable, oscillatory behaviour (Schmid & Henningson Reference Schmid and Henningson2012). The presence of a finite region of absolute instability is a necessary condition for a flow to be globally unstable (Huerre & Monkewitz Reference Huerre and Monkewitz1990), i.e. flows that are absolutely unstable tend to become globally unstable. Therefore, in the present study, we calculated the frequency spectra from the velocity fields obtained from PIV to identify the global instability. Figure 9 shows the time traces of velocity at three streamwise locations
![]() $z=1$
, 2 and 3 along the plume centreline (
$z=1$
, 2 and 3 along the plume centreline (
![]() $x=0$
) and their corresponding fast Fourier transforms (FFTs), for the four plume cases shown in figure 8.
$x=0$
) and their corresponding fast Fourier transforms (FFTs), for the four plume cases shown in figure 8.
At lower inlet velocities (figures 8
a,b and 9
a,b), the FFTs show a broadband frequency spectrum with the peaks distributed over a set of frequencies, which is a characteristic of convective instability. Therefore, the sinuous meandering or the asymmetric instability observed in plumes corresponds to the convective instability. This observation is consistent with the earlier works of Pera & Gebhart (Reference Pera and Gebhart1971), Yang (Reference Yang1992) and Ravier et al. (Reference Ravier, Abid, Amielh and Anselmet2006) concerning planar plumes. From local-spatial and local-temporal linear stability analysis in planar plumes, they obtained that these plumes are convectively unstable for both varicose and sinuous perturbations, with the sinuous perturbations always exhibiting higher growth rates than the varicose perturbations. The occurrence of sinuous instability in the far field of the planar plumes was also observed in earlier experiments (Pera & Gebhart Reference Pera and Gebhart1971) and computations (Ravier et al.
Reference Ravier, Abid, Amielh and Anselmet2006). The spectral behaviour changes beyond the critical inlet velocity, i.e. at higher inlet velocities (figures 8
c,d and 9
c,d) the FFTs show sharper peaks at a characteristic frequency and its harmonics, with higher amplitudes, which implies that the symmetric periodic instability observed in the near field corresponds to the global instability. The periodic nature of this instability is evident from the near-field (
![]() $x=0$
and
$x=0$
and
![]() $z=1$
) velocity traces presented in figure 9(c,d). The flow visualizations (figure 8
c,d) show that this global oscillatory instability is symmetric in nature consistent with our observation from the present BiGlobal linear stability analysis. This oscillatory instability in plumes is commonly termed ‘puffing’. The dominant frequency of pulsation in the near field is termed the ‘puffing frequency’ of the plume. Further away from the plume source, the flow becomes more complex and additional frequencies which correspond to the sub/super harmonics of the puffing frequency dominate the flow (
$z=1$
) velocity traces presented in figure 9(c,d). The flow visualizations (figure 8
c,d) show that this global oscillatory instability is symmetric in nature consistent with our observation from the present BiGlobal linear stability analysis. This oscillatory instability in plumes is commonly termed ‘puffing’. The dominant frequency of pulsation in the near field is termed the ‘puffing frequency’ of the plume. Further away from the plume source, the flow becomes more complex and additional frequencies which correspond to the sub/super harmonics of the puffing frequency dominate the flow (
![]() $z=3$
in figure 9
c,d).
$z=3$
in figure 9
c,d).
Note that although the plumes at low inlet velocities are convectively unstable to asymmetric perturbations, they are globally stable since these perturbations eventually convect downstream away from the plume source, thereby stabilizing the plumes in the near field in the long-time limit. Since the present study is only confined to global instability, we consider these plumes to be globally stable, and refer to them as ‘non-puffing plumes’ in our further discussion.
4.2.2 Effect of AR
The effect of AR on puffing has been examined by comparing the plume states and puffing frequencies of rectangular plumes with those of the results obtained from the BiGlobal instability analysis with
![]() $\unicode[STIX]{x1D6FD}=0$
. The case of
$\unicode[STIX]{x1D6FD}=0$
. The case of
![]() $\text{AR}=1$
, i.e. square plumes, will be discussed separately in § 4.2.4.
$\text{AR}=1$
, i.e. square plumes, will be discussed separately in § 4.2.4.
The plume states are classified as non-puffing and puffing as described in § 4.2.1, and are mapped in the
![]() $Re{-}Fr$
plane at each density ratio
$Re{-}Fr$
plane at each density ratio
![]() $S$
. Figure 10 shows the plume states for rectangular plumes of two ARs, 3.4 and 5, and four density ratios,
$S$
. Figure 10 shows the plume states for rectangular plumes of two ARs, 3.4 and 5, and four density ratios,
![]() $S=0.138$
, 0.276, 0.414 and 0.552. The filled markers in figure 10 represent the puffing plumes, whereas the non-puffing plumes are denoted by open markers. It is evident from figure 10 that in spite of their low ARs, the rectangular plumes closely follow the transition criterion obtained from BiGlobal instability analysis with
$S=0.138$
, 0.276, 0.414 and 0.552. The filled markers in figure 10 represent the puffing plumes, whereas the non-puffing plumes are denoted by open markers. It is evident from figure 10 that in spite of their low ARs, the rectangular plumes closely follow the transition criterion obtained from BiGlobal instability analysis with
![]() $\unicode[STIX]{x1D6FD}=0$
. This shows that the neutral curves obtained from instability analysis could effectively delineate the puffing and non-puffing regions for rectangular plumes of low AR. However, the square plumes (discussed in § 4.2.4) deviate from the predictions of the instability analysis, which indicates that there is an AR limit for the validity of these BiGlobal instability predictions.
$\unicode[STIX]{x1D6FD}=0$
. This shows that the neutral curves obtained from instability analysis could effectively delineate the puffing and non-puffing regions for rectangular plumes of low AR. However, the square plumes (discussed in § 4.2.4) deviate from the predictions of the instability analysis, which indicates that there is an AR limit for the validity of these BiGlobal instability predictions.
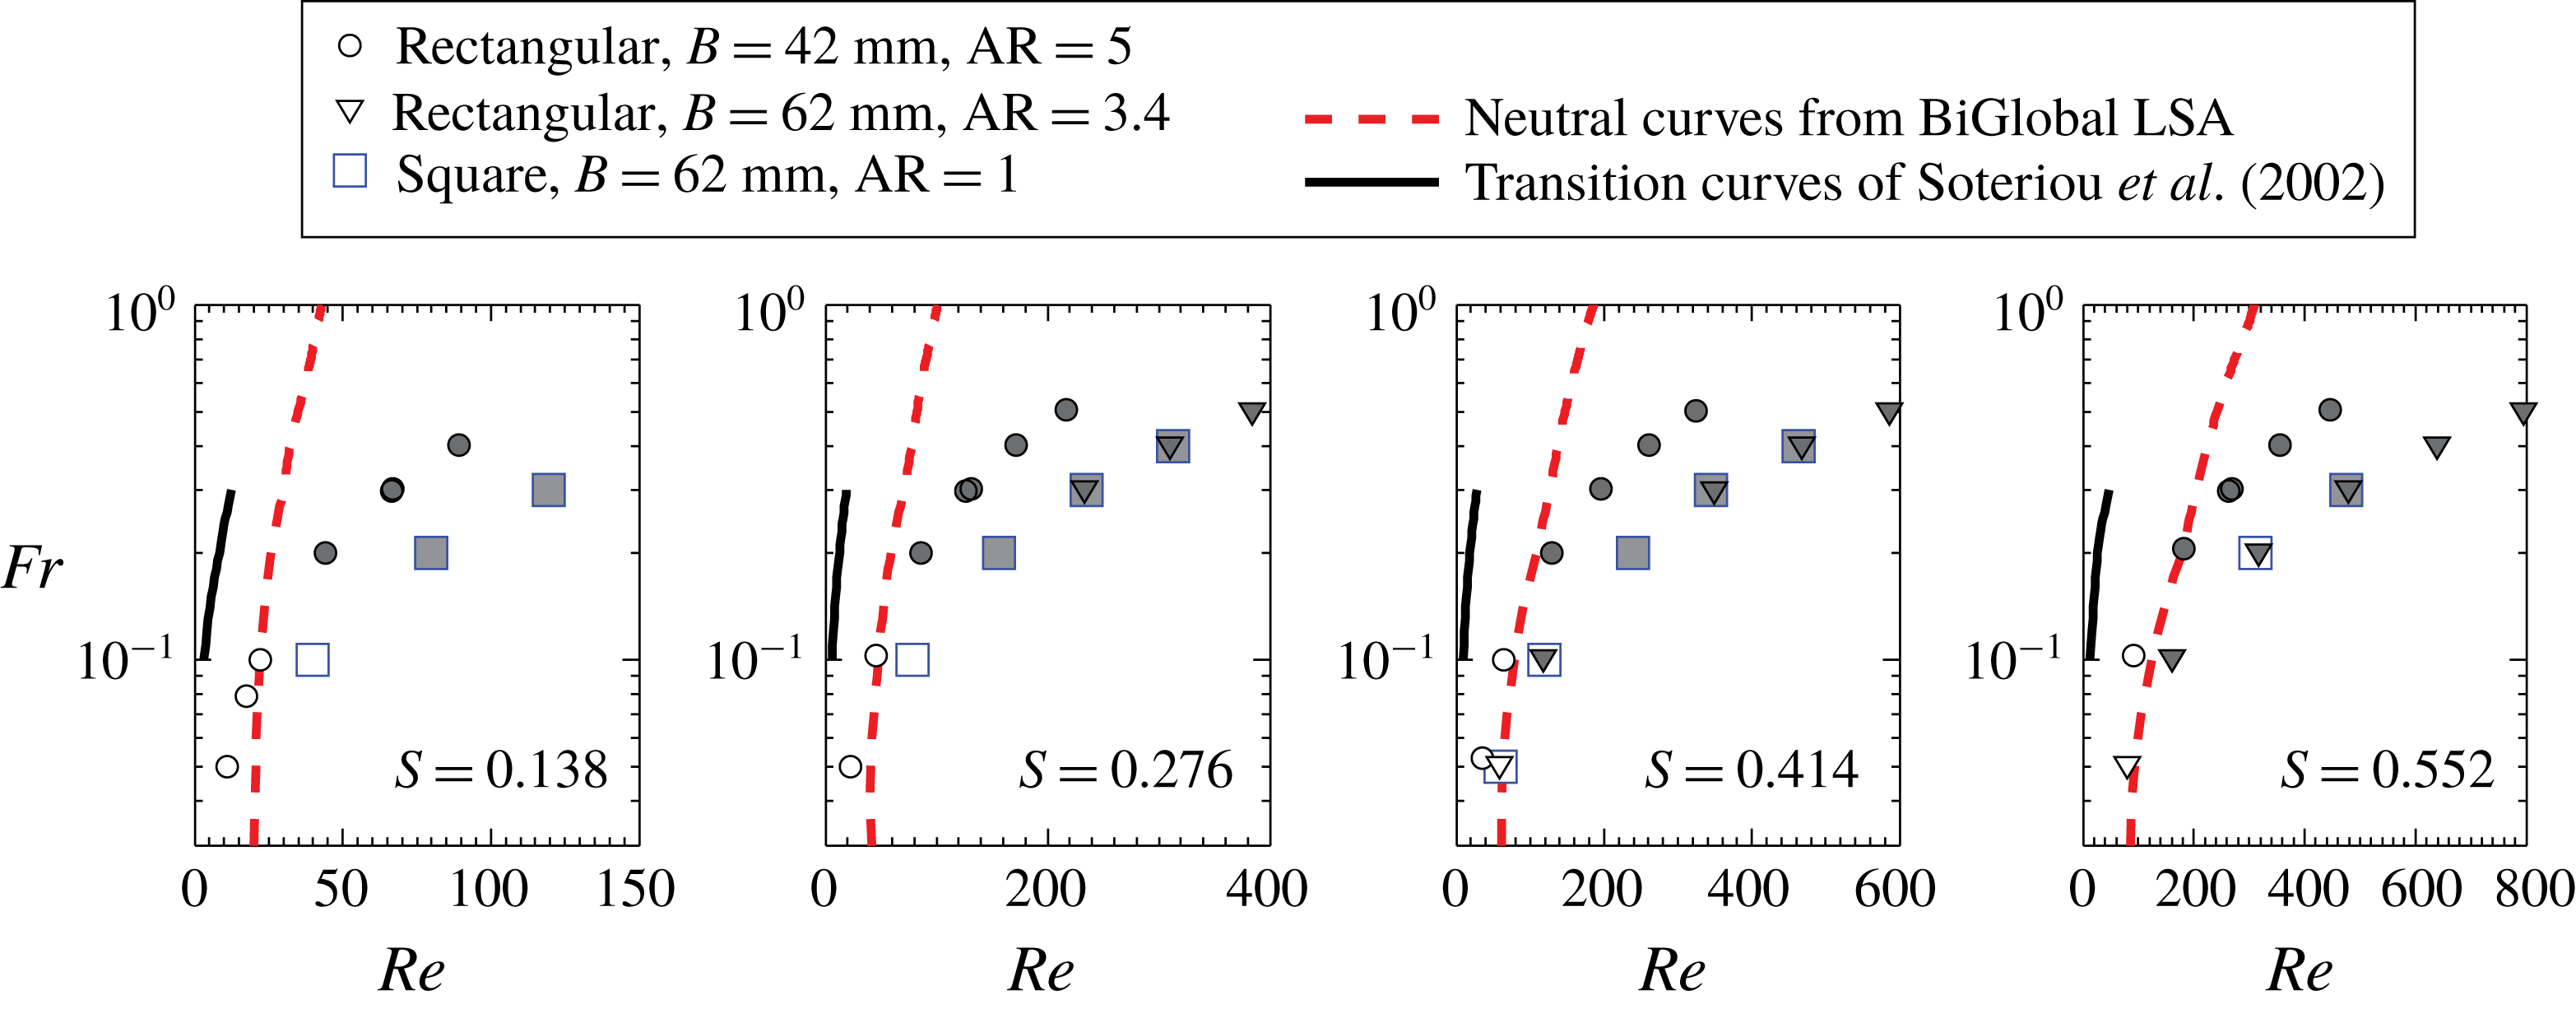
Figure 10. Mapping of plume behaviour on
![]() $Re{-}Fr$
plane for various
$Re{-}Fr$
plane for various
![]() $S$
, for both rectangular and square plumes. The open and filled markers correspond to non-puffing and puffing plumes respectively. The dashed lines are the neutral curves obtained from BiGlobal linear stability analysis with
$S$
, for both rectangular and square plumes. The open and filled markers correspond to non-puffing and puffing plumes respectively. The dashed lines are the neutral curves obtained from BiGlobal linear stability analysis with
![]() $\unicode[STIX]{x1D6FD}=0$
(shown in figure 5). The continuous lines are the transition curves obtained by Soteriou et al. (Reference Soteriou, Dong and Cetegen2002) from their simulations.
$\unicode[STIX]{x1D6FD}=0$
(shown in figure 5). The continuous lines are the transition curves obtained by Soteriou et al. (Reference Soteriou, Dong and Cetegen2002) from their simulations.
Further, we compare our transition curves with those obtained earlier by Soteriou et al. (Reference Soteriou, Dong and Cetegen2002). By performing Lagrangian simulations in planar plumes, Soteriou et al. (Reference Soteriou, Dong and Cetegen2002) obtained transition
![]() $Re$
at which the plumes become puffing based on a transition criterion. The stability boundaries obtained by them in
$Re$
at which the plumes become puffing based on a transition criterion. The stability boundaries obtained by them in
![]() $Fr$
range 0.1–0.3 (extracted from figure 14 of Soteriou et al.
Reference Soteriou, Dong and Cetegen2002) are also presented in figure 10 for comparison. A comparison of their transition curves with that of the present instability analysis and experiments shows that their transition criterion yielded a more conservative estimate of critical
$Fr$
range 0.1–0.3 (extracted from figure 14 of Soteriou et al.
Reference Soteriou, Dong and Cetegen2002) are also presented in figure 10 for comparison. A comparison of their transition curves with that of the present instability analysis and experiments shows that their transition criterion yielded a more conservative estimate of critical
![]() $Re$
at which the planar plumes turn puffing, while the present work reasonably delineates these regions. The reason for this difference between the earlier work of Soteriou et al. (Reference Soteriou, Dong and Cetegen2002) and the present work lies in the transition criterion chosen by them for demarcating non-puffing and puffing regions, which is briefly described here.
$Re$
at which the planar plumes turn puffing, while the present work reasonably delineates these regions. The reason for this difference between the earlier work of Soteriou et al. (Reference Soteriou, Dong and Cetegen2002) and the present work lies in the transition criterion chosen by them for demarcating non-puffing and puffing regions, which is briefly described here.
For a fixed
![]() $Fr$
and
$Fr$
and
![]() $S$
, Soteriou et al. (Reference Soteriou, Dong and Cetegen2002) performed simulations by incrementing
$S$
, Soteriou et al. (Reference Soteriou, Dong and Cetegen2002) performed simulations by incrementing
![]() $Re$
, starting from the lowest possible value (see figure 13 in Soteriou et al.
Reference Soteriou, Dong and Cetegen2002). At each
$Re$
, starting from the lowest possible value (see figure 13 in Soteriou et al.
Reference Soteriou, Dong and Cetegen2002). At each
![]() $Re$
, they tested for unsteadiness at various streamwise locations along the plume column, and considered the plume to be non-puffing as long as the plume column remained steady. As the plume column turned unsteady, they considered the plume to be puffing. However, in figures 8 and 9, we have seen that the unsteadiness in these plumes can arise as a result of asymmetric instability as well. This is also supported by the fact that the initial instability observed in their work is also asymmetric (second and third columns in figure 13 of Soteriou et al.
Reference Soteriou, Dong and Cetegen2002), which arises because of convective instability. Also, in the present experiments, we observed the appearance of asymmetric instability at low flow rates (figure 8
a,b) prior to the occurrence of symmetric puffing mode at high flow rates (figure 8
c,d). Therefore, the transition criterion of Soteriou et al. (Reference Soteriou, Dong and Cetegen2002) yielded a more conservative estimate of critical
$Re$
, they tested for unsteadiness at various streamwise locations along the plume column, and considered the plume to be non-puffing as long as the plume column remained steady. As the plume column turned unsteady, they considered the plume to be puffing. However, in figures 8 and 9, we have seen that the unsteadiness in these plumes can arise as a result of asymmetric instability as well. This is also supported by the fact that the initial instability observed in their work is also asymmetric (second and third columns in figure 13 of Soteriou et al.
Reference Soteriou, Dong and Cetegen2002), which arises because of convective instability. Also, in the present experiments, we observed the appearance of asymmetric instability at low flow rates (figure 8
a,b) prior to the occurrence of symmetric puffing mode at high flow rates (figure 8
c,d). Therefore, the transition criterion of Soteriou et al. (Reference Soteriou, Dong and Cetegen2002) yielded a more conservative estimate of critical
![]() $Re$
. The FFT-based criterion of Sreenivasan et al. (Reference Sreenivasan, Raghu and Kyle1989) followed here seems to be a robust transition criterion to separate the puffing plumes from unsteady non-puffing plumes.
$Re$
. The FFT-based criterion of Sreenivasan et al. (Reference Sreenivasan, Raghu and Kyle1989) followed here seems to be a robust transition criterion to separate the puffing plumes from unsteady non-puffing plumes.
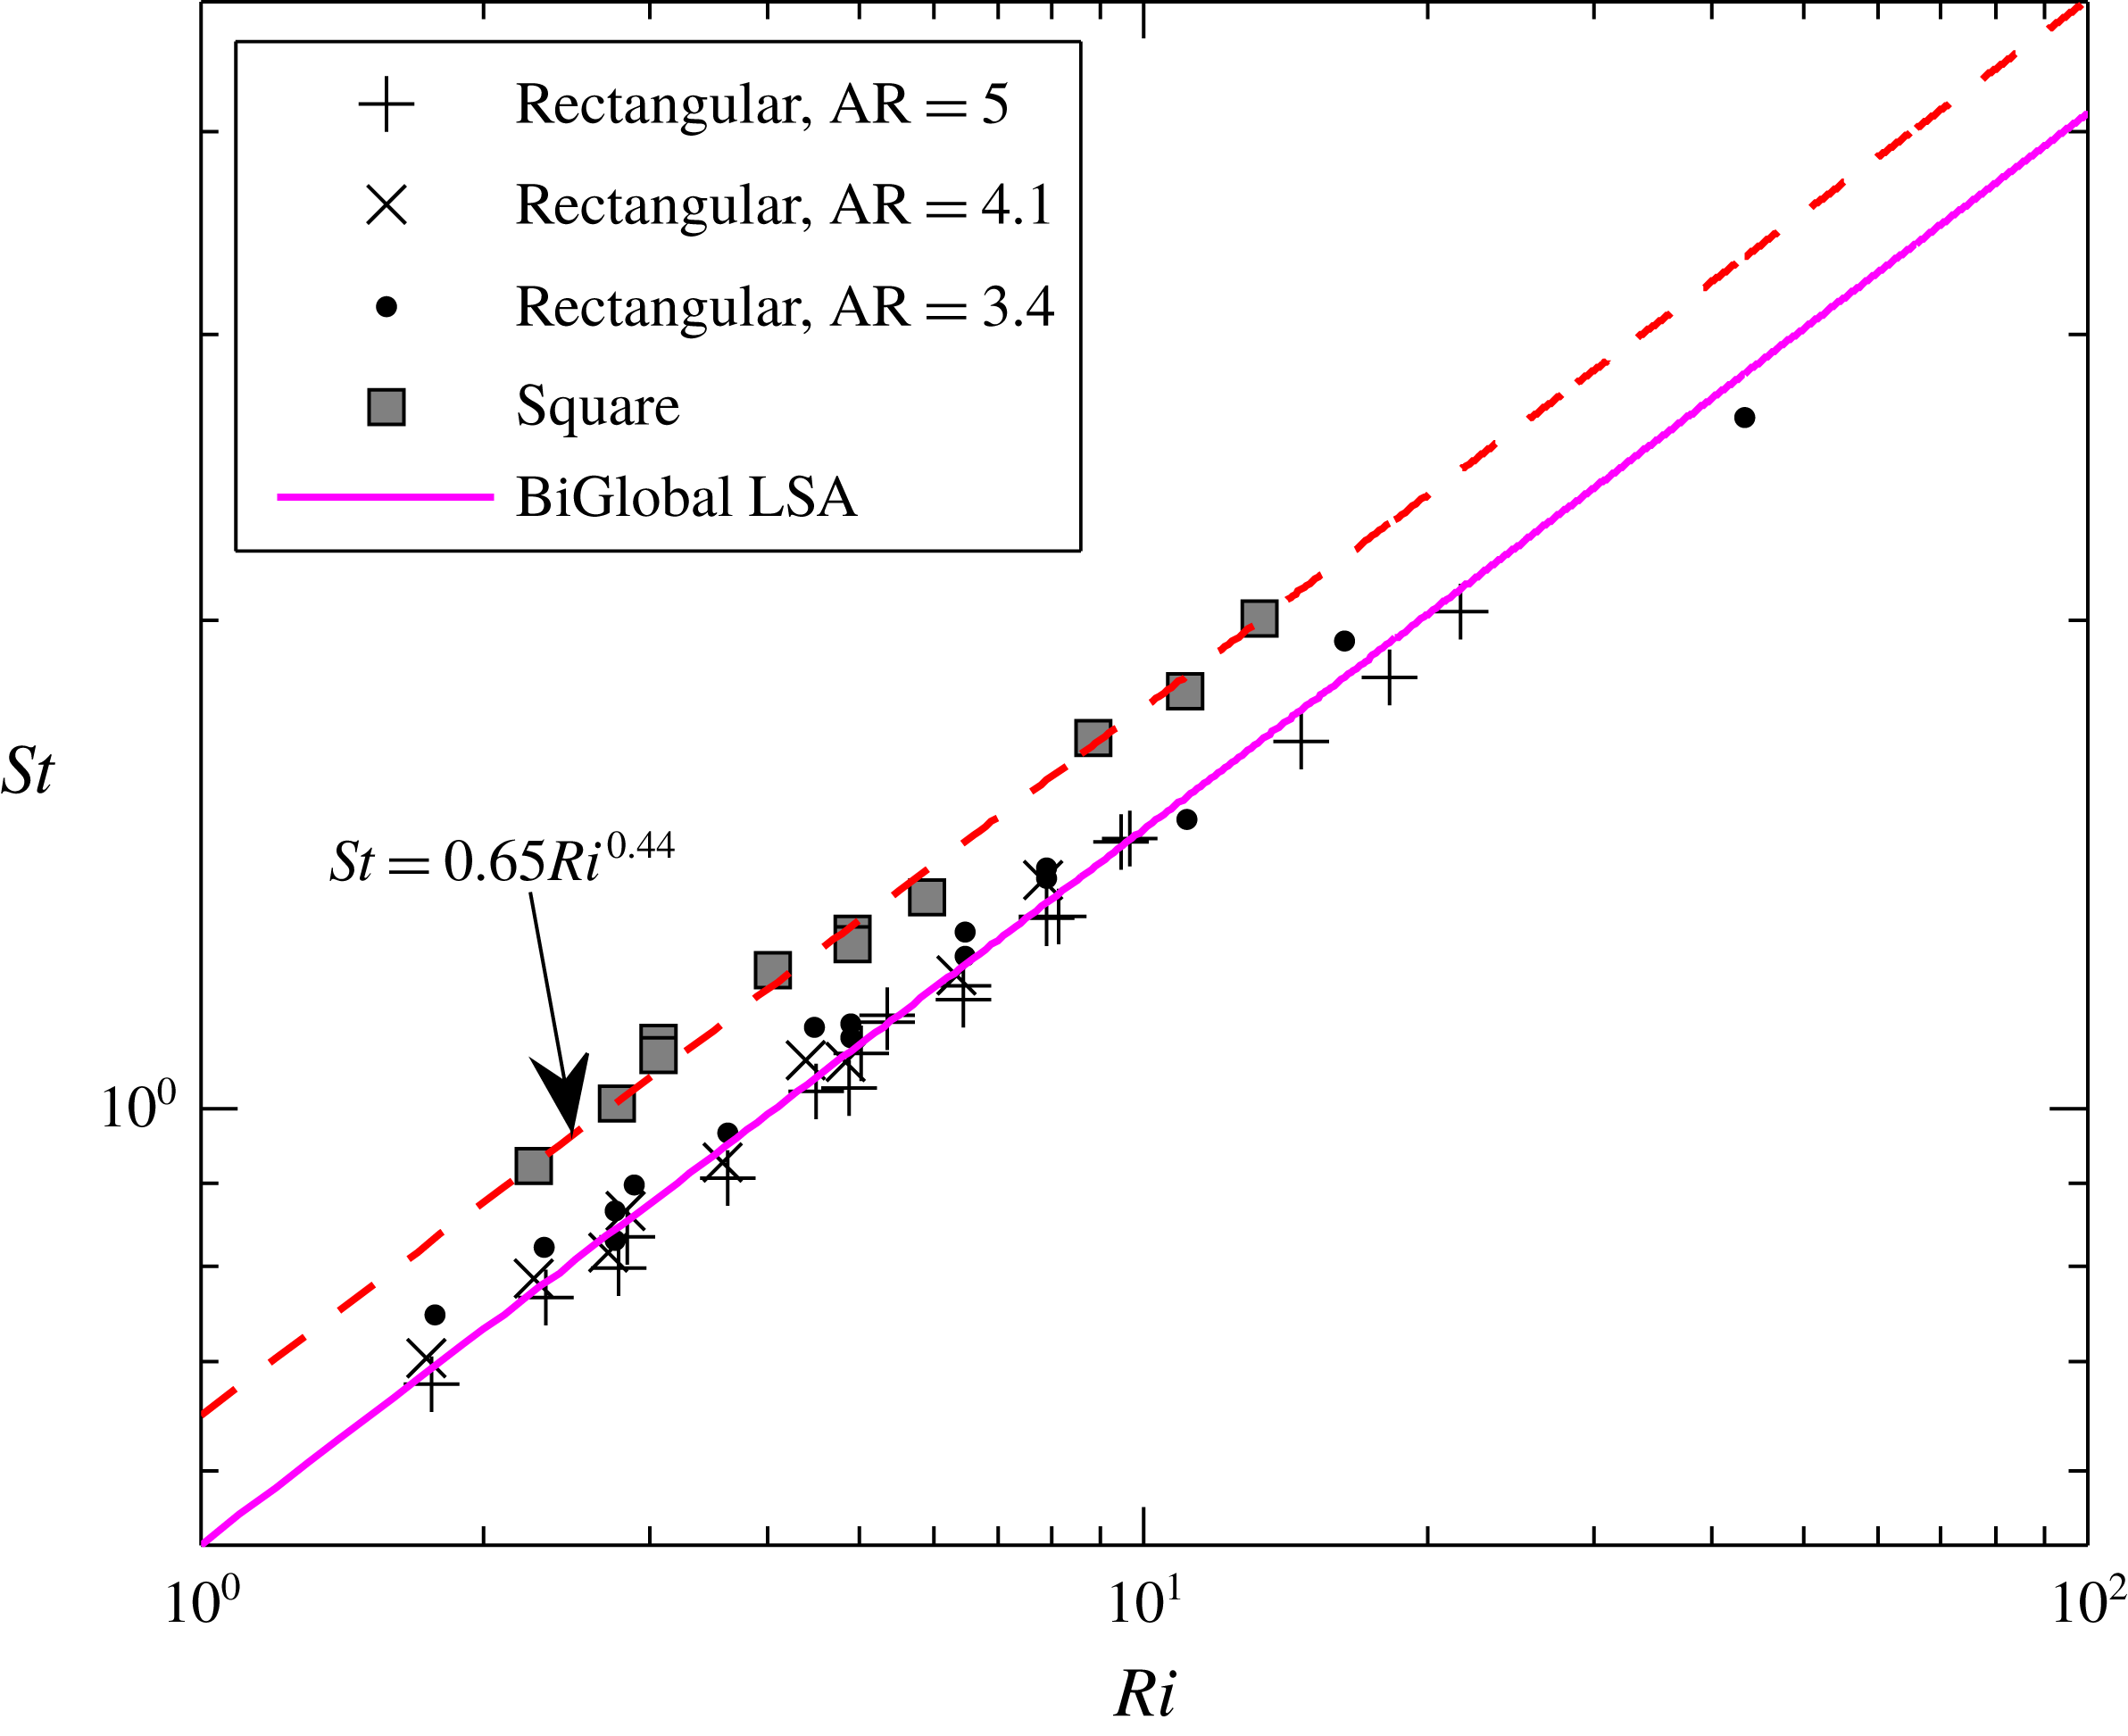
Figure 11. Strouhal number variation with Richardson number for rectangular and square plumes.
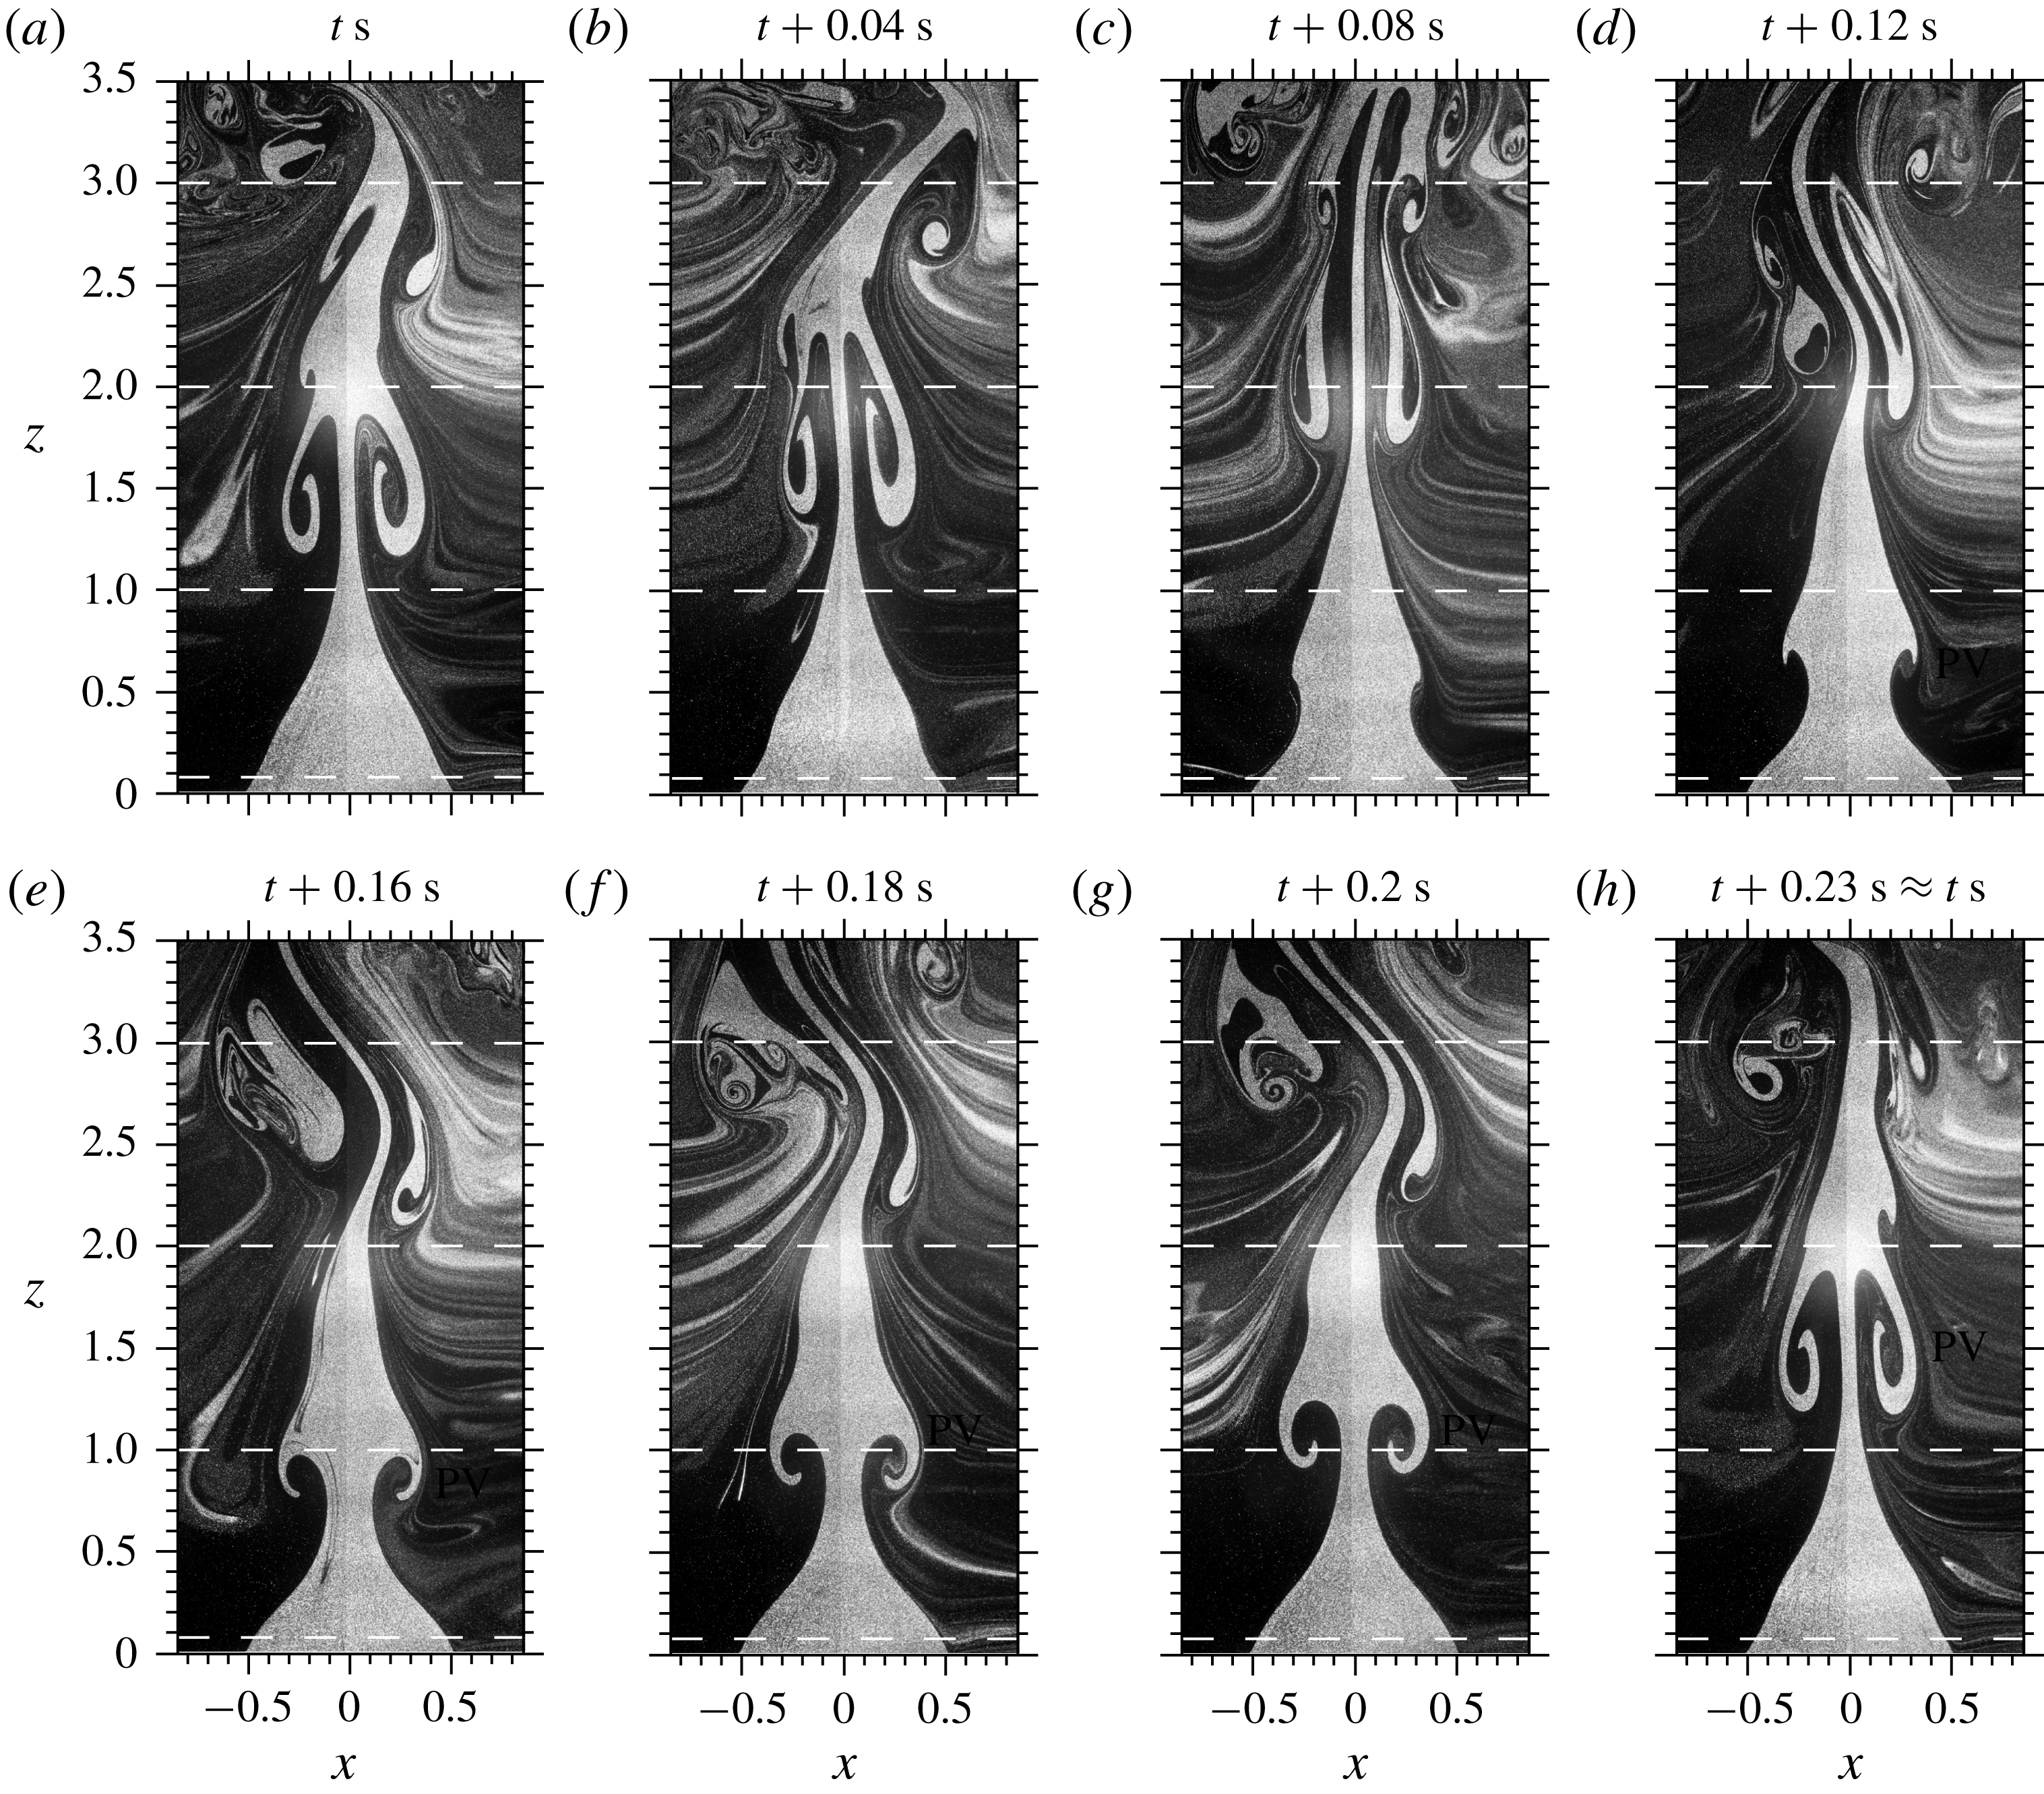
Figure 12. Streamwise visualizations. Evolution of a rectangular plume of
![]() $Re=480$
,
$Re=480$
,
![]() $Fr=0.3$
and
$Fr=0.3$
and
![]() $S=0.553$
, emanating from an orifice of
$S=0.553$
, emanating from an orifice of
![]() $B=62~\text{mm}$
(
$B=62~\text{mm}$
(
![]() $\text{AR}=3.4$
), at various instants during a single puffing cycle. Puffing frequency for this case is 4.3 Hz. The dashed lines correspond to the
$\text{AR}=3.4$
), at various instants during a single puffing cycle. Puffing frequency for this case is 4.3 Hz. The dashed lines correspond to the
![]() $z$
locations at which the spanwise visualizations (figure 13) are performed.
$z$
locations at which the spanwise visualizations (figure 13) are performed.
The puffing frequencies measured for various rectangular plumes are represented as their Strouhal number variation with Richardson number in figure 11. The
![]() $St{-}Ri$
correlation obtained from BiGlobal linear stability analysis, i.e.
$St{-}Ri$
correlation obtained from BiGlobal linear stability analysis, i.e.
![]() $St=0.54Ri^{0.44}$
, is also plotted for comparison. Overall, the rectangular plumes of various ARs closely follow the
$St=0.54Ri^{0.44}$
, is also plotted for comparison. Overall, the rectangular plumes of various ARs closely follow the
![]() $St{-}Ri$
correlation obtained from the BiGlobal stability analysis. However, at a fixed
$St{-}Ri$
correlation obtained from the BiGlobal stability analysis. However, at a fixed
![]() $Ri$
, it can be observed that the Strouhal numbers exhibit a marginal scatter with respect to the plume ARs. For instance, in figure 11, the
$Ri$
, it can be observed that the Strouhal numbers exhibit a marginal scatter with respect to the plume ARs. For instance, in figure 11, the
![]() $St$
values of
$St$
values of
![]() $\text{AR}=3.4$
largely lie above the
$\text{AR}=3.4$
largely lie above the
![]() $St{-}Ri$
correlation of the unstable BiGlobal mode, whereas the
$St{-}Ri$
correlation of the unstable BiGlobal mode, whereas the
![]() $St$
values of
$St$
values of
![]() $\text{AR}=5$
lie below it. Also, this scatter can be prominently observed at low Richardson numbers. Thereby, rectangular plumes exhibit a weaker dependence on AR.
$\text{AR}=5$
lie below it. Also, this scatter can be prominently observed at low Richardson numbers. Thereby, rectangular plumes exhibit a weaker dependence on AR.
Overall, the global dynamics of rectangular plumes is in reasonable agreement with that of the BiGlobal instability predictions, which are obtained assuming these plumes to be 2D in nature. This shows that the puffing dynamics in rectangular plumes largely remains 2D even at such low ARs. To further verify this inference, we performed both streamwise and spanwise flow visualizations (figure 2) in puffing rectangular plumes to examine their three-dimensionality. These measurements are performed in a phase-resolved manner to resolve various time instants during a puffing cycle, as explained in § 3. The streamwise visualizations assist in identifying the flow features observed in spanwise visualizations (e.g. puffing vortex (PV), central stem (CS), etc.).
4.2.3 Three-dimensionality: phase-locked streamwise and spanwise visualizations
Figure 12(a–h) shows the streamwise evolution of a typical puffing rectangular plume in the
![]() $x{-}z$
plane at various time instants during a single puffing cycle. Figure 13(a–h) shows the corresponding spanwise visualizations in the
$x{-}z$
plane at various time instants during a single puffing cycle. Figure 13(a–h) shows the corresponding spanwise visualizations in the
![]() $x{-}y$
plane, at four different heights (i.e.
$x{-}y$
plane, at four different heights (i.e.
![]() $z=0.08$
, 1, 2 and 3). The position of PV in figure 13 has been identified by correlating it with figure 12. The spanwise visualizations show that the flow remains uniform near the plume inlet at all time instants of a puffing cycle, as observed at
$z=0.08$
, 1, 2 and 3). The position of PV in figure 13 has been identified by correlating it with figure 12. The spanwise visualizations show that the flow remains uniform near the plume inlet at all time instants of a puffing cycle, as observed at
![]() $z=0.08$
in figure 13. As the plume fluid convects downstream, two phenomena occur. First, the global instability leads to the periodic formation of spanwise vortex pair as discussed earlier and leads to puffing (marked as PV in figures 12 and 13). Second, the distortion of shear layer at the corners (marked as D in figure 13) leads to the formation of four streamwise vortices, aligned with the corners (shown as corner vortices (CVs) in figure 13). These CVs are also observed in non-puffing steady laminar plumes, demonstrated here in figure 14 for a laminar rectangular plume of
$z=0.08$
in figure 13. As the plume fluid convects downstream, two phenomena occur. First, the global instability leads to the periodic formation of spanwise vortex pair as discussed earlier and leads to puffing (marked as PV in figures 12 and 13). Second, the distortion of shear layer at the corners (marked as D in figure 13) leads to the formation of four streamwise vortices, aligned with the corners (shown as corner vortices (CVs) in figure 13). These CVs are also observed in non-puffing steady laminar plumes, demonstrated here in figure 14 for a laminar rectangular plume of
![]() $\text{AR}=10$
. This implies that these vortices are not related to the global instability in plumes.
$\text{AR}=10$
. This implies that these vortices are not related to the global instability in plumes.
In constant-density jets ejecting from rectangular orifices and ducts, the formation of CVs had been widely reported in earlier works (Quinn Reference Quinn1992; Zaman Reference Zaman1996; Gutmark & Grinstein Reference Gutmark and Grinstein1999; Sau Reference Sau1999, Reference Sau2002). They concluded that these streamwise vortices represent the Prandtl secondary flow of first kind that occurs due to unequal flow acceleration and resulting shear layer distortion nearer to the corners. In orifice-generated homogeneous jets, this secondary flow occurs as a result of flow acceleration because of vena-contracta (Quinn Reference Quinn1992). A secondary flow phenomenon, similar to that observed in orifice-generated constant-density jets, occurs in the present case as a result of buoyancy, which leads to the formation of these CVs. This phenomenon will be briefly described below.
As the plume fluid ejects out into the atmosphere, it undergoes a lateral contraction due to buoyant acceleration as observed at all time instants in figure 12. However, the buoyant acceleration, and thereby the lateral contraction, is not uniform over the entire span as observed from spanwise visualizations at
![]() $z=0.08$
in figure 13. The plume fluid near the shorter edges accelerates more slowly than the plume fluid at the centre. This is evident from spanwise visualizations at
$z=0.08$
in figure 13. The plume fluid near the shorter edges accelerates more slowly than the plume fluid at the centre. This is evident from spanwise visualizations at
![]() $z=0.08$
in figure 13 in which the plume fluid converges laterally all along the span, while it remains intact near the shorter edges, on either extremes of the span. This unequal acceleration of plume fluid results in the distortion/skewing (D) of the shear layer near the corners as highlighted at
$z=0.08$
in figure 13 in which the plume fluid converges laterally all along the span, while it remains intact near the shorter edges, on either extremes of the span. This unequal acceleration of plume fluid results in the distortion/skewing (D) of the shear layer near the corners as highlighted at
![]() $z=0.08$
in figure 13(d), which results in the generation of streamwise vorticity at the corners. Further downstream, this skewed shear layer at four corners rolls up into four streamwise vortices aligned with plume corners, similar to that observed by Zaman (Reference Zaman1996) and Sau (Reference Sau1999) in the case of free rectangular jets. Thus, it can be inferred that the CVs correspond to the secondary flow superposed over the primary plume flow because of the presence of corners. Zaman (Reference Zaman1996) had shown that the orientation of these CVs influences the downstream development of the jet by promoting or resisting the axis-switching phenomenon, observed in non-circular jets (Gutmark & Grinstein Reference Gutmark and Grinstein1999). In the present buoyant plumes, the CVs formed are of ‘outflow’ type as shown at
$z=0.08$
in figure 13(d), which results in the generation of streamwise vorticity at the corners. Further downstream, this skewed shear layer at four corners rolls up into four streamwise vortices aligned with plume corners, similar to that observed by Zaman (Reference Zaman1996) and Sau (Reference Sau1999) in the case of free rectangular jets. Thus, it can be inferred that the CVs correspond to the secondary flow superposed over the primary plume flow because of the presence of corners. Zaman (Reference Zaman1996) had shown that the orientation of these CVs influences the downstream development of the jet by promoting or resisting the axis-switching phenomenon, observed in non-circular jets (Gutmark & Grinstein Reference Gutmark and Grinstein1999). In the present buoyant plumes, the CVs formed are of ‘outflow’ type as shown at
![]() $z=1$
in figure 13(d), exactly similar to that observed by Zaman (Reference Zaman1996) in the case of free rectangular homogeneous jets. In this ‘outflow’ configuration, the two CV pairs located at either side of the span tend to elongate the plume cross-section along the span as shown at
$z=1$
in figure 13(d), exactly similar to that observed by Zaman (Reference Zaman1996) in the case of free rectangular homogeneous jets. In this ‘outflow’ configuration, the two CV pairs located at either side of the span tend to elongate the plume cross-section along the span as shown at
![]() $z=1$
in figure 13(d), thus resisting the axis-switching of plume cross-section in buoyant plumes. Therefore, no axis-switching phenomenon has been observed in the present buoyant plumes.
$z=1$
in figure 13(d), thus resisting the axis-switching of plume cross-section in buoyant plumes. Therefore, no axis-switching phenomenon has been observed in the present buoyant plumes.

Figure 14. Spanwise visualization of a non-puffing steady plume of
![]() $\text{AR}=10$
at two arbitrary time instants (a,b). The visualizations show the presence of CVs even in the absence of puffing.
$\text{AR}=10$
at two arbitrary time instants (a,b). The visualizations show the presence of CVs even in the absence of puffing.
Now, we revert back to our inference drawn previously in § 4.2.2 regarding puffing dynamics in rectangular plumes. In spite of smaller ARs, we had observed in the previous section that the puffing frequencies and plume transition in rectangular plumes are in good agreement with those obtained from BiGlobal instability analysis with
![]() $\unicode[STIX]{x1D6FD}=0$
. The spanwise visualizations of puffing plumes in the near field, i.e.
$\unicode[STIX]{x1D6FD}=0$
. The spanwise visualizations of puffing plumes in the near field, i.e.
![]() $z\leqslant 1$
in figure 13, show that, barring secondary flow, the plume CS and the PVs indeed remain largely 2D without any spanwise variations. This 2D nature CS and PV is more pronounced for higher AR plumes. This shows that puffing is 2D in a rectangular plume, even at such low AR. However, further downstream, the spanwise undulations develop along the plume stem as observed at
$z\leqslant 1$
in figure 13, show that, barring secondary flow, the plume CS and the PVs indeed remain largely 2D without any spanwise variations. This 2D nature CS and PV is more pronounced for higher AR plumes. This shows that puffing is 2D in a rectangular plume, even at such low AR. However, further downstream, the spanwise undulations develop along the plume stem as observed at
![]() $z=2$
in figure 13, which leads to a rapid breakdown of plume fluid and transition to turbulence.
$z=2$
in figure 13, which leads to a rapid breakdown of plume fluid and transition to turbulence.
Up to now, we have investigated the puffing behaviour in rectangular plumes of
![]() $\text{AR}\geqslant 3$
. These plumes exhibited a weaker dependence on the ARs. Next, we consider the effect of a further decrease in AR by investigating the puffing dynamics in square plumes, i.e.
$\text{AR}\geqslant 3$
. These plumes exhibited a weaker dependence on the ARs. Next, we consider the effect of a further decrease in AR by investigating the puffing dynamics in square plumes, i.e.
![]() $\text{AR}=1$
.
$\text{AR}=1$
.
4.2.4 Square plumes
Experiments are performed using a square orifice of dimensions
![]() $B=L=62~\text{mm}$
, at four density ratios
$B=L=62~\text{mm}$
, at four density ratios
![]() $S=0.138$
, 0.276, 0.414 and 0.552, by systematically increasing the plume inlet velocity at each density ratio, similar to that performed in the case of rectangular plumes. These square plumes are categorized into non-puffing and puffing states based on temporal flow visualizations and FFT approach as explained in § 4.2.1, and the resulting plume states are presented in figure 10 along with rectangular plumes. Also, the Strouhal numbers of the puffing square plumes are presented in figure 11.
$S=0.138$
, 0.276, 0.414 and 0.552, by systematically increasing the plume inlet velocity at each density ratio, similar to that performed in the case of rectangular plumes. These square plumes are categorized into non-puffing and puffing states based on temporal flow visualizations and FFT approach as explained in § 4.2.1, and the resulting plume states are presented in figure 10 along with rectangular plumes. Also, the Strouhal numbers of the puffing square plumes are presented in figure 11.
Overall, it is observed that the puffing dynamics in square plumes differs from that in 2D or rectangular plumes. Figure 10 shows that square plumes are more stable than 2D/rectangular plumes, i.e. puffing tends to initiate in square plumes at higher critical
![]() $Re$
when compared to 2D/rectangular plumes. Also, for a fixed
$Re$
when compared to 2D/rectangular plumes. Also, for a fixed
![]() $Ri$
, the puffing Strouhal number in a square plume is higher than that in a 2D/rectangular plume. The puffing frequencies in square plumes correlate as
$Ri$
, the puffing Strouhal number in a square plume is higher than that in a 2D/rectangular plume. The puffing frequencies in square plumes correlate as
![]() $St=0.65Ri^{0.44}$
as shown in figure 11. It is interesting to note that the power-law exponent for square plumes is same as that for the rectangular plumes, i.e.
$St=0.65Ri^{0.44}$
as shown in figure 11. It is interesting to note that the power-law exponent for square plumes is same as that for the rectangular plumes, i.e.
![]() $St\propto Ri^{0.44}$
. However, the proportionality constant is higher for square plumes. We further highlight the differences observed between rectangular and square plumes in both non-puffing and puffing regimes.
$St\propto Ri^{0.44}$
. However, the proportionality constant is higher for square plumes. We further highlight the differences observed between rectangular and square plumes in both non-puffing and puffing regimes.
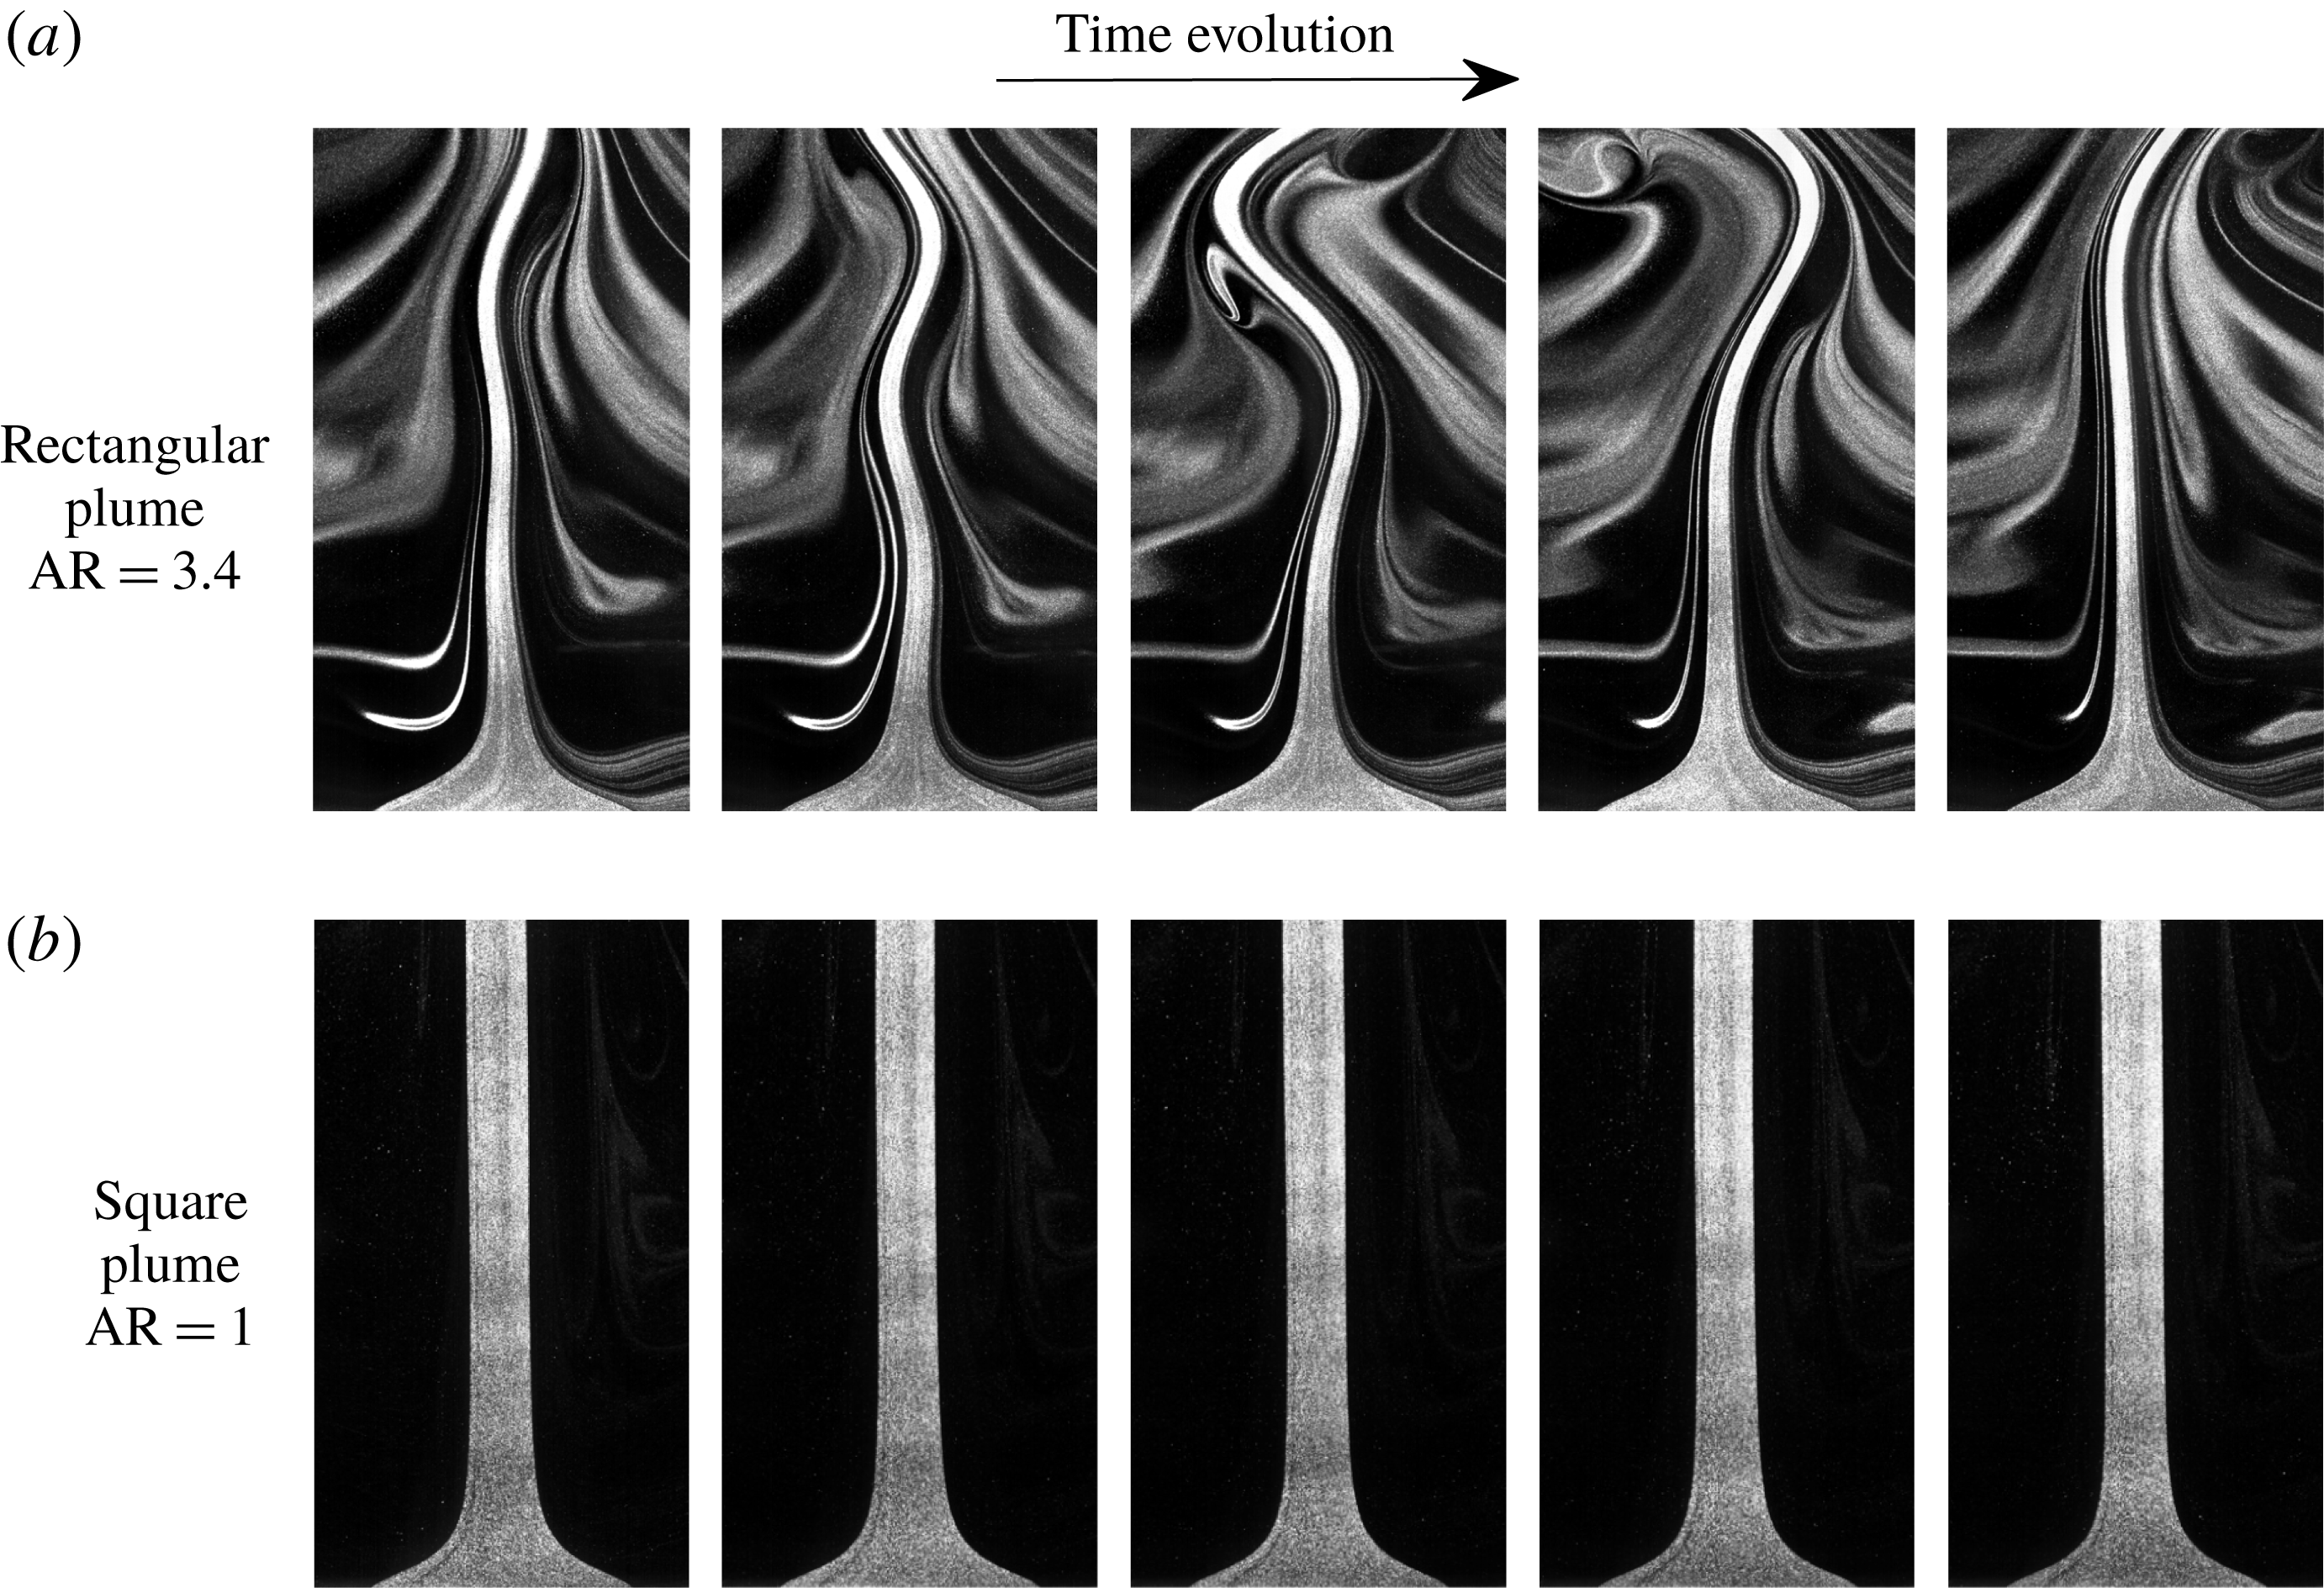
Figure 15. Flow field in non-puffing (a) rectangular and (b) square plumes of
![]() $Re=60$
,
$Re=60$
,
![]() $Fr=0.05$
and
$Fr=0.05$
and
![]() $S=0.414$
.
$S=0.414$
.
Figure 15 compares the flow field of a non-puffing rectangular (
![]() $\text{AR}=3.4$
) and square plume with similar inlet conditions, i.e. same (
$\text{AR}=3.4$
) and square plume with similar inlet conditions, i.e. same (
![]() $Re$
,
$Re$
,
![]() $Fr$
,
$Fr$
,
![]() $S$
). From the time evolution of these plumes, it can be observed that the rectangular plumes undergo asymmetric instability as observed in figure 15(a) and as discussed earlier in § 4.2.1. Whereas, the square plumes remain stable even in the far field as observed from their time evolution in figure 15(b). The far field asymmetric convective instability observed in rectangular plumes disappears as
$S$
). From the time evolution of these plumes, it can be observed that the rectangular plumes undergo asymmetric instability as observed in figure 15(a) and as discussed earlier in § 4.2.1. Whereas, the square plumes remain stable even in the far field as observed from their time evolution in figure 15(b). The far field asymmetric convective instability observed in rectangular plumes disappears as
![]() $\text{AR}\rightarrow 1$
.
$\text{AR}\rightarrow 1$
.
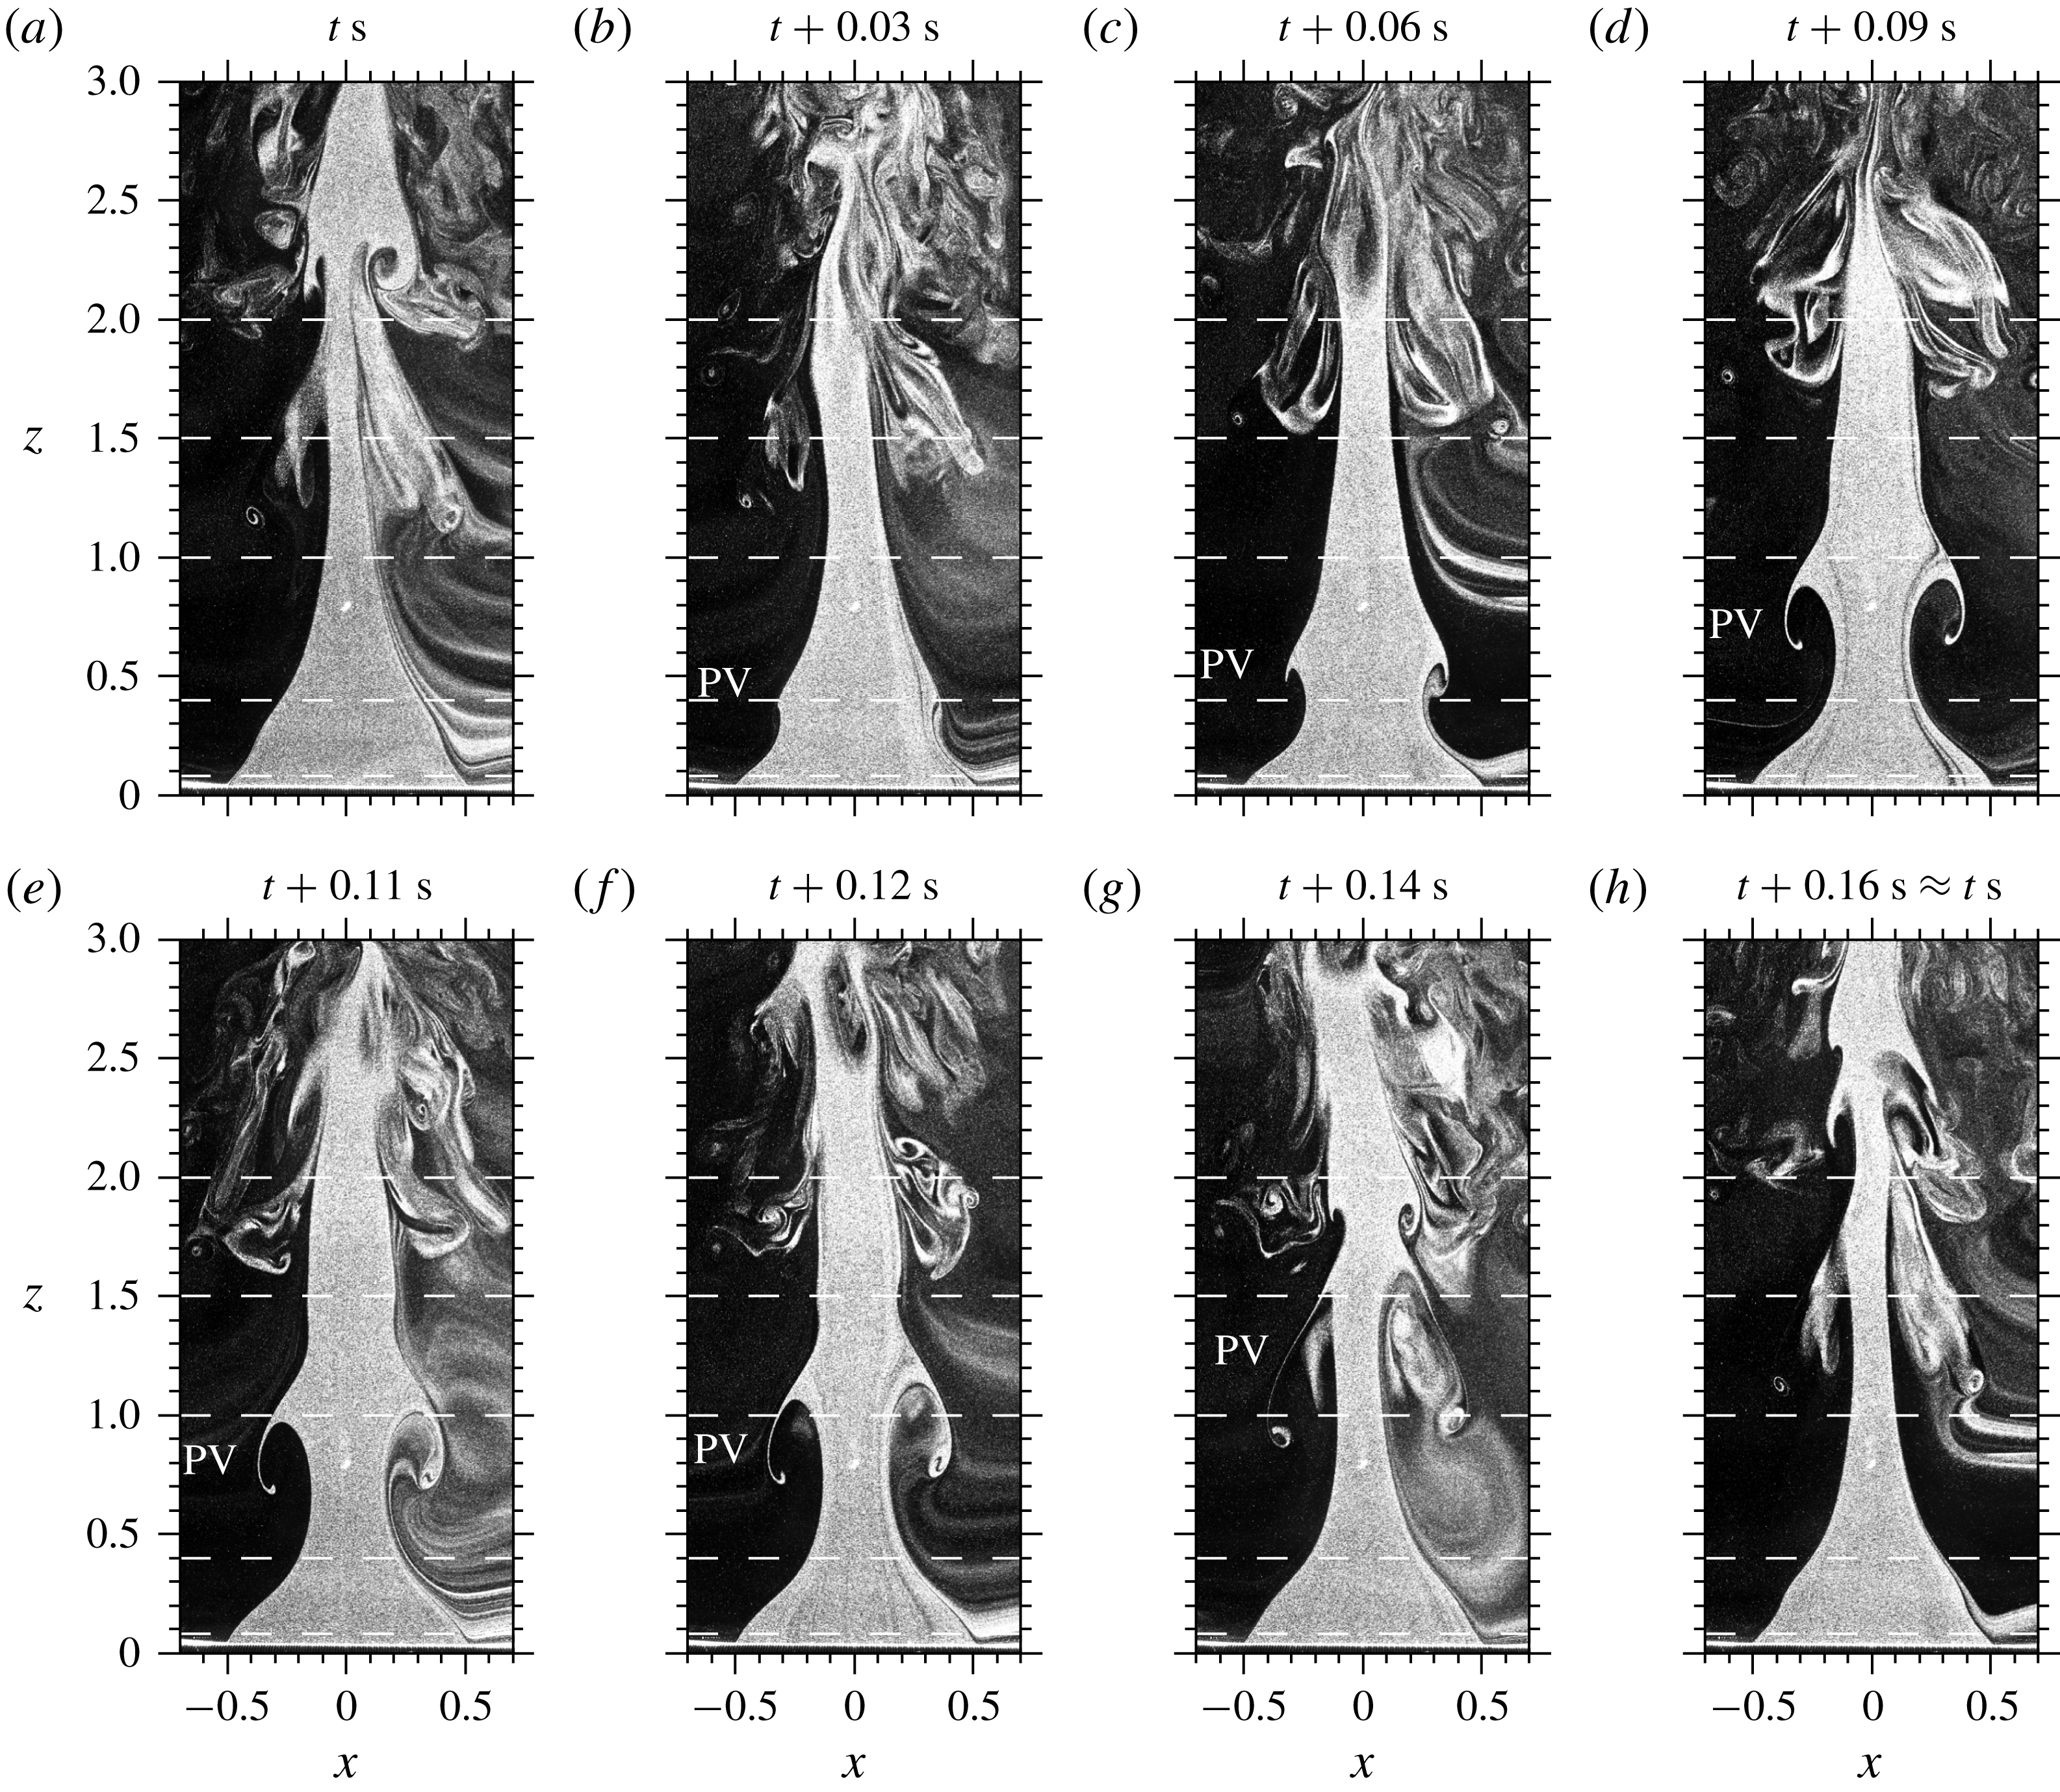
Figure 16. Streamwise visualizations. Evolution of a square plume of
![]() $Re=235$
,
$Re=235$
,
![]() $Fr=0.3$
and
$Fr=0.3$
and
![]() $S=0.28$
, emanating from an orifice of width
$S=0.28$
, emanating from an orifice of width
![]() $B=62~\text{mm}$
, at various instants during a single puffing cycle. Puffing frequency for this case is 6.2 Hz. The dashed lines correspond to
$B=62~\text{mm}$
, at various instants during a single puffing cycle. Puffing frequency for this case is 6.2 Hz. The dashed lines correspond to
![]() $z$
locations at which the spanwise visualizations (figure 17) are performed.
$z$
locations at which the spanwise visualizations (figure 17) are performed.
Further, we compare the PV of a square plume with that of a rectangular plume and attempt to explain the reason for higher Strouhal numbers observed in square plumes. Figure 16 shows the streamwise visualizations of a puffing square plume at various time instants during a single puffing cycle. The corresponding spanwise visualizations performed at various heights are shown in figure 17. It is evident from the spanwise visualizations that the structure of the PV (shown in figures 16 and 17) is highly 3D, whereas a PV in rectangular plumes remains largely 2D as seen earlier in figure 13. Cetegen & Ahmed (Reference Cetegen and Ahmed1993) investigated the puffing mechanism in circular plumes by introducing various mechanisms that prevent the formed PV from interacting with the plume fluid nearer to the source. From their experiments, they proposed that the puffing frequencies are strongly coupled with the downstream development of the PV. They observed that the perturbations introduced by the downstream convecting PV act as source of instability to the plume fluid nearer to the source, which result in the formation of the next PV. That is, the induction and convection of the formed PV provide the coupling to sustain these periodic oscillations. Therefore, we attribute the difference observed in puffing frequency correlations of square and rectangular plumes to their PV dynamics. We conjecture that the 3D structure and dynamics of PVs in square plumes might have resulted in an increase in their puffing frequencies compared to those of the rectangular plumes.
Additionally, the flow field in square plumes is dominated by four corner vortex pairs (as shown in figure 17) similar to that observed in momentum-dominated homogeneous square jets (Quinn Reference Quinn1992; Gutmark & Grinstein Reference Gutmark and Grinstein1999).
4.3 Strouhal number similarity at low ARs
In § 4.2.2, we observed that the puffing Strouhal numbers in rectangular plumes exhibited a weaker dependence on plume inlet AR. This dependence on AR grew stronger with a further decrease in its value to
![]() $\text{AR}=1$
, where the square plumes exhibited higher Strouhal numbers than the rectangular plumes, which correlated as
$\text{AR}=1$
, where the square plumes exhibited higher Strouhal numbers than the rectangular plumes, which correlated as
![]() $St=0.65Ri^{0.44}$
. Also, the puffing dynamics undergoes a change in range of
$St=0.65Ri^{0.44}$
. Also, the puffing dynamics undergoes a change in range of
![]() $3\geqslant \text{AR}\geqslant 1$
as the PV changes from near 2D to 3D as seen from figures 13 and 17. These observations clearly suggest that the puffing Strouhal numbers exhibit a dependence on the AR, at such low AR.
$3\geqslant \text{AR}\geqslant 1$
as the PV changes from near 2D to 3D as seen from figures 13 and 17. These observations clearly suggest that the puffing Strouhal numbers exhibit a dependence on the AR, at such low AR.
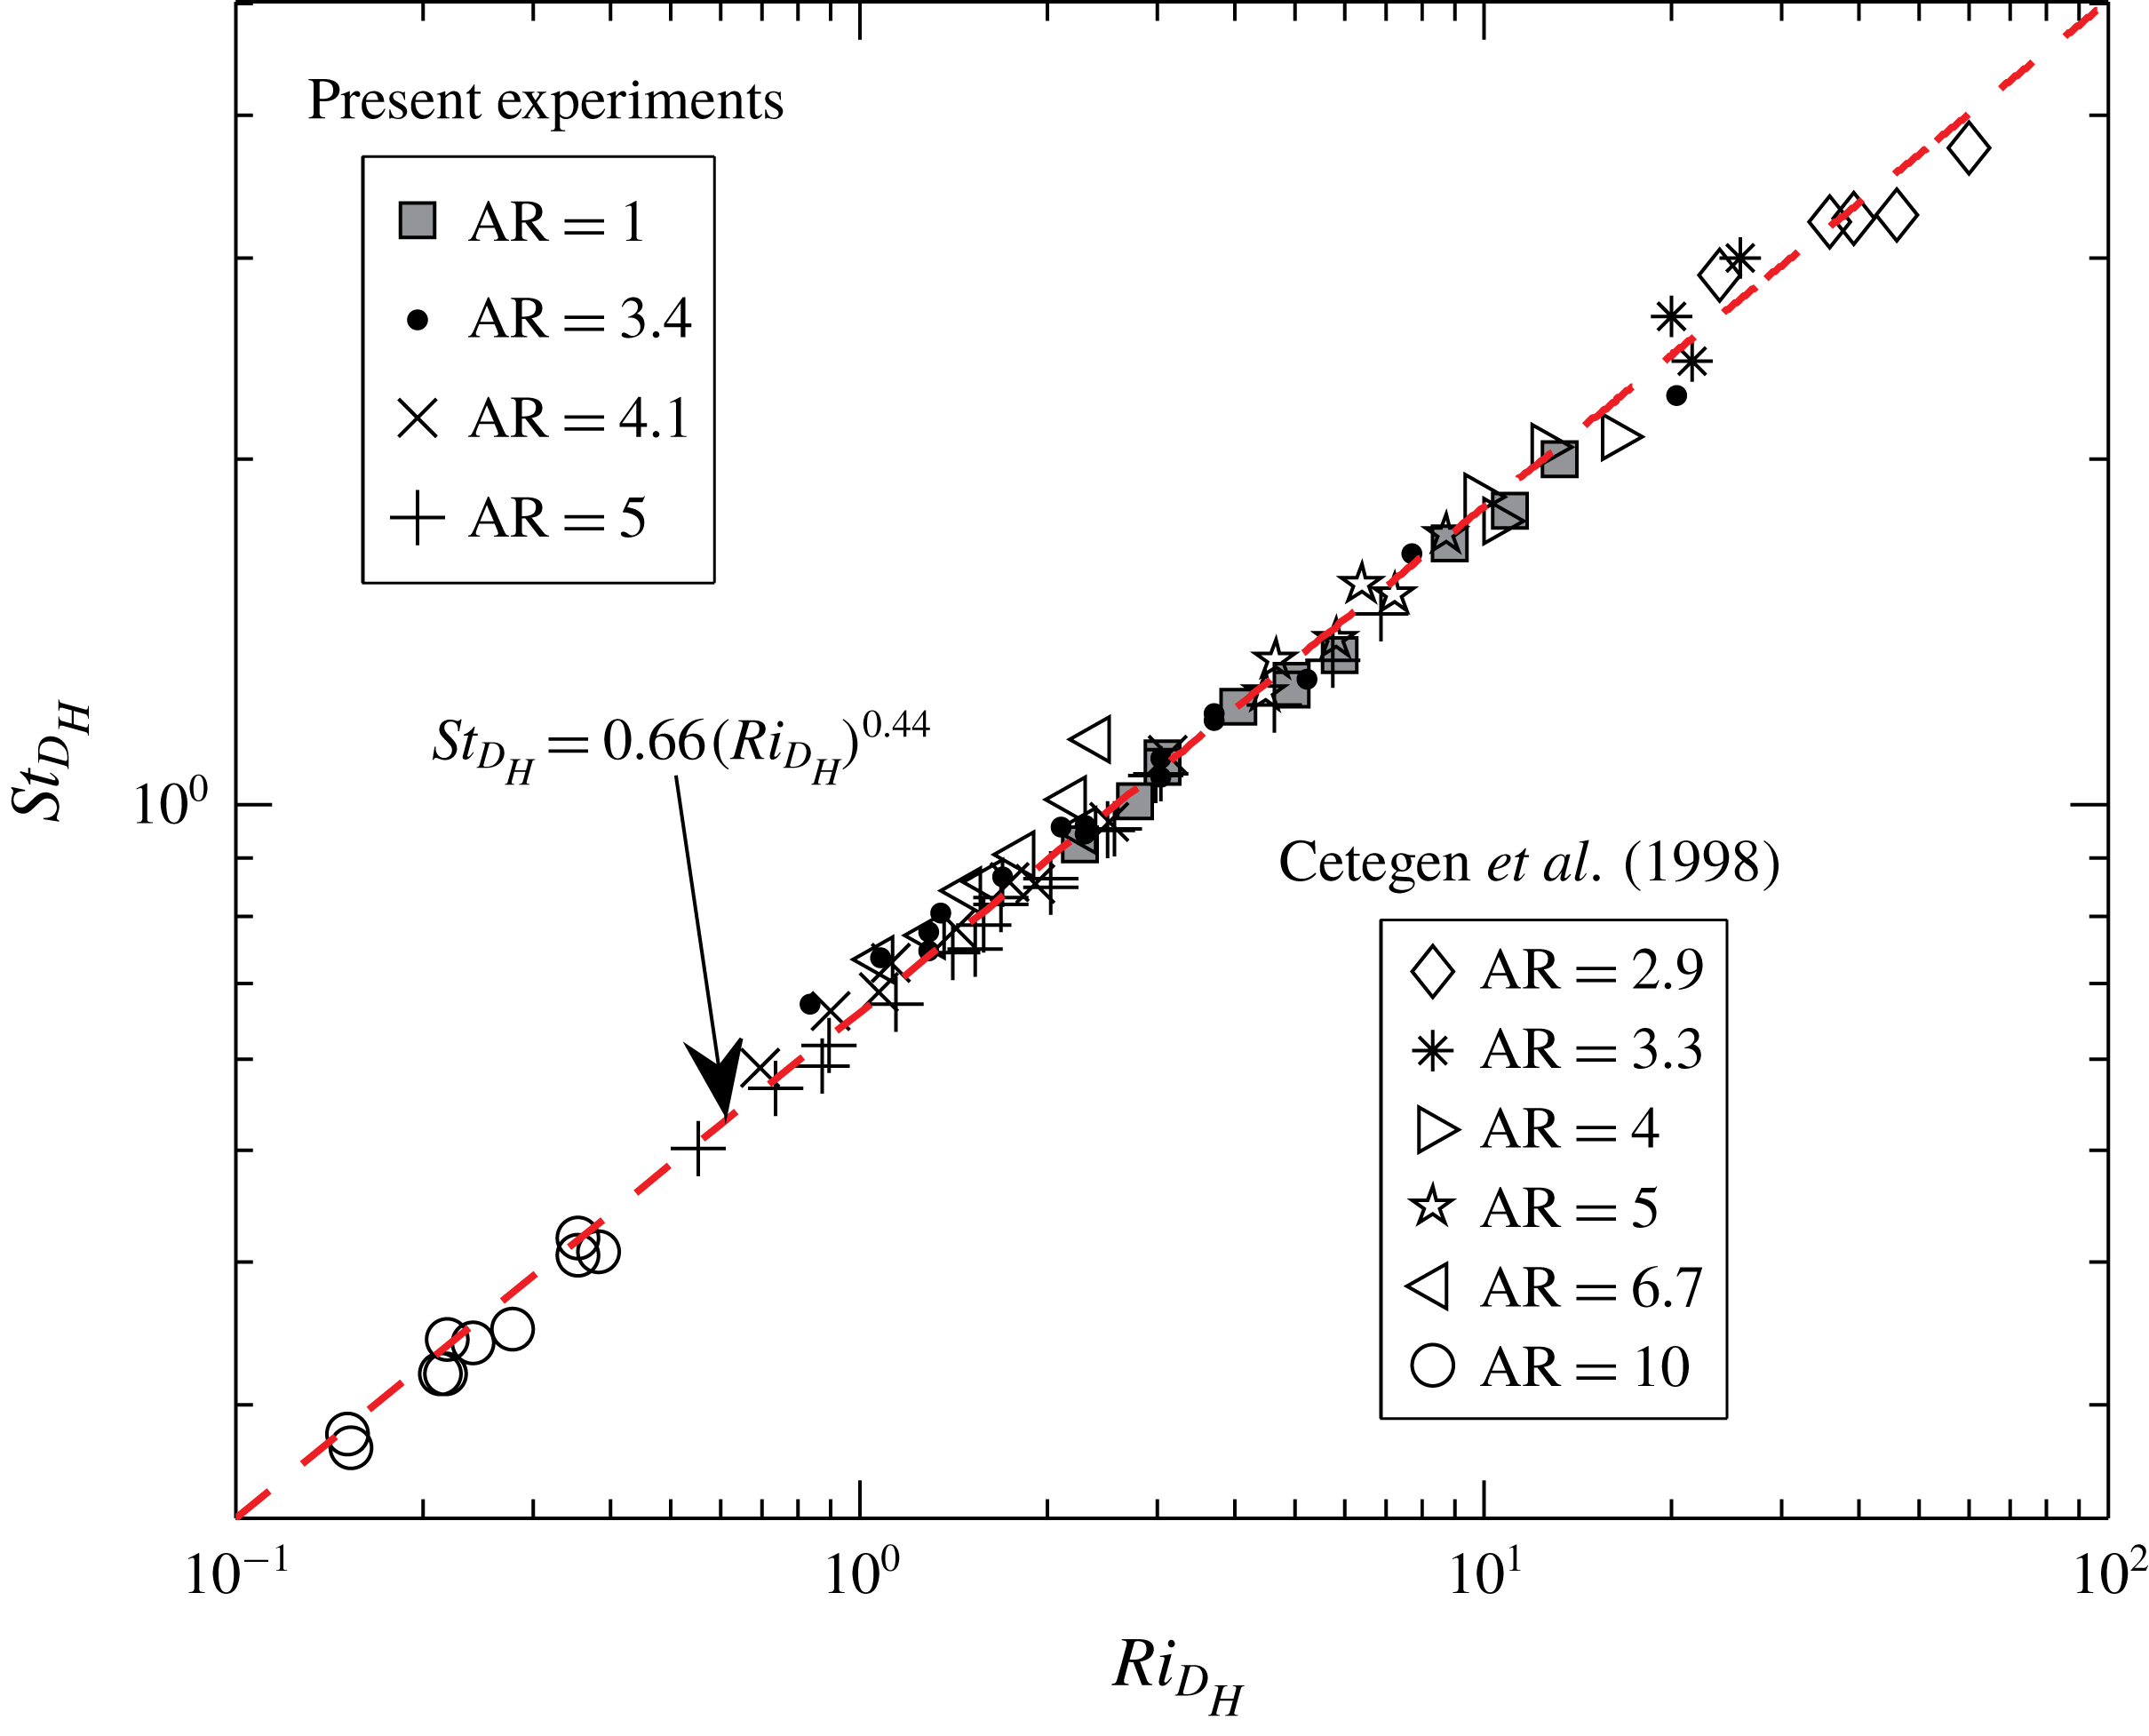
Figure 18. Puffing frequency similarity for low-AR plumes in the range 1–10.
However, it has been observed that this Strouhal number dependence on AR can be eliminated by using the hydraulic diameter (
![]() $D_{H}$
) and its equivalent velocity (
$D_{H}$
) and its equivalent velocity (
![]() $w_{H}=Q/(\unicode[STIX]{x03C0}D_{H}^{2}/4)$
, where
$w_{H}=Q/(\unicode[STIX]{x03C0}D_{H}^{2}/4)$
, where
![]() $Q$
is the inlet volume flow rate) as the length and velocity scales respectively, instead of the plume width
$Q$
is the inlet volume flow rate) as the length and velocity scales respectively, instead of the plume width
![]() $B$
and the mean inlet velocity
$B$
and the mean inlet velocity
![]() $w_{0}$
. That is, puffing frequencies at these low ARs exhibit similarity and collapse on to each other when the Strouhal and Richardson numbers are expressed in terms of hydraulic diameter (
$w_{0}$
. That is, puffing frequencies at these low ARs exhibit similarity and collapse on to each other when the Strouhal and Richardson numbers are expressed in terms of hydraulic diameter (
![]() $D_{H}$
) and its equivalent velocity (
$D_{H}$
) and its equivalent velocity (
![]() $w_{H}$
). The modified Strouhal number (
$w_{H}$
). The modified Strouhal number (
![]() $St_{D_{H}}$
) and Richardson number (
$St_{D_{H}}$
) and Richardson number (
![]() $Ri_{D_{H}}$
) are defined in terms of
$Ri_{D_{H}}$
) are defined in terms of
![]() $D_{H}$
and
$D_{H}$
and
![]() $w_{H}$
as
$w_{H}$
as
The present experimental data for square and rectangular plumes, expressed in terms of
![]() $St_{D_{H}}$
and
$St_{D_{H}}$
and
![]() $Ri_{D_{H}}$
, are plotted in figure 18. The experimental data of Cetegen et al. (Reference Cetegen, Dong and Soteriou1998), extracted from figure 9 of their paper and expressed in terms of
$Ri_{D_{H}}$
, are plotted in figure 18. The experimental data of Cetegen et al. (Reference Cetegen, Dong and Soteriou1998), extracted from figure 9 of their paper and expressed in terms of
![]() $St_{D_{H}}$
and
$St_{D_{H}}$
and
![]() $Ri_{D_{H}}$
, are also presented in figure 18 for comparison. The experimental data for plumes of
$Ri_{D_{H}}$
, are also presented in figure 18 for comparison. The experimental data for plumes of
![]() $1\leqslant \text{AR}\leqslant 10$
collapse onto a single line, following a power law
$1\leqslant \text{AR}\leqslant 10$
collapse onto a single line, following a power law
![]() $St_{D_{H}}=0.66(Ri_{D_{H}})^{0.44}$
(
$St_{D_{H}}=0.66(Ri_{D_{H}})^{0.44}$
(
![]() $R$
-square
$R$
-square
![]() $=$
0.99). This frequency correlation eliminates the dependence of AR on puffing dynamics, and serves as a universal law for both rectangular and square plumes. Using the new scaling law
$=$
0.99). This frequency correlation eliminates the dependence of AR on puffing dynamics, and serves as a universal law for both rectangular and square plumes. Using the new scaling law
![]() $St_{D_{H}}=0.66(Ri_{D_{H}})^{0.44}$
, by expressing
$St_{D_{H}}=0.66(Ri_{D_{H}})^{0.44}$
, by expressing
![]() $St_{D_{H}}$
in terms of
$St_{D_{H}}$
in terms of
![]() $St$
and
$St$
and
![]() $Ri_{D_{H}}$
in terms of
$Ri_{D_{H}}$
in terms of
![]() $Ri$
, we can derive an
$Ri$
, we can derive an
![]() $St{-}Ri$
correlation which includes an AR-dependent correction term in its coefficient as
$St{-}Ri$
correlation which includes an AR-dependent correction term in its coefficient as
5 Conclusions
The BiGlobal instability characteristics of planar plumes have been investigated in parameter ranges
![]() $10\leqslant Re\leqslant 600$
,
$10\leqslant Re\leqslant 600$
,
![]() $0.03\leqslant Fr\leqslant 1$
and
$0.03\leqslant Fr\leqslant 1$
and
![]() $0.138\leqslant S\leqslant 0.967$
, thereby varying the plume Richardson number in range
$0.138\leqslant S\leqslant 0.967$
, thereby varying the plume Richardson number in range
![]() $0.03<Ri<960$
. Planar plumes contain only one unstable BiGlobal mode that corresponds to symmetric perturbations, while asymmetric perturbations are BiGlobally stable in the parameter space investigated. The characteristics of this unstable mode are qualitatively similar to those of circular plumes. Similar to that in circular plumes, instability regions and frequency correlations are obtained for planar plumes using BiGlobal instability analysis. The oscillation frequencies of BiGlobal unstable mode scale as
$0.03<Ri<960$
. Planar plumes contain only one unstable BiGlobal mode that corresponds to symmetric perturbations, while asymmetric perturbations are BiGlobally stable in the parameter space investigated. The characteristics of this unstable mode are qualitatively similar to those of circular plumes. Similar to that in circular plumes, instability regions and frequency correlations are obtained for planar plumes using BiGlobal instability analysis. The oscillation frequencies of BiGlobal unstable mode scale as
![]() $St=0.54Ri^{0.44}$
, which is in excellent agreement with the experimental scaling law obtained by Cetegen et al. (Reference Cetegen, Dong and Soteriou1998). Planar plumes turn oscillatory at low
$St=0.54Ri^{0.44}$
, which is in excellent agreement with the experimental scaling law obtained by Cetegen et al. (Reference Cetegen, Dong and Soteriou1998). Planar plumes turn oscillatory at low
![]() $Re$
when compared to circular plumes. Planar plumes are found to be more unstable to 2D perturbations than 3D perturbations, while their puffing frequencies remain the same for both.
$Re$
when compared to circular plumes. Planar plumes are found to be more unstable to 2D perturbations than 3D perturbations, while their puffing frequencies remain the same for both.
Further, experiments are performed in rectangular plumes of ARs 3.4, 4.1 and 5 and square plumes, and their puffing dynamics is compared with the predictions from the instability analysis. In spite of the lower AR, the puffing characteristics of rectangular plumes are found to be in reasonable agreement with the BiGlobal instability theory. This agreement shows that puffing instability is nearly 2D even for low-AR rectangular plumes. This has been further verified using spanwise flow visualizations which have shown that, barring the secondary flows at the corners, the flow field and the PV remain largely 2D in rectangular plumes. Nevertheless, the puffing Strouhal numbers exhibited a weaker dependence on inlet ARs. Also, from instability analysis and experiments, we have shown that the numerical simulations of Soteriou et al. (Reference Soteriou, Dong and Cetegen2002) arrived at a more conservative estimate of the critical
![]() $Re$
for the onset of puffing.
$Re$
for the onset of puffing.
For the first time, puffing characteristics of square plumes have been studied. The puffing dynamics of square plumes is found to differ from that of rectangular plumes. Square plumes tend to be more stable and display higher puffing frequencies than rectangular plumes for the same inlet parameters. From the present experiments, a frequency correlation has been obtained for square plumes as
![]() $St=0.65Ri^{0.44}$
. From spanwise visualizations, it is observed that the PV dynamics in square plumes is highly 3D, which might have resulted in an increase in their puffing frequencies when compared to rectangular plumes. In addition to puffing instability, the spanwise visualizations also revealed that both rectangular and square plumes exhibit secondary flows at their corners similar to their constant-density counterparts.
$St=0.65Ri^{0.44}$
. From spanwise visualizations, it is observed that the PV dynamics in square plumes is highly 3D, which might have resulted in an increase in their puffing frequencies when compared to rectangular plumes. In addition to puffing instability, the spanwise visualizations also revealed that both rectangular and square plumes exhibit secondary flows at their corners similar to their constant-density counterparts.
Finally, using the present experiments and the experiments of Cetegen et al. (Reference Cetegen, Dong and Soteriou1998), and by employing the hydraulic diameter as the length scale and its corresponding mean inlet velocity as the velocity scale, we obtained a universal scaling law for puffing frequencies in both rectangular and square plumes. This correlation,
![]() $St_{D_{H}}=0.66(Ri_{D_{H}})^{0.44}$
, eliminates the dependence of AR on plume global dynamics.
$St_{D_{H}}=0.66(Ri_{D_{H}})^{0.44}$
, eliminates the dependence of AR on plume global dynamics.
Acknowledgements
The authors gratefully acknowledge the use of computational resources at the High Performance Computing Facility, Indian Institute of Technology Kanpur, for carrying out the instability computations. We also acknowledge partial financial support from Bhabha Atomic Research Center (BARC), Mumbai, which has helped us to build the experimental set-up, and the PG Research Grant of IIT Kanpur.
Appendix A. Base flow validation with experiments
The velocity field measured using PIV in a steady laminar plume is used to validate the numerical model (see § 2.1) employed for obtaining the base flows. The validation case corresponds to a steady laminar plume of
![]() $(Re,Fr,S)=(341,0.3,0.69)$
generated in an experiment using a rectangular orifice of
$(Re,Fr,S)=(341,0.3,0.69)$
generated in an experiment using a rectangular orifice of
![]() $B=0.042~\text{m}$
and
$B=0.042~\text{m}$
and
![]() $L=0.211~\text{m}$
(
$L=0.211~\text{m}$
(
![]() $\text{AR}=5$
). Figure 19(a) shows the laminar plume and its mean velocity field obtained by averaging 100 instantaneous velocity fields measured using PIV. Note that the measurement window in the streamwise direction is limited to
$\text{AR}=5$
). Figure 19(a) shows the laminar plume and its mean velocity field obtained by averaging 100 instantaneous velocity fields measured using PIV. Note that the measurement window in the streamwise direction is limited to
![]() $z=3.7$
in the present experiments. The sectional velocity profiles and centreline velocity obtained from the base flow computations are compared with the ones obtained from the experiment, and plotted in figures 19(b) and 20(b) respectively. The comparison shows a reasonably good agreement between the computations and the experiments which proves the reliability of the numerical model in predicting the steady base flow.
$z=3.7$
in the present experiments. The sectional velocity profiles and centreline velocity obtained from the base flow computations are compared with the ones obtained from the experiment, and plotted in figures 19(b) and 20(b) respectively. The comparison shows a reasonably good agreement between the computations and the experiments which proves the reliability of the numerical model in predicting the steady base flow.
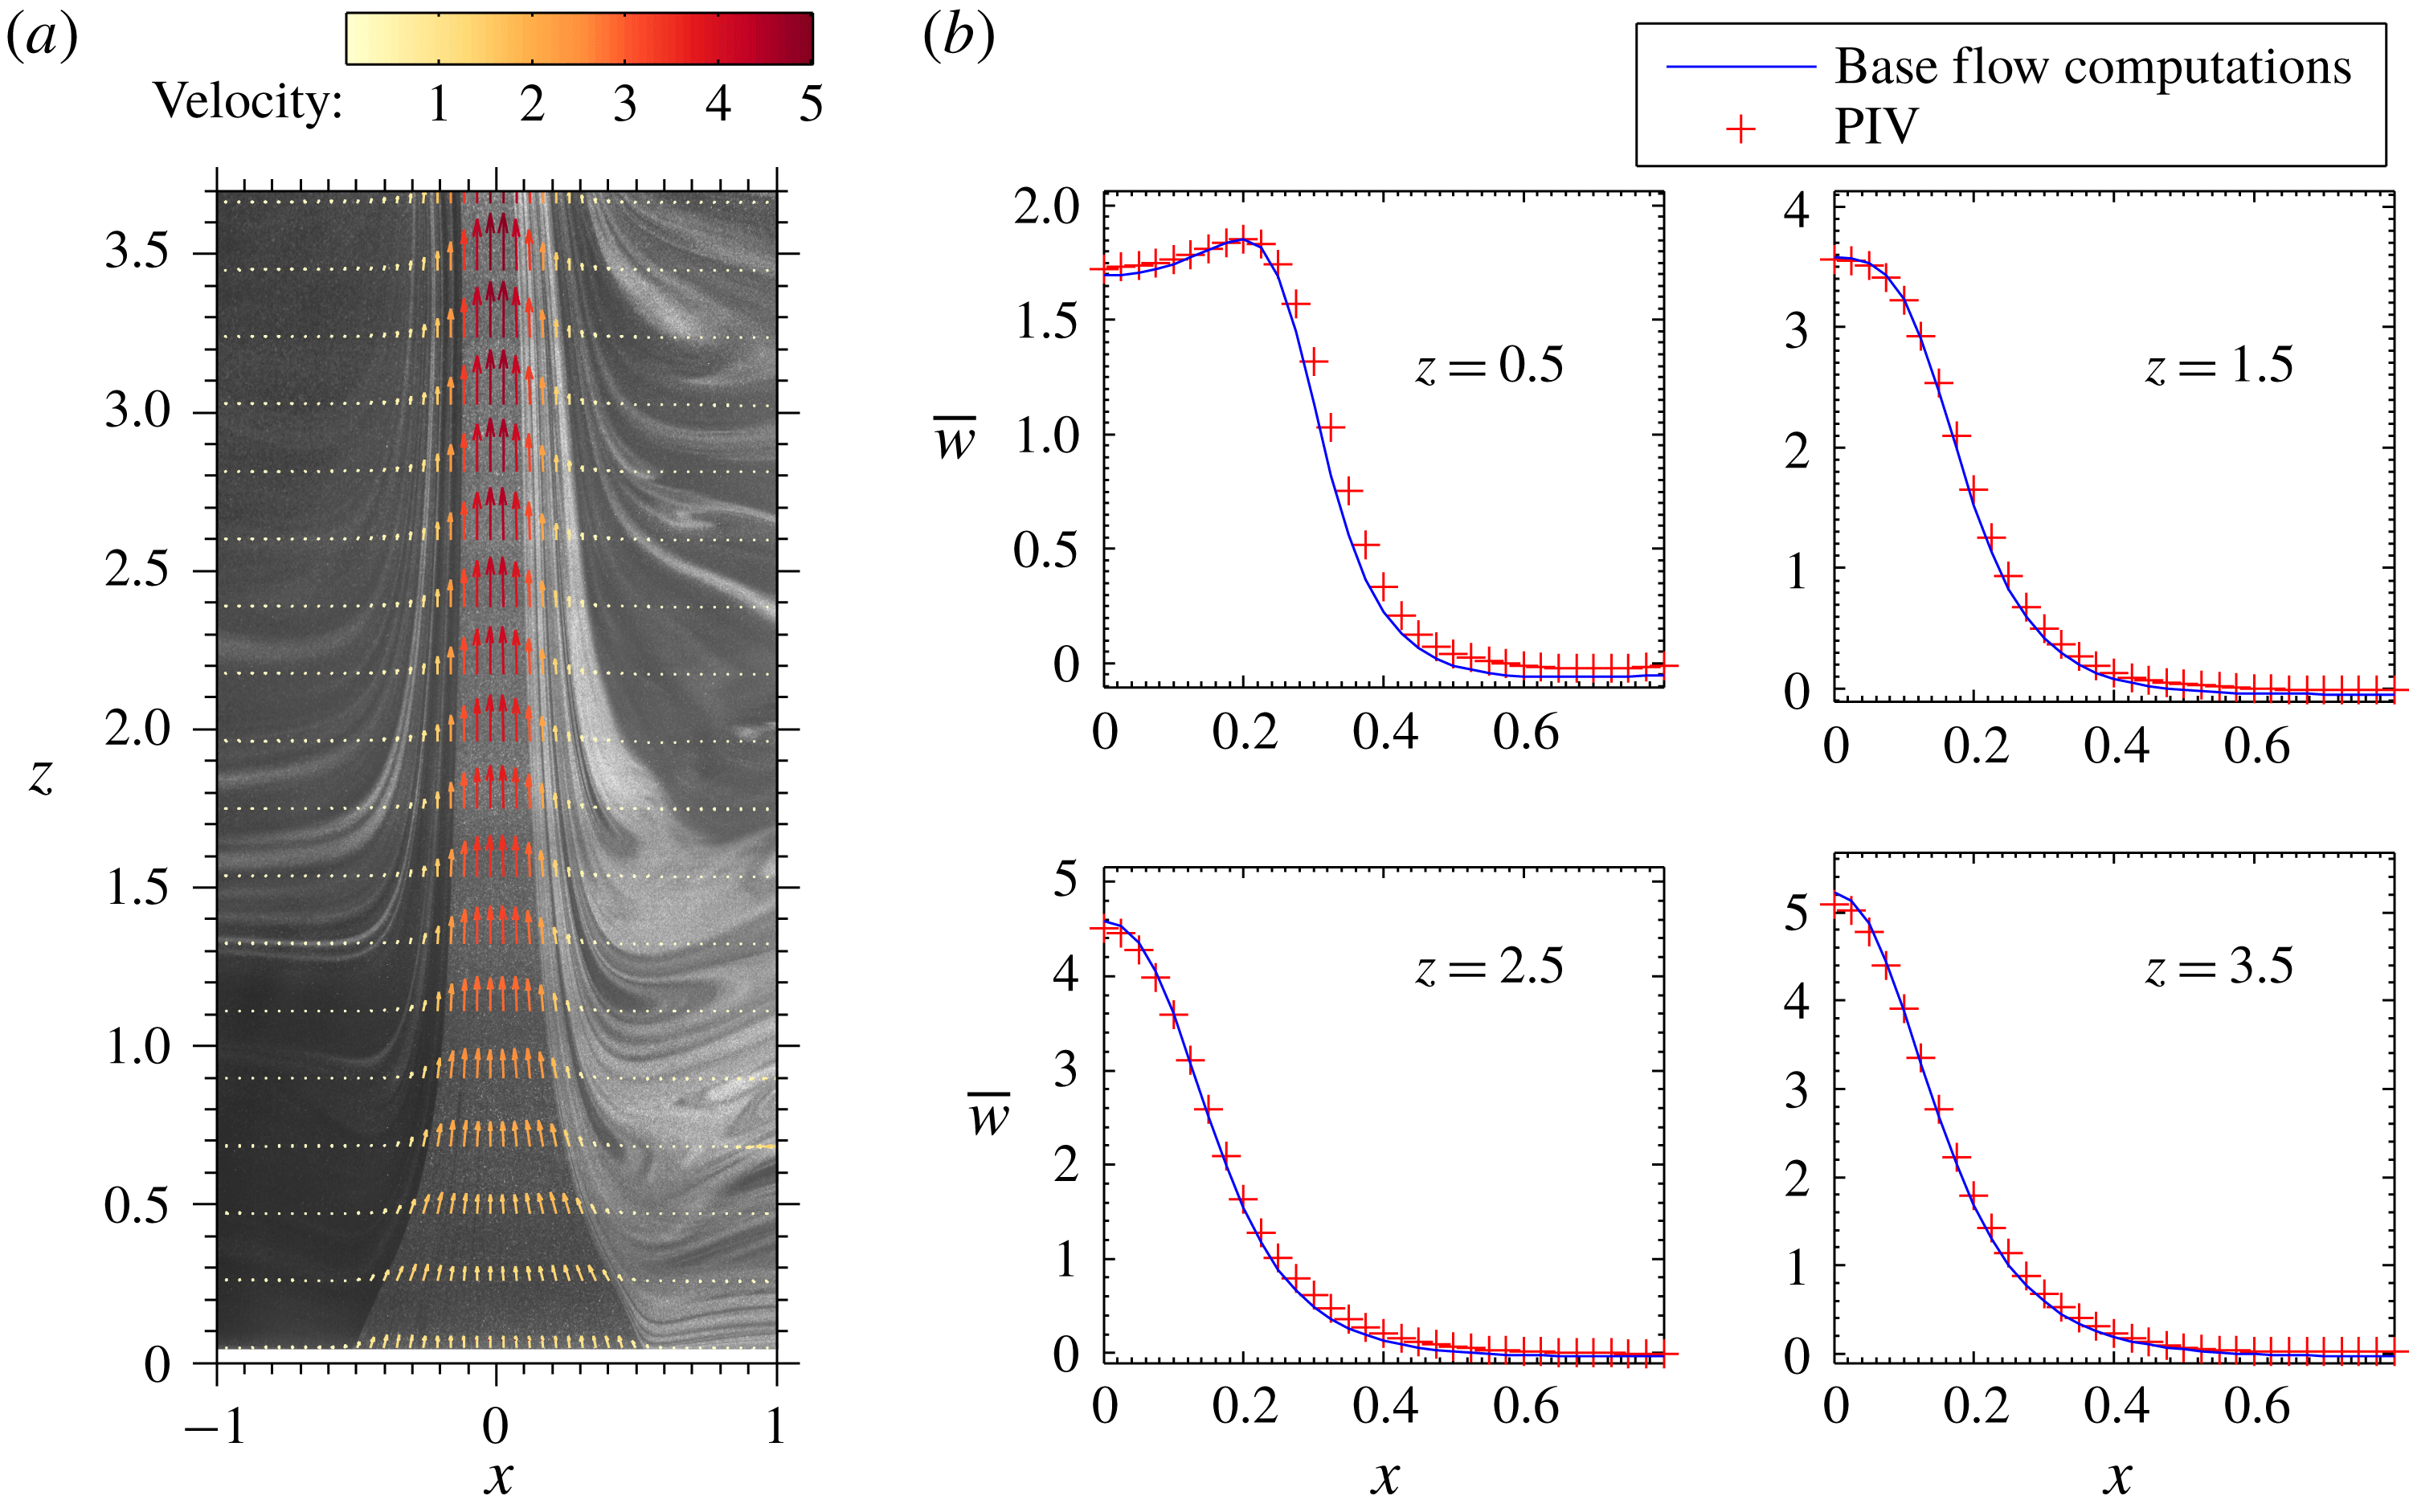
Figure 19. Validation of base flow solution with an experimentally generated steady laminar plume of
![]() $(Re,Fr,S)=(341,0.3,0.69)$
. (a) Flow visualization and velocity field obtained from PIV measurements. (b) Comparison of sectional velocity profiles.
$(Re,Fr,S)=(341,0.3,0.69)$
. (a) Flow visualization and velocity field obtained from PIV measurements. (b) Comparison of sectional velocity profiles.
For the validation case presented in figure 19, the streamwise velocity, lateral velocity and mass fraction fields obtained using base flow computations are shown in figure 20(a). Near to their source, these plumes undergo a rapid acceleration along the centreline and converge to a minimum width before diverging again downstream, a typical characteristic of the so-called ‘lazy plumes’ which have excess buoyancy and deficit momentum at their source when compared to their self-similar region. The rapid convergence accompanied by the dominant lateral flow near the source makes the flow highly non-parallel with non-negligible streamwise gradients.
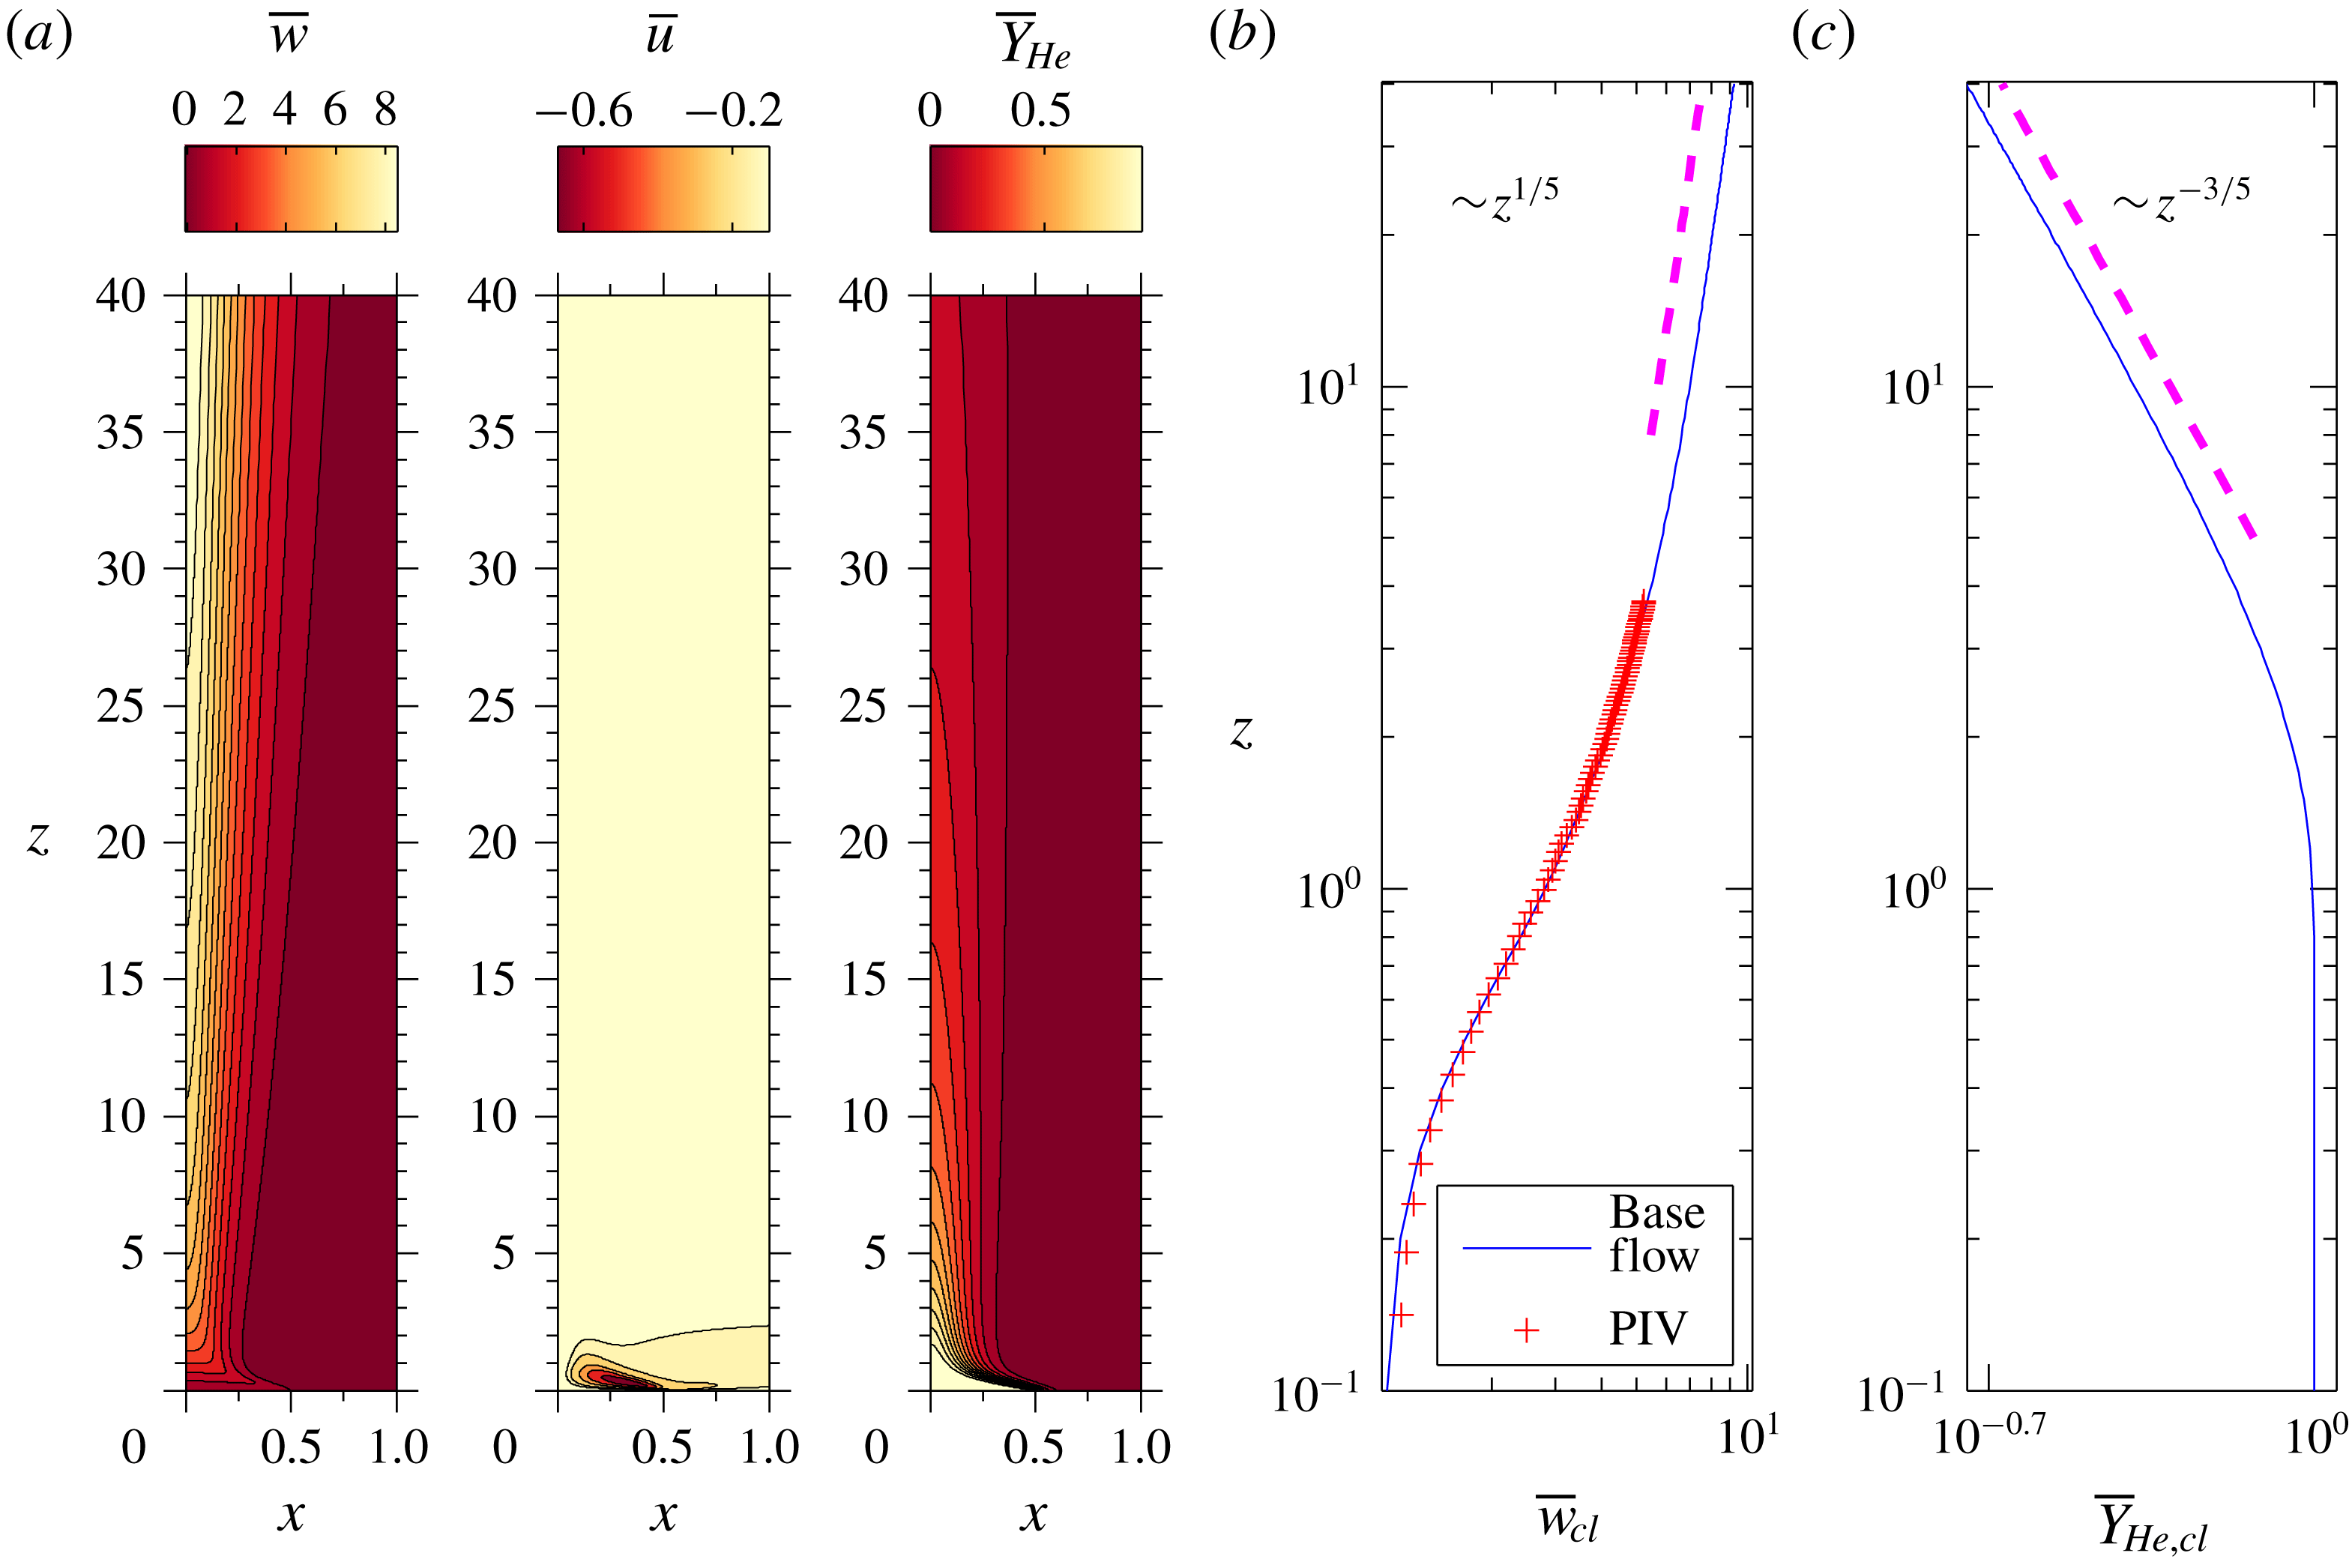
Figure 20. (a) Steady solution obtained from base flow computations for the validation case shown in figure 19. The corresponding (b) velocity and (c) mass fraction variations along the centreline.
The density field in figure 20(c) shows that as the plume fluid convects away from the source, it gets diluted rapidly because of mass diffusion and its density approaches the ambient density in the far field. Thus, the plume follows the Boussinesq approximation in the far field. The similarity formulation reveals that, in self-similar planar Boussinesq laminar plumes, the centreline velocity
![]() $\overline{w}_{cl}$
and mass fraction
$\overline{w}_{cl}$
and mass fraction
![]() $\overline{Y}_{He,cl}$
variations follow the power laws
$\overline{Y}_{He,cl}$
variations follow the power laws
![]() $w_{cl}\propto z^{1/5}$
and
$w_{cl}\propto z^{1/5}$
and
![]() $Y_{He,cl}\propto z^{-3/5}$
respectively (Gebhart et al.
Reference Gebhart, Jaluria, Mahajan and Sammakia1988). For the validation case, variations of velocity and helium mass fraction along the centreline are plotted in figures 20(b) and 20(c) respectively. The laminar plume follows these power-law variations from
$Y_{He,cl}\propto z^{-3/5}$
respectively (Gebhart et al.
Reference Gebhart, Jaluria, Mahajan and Sammakia1988). For the validation case, variations of velocity and helium mass fraction along the centreline are plotted in figures 20(b) and 20(c) respectively. The laminar plume follows these power-law variations from
![]() $z\approx 10$
for this case. Thus, these plumes eventually attain self-similarity in the far field.
$z\approx 10$
for this case. Thus, these plumes eventually attain self-similarity in the far field.
Appendix B. Effect of domain length on isolated and arc branch modes
The instability computations have been performed for different box lengths
![]() $z_{max}=30$
, 50 and 70 without using the absorbing layer at the outlet boundary. The eigenvalue spectra obtained for these cases are presented in figures 21(a) and 21(b) for varicose and sinuous perturbations respectively. These figures show that the isolated BiGlobal mode converged with respect to the domain length. Also, a comparison of the isolated mode in figures 3(a) and 21(a) reveals that it is unaffected by the use of the absorption layer.
$z_{max}=30$
, 50 and 70 without using the absorbing layer at the outlet boundary. The eigenvalue spectra obtained for these cases are presented in figures 21(a) and 21(b) for varicose and sinuous perturbations respectively. These figures show that the isolated BiGlobal mode converged with respect to the domain length. Also, a comparison of the isolated mode in figures 3(a) and 21(a) reveals that it is unaffected by the use of the absorption layer.
However, it can be observed that the growth rates of the arc branch eigenmodes increase with an increase in the domain length. Lesshafft (Reference Lesshafft2018) showed that an increase in domain size will result in an increase in growth rates of the arc branch modes if the flow is convectively unstable at the outflow boundary. Note that the plume far field is convectively unstable to both varicose and sinuous perturbations, and thereby longer domain sizes will lead to an increase in arc branch mode growth rates as observed in figure 21(a,b).
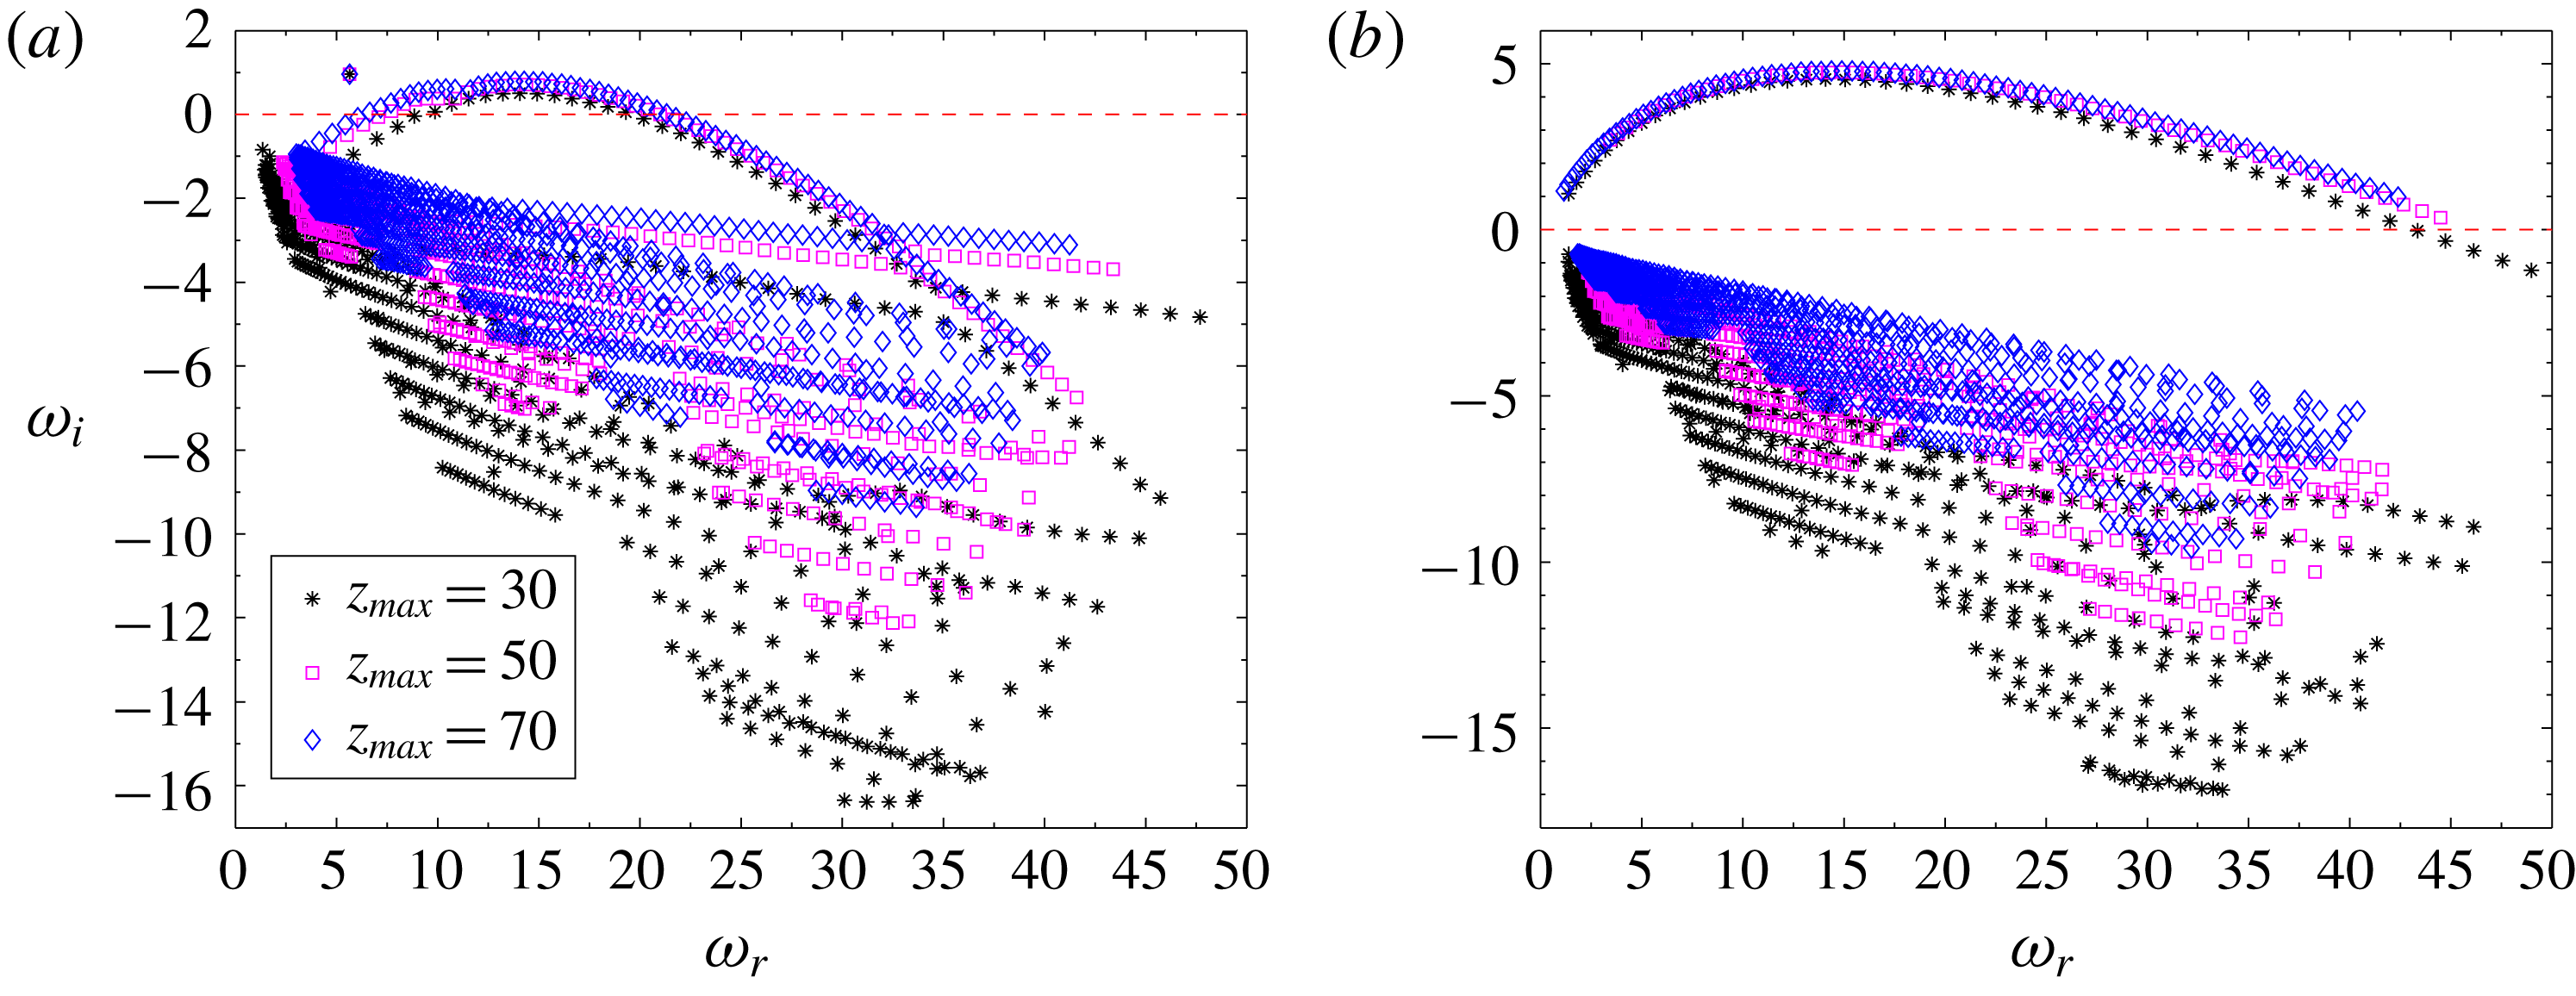
Figure 21. Effect of domain length on eigenvalue spectra for (a) varicose and (b) sinuous perturbations. The plume case is the same as presented in figures 3 and 4. The isolated BiGlobal mode is independent of domain length, while the arc branch modes exhibit higher growth rates for longer domain lengths.
Appendix C. Stability equations
This appendix gives various terms in the dispersion relation (2.12) for planar plumes written in matrix form as given below:
where the subscripts
![]() $eq$
and
$eq$
and
![]() $var$
are rows and columns that correspond to equations and variables respectively. In matrices
$var$
are rows and columns that correspond to equations and variables respectively. In matrices
![]() $A$
and
$A$
and
![]() $B$
, equations
$B$
, equations
![]() $eq=\{xm,ym,zm,co,sp\}$
form the rows where
$eq=\{xm,ym,zm,co,sp\}$
form the rows where
![]() $xm$
,
$xm$
,
![]() $ym$
,
$ym$
,
![]() $zm$
,
$zm$
,
![]() $co$
and
$co$
and
![]() $sp$
correspond to
$sp$
correspond to
![]() $x$
-momentum,
$x$
-momentum,
![]() $y$
-momentum,
$y$
-momentum,
![]() $z$
-momentum, continuity and species transport equations respectively, and variables
$z$
-momentum, continuity and species transport equations respectively, and variables
![]() $var=\{u,v,w,p,\unicode[STIX]{x1D70C}\}$
form the columns. The terms in
$var=\{u,v,w,p,\unicode[STIX]{x1D70C}\}$
form the columns. The terms in
![]() $A$
and
$A$
and
![]() $B$
are given as follows:
$B$
are given as follows:
 $$\begin{eqnarray}\displaystyle A_{xm,\unicode[STIX]{x1D70C}} & = & \displaystyle \overline{u}{\displaystyle \frac{\unicode[STIX]{x2202}\overline{u}}{\unicode[STIX]{x2202}x}}+\overline{w}{\displaystyle \frac{\unicode[STIX]{x2202}\overline{u}}{\unicode[STIX]{x2202}z}}+\overline{H}\frac{S}{\unicode[STIX]{x1D707}^{\ast }Re}\left[-{\displaystyle \frac{\unicode[STIX]{x2202}^{2}\overline{u}}{\unicode[STIX]{x2202}z^{2}}}-\frac{1}{3}{\displaystyle \frac{\unicode[STIX]{x2202}^{2}\overline{w}}{\unicode[STIX]{x2202}z\unicode[STIX]{x2202}x}}-\frac{4}{3}{\displaystyle \frac{\unicode[STIX]{x2202}^{2}\overline{u}}{\unicode[STIX]{x2202}x^{2}}}\right]\nonumber\\ \displaystyle & & \displaystyle +\,\overline{H}\frac{S}{\unicode[STIX]{x1D707}^{\ast }Re}\left[-{\displaystyle \frac{\unicode[STIX]{x2202}\overline{w}}{\unicode[STIX]{x2202}x}}{\displaystyle \frac{\unicode[STIX]{x2202}}{\unicode[STIX]{x2202}z}}-{\displaystyle \frac{\unicode[STIX]{x2202}\overline{u}}{\unicode[STIX]{x2202}z}}{\displaystyle \frac{\unicode[STIX]{x2202}}{\unicode[STIX]{x2202}z}}+\frac{2}{3}{\displaystyle \frac{\unicode[STIX]{x2202}\overline{w}}{\unicode[STIX]{x2202}z}}{\displaystyle \frac{\unicode[STIX]{x2202}}{\unicode[STIX]{x2202}x}}-\frac{4}{3}{\displaystyle \frac{\unicode[STIX]{x2202}\overline{u}}{\unicode[STIX]{x2202}x}}{\displaystyle \frac{\unicode[STIX]{x2202}}{\unicode[STIX]{x2202}x}}\right]\nonumber\\ \displaystyle & & \displaystyle +\,\frac{S}{\unicode[STIX]{x1D707}^{\ast }Re}\left[-{\displaystyle \frac{\unicode[STIX]{x2202}\overline{w}}{\unicode[STIX]{x2202}x}}{\displaystyle \frac{\unicode[STIX]{x2202}\overline{H}}{\unicode[STIX]{x2202}z}}-{\displaystyle \frac{\unicode[STIX]{x2202}\overline{u}}{\unicode[STIX]{x2202}z}}{\displaystyle \frac{\unicode[STIX]{x2202}\overline{H}}{\unicode[STIX]{x2202}z}}+\frac{2}{3}{\displaystyle \frac{\unicode[STIX]{x2202}\overline{w}}{\unicode[STIX]{x2202}z}}{\displaystyle \frac{\unicode[STIX]{x2202}\overline{H}}{\unicode[STIX]{x2202}x}}-\frac{4}{3}{\displaystyle \frac{\unicode[STIX]{x2202}\overline{u}}{\unicode[STIX]{x2202}x}}{\displaystyle \frac{\unicode[STIX]{x2202}\overline{H}}{\unicode[STIX]{x2202}x}}\right]\!,\end{eqnarray}$$
 $$\begin{eqnarray}\displaystyle A_{zm,\unicode[STIX]{x1D70C}} & = & \displaystyle \overline{u}{\displaystyle \frac{\unicode[STIX]{x2202}\overline{w}}{\unicode[STIX]{x2202}x}}+\overline{w}{\displaystyle \frac{\unicode[STIX]{x2202}\overline{w}}{\unicode[STIX]{x2202}z}}+g+\overline{H}\frac{S}{\unicode[STIX]{x1D707}^{\ast }Re}\left[-\frac{1}{3}{\displaystyle \frac{\unicode[STIX]{x2202}^{2}\overline{u}}{\unicode[STIX]{x2202}z\unicode[STIX]{x2202}x}}-{\displaystyle \frac{\unicode[STIX]{x2202}^{2}\overline{w}}{\unicode[STIX]{x2202}x^{2}}}-\frac{4}{3}{\displaystyle \frac{\unicode[STIX]{x2202}^{2}\overline{w}}{\unicode[STIX]{x2202}z^{2}}}\right]\nonumber\\ \displaystyle & & \displaystyle +\,\overline{H}\frac{S}{\unicode[STIX]{x1D707}^{\ast }Re}\left[-{\displaystyle \frac{\unicode[STIX]{x2202}\overline{w}}{\unicode[STIX]{x2202}x}}{\displaystyle \frac{\unicode[STIX]{x2202}}{\unicode[STIX]{x2202}x}}-\frac{4}{3}{\displaystyle \frac{\unicode[STIX]{x2202}\overline{w}}{\unicode[STIX]{x2202}z}}{\displaystyle \frac{\unicode[STIX]{x2202}}{\unicode[STIX]{x2202}z}}-{\displaystyle \frac{\unicode[STIX]{x2202}\overline{u}}{\unicode[STIX]{x2202}z}}{\displaystyle \frac{\unicode[STIX]{x2202}}{\unicode[STIX]{x2202}x}}+\frac{2}{3}{\displaystyle \frac{\unicode[STIX]{x2202}\overline{u}}{\unicode[STIX]{x2202}x}}{\displaystyle \frac{\unicode[STIX]{x2202}}{\unicode[STIX]{x2202}z}}\right]\nonumber\\ \displaystyle & & \displaystyle +\,\frac{S}{\unicode[STIX]{x1D707}^{\ast }Re}\left[-{\displaystyle \frac{\unicode[STIX]{x2202}\overline{w}}{\unicode[STIX]{x2202}x}}{\displaystyle \frac{\unicode[STIX]{x2202}\overline{H}}{\unicode[STIX]{x2202}x}}-\frac{4}{3}{\displaystyle \frac{\unicode[STIX]{x2202}\overline{w}}{\unicode[STIX]{x2202}z}}{\displaystyle \frac{\unicode[STIX]{x2202}\overline{H}}{\unicode[STIX]{x2202}z}}-{\displaystyle \frac{\unicode[STIX]{x2202}\overline{u}}{\unicode[STIX]{x2202}z}}{\displaystyle \frac{\unicode[STIX]{x2202}\overline{H}}{\unicode[STIX]{x2202}x}}+\frac{2}{3}{\displaystyle \frac{\unicode[STIX]{x2202}\overline{u}}{\unicode[STIX]{x2202}x}}{\displaystyle \frac{\unicode[STIX]{x2202}\overline{H}}{\unicode[STIX]{x2202}z}}\right]\!,\end{eqnarray}$$
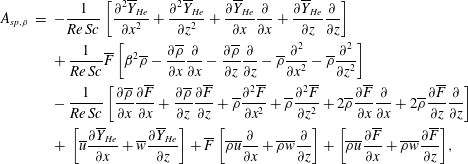 $$\begin{eqnarray}\displaystyle A_{sp,\unicode[STIX]{x1D70C}} & = & \displaystyle -\frac{1}{Re\,Sc}\left[{\displaystyle \frac{\unicode[STIX]{x2202}^{2}\overline{Y}_{He}}{\unicode[STIX]{x2202}x^{2}}}+{\displaystyle \frac{\unicode[STIX]{x2202}^{2}\overline{Y}_{He}}{\unicode[STIX]{x2202}z^{2}}}+{\displaystyle \frac{\unicode[STIX]{x2202}\overline{Y}_{He}}{\unicode[STIX]{x2202}x}}{\displaystyle \frac{\unicode[STIX]{x2202}}{\unicode[STIX]{x2202}x}}+{\displaystyle \frac{\unicode[STIX]{x2202}\overline{Y}_{He}}{\unicode[STIX]{x2202}z}}{\displaystyle \frac{\unicode[STIX]{x2202}}{\unicode[STIX]{x2202}z}}\right]\nonumber\\ \displaystyle & & \displaystyle +\,\frac{1}{Re\,Sc}\overline{F}\left[\unicode[STIX]{x1D6FD}^{2}\overline{\unicode[STIX]{x1D70C}}-{\displaystyle \frac{\unicode[STIX]{x2202}\overline{\unicode[STIX]{x1D70C}}}{\unicode[STIX]{x2202}x}}{\displaystyle \frac{\unicode[STIX]{x2202}}{\unicode[STIX]{x2202}x}}-{\displaystyle \frac{\unicode[STIX]{x2202}\overline{\unicode[STIX]{x1D70C}}}{\unicode[STIX]{x2202}z}}{\displaystyle \frac{\unicode[STIX]{x2202}}{\unicode[STIX]{x2202}z}}-\overline{\unicode[STIX]{x1D70C}}{\displaystyle \frac{\unicode[STIX]{x2202}^{2}}{\unicode[STIX]{x2202}x^{2}}}-\overline{\unicode[STIX]{x1D70C}}{\displaystyle \frac{\unicode[STIX]{x2202}^{2}}{\unicode[STIX]{x2202}z^{2}}}\right]\nonumber\\ \displaystyle & & \displaystyle -\,\frac{1}{Re\,Sc}\left[{\displaystyle \frac{\unicode[STIX]{x2202}\overline{\unicode[STIX]{x1D70C}}}{\unicode[STIX]{x2202}x}}{\displaystyle \frac{\unicode[STIX]{x2202}\overline{F}}{\unicode[STIX]{x2202}x}}+{\displaystyle \frac{\unicode[STIX]{x2202}\overline{\unicode[STIX]{x1D70C}}}{\unicode[STIX]{x2202}z}}{\displaystyle \frac{\unicode[STIX]{x2202}\overline{F}}{\unicode[STIX]{x2202}z}}+\overline{\unicode[STIX]{x1D70C}}{\displaystyle \frac{\unicode[STIX]{x2202}^{2}\overline{F}}{\unicode[STIX]{x2202}x^{2}}}+\overline{\unicode[STIX]{x1D70C}}{\displaystyle \frac{\unicode[STIX]{x2202}^{2}\overline{F}}{\unicode[STIX]{x2202}z^{2}}}+2\overline{\unicode[STIX]{x1D70C}}{\displaystyle \frac{\unicode[STIX]{x2202}\overline{F}}{\unicode[STIX]{x2202}x}}{\displaystyle \frac{\unicode[STIX]{x2202}}{\unicode[STIX]{x2202}x}}+2\overline{\unicode[STIX]{x1D70C}}{\displaystyle \frac{\unicode[STIX]{x2202}\overline{F}}{\unicode[STIX]{x2202}z}}{\displaystyle \frac{\unicode[STIX]{x2202}}{\unicode[STIX]{x2202}z}}\right]\nonumber\\ \displaystyle & & \displaystyle +\,\left[\overline{u}{\displaystyle \frac{\unicode[STIX]{x2202}\overline{Y}_{He}}{\unicode[STIX]{x2202}x}}+\overline{w}{\displaystyle \frac{\unicode[STIX]{x2202}\overline{Y}_{He}}{\unicode[STIX]{x2202}z}}\right]+\overline{F}\left[\overline{\unicode[STIX]{x1D70C}}\overline{u}{\displaystyle \frac{\unicode[STIX]{x2202}}{\unicode[STIX]{x2202}x}}+\overline{\unicode[STIX]{x1D70C}}\overline{w}{\displaystyle \frac{\unicode[STIX]{x2202}}{\unicode[STIX]{x2202}z}}\right]+\left[\overline{\unicode[STIX]{x1D70C}}\overline{u}{\displaystyle \frac{\unicode[STIX]{x2202}\overline{F}}{\unicode[STIX]{x2202}x}}+\overline{\unicode[STIX]{x1D70C}}\overline{w}{\displaystyle \frac{\unicode[STIX]{x2202}\overline{F}}{\unicode[STIX]{x2202}z}}\right]\!,\end{eqnarray}$$


