1. INTRODUCTION AND SUMMARY
Let X1,X2,… be a
sequence of independent and identically distributed (i.i.d.) positive
random variables that are independent of the nonnegative integer-valued
random variable N. The random variable
is called a compound random variable. In Section 2, we give a simple
probabilistic proof of an identity concerning the expected value of a
function of a compound random variable; when the
Xi are positive integer-valued, an identity
concerning the probability mass function of SN
is obtained as a corollary. In Section 3, we use the latter identity to
provide new derivations of the recursive formulas for the probability mass
function of SN when X1 is
a positive integer-valued random variable, and N has a variety
of possible distributions. For other derivations of the applications of
Section 3, the reader should see the references.
Sections 4 and 5 are concerned with finding efficient simulation
techniques to estimate
where c is a specified constant and the
Xi need not be discrete. Because
it follows that estimating p and θ will also give us
estimates of E [S −
c|S > c] and E
[c − S|S ≤
c]. Although our major interest is when the
Xi are positive, in Section 5 we show how
an effective simulation can be performed when this restriction is
removed.
2. THE COMPOUND IDENTITY
Consider the compound random variable
Let M be independent of
X1,X2,… and such that
The random variable M is called the sized bias version of
N. (If the interarrival times of a renewal process were
distributed according to N, then the average length of a
renewal interval containing a fixed point would be distributed
according to M.)
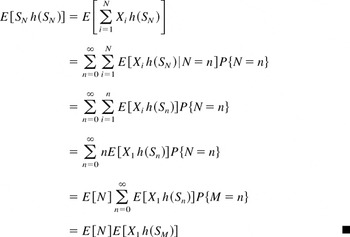
Theorem 2.1 (The Compound Identity): For any function
h,
Proof:
Corollary 2.1: If X1 is a positive
integer-valued random variable with αi =
P{X1 = i}, then
Proof: For an event A, let I(A)
equal one if A occurs and let it equal zero otherwise. Then,
with h(x) = I(x = k), the
compound identity yields that
3. SPECIAL CASES
Suppose that X1 is a positive integer-valued
random variable with αi =
P{X1 = i}.
3.1. Poisson Case
If
Therefore, the corollary yields the well-known recursion
3.2. Negative Binomial Case
For a fixed value of p, we say that N is an
NB(r) random variable if
Such a random variable can be thought of as being the number of
failures that occur before a total of r successes have been
amassed when each trial is independently a success with probability
p.
If M is the size-biased version of an
NB(r) random variable N, then
that is, M − 1 is an NB(r + 1)
random variable.
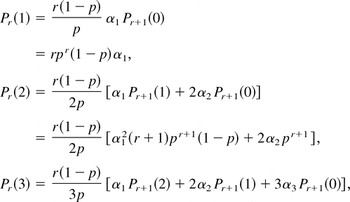
Now, for N an NB(r) random variable, let
The corollary now yields the recursion
For instance, starting with
the recursion yields
and so on.
3.3. Binomial Case
If N is a binomial random variable with parameters
r and p, then
that is, M − 1 is a binomial random variable with
parameters r − 1 and p.
For a fixed p, let
The corollary then yields the recursion
3.4. Hypergeometric Case
Let N = N(w,r) be a
hypergeometric random variable having the distribution of the number of
white balls chosen when a random sample of r is chosen from a
set of w white and b blue balls; that is,
Then, it is straightforward to check that
that is, M − 1 has the same distribution as N
with the modification that w becomes w − 1 and
r becomes r − 1. Letting
then
This yields
and so on. (We are using the convention that
if either k < 0 or k > n.)
3.5. The Logarithmic Count Distribution
Suppose that for 0 < β < 1,
where C = −1/ln(1 − β). Then,
that is, M − 1 has the negative binomial distribution
of Subsection 3.2 with r = 1 and p = 1 − β.
Thus, the recursion of Subsection 3.2 and the corollary yield the
probabilities P{SN =
k}.
3.6. The Negative Hypergeometric Distribution
Suppose that N has the distribution of the number of blue
balls chosen before a total of r white balls have been amassed
when balls are randomly removed from an urn containing w white
and b blue balls; that is,
Using E [N] = rb/(w
+ 1), we obtain
that is, M − 1 has a hypergeometric distribution,
implying that the probabilities
P{SM−1 = j} can be
obtained from the recursion of Subsection 3.4. Applying the corollary
then gives the probabilities P{SN
= k}.
4. ESTIMATING P{S
≤ c}
The raw simulation approach to estimate p =
P{S ≤ c} would first generate the value
of N, say N = n, then generate the values of
X1,…,Xn and use
them to determine the value of the raw simulation estimator:
The average value of I over many such runs would then be the
estimator of p.
We can improve upon the preceding by a conditional expectation
approach that starts by generating the values of the
Xi in sequence, stopping when the sum of
the generated values exceeds c. Let M denote the
number that are needed; that is,
If the generated value of M is m, then we use
P{N < m} as the estimate of p
from this run. To see that this results in an estimator having a
smaller variance than does the raw simulation estimator I,
note that because the Xi are positive,
Hence,
Now,
where the final equality used the independence of N and
M. Consequently, if the value of M obtained from the
simulation is M = m, then the value of E
[I|M] obtained is
P{N < m}.
The preceding conditional expectation estimator can be further
improved by using a control variable. Let μ = E
[Xi], and define the zero mean
random variable
Because Y and the conditional expectation estimator
P{N < M|M} are (strongly)
negatively correlated, Y should make an effective control
variable.
4.1. Improving the Conditional Expectation Estimator
Let M be defined as earlier and write
The conditional expectation estimator is obtained from the preceding
by generating M and using I {M >
j} as the estimator of P{M >
j}.
We now show how to obtain a more efficient simulation estimator of
P{M > j}. Let F denote the
distribution function of Xi and write
If we now simulate X1 conditional on the event
that it is less than or equal to c, then for this value of
X1, the estimator
is an unbiased estimator of P{M > j}
having a smaller variance than I {M > j}.
Let x1 ≤ c be the generated value. For
j > 1, we have
Hence, generating X2 conditional on the event
that X2 ≤ c −
x1 gives, when this generated value is
x2, the estimate
By continuing in this manner it follows that we can obtain, for any
desired value n, estimates of P{M >
j}, j = 1,…,n. We can then obtain
estimators of the probabilities P{M > j},
j > n, by switching to an ordinary simulation.
With ej denoting the estimator of
P{M > j}, we obtain their values as
follows.
4. Generate X conditional on X ≤
c − s. Let its value be X =
x.
7. Generate X1,… until their sum
exceeds c − s. Let R denote the number
needed; that is,
8. en+k =
en I {R >
k}, k ≥ 1.
The estimator of P{S ≤ c} from this run
is
and its average over many runs is the overall estimate.
4.2. A Simulation Experiment
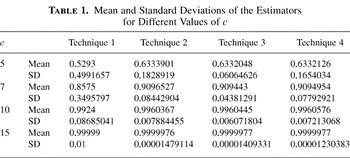
In this subsection, we give the numerical results of a simulation
study done to evaluate the performance of the techniques 1–4. We
let Xi be independent and identically
distributed (i.i.d.) uniform (0,1) random variables and let N
be Poisson, having mean 10. Table 1
summarizes the standard deviations of the estimators for different
values of c. Ten thousand replications were done for each
value of c to estimate
.
Technique 1 is the raw simulation method; technique 2 is the conditional
expectation method; technique 3 is the conditional expectation method
along with the control variable (3); technique 4 uses the estimator (4).
The raw estimator (technique 1), as expected, performs poorly and the other
estimators perform much better.
Mean and Standard Deviations of the Estimators for Different Values
of c
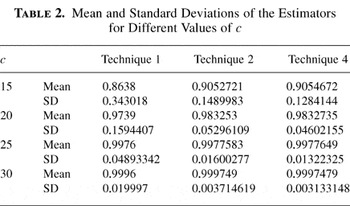
Next, we let Xi be i.i.d. exponential
random variables with mean 1, and, again, let N be Poisson,
having mean 10. Table 2 summarizes the
standard deviations of the estimators for different values of
c. Ten thousand replications were done for each value of
c to estimate
.
Mean and Standard Deviations of the Estimators for Different Values
of c
Thus, based on this small experiment, it appears that the reduction
in variance effected by technique 4 over technique 2 is not worth the
additional time that it takes to do a simulation run. Moreover
technique 3, which does not require much more additional time than
either technique 1 or technique 2, usually gives an even smaller
variance than technique 4.
5. ESTIMATING θ = E [(S − c)+]
Start by letting
and note that
To estimate θ, follow the procedure of (2) and generate the
sequence X1,…, stopping at
Let
and use the estimator
that is, if the generated values of M and A are
m and a, then the estimate of θ from that run is
6. WHEN THE Xi
ARE UNCONSTRAINED IN SIGN
When the Xi are not required to be
positive, our previous methods no longer apply. We now present an
approach in the general case. To estimate p, note that for a
specified integer r,
Our approach is to choose a value r and generate the value
of N conditional on it exceeding r; if this generated
value is g, then simulate the values of
S1,…,Sr and
Sg. The estimate of p from this
run is
The larger the value of r chosen, the smaller the variance
of this estimator. (When r = 0, it reduces to the raw
simulation estimator.)
Similarly, we can estimate θ by using
Hence, using the same data generated to estimate p, the
estimate of θ is
Acknowledgment
This research was supported by the National Science Foundation grant
ECS-0224779 with the University of California.