

Management Implications
One of the difficulties in the management of Ficaria verna (lesser celandine) is the lack of information about its basic biology and demography; it is a difficult task to manage a species that is not fully understood. This spring ephemeral reproduces primarily via bulbils, an unusual method of asexual reproduction. Invasive plants such as F. verna often display large variations in reproductive output, which can make management prioritization difficult. A lack of knowledge of F. verna reproductive output and population growth limits our ability to prioritize management based on which environments are most susceptible to invasion.
Soil characteristics appear to play a large role in driving the population performance of F. verna and should be considered to help prioritize the allocation of resources for management. Significant negative relationships were found in this study between F. verna abundance and reproduction and percent sand, possibly driven by low soil moisture. Low-slope areas are also likely to have more F. verna. These characteristics can be used to identify high-risk populations for immediate management. Management will be most effective in combating population spread by targeting sites where high reproductive output is likely.
In addition to reproductive potential, it is also important to consider where spread is most likely to occur. Areas close to a river are extremely important with regard to population spread and may also require management. While F. verna abundance and reproduction generally were not highest near the river, there was still considerable bulbil production right at the river, where flooding is likely to transport bulbils, which remain on the soil surface after the plant dies back. Overall, the highest-priority sites for management are in floodplains with less sandy soils and a low slope gradient.
It is imperative to gain a greater understanding of this perennial in order to more efficiently manage and control its spread. Because F. verna is not well established at this point in all areas, effective management could still prevent it from becoming widely established, at which point management costs and control efforts would increase considerably. Moreover, it appears that native communities can recover to some extent following F. verna removal (J. Hillmer, personal communication). Management should focus efforts on reducing the spread by focusing on two key areas: areas where F. verna is likely to grow well, and areas likely to be a source for future spread, such as near rivers that flood regularly. In less-invaded areas, soil and elevation maps could be used to prioritize certain populations for management or predict critical areas that may be suitable for and susceptible to F. verna invasion in future.
Introduction
Because resources to manage invasive plants are limited, managers are tasked with prioritizing management efforts. Early recognition and removal of potentially harmful species are incredibly important for effective control of invasions. The longer an invasion persists, the more difficult and costly it is to manage, requiring increasing amounts of resources and effort (Hobbs and Humphries Reference Hobbs and Humphries1995). Invasive plants are not always harmful in all environments, and being able to identify the most susceptible environments for invasion is crucial for focused management and control efforts (Roxburgh et al. Reference Roxburgh, Shea and Wilson2004). Therefore, to manage invasive plants more effectively, we need a greater understanding of their ideal habitats, dispersal mechanisms, and interactions with the local environment.
Soil characteristics can strongly impact plant communities and species performance. For example, soil pH can influence the availability of plant nutrients considerably and can limit plant growth, especially under increasing acidity (Kidd and Proctor Reference Kidd and Proctor2001). Soil variables may influence invasive and native plants in a similar way, yet the intensity of influence varies by species (Porazinska et al. Reference Porazinska, Bardgett, Blaauw, Hunt, Parsons, Seastedt and Wall2003). Variation in the influence of soil characteristics on plants can make generalizing and predicting trends very difficult (Porazinska et al. Reference Porazinska, Bardgett, Blaauw, Hunt, Parsons, Seastedt and Wall2003). As we better understand the underlying mechanisms of invasion and its consequences, we are better able to detect threats and protect native ecosystems.
Beyond the species-specific requirements of particular invasions, some areas are more susceptible to invasion in general than others, especially areas of high disturbance. Roads, for example, have strong associations with invasion, as they provide a means for long-distance transportation (Mortensen et al. Reference Mortensen, Rauschert, Nord and Jones2009). River flooding can drastically alter the landscape, and disturbances have been shown to influence the species richness of riparian plants (Lite et al. Reference Lite, Bagstad and Stromberg2005). Disturbances also create opportunities for invasive plans to capitalize on available resources, including open space. For example, the prolific spread of Japanese knotweed (Reynoutria japonica Houtt.) and reed canary grass (Phalaris arundinacea L.) has been aided by changes in disturbance regimes that alter competitive interactions and resource availability in favor of alien species, resulting in reduced native plant diversity and abundance (Jose et al. Reference Jose, Singh, Batish and Kohli2013). Many invasives grow along transport-disturbance corridors such as roads and river systems, and managers need a better understanding of plant reproduction in such environments, which likely drive regional spread.
Spring ephemeral plant communities are under increasing threat from invasive plant species and are often outcompeted to critically low levels (Axtell et al. Reference Axtell, DiTommaso and Post2010). In river valleys in the northeastern and Pacific Northwest regions of the United States, a threat to native communities has emerged, lesser celandine [Ficaria verna (Huds.), syn: Ranunculus ficaria L.; Ranunculaceae]. It is a spring ephemeral itself, which is unusual for an invasive, because it disappears for parts of the year, potentially facilitating the growth of other plants. Ficaria verna can form dense monocultures, threatening local biodiversity (Axtell et al. Reference Axtell, DiTommaso and Post2010; Swearingen Reference Swearingen2005). Its presence has been associated with an increase in pollinator visits to two native spring ephemerals, narrowleaf spring-beauty (Claytonia virginica L.) and cutleaf toothwort [Cardamine concatenata (Michx.) Sw.], but invaded plots ultimately had decreased seed set of both native plants (Masters and Emery Reference Masters and Emery2015b). Ficaria verna presence can also lead to decreased biomass and recruitment of nearby competitors such as grass species (Masters and Emery Reference Masters and Emery2016).
Flooding events and river systems likely play an important role in explaining the spread of this invasive species through transportation and deposition of propagules. While F. verna can be found on steeper, drier slopes and in sunny spots with low canopy cover, there is evidence that it prefers moist floodplain in shaded areas, with higher levels of disturbances (Axtell et al. Reference Axtell, DiTommaso and Post2010). These conditions are common at intermediate distances from rivers. Because F. verna dies back early in the growing season, its presence on steeper slopes could lead to more soil erosion later in the year.
The aim of this study was to examine the relationship between site characteristics and the abundance and reproductive output of F. verna along a disturbance gradient away from a river. To accomplish this, biomass, reproductive output, and site characteristics were measured at various infested sites along the Rocky River in northeastern Ohio, USA. An additional larger-scale study was conducted examining F. verna abundance and reproduction along a longer portion of the river without specifically targeting infested areas. Soil texture, nutrient availability, and slope were hypothesized to play an important role in determining successful F. verna populations. We also hypothesized that F. verna abundance and reproduction would be highest at intermediate distances from the river.
Materials and Methods
Study Species
Ficaria verna is native to Europe and parts of Asia and is mainly found in floodplains and wetland lowlands; it can also be found in drier, woodier highlands. Ficaria verna has an early, yet brief growing season; it germinates in spring around March and April, or sometimes even earlier under the snow in winter, and top growth completely dies back in the early summer around June and July (Axtell et al. Reference Axtell, DiTommaso and Post2010). In northeast Ohio, we have observed bulbil germination as early as December (although growth is halted when covered by snow). During senescence around late June, large portions of land are left barren, making them susceptible to invasion by a host of weedy species (Axtell et al. Reference Axtell, DiTommaso and Post2010). Ficaria verna is not as palatable as its competitors for many herbivores, which contributes to its competitive advantage (Axtell et al. Reference Axtell, DiTommaso and Post2010).
Ficaria verna may be a particularly successful invasive due to its multiple reproductive strategies; besides forming seeds, it also produces tubers and aboveground bulbils. Under intermediate disturbance, F. verna invests more heavily in the production of seeds (Jung et al. Reference Jung, Bohning-Gaese and Prinzing2008). When resources are not readily available for sexual reproduction, asexual bulbils are produced in place of seeds, and in some cases, the amount of bulbils produced is inversely related to the amount of seeds produced (Arizaga and Ezcurra Reference Arizaga and Ezcurra1995). Because the invasion is thought to have started from a deliberately planted patch in one landowner’s property, the Rocky River populations may be clones incapable of sexual reproduction. This may lead to further selection for traits that decrease sexual fertility (Barrett Reference Barrett2015). Not all subspecies of F. verna produce tubers, which are another important dispersal mechanism with high germination rates (Kertabad et al. Reference Kertabad, Mohassel, Mahalati and Gherekhloo2013), but in our study, only Ficaria verna ssp. bulbifer, was present in the survey area.
Ficaria verna–focused Transect Study (2015 and 2016)
Ficaria verna biomass and seed, bulbil, and tuber production rates were examined along the river valley of the Rocky River Reservation in the Cleveland Metroparks in Cleveland, OH (41.40902°N, 81.88399°W). The Rocky River Reservation was chosen because it has the highest infestation of F. verna in Cuyahoga County (Cleveland Metroparks Invasive Plant Atlas Reference Hillmer and Garman2016). In 2008, the Rocky River Reservation had more than 183 acres of F. verna where cover was greater than 50% (Mack Reference Mack2008). This reservation provides a large array of recreational services from hiking trails and picnic sites to golf courses. It mainly consists of floodplain deciduous forests, wetlands, and meadow with a variety of wildlife and bird species year-round. The dominant tree species include willow (Salix spp.), American sycamore (Platanus occidentalis L.), American beech (Fagus grandifolia Ehrh.), and maple (Acer spp.).
Six sample sites were selected in 2015, with an additional two sites added in 2016, spanning a portion of the Rocky River, to explore abundance and reproductive outputs while ensuring varying site characteristics. Sites were selected in floodplains with an F. verna population extending at least 25 m away from the river, as is common along this watershed, while attempting to mitigate any anthropogenic disturbances such as trails or paths as much as possible. There were often anthropogenic alterations around 10- to 20-m quadrats away from the river, in the form of hiking trails or footpaths, throughout the Rocky River Reservation. Sample sites had no management applied in the last 2 yr.
Experimental Design
A transect was set up perpendicular to the river at each of the six sites in 2015, starting from the vegetation nearest the riverbank and extending away from the river, to represent a disturbance (flooding) gradient. In early May, midway through the growing season, 20 by 20 cm quadrats were set up along each transect at 0, 5, 10, 15, 20, and 25 m away from the stream bank to evaluate the F. verna aboveground biomass, stem density, and reproductive output (bulbil and tuber production). Within each of these quadrats, 10 plants were removed at coordinates selected using a random number generator. Bulbils were counted and weighed, and the length of each plant removed was measured. The total number of stems within each quadrat was then quantified to estimate density. In addition to the 10 individual plants sampled, once bulbils had fully formed, 10 additional plants per quadrat were selected at random from each quadrat for destructive sampling to quantify biomass and bulbil and tuber production. The average aboveground plant biomass was calculated for the 10 randomly removed stems, which were dried for 2 d at 60 C in a drying oven (Fisher Scientific, Waltham, MA) before being weighed.
In 2015, the populations at some sites extended beyond 20 to 25 m; we therefore extended the transect length by 10 m in 2016 and resampled all sites to gain a greater understanding of the plant dynamics at distances farther from the Rocky River. Two additional sample sites were also added, following the same site-selection process as in 2015, with an additional goal to include sites south of Site 1.
Site Characteristics
Distance from the river, PAR, soil characteristics (pH, percent moisture, and nutrient analysis), slope, and aspect were recorded at each site. PAR measurements were taken in late April during the peak growing season (Apogee Instruments, Logan, UT), as close to noon as possible on a cloudless day. In April 2016, two 15-cm soil cores were also taken from each quadrat; soil moisture content was measured for each sample in the lab. Soil texture (particle-size analysis) was also investigated using the hydrometer method (Gee and Bauder Reference Gee and Bauder1979). Nutrient analyses involving phosphorus, potassium, calcium, magnesium, CEC, pH, lime test index (a measure of reserve acidity), and total nitrogen were performed by the STAR laboratory at the Ohio State University. Due to additional costs associated with testing, nitrate nitrogen levels were only assessed for every other quadrat along the transect.
2016 Large-Scale Survey
A larger-scale survey was conducted to gain more insight into the impact of site characteristics on F. verna presence and performance without bias toward sites with F. verna present. The random point generator in ArcMap v. 10.3.1 (Environmental Systems Research Institute, Redlands, CA, USA) was used to identify 30 random sample points along the river.
At each sample site, a 30-m transect was set up as close to the randomly generated point as possible, perpendicular to the river (avoiding large fallen trees, paths, or any other major impedance on transect.) Sampling was conducted at the 0-, 15-, and 30-m marks along the 30-m transect, representing close, intermediate, and far distances from the river. In some sites, due to the presence of steep cliffs, there were no 15- and 30-m plots available. Ficaria verna percent cover and above ground biomass were measured at each of the three distances from the river. We used 2 by 2 m for estimating percent cover based on visual percentage estimates and for categorization according to Daubenmire’s (Reference Daubenmire1959) cover classes: 0% to 5%, 5% to 25%, 25% to 50%, 50% to 75%, 75% to 95%, and 95% to 100%. Ficaria verna aboveground biomass was collected from 50 by 50 cm quadrats at each sampling location, dried in a drying oven for 2 d, and weighed. Site characteristics measured include canopy cover, slope angle, and aspect. PAR was measured at each plot along the transect.
Analysis
Generalized linear mixed-effect models were used to analyze the data, and all analyses were conducted in R, using the lme4, lmerTest, and MASS packages (Bates et al. Reference Bates, Maechler, Bolker and Walker2015; Kuznetsova et al. Reference Kuznetsova, Brockhoff and Christensen2017; R Development Core Team 2011; Venables and Ripley Reference Venables and Ripley2002). The results were similar in both years, and the analyses presented here focus on the 2016 data, which involved surveying two additional sites and longer transects. Site was included as a random factor in all final models for both surveys.
In the F. verna–focused transect survey, the following response variables were all analyzed separately: plant biomass, the number of stems per square meter, and the average number of bulbils and tubers per plant. Initially, linear mixed-effect models were fit using lmer; however, in several cases, diagnostic plotting indicated strong heteroscedacity. Log transformations were applied for plant biomass and for count or count-like data, Poisson/quasipoisson regression models were fit using glmmPQL from the MASS package.
To test whether there was a relationship between the plant response variables and the distance of plots from the river, we conducted ANOVAs with the distance classes as a categorical variable (due to expected nonlinear increase with distance). Because the distance from the river was likely related to changes in environmental variables, especially soil characteristics, we assessed the relationship between site variables and F. verna abundance and reproduction in separate models. The following environmental variables were initially considered: PAR, soil pH, percent soil moisture, P, K, N, Ca, Mg levels, CEC, and soil texture (percent sand, silt, and clay). Multicollinearity was detected in the soil variables using correlation tests and by examining variance inflation factors. Percent sand was chosen as the most likely important soil texture variable in this system, as F. verna generally requires moist soils. As expected, sand was inversely correlated with nitrogen and lower soil moisture. CEC was chosen to represent all the base cations together. The remaining environmental variables were PAR, soil pH, log-transformed P, CEC, and percent sand. In models involving just these variables, variance inflation factors were all below the recommended level of 4 (Zuur et al. Reference Zuur, Ieno, Walker, Saveliev and Smith2009).
Following the approach of Zuur et al. (Reference Zuur, Ieno, Walker, Saveliev and Smith2009), full models were fit using all the candidate variables, and graphical analysis, including diagnostic plots of residuals versus each explanatory factor, was used to determine whether two-way interactions were needed in the models. Individual explanatory variables were then dropped one by one in a sequential hypothesis-testing approach to determine final models. For linear regressions, the model-selection process was performed using models fit with maximum-likelihood estimation, and final models were then fit using restricted maximum-likelihood estimation (Zuur et al. Reference Zuur, Ieno, Walker, Saveliev and Smith2009). Models were validated by plotting residuals against fitted values and by examining Q–Q plots of the residuals to assess model homogeneity of variances and normality. We also examined the pattern in the residuals versus all explanatory variables. If the simplified model had poorer fit, then the last dropped variable was included in the final model, even if not statistically significant.
In the large-scale study, because the design was not specifically targeted at known F. verna populations, logistic regression was first used to model F. verna presence/absence, including plots with no F. verna present. For plots with F. verna present, we modeled the percent cover of F. verna as a function of distance from the river and broader-scale environmental variables, using Poisson regression. We then modeled F. verna biomass, which again required log transformation due to strong nonhomogeneity of variance. The candidate explanatory variables were distance from the river (0, 15, 30 m), slope, aspect, PAR, and canopy cover. As before, distance from the river was treated as a categorical variable to allow for possible nonlinear response. Slope and PAR required log transformation. Aspect was transformed to two variables, southness and eastness, ranging from −1 to 1. No multicollinearity was detected between these response variables using graphical analysis or examination of variance inflation factors.
Results and Discussion
Ficaria verna–focused Transect Survey
Ficaria verna abundance and reproduction were variable between sample sites during both years of field observations (coefficient of variation for the number of F. verna stems m−2 = 54.9, coefficient of variation for F. verna biomass = 75.6). Densities of F. verna were found to be as high as 11,425 plants m−2 in some areas, with an overall mean of 2,772 plants m−2 (maximum = 11,425, median = 2,412). This maximum was an outlier, with a large number of small F. verna plants. The number of F. verna stems per square meter was significantly negatively related to percent sand, t = −2.61, df = 52, P = 0.012, slope = −0.01; Figure 1). The final model also included a nonsignificant positive relationship with log-transformed soil phosphorus (t = 1.74, df = 52, P = 0.088, slope = 0.15) and a nonsignificant negative relationship with CEC (t = −1.611, df = 52, P = 0.11, slope = −0.026; Figure 2).

Figure 1. The relationship of Ficaria verna performance to percent sand. In the Ficaria verna–focused survey, stem density (upper left) had a significant negative relationship with stem density (P = 0.012); however, the relationship with plant biomass (upper right) was not significant (P = 0.081). The average numbers of bulbils per plant (lower left) had a significant negative relationship with percent sand (P = 0.012), as did the average number of tubers per plant (lower right, P = 0.009). Lines shown are regression lines from the fitted model for statistically significant relationships.

Figure 2. The relationship of Ficaria verna performance and CEC. In the F. verna–focused survey, there was a nonsignificant negative relationship with stem density (upper left, P = 0.11), and a significant negative relationship with plant biomass (upper right, P = 0.037), as well as a significant interaction of pH and CEC. CEC was not included in the final model with average bulbils, due to a lack of a significant relationship, but it did have a significantly negative relationship with the average number of tubers produced (lower right, P = 0.024). Lines shown are regression lines from the fitted model.
For plant biomass, there was a significant negative effect of CEC (F(1, 57.3) = 4.57, P = 0.037), and a significant interaction of pH and CEC (F(1, 57.0) = 4.91, P = 0.031). The final model also included pH (F(1, 57.8) = 3.80, P = 0.056), percent sand (F(1, 57.34) = 3.14, P = 0.081), and an interaction between percent sand and pH (F(1, 57.7) = 3.13, P = 0.082), although these were only marginally significant.
Of the plants sampled over the 2 yr, 31% produced bulbils. Bulbil production ranged from 0 to as high as 18 per plant (overall mean = 2.9). Average bulbil production (averaged over 10 plants) ranged from 0 to 6.1 per stem (mean = 1.3, median = 0.95). Bulbils had an average length of 3.93 mm and an average mass of 0.0101 g. The average number of bulbils produced per plant was significantly negatively related to percent sand (t = −2.27, df = 55, P = 0.027, slope = −0.012).
Tuber presence ranged from 1 to as high as 11 tubers per plant (mean = 2.4, median = 2.2, SE = 0.093). The average number of tubers present was 2.3 per plant, with an average tuber length of 7.9 mm and an average mass of 0.041 g. The average number of tubers produced per plant was significantly negatively related to percent sand (t = −2.71, df = 54, P = 0.009, slope = −0.0089) and negatively to CEC (t = −2.32, df = 54, P = 0.024, slope = −0.032). Interestingly, there was no seed production observed in any of the sample quadrats.
The distribution of F. verna was more sparse near the river (0-m quadrats), and then a dense monoculture was typically observed up to the 20-m quadrat. Beyond the 20-m quadrat, there appeared to be higher abundances of other species present. However, in the F. verna–focused transect survey, none of the response variables indicated significant relationships with the distance from the river (all P-values were greater than 0.05; Figure 3).

Figure 3. The relationship of Ficaria verna performance with distance from the river. Plant abundance and reproduction in the F. verna–focused survey was variable as a function of distance to the river, and the median was generally lower close to the river, and to some extent farther from the river. None of the metrics of F. verna abundance and reproduction had significantly different means at different distances.
A few sites had a dense mat of F. verna extending beyond the farthest quadrat (25 m), primarily in locations consisting of a well-established, successful population of F. verna. Sites with a gentle gradient more often had extended populations beyond the length of the established transect. Sites that rapidly increased in gradient beyond the transect typically also declined in the cover of all vegetation, not just F. verna, and steep slopes are often common features throughout river valleys due to erosion over time.
Large-scale Transect Survey
Ficaria verna was present in 75% of the random plots surveyed, and present with more than 10% cover in 53% of plots. Ficaria verna presence was significantly related to slope (z = −2.007, P = 0.045, slope = −0.078) but not to distance from the river (15 m: z = −0.57, P = 0.569, slope = −0.398; 30 m: z = 1.30, P = 0.193, slope = 1.29).
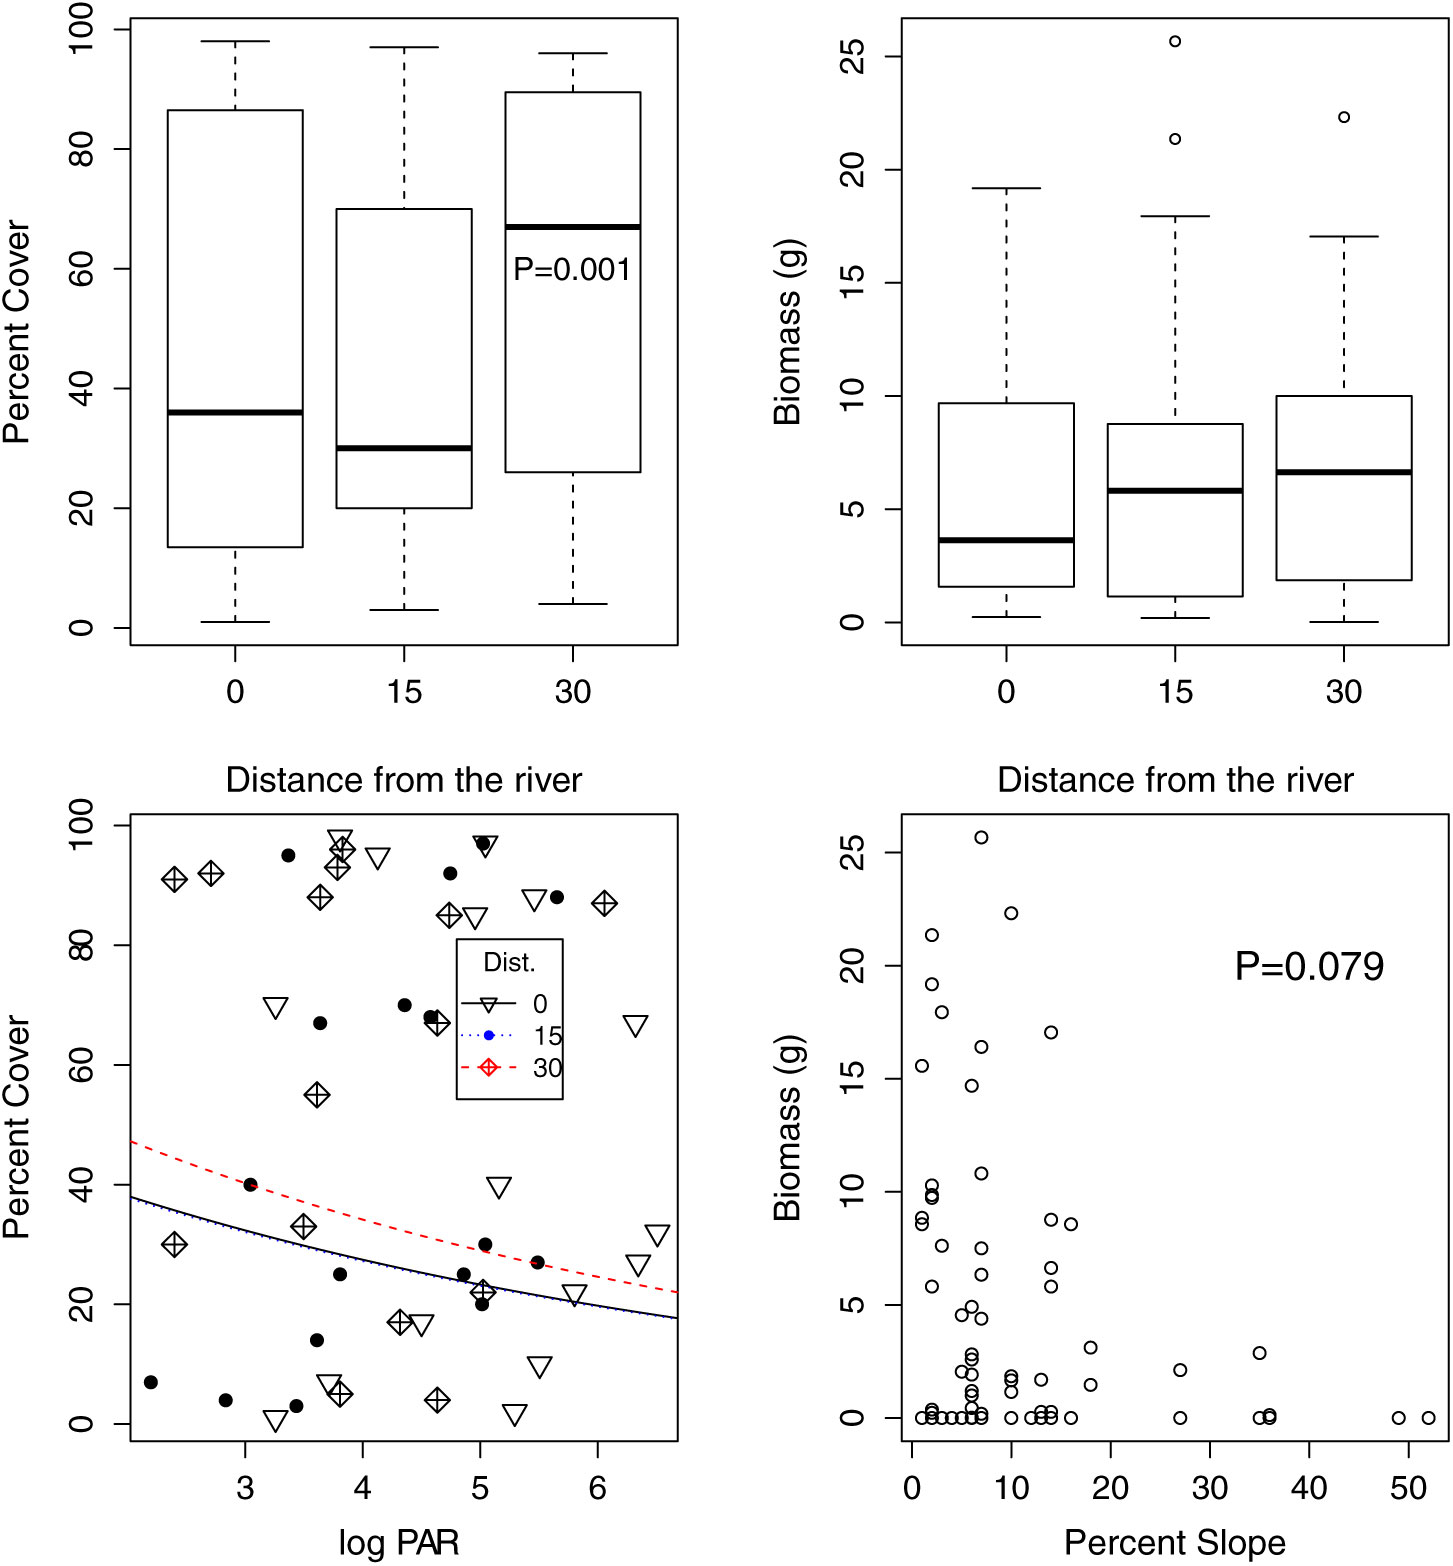
In plots with F. verna present, percent cover in the large-scale survey was significantly higher at 30 m than at 0 m (z = 3.77, P < 0.001, slope = 0.218; Figure 4) and significantly negatively related to light availability (z = −5.22, P < 0.001, slope = −0.164). Plant biomass maxima were generally found at locations of low slope gradients of below 10°. The model of F. verna biomass included nonsignificant relationships with distance from the river (F(2, 33.9) = 0.0036, P = 0.997) and a nonsignificant negative relationship with log-transformed slope (t = −1.82, df = 28.15, P = −0.079, slope = −0.486).

Figure 4. Ficaria verna abundance and reproduction in the large-scale survey. Ficaria verna percent cover was higher 30 m from the river (upper right, P = 0.001) and was lower where PAR was higher (lower left, P<0.001). The regression lines in the lower left panel show the relationship between percent cover and PAR separately for the three distances from the river; the 30-m-distance line has higher percent cover, while the 0- and 15-m lines are nearly indistinguishable. Plant biomass was not significantly higher farther from the river, and the final model included a nonsignificant relationship between slope and biomass (P = 0.079).
The Relationship of Ficaria verna Abundance and Reproduction with Distance and Environmental Variables
Soil characteristics are important driving forces behind F. verna success, with significant negative relationships found between F. verna abundance and reproductive output and percent sand and in some cases also with CEC. We found relatively consistent relationships with percent sand across the response variables, and this result may be driven by the fact that lower percent sand is associated with higher soil moisture. Although percent sand and CEC are often negatively related to each other, in our study, they were only weakly related to each other, perhaps because soil organic matter is also important in determining CEC. We were unable to simultaneously test correlated variables; soil moisture and nitrogen were inversely correlated with percent sand and were not a focus of our analyses. Higher performance in less sandy soils may also be due to elevated calcium levels; soil calcium has been linked to increased F. verna abundance and reproduction, as it has for several other invasive species (Harrison Reference Harrison1999; Howard et al. Reference Howard, Gurevitch, Hyatt, Carreiro and Lerdau2004).
While some sites did have higher F. verna abundance and reproduction at intermediate distances, as indicated by higher maximal values at intermediate distances, overall, we did not observe significantly higher F. verna abundance and reproduction at intermediate distances. One possible reason is that flooding from the river was not the only major disturbance at several sites. There were several trails and swales that generally occurred around the 10- to 20-m quadrats, and these tended to have poor plant performance. Anthropogenic disturbances were avoided as much as possible, yet the Rocky River Reservation is well frequented by the public, making certain disturbances unavoidable. This resulted in some intermediate distance plots also experiencing high levels of disturbance.
Soil pH was not in most final models due to a lack of strong relationships with F. verna abundance and reproduction, but there was a negative relationship between soil pH and plant biomass that was marginally significant, (P = 0.056). This result was unexpected, because generally, F. verna performance appeared to be higher at higher pH values. It may be that some of the pH levels in our study were higher than F. verna would prefer. According to previous work, F. verna requires a pH range of 4.4 to 6.9 (Axtell et al. Reference Axtell, DiTommaso and Post2010). The F. verna populations during the 2-yr observational study were found growing in soils with pH levels from 4.49 to 7.35. This elevated pH range may be attributed to the parent rock material in the Cleveland area, which can result in soil pH above 7.0. In general, higher-pH areas are considered to be at greater risk of invasion (Tsui et al. Reference Tsui, Chen and Hsieh2004). Increasing soil acidity allows for increased availability of phosphorous uptake, yet alkaline elements such as potassium, magnesium, calcium, and sodium are lost (Kidd and Proctor Reference Kidd and Proctor2001).
Although PAR was not strongly associated with higher F. verna abundance and reproduction in the F. verna–focused survey models, percent cover had a negative relationship with light in the large-scale study. Ficaria verna is most often found in shaded sites and less commonly found in full sun on open ground, unless soil moisture levels are sufficient (Axtell et al. Reference Axtell, DiTommaso and Post2010). Too much direct sunlight may also lead to withering in populations, and thus slightly shaded areas seemed to lead to more vigorous populations in the field.
Slope had a significantly negative relationship with percent cover. It was clear in field sites that, although F. verna can be found on very steep slopes, the plant population is increasingly sparse and patchy with increasing gradients. Steep slopes generally have dry, shallow soils, and F. verna prefers moist, fertile floodplain (Axtell et al. Reference Axtell, DiTommaso and Post2010). Invasive plants typically occur most frequently on flatter slopes, along with other herbaceous plant species (Underwood et al. Reference Underwood, Klinger and Moore2004).
Additionally, several of our candidate variables did not have a close enough relationship to F. verna abundance and reproduction to be included in any final models. For example, in the large-scale survey, aspect (southness and eastness) was not included in any final models. Similarly, canopy cover was also not in any final models. Canopy cover may be less important for F. verna performance, because its peak growing season occurs before leaf-out.
Variations in weather patterns from year to year can play a significant role in observational studies of this nature. Water-level fluctuations can influence effects on plant abundance and reproduction, allowing some plant species to thrive in areas of high-frequency flooding while restricting others to higher elevations (Leyer Reference Leyer2005; Van Eck et al. Reference Van Eck, Van de Steeg, Blom and De Kroon2004). There were large temperature and precipitation differences from 2015 to 2016; the 2015 winter was significantly more severe, with temperatures reaching much colder levels with greater amounts and sustained snow and ice cover. The cold winter rebounded sharply into a warmer spring to summer transition in comparison to 2016, causing sharp and erratic flash floods after ice melt in 2015, potentially spreading the F. verna propagules to a greater degree. We observed similar plant biomass with higher densities and bulbil counts in 2016 than in 2015. Ficaria verna prefers cooler growing conditions and starts to senesce, with tubers delaying their growth, when temperatures consistently hit or exceed 20 C (Kertabad et al. Reference Kertabad, Mohassel, Mahalati and Gherekhloo2013). This implies that weather conditions may have played a large role in the increased reproductive output in 2016. In general, spring ephemerals prefer cooler growing conditions, which result in longer leaf longevity (Badri et al. Reference Badri, Minchin and Lapointe2007; Yoshie Reference Yoshie2008).
Although our study did not focus on leaf litter, variable leaf litter depths are common to riparian corridors due to the variation in flooding frequency and intensity (Masters and Emery Reference Masters and Emery2015a). While a lack of litter and deep litter both decreased F. verna biomass, bulbil production was not different across treatments, and seed production only decreased in deep litter of 20 cm (Masters and Emery Reference Masters and Emery2015a). This maintenance of reproductive output across a variety of leaf litter depths may provide an advantage over native species competing for resources (Masters and Emery Reference Masters and Emery2015a).
During the 2-yr observational study in Rocky River Reservation, F. verna produced no seeds in our study plots, and we only observed a few plants outside the study transects producing seeds. This suggests that F. verna populations in Rocky River do not rely heavily on sexual reproduction. Resource allocation in this invasive favors asexual reproduction through high production of tubers and aboveground bulbils. Vegetative diaspores have been hypothesized to be physiologically advantageous during germination (Jung et al. Reference Jung, Bohning-Gaese and Prinzing2008). This may be a more effective method for dispersal, as germination rates have resulted in higher percentages for bulbils than seeds, with 81% germination for bulbils in comparison to 71% germination for polyploid seeds and 18% for diploid seeds (Marsden-Jones Reference Marsden-Jones1935). One drawback of investment into tubers and bulbils is the high resource cost needed to produce the large structures, yet field observations show that this strategy does lead to large infestations of F. verna.
The degree to which F. verna produces seeds, bulbils, and tubers is variable and may depend on which subspecies is present. Bulbils are thought to have evolved in response to limited pollinator visitations in moist habitats mainly caused by a shady living environment (Deng et al. Reference Deng, Kim, Zhang, Zhang, Li, Nie and Sun2013). It appears that bulbil germination rates by the end of the year are extremely high, indicating little innate dormancy in the field. Due to trade-offs in resource allocation, an increase in clonal investment is linked with decreased allocation to sexual reproduction (Barrett Reference Barrett2015). Extensive vegetative dispersal and clonal growth can negatively impact the functioning of sexual polymorphisms, which can relate to single mating groups with consequential effects on mating and fertility (Barrett Reference Barrett2015). Sexual dysfunction and loss of sexual reproductive ability can result from populations in which clonal propagation is the dominant form of dispersal, which aids mutations that decrease fertility (Barrett Reference Barrett2015).
In conclusion, management will be most effective in combating F. verna populations by targeting sites where high reproductive output, most often in the form of bulbils, is likely. Soil characteristics appear to play a large role in driving population performance and should be considered to help prioritize the allocation of resources for management. Besides reproductive potential, it is also important to consider where spread is most likely to occur. Areas close to the river are extremely important with regard to population spread and may also require management. Overall, the highest-priority sites are in floodplains with less sandy soils and a low slope gradient.
Acknowledgments
Jennifer Hillmer, Patrick Lorch, Julie Wolin, and Pete Clapham contributed helpful insights to this project. Megan Palfalvi, Dolly Funk, Rene Kizys, Morgan Moscarillo, Allison Paolucci, Kevin Darragh, Robin Hajek, Daniel Khanin, and Alix Kosmala assisted with field and lab work. JPK wishes to acknowledge funding from the Ohio Invasive Plants Council. No conflicts of interest have been declared.