1. Introduction
Ultramafic rocks are dispersed in suture zones and orogenic belts as the basal sections of ophiolite complexes. They provide important information about melting, melt extraction processes and melt–rock interactions in the upper mantle (Zhou et al. Reference Zhou, Robinson, Malpas, Edwards and Qi2005; Dilek, Furnes & Shallo, Reference Dilek, Furnes and Shallo2007; Eyuboglu, Santosh & Chung, Reference Eyuboglu, Santosh and Chung2011). Thus, geochemical data from peridotites and their constituent minerals can be used to characterize the origin and tectonic setting of ophiolitic rocks (Melcher et al. Reference Melcher, Meisel, Puhl and Koller2002; Karipi, Tsikouras & Hatzipanagiotou, Reference Karipi, Tsikouras and Hatzipanagiotou2006; Choi, Shervais & Mukasa, Reference Choi, Shervais and Mukasa2008; Aldanmaz et al. Reference Aldanmaz, Schmidt, Gourgaud and Meisel2009; Pagé, Bédard & Tremblay, Reference Pagé, Bédard and Tremblay2009; Pearce & Robinson, Reference Pearce and Robinson2010; Ulrich et al. Reference Ulrich, Picard, Guillot, Chauvel, Cluzel and Meffre2010). Peridotites may show surprisingly diverse variations (Parkinson et al. Reference Parkinson, Pearce, Thirlwall, Johnson and Ingram1992; Parkinson & Pearce, Reference Parkinson and Pearce1998; Pearce et al. Reference Pearce, Barker, Edwards, Parkinson and Leat2000), as they can range from relatively fertile peridotites to depleted restites that form after the extraction of large volumes of melt fraction (>20%) under hydrous conditions (Jean et al. Reference Jean, Shervais, Choi and Mukasa2010; Uysal et al. Reference Uysal, Ersoy, Karslı, Dilek, Sadıklar, Ottley, Tiepolo and Meisel2012).
The Iranian Plate is a tectonically active region within the Alpine–Himalayan orogenic belt that is squeezed between the Afro-Arabian Plate in the southwest and the Eurasian Plate in the north. It is divided into several structural zones (Fig. 1) (Stöcklin, Reference Stöcklin1968). Within the Iranian Plate, a main remnant of oceanic basement is from the Neo-Tethys Ocean. The Neo-Tethys Ocean opened from the Late Carboniferous to Permian (Berberian & King, Reference Berberian and King1981; Davoudzadeh & Schmidt, Reference Davoudzadeh and Schmidt1984; Ricou, Reference Ricou1994; Besse et al. Reference Besse, Torcq, Gallet, Ricou, Krystyn and Saidi1998; Mohajjel, Fergusson & Sahandi, Reference Mohajjel, Fergusson and Sahandi2003), as Cimerian continental fragments rifted from the northern margin of Gondwana. Oceanic crust developed along this fracture, and the subduction of this oceanic crust began during the Late Triassic to Early Jurassic (Berberian & King, Reference Berberian and King1981; Davoudzadeh & Schmidt, Reference Davoudzadeh and Schmidt1984; Ricou, Reference Ricou1994; Besse et al. Reference Besse, Torcq, Gallet, Ricou, Krystyn and Saidi1998; Mohajjel, Fergusson & Sahandi, Reference Mohajjel, Fergusson and Sahandi2003; Davoudian et al. Reference Davoudian, Genser, Neubauer and Shabanian2016). The Zagros orogenic belt is related to the opening and closure of the Neo-Tethys, and is divided into three units (Fig. 1): (1) the Urmia–Dokhtar magmatic arc (Fig. 1) was interpreted to be the product of the subduction of the Neo-Tethys oceanic slab beneath the central Iranian Plate. It records abundant Cenozoic magmatism, which is dominantly related to Eocene arc evolution (Berberian & King, Reference Berberian and King1981; Shahabpour, Reference Shahabpour2007; Omrani et al. Reference Omrani, Agard, Whitechurch, Benoit, Prouteau and Jolivet2008; Ghorbani & Bezanjani, Reference Ghorbani and Bezenjani2011; Verdel et al. Reference Verdel, Wernicke, Hassanzadeh and Guest2011; Ghorbani, Graham & Ghaderi, Reference Ghorbani, Graham and Ghaderi2014). (2) The Sanandaj–Sirjan zone (SNSZ), which extends from SE to NW Iran (Fig. 1), was an active margin from the Middle Jurassic to Late Cenozoic and includes many granitoid intrusive bodies (Baharifar et al. Reference Baharifar, Moinevaziri, Bellon and Pique2004; Agard et al. Reference Agard, Omrani, Jolivet and Mouthereau2005; Esmaeily et al. Reference Esmaeily, Nedelec, Valizadeh, Moore and Cotton2005; Davoudian et al. Reference Davoudian, Genser, Dachs and Shabanian2008; Aghazadeh et al. Reference Aghazadeh, Castro, Rashidnejad Omran, Emami, Moinevaziri and Badrzadeh2010; Azizi et al. Reference Azizi, Asahara, Mehrabi and Chung2011a, Reference Azizi, Najari, Asahara, Catlos, Shimizu and Yamamoto2015a; Mahmoudi et al. Reference Mahmoudi, Corfu, Masoudi, Mehrabi and Mohajjel2011; Azizi, Zanjefili Beiranvand & Asahara, Reference Azizi, Zanjefili Beiranvand and Asahara2015b; Azizi, Kazemi & Asahara, Reference Azizi, Kazemi and Asahara2017). (3) The Zagros fold-thrust belt, which consists of dismembered ophiolites and coloured mélanges, crops out along the Zagros suture zone at Neyriz and Esfandaghah in SW Iran and at Kermanshah and Piranshahr in W and NW Iran (Fig. 1). The ophiolites in the Zagros suture zone comprise relicts of Neo-Tethys oceanic lithosphere, which were finally emplaced during the closure of the ocean (Delaloye & Desmons, Reference Delaloye and Desmons1980; Desmons & Beccaluva, Reference Desmons and Beccaluva1983; Ghazi & Hassanipak, Reference Ghazi and Hassanipak1999; Dilek & Ahmed, Reference Dilek, Ahmed, Dilek and Robinson2003; Alavi, Reference Alavi2004; Allahyari et al. Reference Allahyari, Saccani, Pourmoafi, Beccaluva and Masoudi2010 Azizi et al. Reference Azizi, Hadi, Asahara and Mohammad2013; Saccani et al. Reference Saccani, Allahyari, Beccaluva and Bianchini2013; Shafaii Moghadam & Stern, Reference Shafaii Moghadam and Stern2015; Nouri et al. Reference Nouri, Azizi, Golonka, Asahara, Orihashi, Yamamoto, Tsuboi and Anma2016, Reference Nouri, Asahara, Azizi, Yamamoto and Tsuboi2017). The ophiolites in these belts are abundant and comprise various dismembered mafic–ultramafic assemblages that have suffered multiple phases of alteration and deformation. They display evidence of a variety of tectonic environments, ranging from a low degree of partial melting at a mid-oceanic ridge setting to a high degree of partial melting in an arc-related environment (Delaloye & Desmons, Reference Delaloye and Desmons1980; Ghazi & Hassanipak, Reference Ghazi and Hassanipak1999; Parlak, Höck & Delaloye, Reference Parlak, Höck and Delaloye2002; Dilek & Ahmed, Reference Dilek, Ahmed, Dilek and Robinson2003; Alavi, Reference Alavi2004; Allahyari et al. Reference Allahyari, Saccani, Pourmoafi, Beccaluva and Masoudi2010, Reference Allahyari, Saccani, Rahimzadeh and Zeda2014; Uysal et al. Reference Uysal, Ersoy, Karslı, Dilek, Sadıklar, Ottley, Tiepolo and Meisel2012, Reference Uysal, Ersoy, Dilek, Kapsiotis and Sarıfakıoğlu2016; Azizi et al. Reference Azizi, Hadi, Asahara and Mohammad2013; Saccani et al. Reference Saccani, Allahyari, Beccaluva and Bianchini2013; Saka et al. Reference Saka, Uysal, Akmaz, Kaliwoda and Hochleitner2014; Shafaii Moghadam & Stern, Reference Shafaii Moghadam and Stern2015; Ao et al. Reference Ao, Xiao, Khalatbari-Jafari, Talebian, Chen, Wan and Zhang2016; Nouri et al. Reference Nouri, Azizi, Golonka, Asahara, Orihashi, Yamamoto, Tsuboi and Anma2016, Reference Nouri, Asahara, Azizi, Yamamoto and Tsuboi2017).
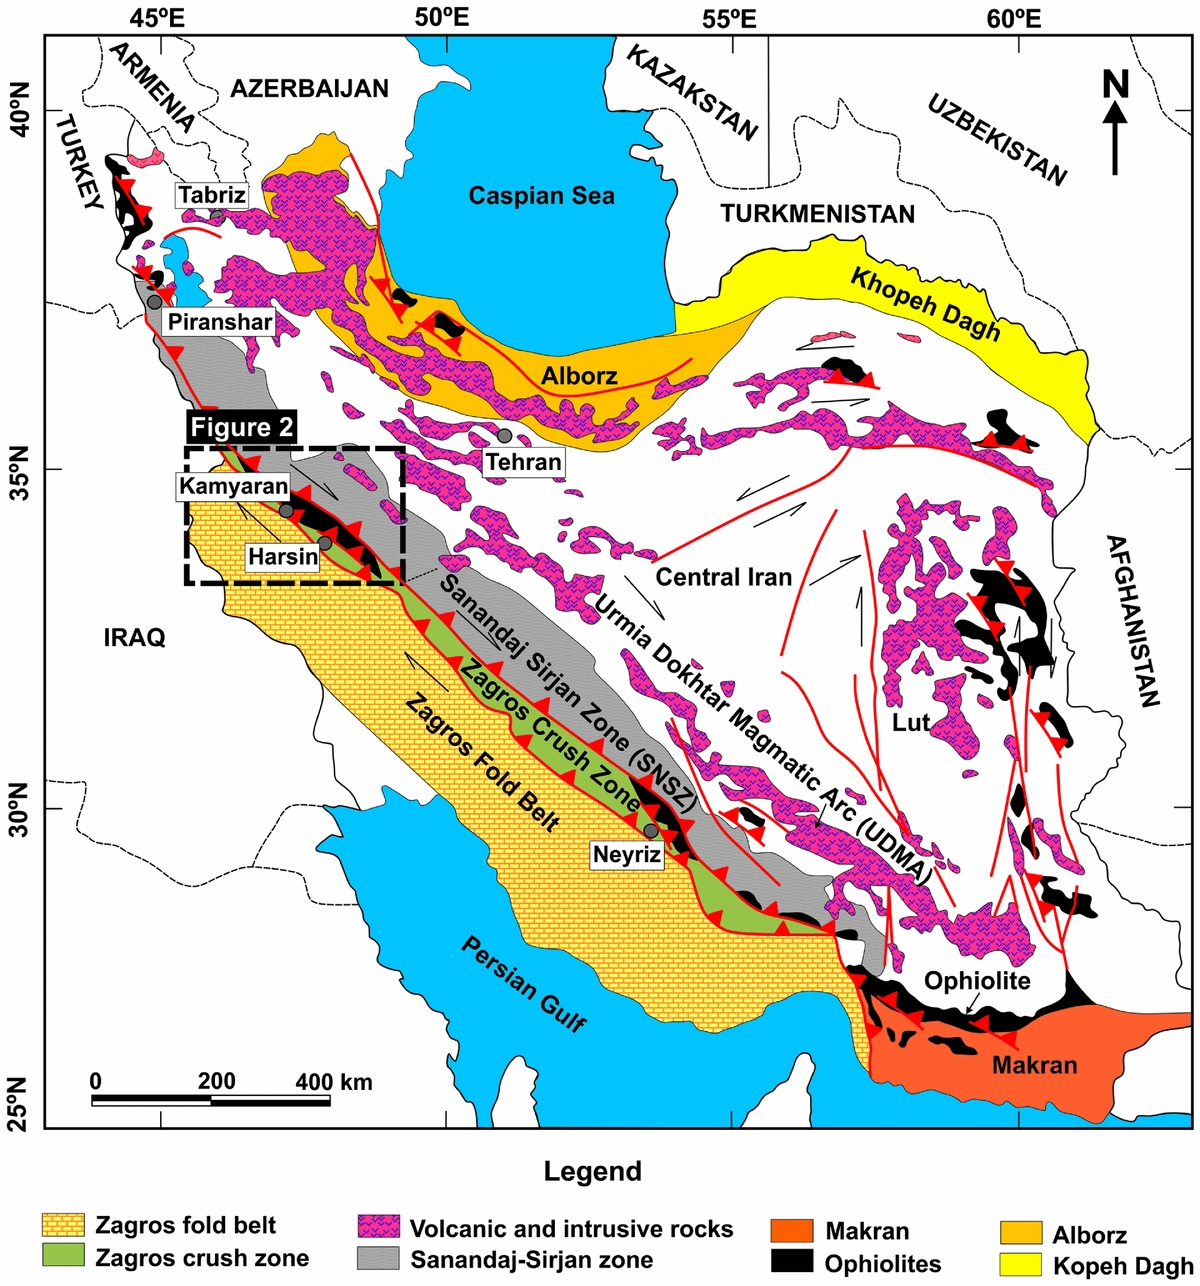
Figure 1. Simplified geological map of Iran (modified from Stöcklin, Reference Stöcklin1968).
The Harsin–Sahneh ophiolite complex in eastern Kermanshah contains spectacular ophiolites and is located between the Arabian and Iranian Plates. It mainly includes ultramafic and gabbroic rocks, with minor felsic rocks (Fig. 2). Allahyari et al. (Reference Allahyari, Saccani, Pourmoafi, Beccaluva and Masoudi2010) demonstrated that the depleted peridotites in the Harsin–Sahneh area were generated during oceanic spreading that formed an oceanic arc basin. Some researchers (Delaloye & Desmons, Reference Delaloye and Desmons1980; Desmons & Beccaluva, Reference Desmons and Beccaluva1983; Ghazi & Hassanipak, Reference Ghazi and Hassanipak1999; Saccani et al. Reference Saccani, Allahyari, Beccaluva and Bianchini2013) have suggested that the Harsin–Sahneh ophiolite formed at a mid-ocean ridge or in island arc basins, whereas others (Wrobel Daveau et al. Reference Wrobel Daveau, Ringenbach, Tavakoli, Ruiz, Masse and Frizonde Lamotte2010; Azizi et al. Reference Azizi, Hadi, Asahara and Mohammad2013; Saccani et al. Reference Saccani, Allahyari, Beccaluva and Bianchini2013; Nouri et al. Reference Nouri, Azizi, Golonka, Asahara, Orihashi, Yamamoto, Tsuboi and Anma2016, Reference Nouri, Asahara, Azizi, Yamamoto and Tsuboi2017) have argued that this zone formed in an undeveloped oceanic basin that was affected by a mantle plume. In the current study, we present mineral chemistry data, whole-rock geochemical and isotopic data and geochronological data from serpentinized peridotites in the Harsin–Sahneh area along the Zagros suture zone in the eastern region of Kermanshah to identify the origin of the ultramafic rocks by comparing them with previously published data from other ultramafic rocks. The origin and tectonic affinity of the Harsin–Sahneh peridotites (HSP) are unclear because few studies (Shahidi & Nazari, Reference Shahidi and Nazari1997; Allahyari et al. Reference Allahyari, Saccani, Pourmoafi, Beccaluva and Masoudi2010) have been performed on the HSP rocks and their original mineral assemblages have almost been eliminated due to the effects of serpentinization and tectonic activity. These new data are used to evaluate the formation processes (i.e. partial melting with subsequent metasomatism) and melt–rock interaction processes of the ophiolitic mantle peridotites in the Harsin–Sahneh area.

Figure 2. Simplified geological map of western Iran: Harsin area modified from Shahidi & Nazari (Reference Shahidi and Nazari1997), Miyanrahan area from Rafia & Shahidi (Reference Rafia and Shahidi2006), Kamyaran area from Sadeghian & Delvar (Reference Sadeghian and Delvar2006), Kermanshah area from Karimi Bavandpur & Hajihoseini (Reference Karimi Bavandpur and Hajihoseini1999) and Sonqor area from Eshraghi, Jafarian & Eshraghi (Reference Eshraghi, Jafarian and Eshraghi1996). The surrounding broken line shows the Harsin area, and sampling locations are indicated.
2. Regional geology and field relationships
The Harsin–Sahneh ophiolite complex is located between the cities of Harsin and Sahneh in eastern Kermanshah, which is located in the western region of Iran (Fig. 2). This area mainly consists of Biston sedimentary rocks, Cretaceous ophiolitic rocks, Eocene gabbro and volcano-sedimentary rocks and Late Cretaceous granites (Braud, Reference Braud1978; Delaloye & Desmons, Reference Delaloye and Desmons1980; Desmons & Beccaluva, Reference Desmons and Beccaluva1983; Shahidi & Nazari, Reference Shahidi and Nazari1997; Ghazi & Hassanipak, Reference Ghazi and Hassanipak1999; Allahyari et al. Reference Allahyari, Saccani, Pourmoafi, Beccaluva and Masoudi2010; Saccani et al. Reference Saccani, Allahyari, Beccaluva and Bianchini2013; Whitechurch et al. Reference Whitechurch, Omrani, Agard, Humbert, Montigny and Jolivet2013; Nouri et al. Reference Nouri, Azizi, Golonka, Asahara, Orihashi, Yamamoto, Tsuboi and Anma2016, Reference Nouri, Asahara, Azizi, Yamamoto and Tsuboi2017).
The oldest rocks in this region are the Late Triassic to Cretaceous sedimentary rocks in the Biston area (Shahidi & Nazari, Reference Shahidi and Nazari1997). This body shows rough topography and is mainly massive, but it occasionally exhibits weak layering in some parts. It includes very thick crystalline limestone that crops out in most regions of the study area. The Cretaceous ophiolite complex comprises ultramafic, mafic and sedimentary mélange complexes that are divided by faults. It is difficult to clearly separate these rocks because they have been deformed and mixed with sediments. In most areas, dynamic deformation has affected the entire ophiolite complex; evidence of this deformation occurs as irregular blocks or bands within Eocene mafic and Miocene sedimentary rocks. The mafic rocks have been divided into two groups based on their intrusive age and tectonic setting: (1) Pillow basalt and coarse-grained gabbro that are black to white in colour represent Cretaceous ophiolites. Some researchers have suggested that these rocks have mid-ocean-ridge basalt (MORB) or/and within-plate origins (Allahyari et al. Reference Allahyari, Saccani, Pourmoafi, Beccaluva and Masoudi2010; Allahyari, Pourmoafi & Khalatbari-Jafari, Reference Allahyari, Pourmoafi and Khalatbari-Jafari2012). Ao et al. (Reference Ao, Xiao, Khalatbari-Jafari, Talebian, Chen, Wan and Zhang2016) reported an age of 79.3 Ma for the rodingitic gabbros in this area. (2) The Eocene fine- to coarse-grained gabbros represent associated volcanic rocks. Braud (Reference Braud1978) suggested an Eocene age for some of the gabbroic bodies in the Harsin area. Whitechurch et al. (Reference Whitechurch, Omrani, Agard, Humbert, Montigny and Jolivet2013) and Ao et al. (Reference Ao, Xiao, Khalatbari-Jafari, Talebian, Chen, Wan and Zhang2016), based on K–Ar and U–Pb age dating, reported ages of 56 Ma and 37 Ma for these gabbros in the northern Harsin area. These rocks are green to black in colour and exhibit rough morphology in outcrops. Our field observations show the gabbroic and sedimentary rocks were mélanged and in some areas the gabbroic and sedimentary rocks show pseudo-layer structures (Nouri, Reference Nouri2016). This group has been incorrectly mapped as layered gabbro on the Harsin map (Shahidi & Nazari, Reference Shahidi and Nazari1997). The trace element chemical compositions of these rocks, as well as their Sr and Nd isotopic ratios show they have affinities to an extensional tectonic regime due to the upwelling of metasomatized mantle after the Late Cretaceous collision in the Harsin area (Wrobel Daveau et al. Reference Wrobel Daveau, Ringenbach, Tavakoli, Ruiz, Masse and Frizonde Lamotte2010; Azizi et al. Reference Azizi, Hadi, Asahara and Mohammad2013; Saccani et al. Reference Saccani, Allahyari, Beccaluva and Bianchini2013; Nouri et al. Reference Nouri, Azizi, Golonka, Asahara, Orihashi, Yamamoto, Tsuboi and Anma2016, Reference Nouri, Asahara, Azizi, Yamamoto and Tsuboi2017). New field works by Wrobel Daveau et al. (Reference Wrobel Daveau, Ringenbach, Tavakoli, Ruiz, Masse and Frizonde Lamotte2010) show the presence of detachment faults over mantle rocks that associate to upwelling of mantle. Furthermore, Braud (Reference Braud1978), Whitechurch et al. (Reference Whitechurch, Omrani, Agard, Humbert, Montigny and Jolivet2013) and Nouri et al. (Reference Nouri, Asahara, Azizi, Yamamoto and Tsuboi2017) proposed that the body formed in an Eocene arc to back-arc setting.
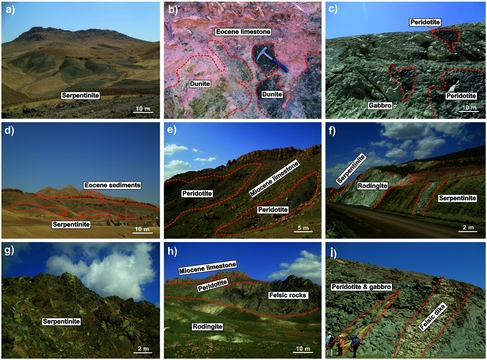
The serpentinized peridotites are characterized by flat morphology; they form elevations or swelling hills that are supported by scarce vegetation (Fig. 3a). This massif chiefly includes serpentinized harzburgite and lherzolite with lenses of dunite that vary in size. Serpentinite bodies exhibit faulted and sheared contact relationships where they are exposed. Sometimes, relic lenses are schistose serpentinites and they are brecciated. Carbonate assemblages are locally developed close to the shear zone between the serpentinite and the ophiolite mélange. Farther from the shear zone, the protolith of serpentinite can be easily recognized as harzburgite, in which relicts of primary orthopyroxenes are still preserved in the serpentinized background. Serpentinized dunites are observed as tectonic slices within gabbro and limestone (Fig. 3b, c). The serpentinized peridotites are always sandwiched between Eocene and Miocene sediments and are bounded by faults (Fig. 3d, e). The cavities and fractures in the HSP rocks are filled by silica fluid that was derived from the late-stage injection of granitic magma during the Late Cretaceous (Nouri et al. Reference Nouri, Azizi, Golonka, Asahara, Orihashi, Yamamoto, Tsuboi and Anma2016). The peridotites exhibit faulted relationships with the rodingitic gabbros (Fig. 3f). The rodingitic gabbros formed by a metasomatic mechanism that involved the loss of Si and alkalis from a mafic protolith during or after the serpentinization of adjacent ultramafic rocks (Nouri & Azizi, Reference Nouri and Azizi2015) (Fig. 3g). Some peridotites exhibit faulted relationships with felsic rocks (Fig. 3h) and occur as isolated bodies and slices within the felsic bodies. They are locally cut by felsic rocks (Fig. 3i) of Late Cretaceous age (Nouri et al. Reference Nouri, Azizi, Golonka, Asahara, Orihashi, Yamamoto, Tsuboi and Anma2016), thus indicating that the HSP bodies are older than the felsic dikes.

Figure 3. Photographs of HSP bodies from the Harsin area. (a) Serpentinized peridotites with smooth morphology. (b) Serpentinized dunites as tectonic slices within limestone. (c) Serpentinized dunites as tectonic slices within gabbro. (d) Irregular blocks of serpentinites within Eocene sedimentary rocks. (e) Irregular blocks or bands of peridotites within Miocene sedimentary rocks. (f) Fault relationship between serpentinized HSP rocks and rodingitic gabbro. (g) Hydrothermal alteration in the HSP rocks. (h) Fault relationship of the HSP rocks with felsic rocks, gabbro and Miocene sediments. (i) Felsic dikes in the HSP rocks.
3. Petrography
The Harsin–Sahneh peridotites (HSP) are mostly serpentinized and display porphyroclastic to mesh textures. The porphyroclasitc to mesh textures indicate that the rocks are tectonites. They mainly comprise olivine, orthopyroxene, scarce clinopyroxene and spinel with varying amounts of serpentinized minerals. The deformed minerals display undulose extinction and kink-band fractures; these textural features are evidences of mantle metamorphism.
Olivine generally forms elongated porphyroclasts that have been partially replaced by serpentine and show a typical mesh texture (Fig. 4a). Olivine neoblasts occur around orthopyroxene grains (Fig. 4b); the olivine neoblasts are evidence of annealing. Orthopyroxene porphyroclasts exhibit strongly corroded boundaries with embayments that have been filled by olivine and spinel. They also exhibit clinopyroxene exsolution lamellae (Fig. 4c). Orthopyroxene is frequently replaced by bastite serpentine, which is dark brown to black in colour (Fig. 4b, d). Spinel inclusions are observed in some orthopyroxene and olivine porphyroclasts (Fig. 4d). In addition, there are minor primary clinopyroxene porphyroclasts with irregular rims, which represent the residues left after partial melting (Fig. 4e, f) (Zhou et al. Reference Zhou, Robinson, Malpas, Edwards and Qi2005; Uysal et al. Reference Uysal, Ersoy, Karslı, Dilek, Sadıklar, Ottley, Tiepolo and Meisel2012). Secondary clinopyroxene commonly occurs as an interstitial phase along the grain boundaries of olivine (Fig. 4a, g) and orthopyroxene. This indicates that the formation of clinopyroxene occurred during the last stage, and this type of clinopyroxene is interpreted to represent the product of the crystallization of metasomatic melts (Nicolas & Prinzhofer, Reference Nicolas and Prinzhofer1983; Luguet et al. Reference Luguet, Alard, Lorand, Pearson, Ryan and O'Reilly2001; Alard et al. Reference Alard, Luguet, Pearson, Griffin, Lorand, Gannoun, Burton and O'Reilly2005; Morishita et al. Reference Morishita, Maeda, Miyashita, Kumagai, Matsumoto and Dick2007; Uysal et al. Reference Uysal, Ersoy, Dilek, Escayola, Sarıfakıoğlu, Saka and Hirata2015). Amphibole tends to occur as irregular growths along the rims of clinopyroxene crystals. Accessory spinels exhibit anhedral to subhedral shapes; they are reddish-brown in colour and are randomly distributed in the serpentinized peridotite (Fig. 4h). They have been affected by deformation and show elongated grain shapes with incomplete ferrian chromite rims along their grain boundaries and fractures. In some samples, the spinel–orthopyroxene association shows a symplectic texture (Fig. 4h, i).

Figure 4. Thin-section images of the HSP rocks from the ophiolite. (a) Peridotite showing mesh texture and remnants of olivines (XPL). (b) Peridotite showing porphyroblastic textures. Olivine neoblasts occur around orthopyroxene grains (XPL). (c) Orthopyroxene porphyroclasts showing clinopyroxene exsolution lamellae (XPL). (d) Spinel inclusions observed in some orthopyroxene porphyroclasts (PPL). (e, f) Clinopyroxene porphyroblasts with irregular rims (XPL). (g) Secondary clinopyroxene occurring as an interstitial phase along grain boundaries with olivine. (h, i) Accessory spinels exhibiting anhedral to subhedral shapes with reddish-brown colour. Spinel–orthopyroxene association with a symplectic texture is observed (PPL). Ol: olivine; Srp: serpentine; Opx: orthopyroxene; Spl: spinel; Cpx: clinopyroxene (Whitney & Evans, Reference Whitney and Evans2010).
The relatively high abundances of relict olivine (~50–60%) and orthopyroxene (~20–35%) compared to the low abundances of pseudomorphic clinopyroxene relicts (~3–5%) probably suggest that most of the HSP rocks originated from Cpx-harzburgites to harzburgites, as well as rare lherzolites and dunites.
4. Analytical techniques
Representative samples from the serpentinized HSP rocks were selected for chemical analyses based on their locations. The powdered samples were prepared and analysed for their major and trace element compositions. The whole-rock major element contents were determined using the wavelength dispersive X-ray fluorescence (WD-XRF) technique with a Rigaku ZSX Primus II at Nagoya University. For major element analyses, 0.5 g of each rock powder sample was mixed with 5.0 g of lithium tetraborate, and the mixture was melted at 1200°C for 12–17 min with a high-frequency bead sampler to obtain a glass bead for XRF analysis. The whole-rock Cr and Ni contents were also determined using WD-XRF, and a glass bead was prepared for trace element analysis from a mixture of 1.5 g of sample powder and 5.0 g of lithium tetraborate. The loss on ignition (LOI) of the sample was calculated based on the weight difference after ignition at 950°C.
The HSP rocks contain low concentrations of rare earth elements (REE). Thus, 400–500 mg of each powdered sample was completely decomposed in 3 ml of HF (38%) and 0.5–1 ml of HClO4 (70%) in a covered PTFE beaker at 120–140°C on a hotplate in a clean room. The dissolved sample was then dried at 140°C on a hotplate using infrared lamps. After drying, >10 ml of 2–6 M HCl was added to the dried sample to dissolve it, and the sample solution was moved to a polypropylene centrifuge tube to separate the residue from the clear upper portion. The residue was moved into a smaller PTFE vessel and then treated with HF+HClO4 in a steel-jacketed bomb to ensure its complete dissolution. After the second HF decomposition, the residue fraction was mixed with the clear upper fraction, and the resulting solution was divided into two parts in a ratio of 1:20. The former was used for the quantitative analysis of trace elements, and the latter was used for Sr and Nd isotopic analysis. The former was dried and dissolved in 15–20 ml of 2% HNO3, and its concentrations of trace elements (including REEs) were analysed using an inductively coupled plasma mass spectrometer (ICP-MS) (Agilent 7700x) at Nagoya University. The latter was dried and dissolved in 15 ml of 2.4 M HCl. To isolate and purify Sr and REE, including Nd, from the large amount of matrix elements in >400 mg of rock sample, cation exchange column separation was carried out twice. First, after loading the sample solution (15 ml), matrix elements such as Fe, Mg and Ca were eliminated by a cation exchange column (AG50W-X8, 200–400 mesh) with an eluent of 2.4 M HCl, and both Sr and REE were collected together using an eluent of 6 M HCl. The collected Sr and REE fraction was dried and dissolved in 3 ml of 2.4 M HCl. The Sr and REE solution was loaded onto the same cation exchange column with eluents of 2.4 and 6 M HCl to isolate and collect Sr and REE, respectively, in each vessel. The REE fraction was dried, then neodymium was isolated from the REE fraction using a cation exchange column with an eluent of α-hydroxyl isobutric acid (α-HIBA).
The isotopic ratios of Sr and Nd were determined using the VG Sector 54-30 and GVI IsoProbe-T thermal ionization mass spectrometers (TIMS) at Nagoya University. Mass fractionation was corrected using values of 86Sr/88Sr=0.1194 and 146Nd/144Nd=0.7219. The NIST-SRM987 and JNdi-1 standards (Tanaka et al. Reference Tanaka, Togashi, Kamioka, Amakawa, Kagami, Hamamoto and Yuhara2000) were used as the natural Sr and Nd isotopic ratio standards.
For some of the samples, their elemental concentrations were determined using the isotope dilution (ID) technique after adding the prepared isotope spike solutions for Rb, Sr, Sm and Nd. To isolate Rb, Sr and REE, conventional column chemistry was carried out using cation exchange resin (Bio Rad AG50W-X8, 200–400 mesh) and an eluent of HCl. The abundances of Rb, Sr, Sm and Nd were measured using the Finnigan MAT Thermoquad THQ thermal ionization quadrupole mass spectrometer at Nagoya University.
Additionally, the trace element concentrations (including REE) of five samples (SH1, SH2, SH3, TB2, TM1) were analysed using inductively coupled plasma mass spectrometry (ICP-MS) at ALS CHEM Analytical Laboratories, North Vancouver, Canada.
After observations of the polished thin-sections were obtained, the chemical compositions of fresh minerals were determined using a JXA-8800R electron microprobe analyzer (EMPA) at Nagoya University. The acceleration voltage and beam current were set at 15 kV and 12 nA, respectively. Natural and synthetic standards were used for calibration.
5. Mineral chemistry
5.a. Spinel
Spinel grains are usually fresh and preserve their primary composition. The results of the electron microprobe (EMP) analyses of spinel in the HSP rocks are presented in Table 1a. Individually, there is no compositional variation or zoning in the spinels of the HSP rocks. These spinels are characterized by a narrow range of Cr2O3 contents of 35.3–42.3 wt% and Al2O3 contents ranging from 26.7 to 31.9 wt%. The Cr# varies from 0.44 to 0.52. The TiO2 contents of spinels are low (<0.1 wt%), which is a common feature of ophiolitic ultramafic rocks (Arai & Yurimoto, Reference Arai and Yurimoto1994; Ahmed & Habtoor, Reference Ahmed and Habtoor2015).
Table 1. Chemical compositions of (a) spinel, (b) pyroxene and (c) olivine, based on EMP analyses

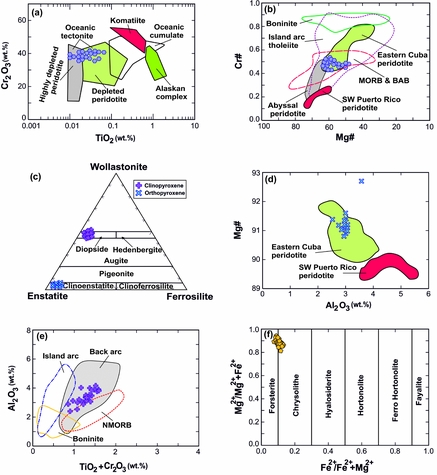
The minerals plot in the field of depleted peridotite (Fig. 5a) on the TiO2 versus Cr# diagram (Dick & Bullen, Reference Dick and Bullen1984). The magnesium number (Mg#) values of the spinels in the HSP rocks (47.4–62.1) are generally higher than those in abyssal peridotites and SW Puerto Rico peridotites (i.e., mid-oceanic ridge rocks), and the Cr# values of the spinels are lower than those of boninites (Fig. 5b). The spinels of the HSP rocks plot close to the back-arc and eastern Cuba peridotite (i.e. back-arc basin) fields (Fig. 5b). Low Cr# (<0.6) values are typical indicators of oceanic ophiolites, including back-arc basin ophiolites, whereas arc-related ophiolitic spinels have Cr# values that are greater than 0.6 (Dick & Bullen, Reference Dick and Bullen1984).

Figure 5. (a) Diagram of Cr2O3 versus TiO2 in spinel. Fields for ultramafic rocks are after Herbert (Reference Herbert1982), Jan & Windley (Reference Jan and Windley1990) and Zhou & Kerrich (Reference Zhou and Kerrich1992). (b) Mg# versus Cr# diagram for spinel. Fields of spinel compositions in abyssal peridotite, MORB-BAB, island arc tholeiite and boninite are from Dick & Bullen (Reference Dick and Bullen1984) and the GEOROC database. Data of spinel in eastern Cuba dunites and harzburgites are from Marchesi et al. (Reference Marchesi, Garrido, Godard, Proenza, Gervilla and Blanco-Moreno2006), and those in SW Puerto Rico lherzolites are from Marchesi et al. (Reference Marchesi, Jolly, Lewis, Garrido, Proenza and Lidiak2011). (c) Classification of pyroxenes (Morimoto, Reference Morimoto1988). (d) Diagram of Al2O3 (wt%) versus Mg# in orthopyroxene. Data of orthopyroxene in eastern Cuba dunites and harzburgite are from Marchesi et al. (Reference Marchesi, Garrido, Godard, Proenza, Gervilla and Blanco-Moreno2006), and those in SW Puerto Rico lherzolites are from Marchesi et al. (Reference Marchesi, Jolly, Lewis, Garrido, Proenza and Lidiak2011). (e) TiO2+Cr2O3 (wt%) versus Al2O3 (wt%) diagram (after Hout et al. Reference Hout, Hébert, Varfalvy, Beaudoin, Wang, Liu, Cotten and Dostal2002) for clinopyroxene. Fields are outlined for clinopyroxene compositions in boninite (Van der Laan et al. Reference Van der Laan, Arculus, Pearce and Murton1992), island arc tholeiite and back-arc basalt (Hawkins & Allen, Reference Hawkins and Allan1994) and NMORB (Stakes & Franklin, Reference Stakes and Franklin1994). (f) Classification of olivine minerals (Deer, Howie & Zussman, Reference Deer, Howie and Zussman1992).
5.b. Pyroxene
The results of the chemical compositions of the pyroxenes from the HSP rocks are listed in Table 1b. All analysed pyroxenes are chemically homogeneous.
The orthopyroxenes in the HSP rocks mainly comprise enstatite (En80–90, Wo1–14 and Fs6–9), according to the pyroxene classification diagram (Fig. 5c) (Morimoto, Reference Morimoto1988). Their Mg# values range from 91.3 to 95.3. These orthopyroxenes are characterized by narrow ranges of Al2O3 (2.5–3.6 wt%) and CaO contents (0.6–3.5 wt%), with low TiO2 contents (<0.1 wt%). The orthopyroxenes show lower Al2O3 contents and higher Mg# values than MORB-type peridotites from SW Puerto Rico, and have similar compositions to back-arc peridotites from eastern Cuba (Fig. 5d).
The chemical compositions of representative clinopyroxene grains are also given in Table 1b. The residual clinopyroxenes are generally diopside in composition on the En–Wo–Fs ternary diagram (Morimoto, Reference Morimoto1988). The Mg# values of clinopyroxene are positively correlated with their degree of depletion and degree of melting (Zhou et al. Reference Zhou, Robinson, Malpas, Edwards and Qi2005; Uysal et al. Reference Uysal, Ersoy, Karslı, Dilek, Sadıklar, Ottley, Tiepolo and Meisel2012); clinopyroxenes in highly depleted peridotites are characterized by high Mg# values. The Mg# values of residual clinopyroxenes range from 90.7 to 92.1 (reflecting high degrees of partial melting) and are higher than those of the secondary clinopyroxenes with diopside compositions (Fig. 5c) that occur as an interstitial phase (i.e. Mg# values ranging from 84.1 to 86.6, reflecting melt–rock interactions). On the Al2O3 versus TiO2 diagram (Fig. 5e), the clinopyroxenes plot in the field corresponding to a back-arc tectonic setting.
5.c. Olivine
The chemical compositions of olivines are shown in Table 1c. Both porphyroclastic and neoblastic grains show similar and homogeneous chemical compositions. The olivines in these samples plot in both the chrysolite and forsterite fields (Fig. 5f) on the olivine classification diagram (Deer, Howie & Zussman, Reference Deer, Howie and Zussman1992). The average Fo value in olivine reflects the fertility of a sample, and is related to the conditions of partial melting (i.e. the pressure and degree of melt extraction) (Arai, Reference Arai1994; Uysal et al. Reference Uysal, Ersoy, Karslı, Dilek, Sadıklar, Ottley, Tiepolo and Meisel2012). The olivine porphyroclastic grains in the HSP rocks have variable Fo numbers ranging from 91.1 to 94.9 (reflecting a high degree of partial melting), whereas the neoblastic grains have variable Fo numbers ranging from 89.2 to 90.3 (due to melt–rock interactions). All of the olivines in the HSP rocks contain very low Ti and Cr concentrations, which are typically less than 0.1 wt%.
6. Whole-rock geochemistry
The whole-rock major and trace element compositions of the serpentinized HSP rocks are listed in Table 2. Their variable amounts of LOI values (1.0–6.8 wt%) mainly indicate that all of the HSP samples have experienced moderate to low degrees of serpentinization (Table 2). They are characterized by low contents of SiO2 (38.8–43.5 wt%), Al2O3 (0.0–3.8 wt%) and CaO (0.2–8.2 wt%). Al2O3 mainly resides in spinel and is partly incorporated in primary pyroxene (Li et al. Reference Li, Chen, Wang, Wang, Yang and Robinson2015). The samples display variable degrees of depletion, with MgO contents ranging from 31.1 to 45.9 wt%. In addition, their trace element abundances are highly variable. These samples have variable contents of Cr (96–7560 ppm) and Ni (112–2880 ppm). Most of their Cr and Ni contents are higher than those of the primitive mantle (Ni=2090 ppm and Cr=3240 ppm; Hart & Zindler, Reference Hart and Zindler1986), which probably reflects their high olivine/pyroxene ratios and relatively high Cr-spinel contents (Whattam, Cho & Smith, Reference Whattam, Cho and Smith2011).
Table 2. Chemical compositions of the HSP

*=not measured; .d.=not detected.
On the MgO/SiO2 versus Al2O3/SiO2 diagram (Fig. 6), most of the peridotites plot at low Al2O3/SiO2 values (<0.04). The most depleted (refractory) compositions are defined by Al2O3/SiO2 and MgO/SiO2 ratios of <0.01 and >1, respectively (Jagoutz et al. Reference Jagoutz, Palme, Baddenhausen, Blum, Cendales, Dreibus, Spettel, Wänke and Lorenz1979; Hart & Zindler, Reference Hart and Zindler1986). Thus, peridotites of residual mantle origin should follow a progressive trend toward lower Al2O3/SiO2 values (reflecting a higher degree of melt extraction) and higher MgO/SiO2 values along a trend that parallels the terrestrial array (Fig. 6). The HSP rocks show a trend extending from the peridotites, which have more fertile Al2O3/SiO2=0.07–0.09 and MgO/SiO2=1.1–1.14, to more refractory peridotite (Al2O3/SiO2=0.00–0.05 and MgO/SiO2=0.75–1.1); they all plot along or above the terrestrial array. Their high MgO/SiO2 values reflect their higher olivine/pyroxene ratios. Some samples (UH-28 and UH-30) record low Al2O3/SiO2 values (~0.00), reflecting their more depleted (refractory) compositions; they are not plotted. On this diagram (Fig. 6), some samples show lower values of MgO/SiO2 and Al2O3/SiO2, indicating that they have experienced MgO loss or SiO2 addition relative to normal mantle melting residues (Marchesi et al. Reference Marchesi, Garrido, Bosch, Bodinier, Gervilla and Hidas2013).

Figure 6. Plot of the HSP rocks on Al2O3/SiO2 versus MgO/SiO2 diagram (Jagoutz et al. Reference Jagoutz, Palme, Baddenhausen, Blum, Cendales, Dreibus, Spettel, Wänke and Lorenz1979; Hart & Zindler, Reference Hart and Zindler1986). The HSP rocks extend from peridotites in more fertile Al2O3/SiO2=0.07–0.09 and MgO/SiO2=1.1–1.14 and more refractory peridotites (Al2O3/SiO2=0.00–0.05 and MgO/SiO2=0.75–1.1); they all plot along or above the terrestrial array.
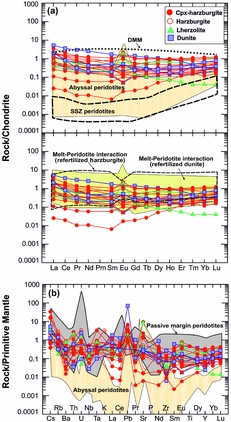
Most of these rocks have REE patterns that are subparallel to each other (Fig. 7a), although two samples exhibit REE patterns that are accompanied by slightly bulged shapes around their MREE segments. All of the peridotite samples are characterized by variously depleted REE patterns compared to the depleted MORB mantle (DMM), and their total REE contents range from 0.5 to 6.2 ppm. The presence of slightly positive Eu anomalies in some samples (Niu, Langmuir & Kinzler, Reference Niu, Langmuir and Kinzler1997) is due to reactions with plagioclase-bearing rocks, such as oceanic gabbro (e.g. Klinkhammer et al. Reference Klinkhammer, Elderfield, Edmond and Mitra1994; Douville et al. Reference Douville, Charlou, Oelkers, Bienvenu, Jove Colon, Donval, Fouquet, Pricur and Appriou2002; Chen et al. Reference Chen, Zhou, Liu, Yang, Li and Dick2013). Recent experimental studies demonstrate that the chlorinity and redox potential of the fluid is a major controlling factor on LREE and Eu mobility (Allen & Seyfried, Reference Allen and Seyfried2005; Paulick et al. Reference Paulick, Bach, Godard, De Hoog, Suhr and Harvey2006; Deschamps et al. Reference Deschamps, Godard, Guillot and Hattori2013) and that the presence of plagioclase is not required for the generation of LREE-enriched fluid compositions with positive Eu anomalies.

Figure 7. (a) Chondrite-normalized abundances of REE in the HSP rocks (Sun & McDonough, Reference Sun, McDonough, Sunders and Norry1989). The supra-subduction zone (SSZ) peridotite field is from Parkinson & Pearce (Reference Parkinson and Pearce1998). The DMM field is from Sun & McDonough (Reference Sun, McDonough, Sunders and Norry1989). Fields of abyssal peridotites and melt/rock interaction are from Deschamps et al. (Reference Deschamps, Godard, Guillot and Hattori2013). The solid line field (abyssal peridotites + melt/rock interactions) shows characteristics of refertilized protolith after melt/rock interactions. (b) Trace element abundances normalized by primitive mantle values (Sun & McDonough, Reference Sun, McDonough, Sunders and Norry1989). The solid line field (abyssal peridotites + melt/rock interactions) shows characteristics of refertilized protolith after melt/rock interactions. The field of passive margin serpentinized peridotites is based on data from Newfoundland and the Iberian abyssal plain from Seifert & Brunotte (Reference Seifert and Brunotte1996), Niu (Reference Niu2004), Savov et al. (Reference Savov, Ryan, D'Antonio, Kelley and Mattie2005, Reference Savov, Ryan, D'Antonio and Fryer2007), Deschamps et al. (Reference Deschamps, Guillot, Godard, Andreani and Hattori2011, Reference Deschamps, Godard, Guillot, Chauvel, Andreani, Hattori, Wunder and France2012) and Kodolányi et al. (Reference Kodolányi, Pettke, Spandler, Kamber and Gméling2012).
The abundances of incompatible trace elements on the primitive mantle-normalized diagram (Fig. 7b) show elevated abundances of U, Pb, Sr, Cs and Rb and small negative Ba and Zr anomalies compared to their neighbouring elements. Except for a few elements, such as Cs, Pb and Sr, in some samples, the trace element contents in the HSP samples are depleted compared to those of the primitive mantle (Sun & McDonough, Reference Sun, McDonough, Sunders and Norry1989). This feature suggests the residual mantle origin of their protolith. Assessing the abundances of the incompatible trace elements normalized to the primitive mantle (Fig. 7b) reveals that some samples show a decoupling between Nb and Ta and are more enriched in Ta. This is consistent with depleted peridotites from abyssal and continental passive margins, whereas two samples show higher depletion on MREE and HREE compared to abyssal peridotites and the REE patterns reaching up to the field of typical supra-subduction peridotites (Parkinson & Pearce, Reference Parkinson and Pearce1998; Uysal et al. Reference Uysal, Ersoy, Dilek, Kapsiotis and Sarıfakıoğlu2016).
7. Sr–Nd isotopic ratios
The 87Sr/86Sr and 143Nd/144Nd isotopic ratios of the HSP rocks are shown in Table 3. Their initial ratios are calculated based on an age of 80 Ma, which Aziz, Elias & Aswad (Reference Aziz, Elias and Aswad2011) reported from neighbouring Penjween serpentinized peridotites using the Rb–Sr method (80-100 Ma). Braud (Reference Braud1978) and Shahidi & Nazari (Reference Shahidi and Nazari1997) have suggested a Jurassic to Late Cretaceous age for the Harsin–Sahneh ophiolite complex based on its tectonic and stratigraphic relationships. Their 87Sr/86Sr(i=initial) and 143Nd/144Nd(i) ratios range from 0.7038 to 0.7109 and from 0.51214 to 0.51285, respectively. Their εNd(t) values range from –7.5 to +7.8 (Table 3), thus reflecting the contribution of continental material to the source of the HSP rocks. The 87Sr/86Sr(i) ratios of the HSP rocks are significantly more radiogenic compared to MORB (0.7025), whereas the 143Nd/144Nd(i) ratios of the HSP rocks are lower than that of MORB (0.51315). This suggests that the HSP rocks originated from a depleted mantle source that was affected by alteration reactions (as indicated by their high 87Sr/86Sr(i) ratios).
Table 3. Rb–Sr and Sm–Nd isotopic compositions of the HSP rocks

The natural Nd and Sr isotope ratios were normalized based on146Nd/144Nd=0.7219 and 86Sr/88Sr=0.1194. Averages and1σ for isotope ratio standards, JNdi-1 and NBS987, are 143Nd/144Nd=0.512119±0.000005 (n=3) and 87Sr/86Sr=0.710253±0.000007 (n=10). The CHUR (Chondritic Uniform Reservoir) values,147Sm/144Nd=0.1967 and 143Nd/144Nd=0.512638, were used to calculate the ε0 (DePaolo & Wasserburg,Reference DePaolo and Wasserburg1976). ƒ(Sm/Nd)=[(147Sm/144Nd)sample/(147Sm/144Nd)CHUR]−1 and ƒ(Rb/Sr)=[(87Rb/86Sr)sample/(87Rb/86Sr)CHUR] −1.
* Rb, Sr, Sm, Nd and 87Sr/86Sr(p) 143Nd/144Nd(p) were measured by isotope dilution method. i=initial and p=present.
W/R(Closed system)=[(ε ri−ε rf)/(ε rf-−ε wi)]×(X r/X w). W/R(Open system)=(X r/X m)×ln[(ε ri−ε rf)/(ε rf−ε wi)+1]. ε ri = initial 87/86Sr (0.702689) for mantle peridotite, element composition X r as 6.1 ppm for mantle peridotites (Workman & Hart, Reference Workman and Hart2005), ε rf is the final 87Sr/86Sr of Harsin–Sahneh peridotites, ε wi is the initial 87Sr/86Sr of hydrothermal fluid as 0.70916, with the element composition of seawater X w as 8 ppm for present North Atlantic seawater (Palmer & Edmond, Reference Palmer and Edmond1989).
On the 87Sr/86Sr(i) versus εNd(t) diagram, the samples plot near the mantle array, and they extend from the MORB (mid-oceanic ridge) field toward the EMII (continental sediments associated with a subducting slab) field and a seawater component (Fig. 8a, b, c). These diagrams show that the HSP rocks were not strongly affected by seawater alteration and the HSP rocks were altered by seawater along deep faults and fractures in an extensional basin. In Figure 8a, the HSP rocks exhibit minor overlapping with the Harsin ophiolite domain due to their highly radiogenic Sr isotopic compositions and less radiogenic Nd isotopic compositions compared to other domains. Figure 8d shows the relationship between the Nd isotopic compositions and (Ce/Yb)N ratios of the HSP rocks. In this diagram, the DP trend is characterized by higher εNd values (εNd>+10) and more depleted LREE patterns ((Ce/Yb)N <0.5) compared to the MORB source (εNd= +10 (White & Hofmann, Reference White and Hofmann1982) and (Ce/Yb)N=0.66 (Sun & McDonough, Reference Sun, McDonough, Sunders and Norry1989)). The HSP samples exhibit enriched REE signatures, and they plot in the EP field. The EP field is formed by mixing between an enriched component and residual peridotites (McCulloch & Chappel, Reference McCulloch and Chappel1982); only continental crustal material shows such enriched characteristics (i.e. fluids or melts derived from the continental crust have an average (Ce/Yb)N= 4). Thus, the minor mantle metasomatism of the HSP rocks was derived from continental crustal materials associated with the subducted slab (Fig. 8b, c, d). Additionally, the calculated values of the Sm/Nd and Rb/Sr differentiation factors (ƒ(Sm/Nd) and ƒ(Rb/Sr) (McCulloch & Wasserburg, Reference McCulloch and Wasserburg1978)) are shown in Table 3. The careful use of these equations (ƒ(Sm/Nd) and ƒ(Rb/Sr) values) allows us to identify the mixing of a source with continental crustal material. The ƒ(Sm/Nd) values range from –0.52 to 0.23, and the ƒ(Rb/Sr) values range from –1 to 72, which confirms that the mantle source of the HSP rocks experienced the minor contribution of continental crustal materials associated with the subducting slab.

Figure 8. (a) The variations in 87Sr/86Sr(i) versus εNd(t). The samples plot near the mantle array and extend from the field of the depleted mantle toward the fields of the EMII end-member component and seawater component. (b) The variations in 87Sr/86Sr(i) versus 143Nd/144Nd(i). The field of mantle components is based on data compiled by Stracke, Bizimis & Salters, (Reference Stracke, Bizimis and Salters2003) for Atlantic MORB (DMM). Saint Helena (HIMU), Samoa and Society (EMII) and Pitcairn (EMI). The samples extend toward the EMII end-member, suggesting a minor contribution from EMII to the depleted mantle in their sources. The Sr and Nd isotopic compositions of seawater are from the literature: Palmer & Edmond (Reference Palmer and Edmond1989) for Sr and Nd compositions and Piepgras & Wasserburg (Reference Piepgras and Wasserburg1987) and Tachikawa, Jeandel & Roy Barman, (Reference Tachikawa, Jeandel and Roy Barman1999) for Nd isotopic compositions. The fields of the Eocene Kamyaran ophiolite and Late Cretaceous Mawat ophiolite are from Azizi et al. (Reference Azizi, Tanaka, Asahara, Chung and Zarrinkoub2011b) and Azizi et al. (Reference Azizi, Hadi, Asahara and Mohammad2013), the data for the Late Cretaceous Neyriz ophiolite are from Shafaii Moghadam et al. (Reference Shafaii Moghadam, Zaki Khedr, Chiaradia, Stern, Bakhshizad, Arai, Ottley and Tamura2014), the data for the Late Cretaceous Balvard–Baft ophiolite are from Shafaii Moghadam et al. (Reference Shafaii Moghadam, Stern, Chiaradia and Rahgoshay2013), and the data for the Harsin ophiolite are from Nouri (Reference Nouri2016). (c) Sr isotope versus Ba/Rb diagram showing mixing between upper/lower crust and upper mantle peridotites. The Ba/Rb ratio of the lower crust is based on mafic granulites from the Dabie orogeny in Hou (Reference Hou2003). The Ba and Rb data for the UM and upper crust are from Sun & McDonough (Reference Sun, McDonough, Sunders and Norry1989). The Sr–Nd data for UM (upper mantle peridotite) are from Jahn et al. (Reference Jahn, Wu, Lo and Tsai1999), and the Sr–Nd data for the lower and upper crust are from Xu et al. (Reference Xu, Ma, Huang, Lizuka, Chung, Wang and Wu2004) and Jahn et al. (Reference Jahn, Wu, Lo and Tsai1999). (d) (Ce/Yb)N versus εNd. Star indicates the (Ce/Yb)N and εNd compositions of the present-day MORB (White & Hofmann, Reference White and Hofmann1982; Sun & McDonough, Reference Sun, McDonough, Sunders and Norry1989).
8. Discussion
8.a. Evidence of melt depletion
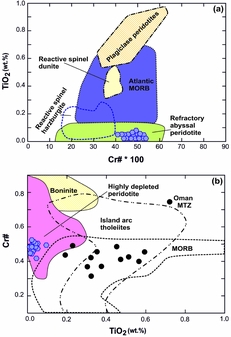
The petrographic, major and trace element characteristics of the HSP rocks indicate that they represent the refractory and depleted mantle residues following partial melting. The geochemical and petrographical evidence includes: (1) the orthopyroxene grains with exsolution lamellae of clinopyroxene and spinel or between orthopyroxene and olivine (Fig. 4h, i), olivines with kink band features and partial replacement of orthopyroxene by olivine (Fig. 4b); (2) their low 143Nd/144Nd(i) ratios (0.51208–0.51285); (3) the forsteritic composition of primary olivine (Fo: 91.1–94.9); (4) the depletion of the HSP samples in terms of their major oxide (Al2O3, TiO2, CaO and MnO), incompatible trace element (V, Sc, Y, Zn) and HREE contents; and (5) their variously depleted REE patterns compared to the depleted mantle on chondrite- and primitive mantle-normalized diagrams. Additionally, their observed whole-rock geochemical compositions are consistent with those of refractory and depleted mantle residues, which can also be seen on the MgO/SiO2 versus Al2O3/SiO2 diagram, where these samples lie on the depleted end of the terrestrial melting trend (Fig. 6). On the TiO2 versus Cr2O3 diagram (Fig. 5a), the spinel compositions of the HSP rocks fall within the field of depleted oceanic peridotites (tectonites). This can also be seen on the TiO2 versus Cr# diagram for spinel (Fig. 9), where the HSP spinels fall within the field of refractory abyssal peridotites defined by Kelemen et al. (Reference Kelemen, Hirth, Shimizu, Spiegelman and Dick1997) and Suhr et al. (Reference Suhr, Hellebrand, Snow, Seck and Hofmann2003); additionally, indicating that they represent mantle residues.

Figure 9. (a) TiO2 versus Cr# diagram for the HSP spinels. The spinel samples fall within the field of refractory abyssal peridotite. The fields of refractory abyssal peridotites and Atlantic MORB are after Kelemen et al. (Reference Kelemen, Hirth, Shimizu, Spiegelman and Dick1997). (b) TiO2 versus Cr# of spinels, the area for highly depleted peridotite from the Bay of Island ophiolite (Suhr et al. Reference Suhr, Hellebrand, Snow, Seck and Hofmann2003), Josephine ophiolite (Morgan, Liang & Kelemen, Reference Morgan, Liang and Kelemen2008) and Iwanaidake peridotite (Kubo, Reference Kubo2002). MORB, island arc and boninite fields from Arai (Reference Arai1992), Kelemen, Shimizu & Salters (Reference Kelemen, Shimizu and Salters1995) and Dick & Natland (Reference Dick and Natland1996). Small black circles: dunites and impregnated peridotites from the Moho transition zone (MTZ) of the Oman ophiolite (Koga, Kelemen & Shimizu, Reference Koga, Kelemen and Shimizu2001).
8.b. Water–rock interaction or melt refertilization?
The chemical compositions of the HSP rocks exhibit similar properties to refractory peridotites. Generally, the refractory peridotites are residues of high degrees of partial melting; their whole-rock REE patterns should be characterized by strong LREE depletion and flat to enriched MREE–HREE contents (Johnson, Dick & Shimizu, Reference Johnson, Dick and Shimizu1990; Johnson & Dick, Reference Johnson and Dick1992). Nevertheless, the bulk compositions of the HSP rocks exhibit different patterns, with light rare earth elements (LREE) and large-ion lithophile elements (LILE) enrichment (Fig. 7). Therefore, there must be another process, such as water–rock interaction (Paulick et al. Reference Paulick, Bach, Godard, De Hoog, Suhr and Harvey2006; Delacour et al. Reference Delacour, Früh Green, Frank, Gutjahr and Kelley2008; Chen et al. Reference Chen, Zhou, Liu, Yang, Li and Dick2013) or melt refertilization (Niu, Reference Niu1997, Reference Niu2004; Kelemen, Kikawa & Miller, Reference Kelemen, Kikawa and Miller2007; Chen et al. Reference Chen, Zhou, Liu, Yang, Li and Dick2013), that can explain the LREE and LILE enrichments in the HSP rocks; these are discussed below.
8.b.1. Water–rock interaction ratios
In many studies, Sr isotopes have been demonstrated to be an important geochemical tool in the determination of fluid–rock interactions (Hart, Erlank & Kable, Reference Hart, Erlank and Kable1974; Jacobsen & Wasserburg, Reference Jacobsen and Wasserburg1979; Hess, Bender & Schilling, Reference Hess, Bender and Schilling1991; Kempton, Hawkesworth & Fowler, Reference Kempton, Hawkesworth and Fowler1991; Gillis, Coogan & Pedersen, Reference Gillis, Coogan and Pedersen2005). A significant shift in Sr isotope compositions provides a constraint on the degree of seawater–rock interaction and fluid fluxes during the formation and alteration of these rocks. Therefore, when considering the interactions between fluids derived from seawater and the oceanic lithosphere, the 87Sr/86Sr ratio is an effective parameter for assessing water–rock (W/R) ratios (Hart, Erlank & Kable, Reference Hart, Erlank and Kable1974; Hess, Bender & Schilling, Reference Hess, Bender and Schilling1991; Kempton & Hunter, Reference Kempton and Hunter1997; Delacour et al. Reference Delacour, Früh Green, Frank, Gutjahr and Kelley2008) and reflecting the extent of seawater–rock interaction in the oceanic lithosphere. It is necessary to calculate W/R ratios to determine the effect of hydrothermal alteration on the REE patterns of the HSP samples and to provide evidence for the circulation of seawater into the oceanic crust (Paulick et al. Reference Paulick, Bach, Godard, De Hoog, Suhr and Harvey2006; Delacour et al. Reference Delacour, Früh Green, Frank, Gutjahr and Kelley2008; Chen et al. Reference Chen, Zhou, Liu, Yang, Li and Dick2013):
 $$\begin{eqnarray}
W/{R_{{\rm{closed system}}}} &=& [({\varepsilon _{\rm{r}}}^{\rm{i}} - {\varepsilon _{\rm{r}}}^{\rm{f}})/\left({{\varepsilon _{\rm{r}}}^{\rm{f}} - {\varepsilon _{\rm{w}}}^{\rm{i}}} \right)] \nonumber\\
&&\times\, \left( {{X_{\rm{r}}}/{X_{\rm{w}}}} \right)
\end{eqnarray}$$
$$\begin{eqnarray}
W/{R_{{\rm{closed system}}}} &=& [({\varepsilon _{\rm{r}}}^{\rm{i}} - {\varepsilon _{\rm{r}}}^{\rm{f}})/\left({{\varepsilon _{\rm{r}}}^{\rm{f}} - {\varepsilon _{\rm{w}}}^{\rm{i}}} \right)] \nonumber\\
&&\times\, \left( {{X_{\rm{r}}}/{X_{\rm{w}}}} \right)
\end{eqnarray}$$
 $$\begin{eqnarray}
&&W/{R_{{\rm{open system}}}} = \left( {{X_{\rm{r}}}/{X_{\rm{w}}}} \right)\nonumber\\
&&\quad \times {\rm{ln}}[({\varepsilon _{\rm{r}}}^{\rm{i}} - {\varepsilon _{\rm{r}}}^{\rm{f}})/\left( {{\varepsilon _{\rm{r}}}^{\rm{f}} - {\varepsilon _{\rm{w}}}^{\rm{i}}} \right){\rm{ }} + 1]
\end{eqnarray}$$
$$\begin{eqnarray}
&&W/{R_{{\rm{open system}}}} = \left( {{X_{\rm{r}}}/{X_{\rm{w}}}} \right)\nonumber\\
&&\quad \times {\rm{ln}}[({\varepsilon _{\rm{r}}}^{\rm{i}} - {\varepsilon _{\rm{r}}}^{\rm{f}})/\left( {{\varepsilon _{\rm{r}}}^{\rm{f}} - {\varepsilon _{\rm{w}}}^{\rm{i}}} \right){\rm{ }} + 1]
\end{eqnarray}$$
In this equation, W is the mass of the hydrothermal fluid, R is the mass of the rock being altered by the fluid, ε ri is the initial isotopic ratio of the rock (i.e. 0.702689 for mantle peridotite) (Workman & Hart, Reference Workman and Hart2005), ε rf is the final isotopic ratio of the hydrothermally altered rock (Table 3), ε wi is the initial isotopic composition of hydrothermal fluid (seawater) (i.e. 0.70916) (Palmer & Edmond, Reference Palmer and Edmond1989), X r is the elemental composition of the mantle peridotite (i.e. 6.1 ppm) (Workman & Hart, Reference Workman and Hart2005) and X w is the elemental composition of the hydrothermal fluid (i.e. 8 ppm) (Palmer & Edmond, Reference Palmer and Edmond1989).
When the water–rock ratio is greater than 100, incompatible elements become mobile and reflect the composition of the fluid phase rather than that of the parent rock (Bau, Reference Bau1991; Gillis, Ludden & Smith, Reference Gillis, Ludden and Smith1992; Delacour et al. Reference Delacour, Früh Green, Frank, Gutjahr and Kelley2008; Li et al. Reference Li, Zhang, Wilde, Song and Liu2010). The W/R ratios of the HSP samples in both closed and open systems (Table 3) are low, ranging from 0.02 to 6.98 for closed systems and from 0.11 to 1.77 for open systems (Table 3). These data confirm that the minor circulation of seawater occurred along deep faults and fractures in an extensional basin. The W/R ratios of these rocks indicate that most REEs were unaffected by the hydrothermal alteration described in Section 7.
8.b.2. Melt refertilization
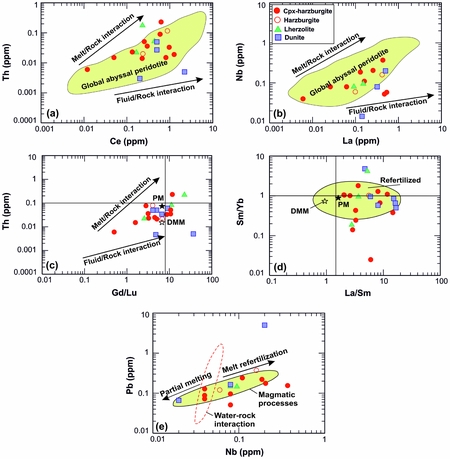
Melt refertilization is a common process in peridotites that has been studied in marine samples and ophiolitic successions (Godard, Bodinier & Vasseur, Reference Godard, Bodinier and Vasseur1995; Seyler & Bonatti, Reference Seyler and Bonatti1997; Piccardo et al. Reference Piccardo, Müntener, Zanetti and Pettke2003; Augustin et al. Reference Augustin, Paulick, Lackschewitz, Eisenhauer, Garbe Schonberg, Kuhn, Botz and Schmidt2012). Trace element data from the serpentinized peridotites indicate that the geochemical characteristics of melt refertilization can even be preserved in altered ultramafic rocks (Paulick et al. Reference Paulick, Bach, Godard, De Hoog, Suhr and Harvey2006; Augustin et al. Reference Augustin, Paulick, Lackschewitz, Eisenhauer, Garbe Schonberg, Kuhn, Botz and Schmidt2012; Chen et al. Reference Chen, Zhou, Liu, Yang, Li and Dick2013; Manuella et al. Reference Manuella, Ottolini, Carbone and Scavo2016). The geochemical features related to melt refertilization include concordant increases in the concentrations of REEs and high field strength elements in bulk-rock peridotite samples (Niu, Reference Niu2004; Augustin et al. Reference Augustin, Paulick, Lackschewitz, Eisenhauer, Garbe Schonberg, Kuhn, Botz and Schmidt2012; Chen et al. Reference Chen, Zhou, Liu, Yang, Li and Dick2013). This is due to the fact that REEs and HFSEs have similar solubilities in mafic melts, and this signature is transferred to peridotite. The trace element compositions of the serpentinized HSP rocks show positive trends on the Ce versus Th and La versus Nb diagrams (Fig, 10a, b), which indicates that melt–rock interaction is the dominant factor controlling these compositional variations, although some samples record evidence of minor fluid–rock interactions. These samples follow the trend of the global dataset, in which melt–rock interaction is the dominant process. This relationship indicates that the variability in LREEs is due to melt–rock interaction with minor hydrothermal alteration, which affects some HFSEs. Moreover, the geochemical characteristics of the HSP rocks in the Th versus Gd/Lu diagram display a similar trend of melt–rock interaction and exhibit enrichments in LREEs and HFSEs (Fig. 10c). In addition, these enrichments are confirmed by the La/Sm versus Sm/Yb diagram, which indicates that these samples have similar properties to the refertilized portion and exhibit enrichments in LREEs (Fig. 10d). Although Pb was previously considered to be a highly mobile element during hydrothermal alteration and dehydration in subduction zones (Niu & ƠHara, Reference Niu and O'Hara2003), recent studies by Niu (Reference Niu2004) and Godard et al. (Reference Godard, Lagabrielle, Alard and Harvey2008) of altered abyssal peridotites demonstrated that the geochemical behaviour of Pb during alteration and weathering was consistent with that of highly incompatible elements. Thus, the variations in the Nb versus Pb contents (Fig. 10e) are indicative of melt/fluid – rock interaction. In this diagram (Fig. 10e), the samples record evidence of melt refertilization; this trend is magmatic and indicates that the positive correlation of Nb and Pb is due to melt refertilization (Niu, Reference Niu2004; Paulick et al. Reference Paulick, Bach, Godard, De Hoog, Suhr and Harvey2006). The scatter of some HSP samples on the Nb versus Pb diagram appears to be due to hydrothermal alteration modifying the Pb concentrations (Fig. 10e).

Figure 10. (a) Th versus Ce and (b) La versus Nb diagrams. Global abyssal peridotite field is from Niu (Reference Niu2004). (c) Th versus Gd/Lu ratio. Most of the samples show similar trends of melt/rock interaction. (d) Sm/Yb versus La/Sm diagram for the HSP rocks. The yellow field shows serpentinized peridotites from refertilized protoliths (Deschamps et al. Reference Deschamps, Godard, Guillot and Hattori2013). (e) Nb versus Pb diagram. Most of the samples show trends of magmatic processes. The fields of partial melting, melt refertilization, water–rock interaction and magmatic processes are from Chen et al. (Reference Chen, Zhou, Liu, Yang, Li and Dick2013).
Moreover, most of the HSP rocks have similar contents of REE and incompatible elements to refertilized abyssal serpentinized peridotites (melt–rock interaction (Fig. 7)). They are enriched in LILEs and LREEs and show a decoupling between Nb and Ta, with more enrichment in Ta. In Figure 11, the REE in the HSP rocks have similar patterns to abyssal serpentinized peridotites that underwent melt–rock (MRI) and fluid-rock (FRI) interactions; however, they do not have similar patterns to the average hydrothermal sediments from the Mid-Atlantic Ridge (MAR) (Dias & Barriga, Reference Dias and Barriga2006). These processes are supported by the significant correlation between LREEs and HFSEs (Fig. 10), which reflects melt refertilization with minor fluid–rock interaction. Furthermore, the REE patterns of the HSP rocks on the chondrite-normalized diagram (Sun & McDonough, Reference Sun, McDonough, Sunders and Norry1989) are almost flat and did not experience seawater alteration, as they exhibit negative Ce anomaly (Fig. 11). Therefore, we conclude that the enrichments in LREEs and other trace elements are clear evidence of melt–rock interaction (i.e. positive correlations between some LREEs and HFSEs), with some samples recording evidence of minor fluid–peridotite interaction.
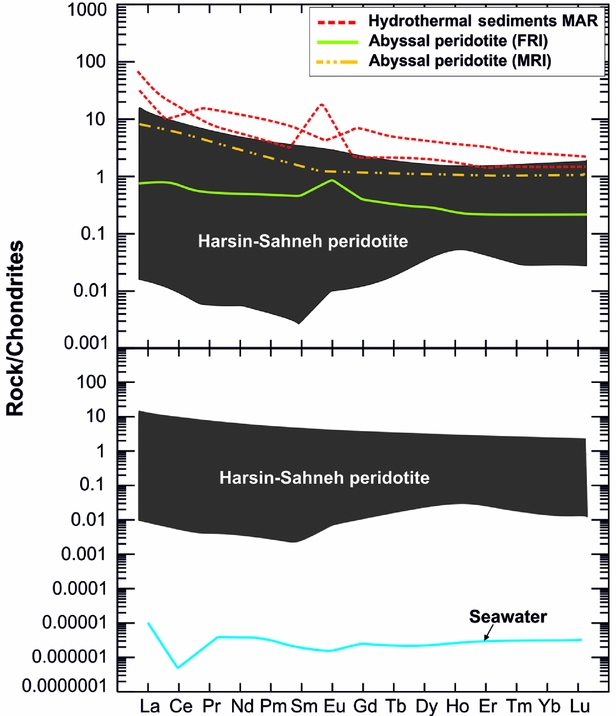
Figure 11. Chondrite-normalized REE abundances in the HSP rocks (Sun & McDonough, Reference Sun, McDonough, Sunders and Norry1989). The hydrothermal sediment data from the MAR (Rainbow and Saldanha serpentinite host vent) are from Dias & Barriga (Reference Dias and Barriga2006); data for abyssal peridotites that interacted with melt (MRI) and fluids (FRI) are from Paulick et al. (Reference Paulick, Bach, Godard, De Hoog, Suhr and Harvey2006); and seawater data are from Turekian (Reference Turekian1968).
8.c. Textures produced by melting and melt refertilization
Based on the above discussions, the textures and geochemistry of the HSP rocks offer evidences of cooling and decompression, partial melting and melt–rock reactions; although each process produces a specific mineral texture, some textures are not limited to a specific process and instead reveal the collective effect of several processes. They typically consist of orthopyroxene grains with exsolution lamellae of clinopyroxene (Fig. 4c) and spinel, vermicular spinel located within orthopyroxene grains or between orthopyroxene and olivine porphyroclasts (Fig. 4h, i), and embayed and flame-like spinel grains (Fig. 4d, i) that are produced during cooling and decompression or by the partial melting of abyssal peridotites at low pressures (Edwards & Malpas, Reference Edwards and Malpas1996; Pearce et al. Reference Pearce, Barker, Edwards, Parkinson and Leat2000; Miller et al. Reference Miller, Thöni, Frank, Schuster, Melcher, Meisel and Zanetti2003; Liu et al. Reference Liu, Wu, Wilde, Yu and Li2010; Li et al. Reference Li, Chen, Wang, Wang, Yang and Robinson2015). They are typical of oceanic mantle tectonites (Pearce et al. Reference Pearce, Barker, Edwards, Parkinson and Leat2000; Tamura et al. Reference Tamura, Arai, Ishimaru and Andal2008). Moseley (Reference Moseley1984) and Tamura & Arai (Reference Tamura and Arai2005) demonstrated that these types of cooling textures are widespread in both abyssal and SSZ peridotites, and are caused by a decrease in solubility of clinopyroxene and spinel in orthopyroxene due to cooling and decompression. In this stage, the partial melting of orthopyroxene leads to spinel/clinopyroxene intergrowths and the erosion of pyroxene grains (Fig. 4c) (Pearce et al. Reference Pearce, Barker, Edwards, Parkinson and Leat2000; Miller et al. Reference Miller, Thöni, Frank, Schuster, Melcher, Meisel and Zanetti2003; Liu et al. Reference Liu, Wu, Wilde, Yu and Li2010). As partial melting continues and more melt is produced, vermicular, chain and flame-like spinel grains (Fig. 4h, i) are formed within orthopyroxene or olivine crystals. Moreover, high degrees of partial melting and melt–rock reactions can cause the breakdown of pyroxene and its pseudomorphic replacement of spinel. These evidences are widely observed in many peridotites and are related to cooling and decompression of mantle peridotites; they were produced by partial melting of primary or evolved mantle or melt–rock interaction (Siena & Coltorti, Reference Siena and Coltorti1993; Edwards & Malpas, Reference Edwards and Malpas1996; Roeder, Poustovetov & Oskarsson, Reference Roeder, Poustovetov and Oskarsson2001; Li et al. Reference Li, Chen, Wang, Wang, Yang and Robinson2015).
Additionally, the vermicular grains of spinel located along grain boundaries and the interstitial clinopyroxene grains located between grains of olivine and orthopyroxene (Fig. 3f, g) are interpreted to represent the crystallization products of metasomatic melts (Morishita et al. Reference Morishita, Maeda, Miyashita, Kumagai, Matsumoto and Dick2007) and are also attributed to melt–rock interaction with incompletely extracted melts in abyssal peridotites (Seyler et al., Reference Seyler, Toplis, Lorand, Luguet and Cannat2001, Reference Seyler, Lorand, Dick and Drouin2007; Morishita et al. Reference Morishita, Maeda, Miyashita, Kumagai, Matsumoto and Dick2007). New interstitial clinopyroxene grains indicate that the penetration of melt can cause reactions with rock (Pearce et al. Reference Pearce, Barker, Edwards, Parkinson and Leat2000; Tamura et al. Reference Tamura, Arai, Ishimaru and Andal2008). Based on these textural and compositional data, we suggest that the HSP rocks are related by an increasing degree of depletion due to both partial melting and melt–rock reactions.
8.d. Trace element modelling of melting
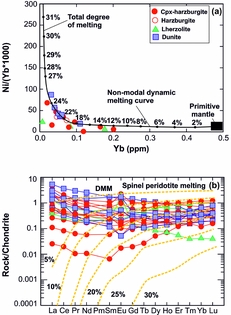
We constrain the depleted nature of the HSP rocks based on evidence from geochemical data indicating that they represent mantle residues produced by various degrees and multiple episodes of partial melting. Mysen & Kushiro (Reference Mysen and Kushiro1977) argued that if the mantle undergoes 2% partial melting, its Cr# value will be 0.2, whereas with 10% partial melting, its Cr# value will reach more than 0.3. If the Cr# of spinel reaches 0.22, the host rock underwent 10% partial melting, whereas if the Cr# value reaches 0.5, the host rock underwent 15% partial melting in the spinel lherzolite facies (Jaques & Green, Reference Jaques and Green1980). Based on this idea, the Cr# values of the HSP rocks range from 0.41 to 0.52, which is consistent with 15−20% partial melting of fertile spinel lherzolite. In addition, the abundances of Ni and Yb are less sensitive to melt–rock interaction or mantle metasomatism (Parkinson & Pearce, Reference Parkinson and Pearce1998; Green et al. Reference Green, Blundy, Adam and Yaxley2000; Deschamps et al. Reference Deschamps, Guillot, Godard, Chauvel, Andreani and Hattori2010; Uysal et al. Reference Uysal, Ersoy, Karslı, Dilek, Sadıklar, Ottley, Tiepolo and Meisel2012) and are useful tools for estimating the degree of partial melting (Uysal et al. Reference Uysal, Ersoy, Karslı, Dilek, Sadıklar, Ottley, Tiepolo and Meisel2012; Kapsiotis, Reference Kapsiotis2014). On the Yb versus Ni/Yb diagram, the HSP rocks are closely related to the residue produced by the 12–25% partial melting of the primitive mantle (Fig. 12a). Chondrite-normalized REE patterns and curve calculated for non-modal fractional melting of depleted MORB mantle (DMM) are shown in Figure 12b; in this diagram the HREEs variation coincides with the pattern calculated for 10–25% melt extraction (Fig. 12b), because HREEs are less mobile than LREEs during mantle metasomatism (Aldanmaz et al. Reference Aldanmaz, Schmidt, Gourgaud and Meisel2009; Niu et al. Reference Niu, Yang, Dilek, Xu, Li, Chen, Feng, Liu, Xiong and Liu2015; Marchesi et al. Reference Marchesi, Garrido, Proenza, Hidas, Varas-Reus, Butjosa and Lewis2016). The LREE abundances are significantly different from the melting model estimation and are higher than the calculated LREE contents, indicating that these mantle rocks were enriched in LREEs during the syn- and/or post-melting interaction with fluid/melts (Aldanmaz et al. Reference Aldanmaz, Schmidt, Gourgaud and Meisel2009; Marchesi et al. Reference Marchesi, Garrido, Godard, Belley and Ferré2009, Reference Marchesi, Garrido, Proenza, Hidas, Varas-Reus, Butjosa and Lewis2016; Niu et al. Reference Niu, Yang, Dilek, Xu, Li, Chen, Feng, Liu, Xiong and Liu2015).

Figure 12. (a) Yb versus Ni/Yb diagram for the HSP rocks. The closed system non-modal dynamic melting model of primitive mantle with spinel-facies mantle mineralogy Ol0.53(0.06)+Opx0.27(0.67)+Sp0.03(0.11) is from Palme & O'Neill (Reference Palme, O'Neill, Holland and Turrekian2004) and Kinzler (Reference Kinzler1997). Partition coefficients are compiled from Suhr (Reference Suhr1999), Green et al. (Reference Green, Blundy, Adam and Yaxley2000) and Adam & Green (Reference Adam and Green2006). (b) Chondrite-normalized REE patterns for the HSP rocks. The samples are compared to the REE patterns calculated for anhydrous non-modal fractional melting of depleted mantle (DMM) (Salters & Stracke, Reference Salters and Stracke2004) in the spinel lherzolite facies (yellow dashed lines). Source and melting for olivine, orthopyroxene and clinopyroxene modal proportion are 0.54:0.28:0.18 and 0.11:0.59:0.53 at 1.5 GPa (Niu, Reference Niu1997). Labels indicate partial melting degree. Partition coefficients are from Bedini & Bodinier (Reference Bedini and Bodinier1999), Donnelly et al. (Reference Donnelly, Goldstein, Langmuir and Spiegelman2004) and Su & Langmuir (Reference Su and Langmuir2003). Normalizing values are from Sun & McDonough (Reference Sun, McDonough, Sunders and Norry1989).
8.d. Geodynamic implications and synthesis
The Harsin–Sahneh ophiolite complex, which is Jurassic to Late Cretaceous in age, has been interpreted as a suture zone between the Arabian and Iranian Plates. Previous data (Delaloye & Desmons, Reference Delaloye and Desmons1980; Desmons & Beccaluva, Reference Desmons and Beccaluva1983; Ghazi & Hassanipak, Reference Ghazi and Hassanipak1999; Allahyari et al. Reference Allahyari, Saccani, Pourmoafi, Beccaluva and Masoudi2010; Saccani et al. Reference Saccani, Allahyari, Beccaluva and Bianchini2013) have suggested that the Harsin–Sahneh ophiolite formed at a mid-ocean ridge or island arc basin, whereas others (Wrobel Daveau et al. Reference Wrobel Daveau, Ringenbach, Tavakoli, Ruiz, Masse and Frizonde Lamotte2010; Azizi et al. Reference Azizi, Hadi, Asahara and Mohammad2013; Saccani et al. Reference Saccani, Allahyari, Beccaluva and Bianchini2013; Nouri et al. Reference Nouri, Azizi, Golonka, Asahara, Orihashi, Yamamoto, Tsuboi and Anma2016, Reference Nouri, Asahara, Azizi, Yamamoto and Tsuboi2017) have proposed that this zone formed in an undeveloped oceanic basin that was affected by a mantle plume.
As discussed above, our study shows that the HSP rocks have geochemical affinities to both MORB and supra-subduction-type rocks. These geochemical characteristics are directly related to a back-arc tectonic setting, which is supported by the elemental and isotopic signatures of the HSP rocks. We concluded that the evolution of the HSP rocks involved multiple episodes of depletion and refertilization. The less depleted HSP rocks may represent the restites produced by low degrees of partial melting during the first stage of partial melting in an extensional spreading basin. The trace element compositions of the less depleted HSP samples can be modelled by the low to moderate partial melting of a mantle source followed by interactions between the residual and percolating melt. In contrast, the highly depleted HSP rocks formed during the second stage of partial melting, followed by melt–peridotite interactions with the previously depleted mantle in an SSZ setting. The trace element abundances of the highly depleted peridotite can be explained by the high degree of partial melting of an already depleted mantle; this stage requires plate convergence and subduction, where the fluxing of the mantle by subduction melts caused the further melting of depleted peridotites to produce highly refractory residual compositions. These melting events are related to the drifting of the Arabian Plate during the Late Triassic – Early Jurassic (Delaloye & Desmons, Reference Delaloye and Desmons1980; Desmons & Beccaluva, Reference Desmons and Beccaluva1983; Ghazi & Hassanipak, Reference Ghazi and Hassanipak1999; Dilek & Ahmed, Reference Dilek, Ahmed, Dilek and Robinson2003; Alavi, Reference Alavi2004; Jassim & Goff, Reference Jassim and Goff2006; Allahyari et al. Reference Allahyari, Saccani, Pourmoafi, Beccaluva and Masoudi2010; Azizi et al. Reference Azizi, Hadi, Asahara and Mohammad2013; Saccani et al. Reference Saccani, Allahyari, Beccaluva and Bianchini2013; Shafaii Moghadam & Stern, Reference Shafaii Moghadam and Stern2015; Nouri et al. Reference Nouri, Azizi, Golonka, Asahara, Orihashi, Yamamoto, Tsuboi and Anma2016, Reference Nouri, Asahara, Azizi, Yamamoto and Tsuboi2017), such as the Neo-Tethys Ocean. During this stage, large volumes of HSP rocks were produced in an extensional spreading basin, as confirmed by the presence of some HSP rocks with a less depleted mantle origin. During this process, the HSP rocks were locally altered by seawater along deep faults and fractures. Then the initiation of subduction occurred from the Early Jurassic to the Late Cretaceous (Braud, Reference Braud1978; Shahidi & Nazari, Reference Shahidi and Nazari1997; Azizi et al. Reference Azizi, Hadi, Asahara and Mohammad2013; Ao et al. Reference Ao, Xiao, Khalatbari-Jafari, Talebian, Chen, Wan and Zhang2016; Davoudian et al. Reference Davoudian, Genser, Neubauer and Shabanian2016; Nouri et al. Reference Nouri, Azizi, Golonka, Asahara, Orihashi, Yamamoto, Tsuboi and Anma2016), and they experienced a second melting episode, in which the less enriched component was derived from continental crustal materials associated with the subducted slab.
9. Conclusions
The high LREE contents and significantly positive correlations between LREEs and HFSEs in the HSP rocks reflect the refertilization of residual peridotites by porous melt flow. Their Sr isotopic ratios show that water–rock interactions may not have played an important role in enriching their LREE contents. In contrast, melt–rock interaction can be considered to be a main cause of the LREEs enrichment of these rocks. Based on our findings in this research, the HSP rocks were predominantly formed by the extraction of MORB-like magma from mantle peridotite at a mid-oceanic ridge or in a back-arc basin due to a combination of melt/rock interactions and a high degree of partial melting in a supra-subduction zone from the Late Triassic to Late Cretaceous.
Acknowledgements
This research is supported by a JSPS KAKENHI grant in Japan (no. 25303029). We would like to thank Nagoya University (Japan) for supporting F. Nouri in summer 2016 and the University of Kurdistan for supporting field trips. The authors would like to give special thanks to Prof. K. Yamamoto from Nagoya University for supporting our XRF and ICP-MS analyses. We are grateful to Prof. S. Wallis from Nagoya University for supporting EMP analyses and to K. Mano from Nagoya University for his technical assistance. This paper benefited greatly from critical comments by Dr C. Deering, Editor, and two anonymous reviewers.