I. INTRODUCTION
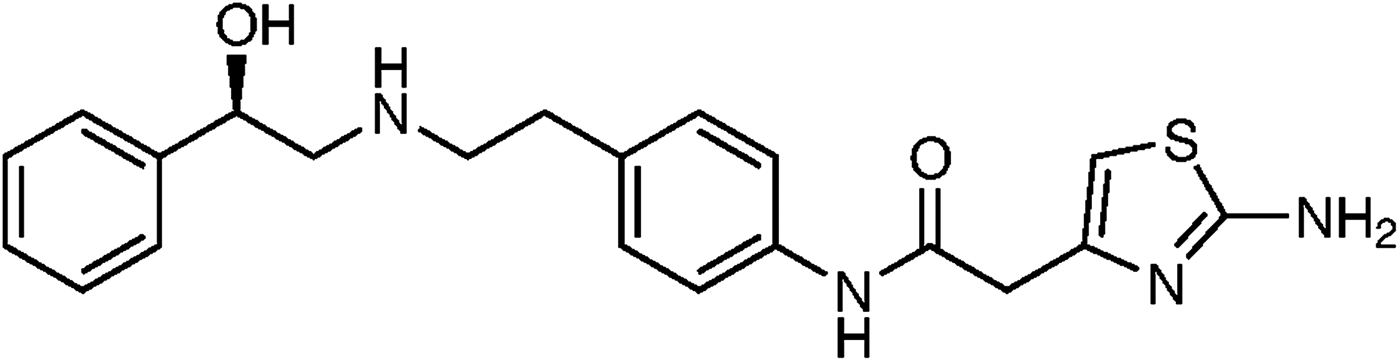
Mirabegron (Figure 1), an active pharmaceutical ingredient (API) approved in Japan, the USA, Canada and Europe, used for the symptomatic treatment of urgency, increased micturition frequency and/or urgency incontinence as may occur in adult patients with overactive bladder (OAB) syndrome. Mirabegron is a potent and selective β3-adrenoceptor agonist (Nitti et al., Reference Nitti, Khullar, van Kerrebroeck, Herschorn, Cambronero, Angulo, Blauwet, Dorrepaal, Siddiqui and Martin2013).

Figure 1. Chemical structure of mirabegron.
There are no entries for this important API in the Cambridge Structural Database (CSD) (Groom et al., Reference Groom, Bruno, Lightfoot and Ward2016) or the Powder Diffraction File (PDF)-4/Organics database. A study by spectroscopy methods (Fourier-transform-infrared spectroscopy (FT-IR), RAMAN), thermal analysis [thermogravimetric analysis (TGA)-differential scanning calorimetry (DSC)] and X-ray powder diffraction of this material, crystallized from a commercial product, was carried out as part of our interest in the structural characterization of pharmaceuticals compounds.
II. EXPERIMENTAL
A. Extraction and crystallization
Commercial Mirabegron was dissolved in a mixture of isopropanol: water. After filtering, the extract was crystallized by the solvothermal method in an autoclave under heating at 60 °C for 4 h. The density of the crystals was determined by the floatation method using potassium iodide solution.
B. IR and RAMAN spectroscopy
The FT-IR spectrum was measured in a IS50 FT-IR Nicolet Thermo Scientific spectrophotometer over the range 4000–400 cm−1 with 32 scans per sample in KBr pellets. RAMAN spectrum was recorded in a LabRam HR Evolution using a laser at 532 nm with 100% attenuation to 3 s. in a range of 1700–800 cm−1 owing to fluorescence sample.
C. Thermal analysis, TGA-DSC
Thermal analysis TGA-DSC were performed in a Thermal Analyzer differential thermal analysis/DSC Instrument Serie Discovery, both experiments under a nitrogen atmosphere with mass flow 50.0 ml min−1, equilibrate at 25 °C, ramp at 10 °C min−1 to 500 °C for TGA and 550 °C for DSC analysis.
C. X-ray powder diffraction data collection
Powder diffraction patterns were recorded at room temperature on a BRUKER D8 ADVANCE diffractometer using CuKα radiation, operating at 40 kV and 40 mA, in steps of 0.0156° (2θ), from 4° to 50° at 1 s per step. The diffractometer was equipped with the primary and secondary Soller slits of 2.5°, divergence slit of 0.6 mm, Nickel filter of 0.02 mm, and a LynxEye detector. The fitting and subtraction of background, using the Sonneveld and Visser (Reference Sonneveld and Visser1975) method, smoothing by sliding polynomials (Savitzky and Golay, Reference Savitzky and Golay1964) and Kα 2-stripping (Rachinger, Reference Rachinger1948) were performed using PowderX program (Dong, Reference Dong1999); the second derivative method was used to determine the peak observed positions.
III. RESULTS AND DISCUSSION
Raman spectrum (Figure 2) shows a strong band at 997 cm−1, corresponding to the vibration C–S. The vibration C=N appears at 1610 cm−1 and one at 1644 cm−1 corresponds to C=O. The FT-IR spectrum (Figure 2) shows the bands characteristic of the functional groups in the material showing the chemical nature of the compound. Stretching O–H is overlapped by the bands of stretching N–H observed at 3351 cm−1 and the amide at 3161 cm−1 absorption bands widened by possibly Csp2-H and Csp3-H are observed at 3050 cm−1 and 2951 cm−1, respectively. The characteristic band of the amide carbonyl (band I) is observed at 1557 cm−1 while the band II amide is observed at 1508 cm−1. Other important bands are 1596 cm−1 to stretching C=C and 1333 cm−1 corresponding to the C–N vibration. In general, the spectrum shows absorption bands widened by possibly numerous hydrogen bonds in the structure.
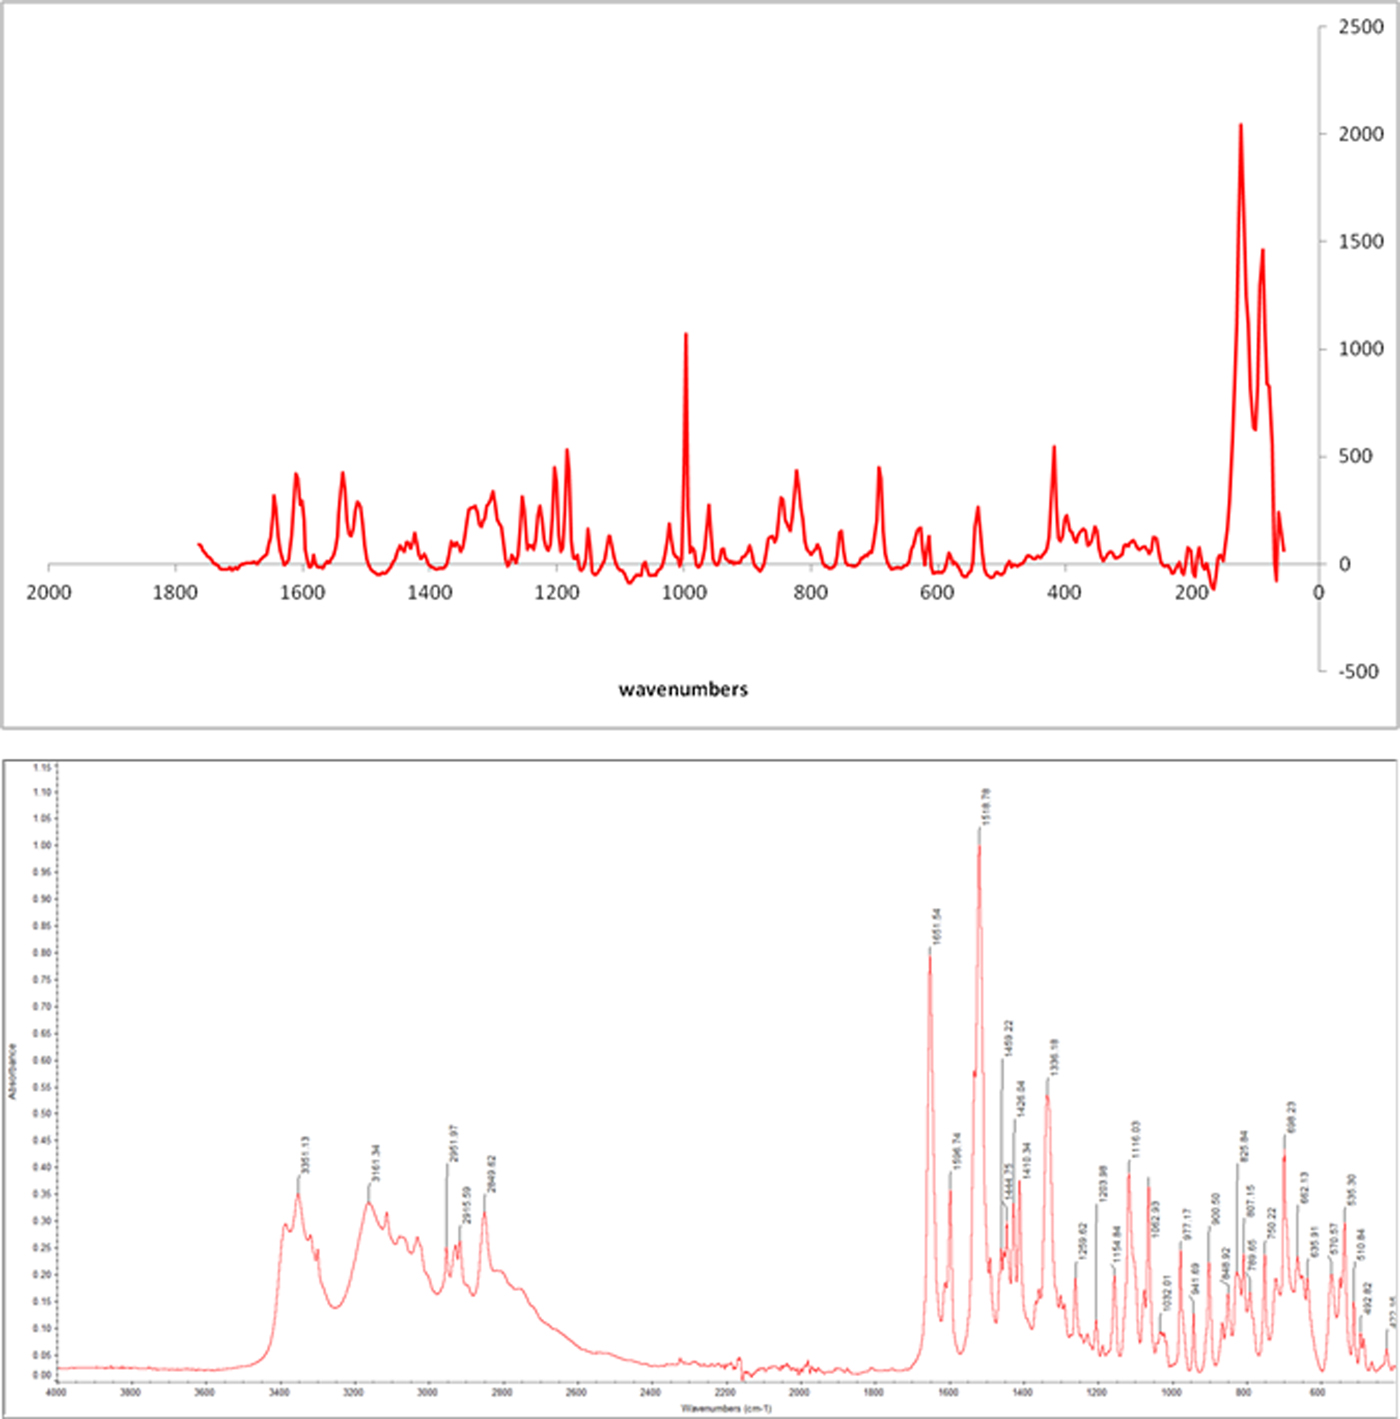
Figure 2. (Colour online) RAMAN spectrum (top) and IR spectrum (bottom) of mirabegron.
Mirabegron melts at 142.96 °C, according to the first endotherm in DSC analysis (Figure 3). The TGA curve (Figure 3) shows that the material is stable up to 200 °C, experiencing weight loss 70.08% at ~206–426 °C. This corresponds to the total decomposition of mirabegron.
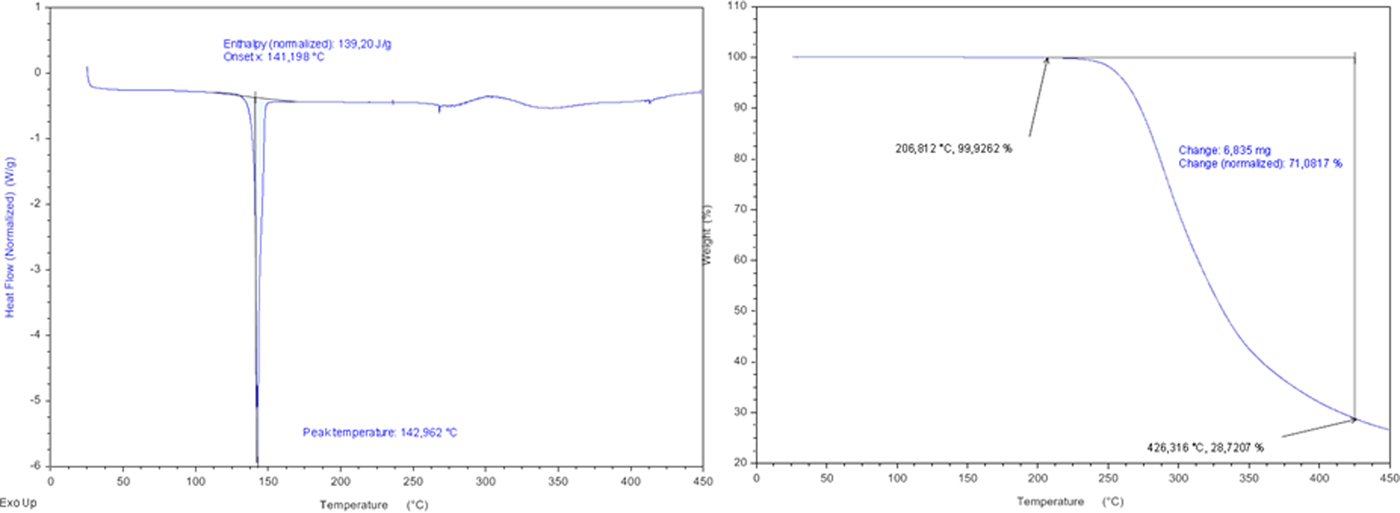
Figure 3. (Colour online) DSC (right) curve and TGA curve (left) of mirabegron.
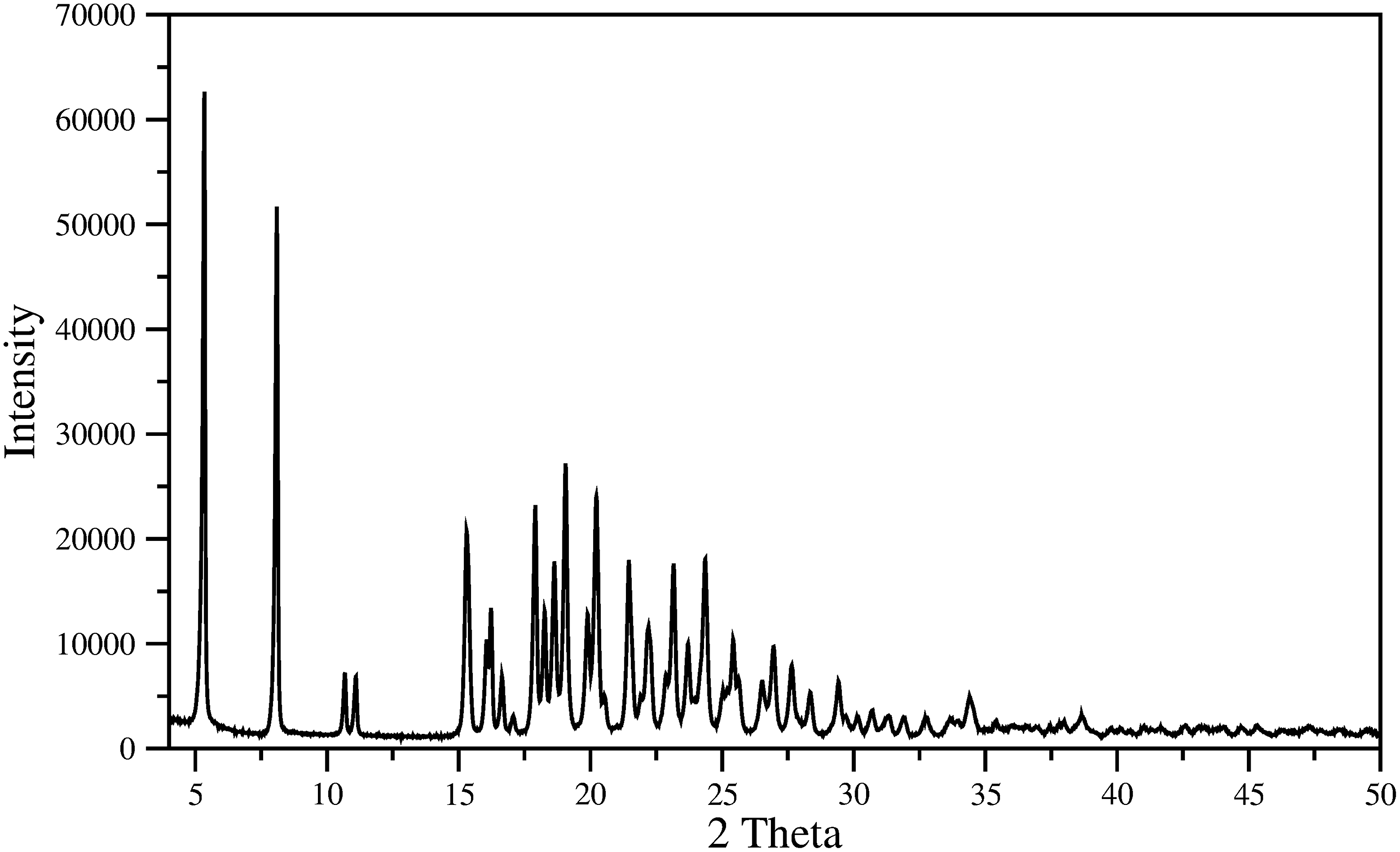
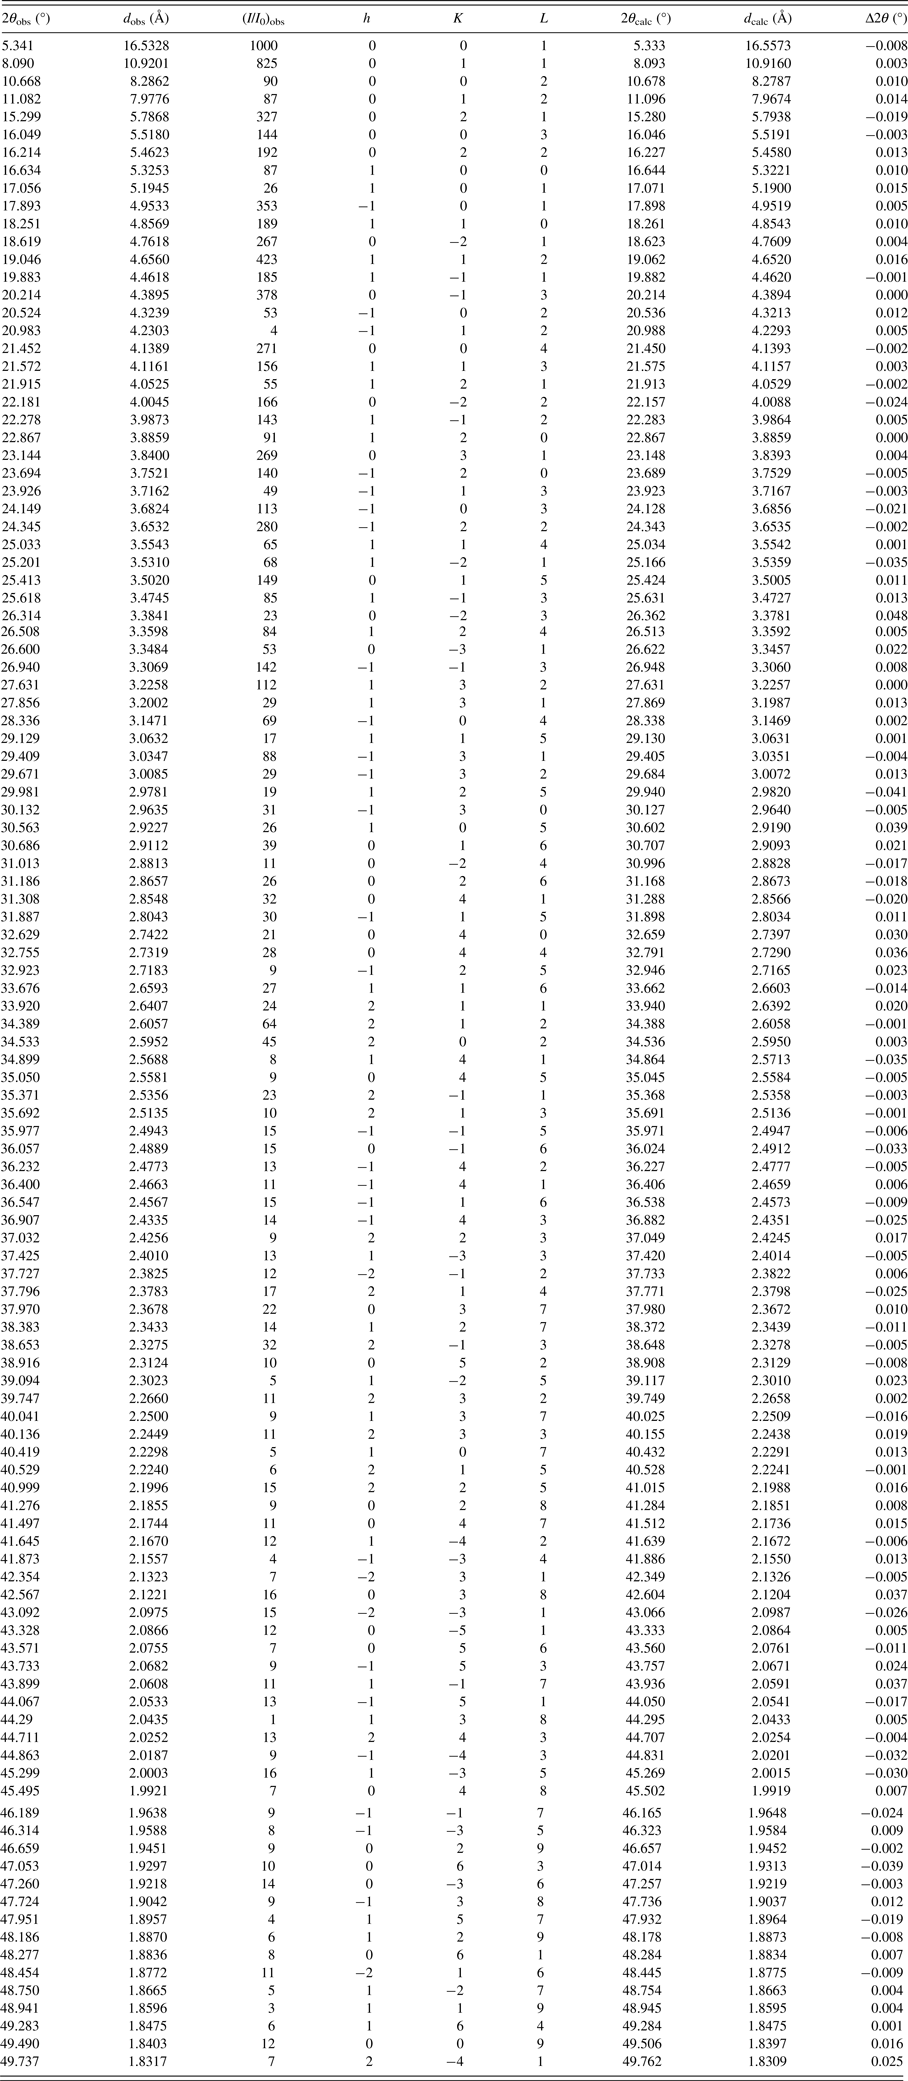
The indexing of pattern recorded (Figure 4) for the material was carried out with DICVOL14 (Boultif and Loüer, Reference Boultif and Loüer2014). The analysis with NSB*AIDS83 (Mighell et al., Reference Mighell, Hubbard and Stalick1981), resulted in a triclinic unit cell P1 with parameters: a = 5.351(2) Å, b = 11.612(2) Å, c = 17.591(2) Å, α = 70.79(1), β = 84.42(2), γ = 86.29(2), V = 1026.6(3) Å3, and figures of merit associated are M20 = 30.6 and F30 = 67.7 (0.0085, 52) (de Wolf, Reference de Wolff1968; Smith and Snyder, Reference Smith and Snyder1979). Table I contains the corresponding powder diffraction data. This pattern, in PD3 format, will be submitted for inclusion in the Powder Diffraction File. The space group is P1 with Z = 2, of the commercial material is chiral. The fitting of the whole pattern with the Le Bail algorithm in FULLPROF program (Rodriguez-Carvajal, Reference Rodriguez-Carvajal1990), using the above-mentioned unit cell parameters, accounts for all the diffraction maxima recorded. Z = 2 was estimated by density obtained by the flotation method (d = 1.22(1) g cm−3), and the calculated density, using this Z-value and the volume obtained from the indexing process, was 1.21 g cm−3, similar to measured density.

Figure 4. Powder diffraction pattern of mirabegron.
Table I. X-ray powder diffraction data of mirabegron.
SUPPLEMENTARY MATERIAL
The supplementary material for this article can be found at https://doi.org/10.1017/S0885715617001129.
ACKNOWLEDGEMENTS
The authors acknowledge the support of Vicerrectoría de Investigación y Extensión, Universidad Industrial de Santander (UIS) and Parque Tecnológico Guatiguará, UIS, Piedecuesta, Santander, Colombia, Laboratorio de Investigación en Polímeros for recording TGA-DSC data, Laboratorio de Espectroscopia for FT-IR and RAMAN spectra register and Laboratorio de Difracción de Rayos-X, for recording X-ray diffraction data.