1 Introduction
It is well known that when a container, partially filled with liquid, is periodically forced in the direction perpendicular to the liquid surface, waves, called Faraday waves, are excited (Benjamin & Ursell Reference Benjamin and Ursell1954; Edwards & Fauve Reference Edwards and Fauve1994; Kumar & Tuckerman Reference Kumar and Tuckerman1994). The wave pattern and wave type (gravity or capillary) depend on the forcing frequency and the forcing amplitude determines the amplification of the wave motion. Miles & Henderson (Reference Miles and Henderson1990) developed a Lagrangian–Hamiltonian formulation to explain the weakly nonlinear surface waves in cylindrical containers. This formulation contains some control parameters that allow one to determine the phase diagram of sloshing for the axisymmetric mode. Wave breaking and following wave-depression cavity collapse occur at forcing amplitudes well above the instability threshold, i.e. when waves are overdriven.
Understanding large-amplitude wave motions in containers is of practical and fundamental interest. In liquid storage tanks such as ship tanks (Faltinsen et al. Reference Faltinsen, Rognebakke, Lukovsky and Timokha2000) containing liquefied methane gas, or in rocket engine fuel tanks, large-amplitude wave motions can destabilize the tanks and enhance interfacial heat and mass transfer, hence leading to large pressure variations (Moran et al. Reference Moran, McNelis, Kudlac, Haberbusch and Satornino1994; Das & Hopfinger Reference Das and Hopfinger2009; Ludwig, Dreyer & Hopfinger Reference Ludwig, Dreyer and Hopfinger2013). It is therefore important to understand, in common low-viscosity fluids including water, the conditions of wave amplification leading to breaking. The lowest axisymmetric wave mode considered here is a rare event in application but is of fundamental interest because cavities produced in this way are free of large perturbations and are representative of cavities produced by objects entering or exiting from the free surface (Bergmann et al. Reference Bergmann, van der Meer, Stijnman, Sandtke, Prosperetti and Lohse2006; Ding et al. Reference Ding, Chen, Liu, Zhang, Gao and Lu2015).
Longuet-Higgins (Reference Longuet-Higgins1983) developed a potential flow theory of cavity collapse, treating the cavity interface as an evolving hyperboloid, of vertex angle
 $109.5^{\circ }$
. His theory compared well with vapour bubble collapse and the cavity formed by drop impact (Longuet-Higgins Reference Longuet-Higgins1990) but less so with overdriven axisymmetric surface gravity waves that give rise to cavity collapse and jet formation, as shown by Longuet-Higgins’s (Reference Longuet-Higgins1983) experiments, for conditions similar to the present ones. Longuet-Higgins & Dommermuth (Reference Longuet-Higgins and Dommermuth2001) have shown numerically the growth of vertical jets from the standing wave using a boundary-integral time-stepping technique. Later, Longuet-Higgins & Oguz (Reference Longuet-Higgins and Oguz1995) formulated a power-law dependence on time of cavity collapse velocity and acceleration in good qualitative agreement with numerically obtained free-surface profiles. Longuet-Higgins & Oguz (Reference Longuet-Higgins and Oguz1997) explained the power-law scaling of acceleration and collapse velocity with time
$109.5^{\circ }$
. His theory compared well with vapour bubble collapse and the cavity formed by drop impact (Longuet-Higgins Reference Longuet-Higgins1990) but less so with overdriven axisymmetric surface gravity waves that give rise to cavity collapse and jet formation, as shown by Longuet-Higgins’s (Reference Longuet-Higgins1983) experiments, for conditions similar to the present ones. Longuet-Higgins & Dommermuth (Reference Longuet-Higgins and Dommermuth2001) have shown numerically the growth of vertical jets from the standing wave using a boundary-integral time-stepping technique. Later, Longuet-Higgins & Oguz (Reference Longuet-Higgins and Oguz1995) formulated a power-law dependence on time of cavity collapse velocity and acceleration in good qualitative agreement with numerically obtained free-surface profiles. Longuet-Higgins & Oguz (Reference Longuet-Higgins and Oguz1997) explained the power-law scaling of acceleration and collapse velocity with time
 $\unicode[STIX]{x1D70F}$
in different physical situations including the flip-through phenomenon. They discussed the possibility of a range of exponents
$\unicode[STIX]{x1D70F}$
in different physical situations including the flip-through phenomenon. They discussed the possibility of a range of exponents
 $\unicode[STIX]{x1D6FC}$
(their
$\unicode[STIX]{x1D6FC}$
(their
 $\unicode[STIX]{x1D6FD}$
), cavity radius
$\unicode[STIX]{x1D6FD}$
), cavity radius
 $r\propto \unicode[STIX]{x1D70F}^{\unicode[STIX]{x1D6FC}}$
, with
$r\propto \unicode[STIX]{x1D70F}^{\unicode[STIX]{x1D6FC}}$
, with
 $\unicode[STIX]{x1D6FC}$
asymptotically limited to
$\unicode[STIX]{x1D6FC}$
asymptotically limited to
 $2/3$
. Burton, Waldrep & Taborek (Reference Burton, Waldrep and Taborek2005) experimentally analysed the pinch-off of a gas bubble in fluids of various viscosities, and observed a power-law behaviour in time with the exponent depending on the viscosity of the fluid. For very low values of viscosity the radial length scale (minimum radius) follows
$2/3$
. Burton, Waldrep & Taborek (Reference Burton, Waldrep and Taborek2005) experimentally analysed the pinch-off of a gas bubble in fluids of various viscosities, and observed a power-law behaviour in time with the exponent depending on the viscosity of the fluid. For very low values of viscosity the radial length scale (minimum radius) follows
 $\unicode[STIX]{x1D70F}^{1/2}$
, where
$\unicode[STIX]{x1D70F}^{1/2}$
, where
 $\unicode[STIX]{x1D70F}$
is the time remaining to pinching. In the case of a viscous liquid (glycerine–water) the radial length scale follows
$\unicode[STIX]{x1D70F}$
is the time remaining to pinching. In the case of a viscous liquid (glycerine–water) the radial length scale follows
 $\unicode[STIX]{x1D70F}\;(\unicode[STIX]{x1D6FC}=1)$
. For intermediate viscosities thread formation was observed with a time exponent
$\unicode[STIX]{x1D70F}\;(\unicode[STIX]{x1D6FC}=1)$
. For intermediate viscosities thread formation was observed with a time exponent
 $\unicode[STIX]{x1D6FC}>1/2$
. Burton & Taborek (Reference Burton and Taborek2007) observed viscous–inertial transition for coalescence of two initially circular lenses in quiescent water. The radial length scale follows
$\unicode[STIX]{x1D6FC}>1/2$
. Burton & Taborek (Reference Burton and Taborek2007) observed viscous–inertial transition for coalescence of two initially circular lenses in quiescent water. The radial length scale follows
 $\unicode[STIX]{x1D70F}$
in the initial stages and
$\unicode[STIX]{x1D70F}$
in the initial stages and
 $\unicode[STIX]{x1D70F}^{1/2}$
in the later stages, here
$\unicode[STIX]{x1D70F}^{1/2}$
in the later stages, here
 $\unicode[STIX]{x1D70F}$
being time after the initial contact. Thus, the power-law analysis of collapse and coalescence even at small scales shows the relevance of inertia and viscous effects with surface tension playing intermediate roles. In the experiments by Bergmann et al. (Reference Bergmann, van der Meer, Stijnman, Sandtke, Prosperetti and Lohse2006), where a cavity was produced by a vertically moving disc, collapse exhibited an exponent
$\unicode[STIX]{x1D70F}$
being time after the initial contact. Thus, the power-law analysis of collapse and coalescence even at small scales shows the relevance of inertia and viscous effects with surface tension playing intermediate roles. In the experiments by Bergmann et al. (Reference Bergmann, van der Meer, Stijnman, Sandtke, Prosperetti and Lohse2006), where a cavity was produced by a vertically moving disc, collapse exhibited an exponent
 $\unicode[STIX]{x1D6FC}<0.6$
tending towards
$\unicode[STIX]{x1D6FC}<0.6$
tending towards
 $0.5$
with increasing Froude number defined with the disc radius and velocity.
$0.5$
with increasing Froude number defined with the disc radius and velocity.
Concerning jetting, following axisymmetric wave-depression cavity collapse, Longuet-Higgins (Reference Longuet-Higgins1983) measured jet velocities of
 $8~\text{m}~\text{s}^{-1}$
using water in a container of 16.5 cm in diameter. More recently, Zeff et al. (Reference Zeff, Kleber, Fineberg and Lathrop2000) considered wave-depression cavity collapse using a glycerine–water solution which allows one to obtain smooth cavity boundaries and hence ‘perfect’ collapse as parasitic capillary waves are damped by viscosity. The experimentally observed jet velocity, in their container of 12.6 cm in diameter, reached values as high as
$8~\text{m}~\text{s}^{-1}$
using water in a container of 16.5 cm in diameter. More recently, Zeff et al. (Reference Zeff, Kleber, Fineberg and Lathrop2000) considered wave-depression cavity collapse using a glycerine–water solution which allows one to obtain smooth cavity boundaries and hence ‘perfect’ collapse as parasitic capillary waves are damped by viscosity. The experimentally observed jet velocity, in their container of 12.6 cm in diameter, reached values as high as
 $52~\text{m}~\text{s}^{-1}$
. A capillary scaling with
$52~\text{m}~\text{s}^{-1}$
. A capillary scaling with
 $U_{c}=(\unicode[STIX]{x1D70E}/\unicode[STIX]{x1D70C}R)^{1/2}$
(Weber number) of the jet velocity has been used. Das & Hopfinger (Reference Das and Hopfinger2008) conducted experiments with two different container sizes, 5 and 10 cm in diameter, and three different working fluids and, based on these experiments, suggested a scaling with gravitational velocity scale
$U_{c}=(\unicode[STIX]{x1D70E}/\unicode[STIX]{x1D70C}R)^{1/2}$
(Weber number) of the jet velocity has been used. Das & Hopfinger (Reference Das and Hopfinger2008) conducted experiments with two different container sizes, 5 and 10 cm in diameter, and three different working fluids and, based on these experiments, suggested a scaling with gravitational velocity scale
 $U_{g}=(gR)^{1/2}$
(Froude number scaling). The justification has been the large Bond number in these experiments, i.e. inertia is dominant over surface tension forces.
$U_{g}=(gR)^{1/2}$
(Froude number scaling). The justification has been the large Bond number in these experiments, i.e. inertia is dominant over surface tension forces.
In the light of the foregoing discussion, there is sufficient motivation to study in some detail the collapse of gravity wave-depression cavities as well as the dependency of the jet velocity on cavity depth and shape. We clearly demonstrate that the implosion of the cavity in a container of a size of the order of 10 cm is an inertial process and that obtaining high-velocity jets requires very fine tuning in forcing amplitude. The finite-time singularity scaling of jet velocity is reexamined and in addition a power-law model is proposed which is of practical interest because it does not require a singular wave amplitude. In § 2 the experimental conditions are presented and § 3 contains the experimentally obtained wave response and stability threshold diagrams. Then in § 4 we discuss the time dependency of cavity collapse. Section 5 contains the results on jet formation with a power-law analysis and a finite-time singularity scaling. An impulse model is developed that gives some physical insight into the dependency of jet formation on the singular cavity radius. The main conclusions and some further discussions are presented in § 6.
2 Experimental conditions
The experiments were conducted in circular cylindrical containers, made of Plexiglas, one of diameter
 $2R=10~\text{cm}$
and 10 cm deep and the other of
$2R=10~\text{cm}$
and 10 cm deep and the other of
 $2R=15~\text{cm}$
and 18 cm deep, which were mounted on a vertically oscillating vibration exciter (APS 400 ELECTRO-SEIS) of peak force 440 N. The respective natural frequencies of the axisymmetric mode (0,1) are 27.82 and
$2R=15~\text{cm}$
and 18 cm deep, which were mounted on a vertically oscillating vibration exciter (APS 400 ELECTRO-SEIS) of peak force 440 N. The respective natural frequencies of the axisymmetric mode (0,1) are 27.82 and
 $22.53~\text{rad}~\text{s}^{-1}$
. After calibration, the vibration amplitude was kept within
$22.53~\text{rad}~\text{s}^{-1}$
. After calibration, the vibration amplitude was kept within
 $\pm 0.30\,\%$
of the nominal value and the frequency within 0.02 %. Since the vibration is normal to the fluid surface, the waves are sub-harmonically excited. The working fluid used was water with 1 % detergent solution by volume added to reduce surface tension and prevent contact line pinning. The fluid properties are: surface tension,
$\pm 0.30\,\%$
of the nominal value and the frequency within 0.02 %. Since the vibration is normal to the fluid surface, the waves are sub-harmonically excited. The working fluid used was water with 1 % detergent solution by volume added to reduce surface tension and prevent contact line pinning. The fluid properties are: surface tension,
 $\unicode[STIX]{x1D70E}=50~\text{dyne}~\text{cm}^{-1}$
; kinematic viscosity,
$\unicode[STIX]{x1D70E}=50~\text{dyne}~\text{cm}^{-1}$
; kinematic viscosity,
 $\unicode[STIX]{x1D708}=1.062\times 10^{-6}~\text{m}^{2}~\text{s}^{-1}$
; density,
$\unicode[STIX]{x1D708}=1.062\times 10^{-6}~\text{m}^{2}~\text{s}^{-1}$
; density,
 $\unicode[STIX]{x1D70C}=985~\text{kg}~\text{m}^{-3}$
at
$\unicode[STIX]{x1D70C}=985~\text{kg}~\text{m}^{-3}$
at
 $20\,^{\circ }\text{C}$
. The Bond number
$20\,^{\circ }\text{C}$
. The Bond number
 $Bo=\unicode[STIX]{x1D70C}gR^{2}/\unicode[STIX]{x1D70E}=483$
in the smaller container and 1087 in the larger one. Experiments were conducted at room temperature, generally around
$Bo=\unicode[STIX]{x1D70C}gR^{2}/\unicode[STIX]{x1D70E}=483$
in the smaller container and 1087 in the larger one. Experiments were conducted at room temperature, generally around
 $25\,^{\circ }\text{C}$
. Experiments were also conducted using water with surface tension
$25\,^{\circ }\text{C}$
. Experiments were also conducted using water with surface tension
 $\unicode[STIX]{x1D70E}=0.072~\text{N}~\text{m}^{-1}$
. The fluid depth-to-radius ratio was
$\unicode[STIX]{x1D70E}=0.072~\text{N}~\text{m}^{-1}$
. The fluid depth-to-radius ratio was
 $h/R=1.2$
that is sufficient to satisfy deep-water conditions for the axisymmetric mode (Henderson & Miles Reference Henderson and Miles1990) with
$h/R=1.2$
that is sufficient to satisfy deep-water conditions for the axisymmetric mode (Henderson & Miles Reference Henderson and Miles1990) with
 $\tanh (k_{01}h)\approx 1$
. The container acceleration,
$\tanh (k_{01}h)\approx 1$
. The container acceleration,
 $a(t)=A\unicode[STIX]{x1D714}_{f}^{2}\sin (\unicode[STIX]{x1D714}_{f}t)$
, in all experiments is less than
$a(t)=A\unicode[STIX]{x1D714}_{f}^{2}\sin (\unicode[STIX]{x1D714}_{f}t)$
, in all experiments is less than
 $6~\text{m}~\text{s}^{-2}$
, where
$6~\text{m}~\text{s}^{-2}$
, where
 $\unicode[STIX]{x1D714}_{f}$
is the forcing frequency, equal to twice the wave frequency
$\unicode[STIX]{x1D714}_{f}$
is the forcing frequency, equal to twice the wave frequency
 $\unicode[STIX]{x1D714}$
, and
$\unicode[STIX]{x1D714}$
, and
 $A$
is the forcing amplitude. The experiments were conducted by starting each time from initially unperturbed condition, i.e. interface at rest. The displacement of the shaker was measured using a Wenglor CP24 laser displacement sensor with a resolution of
$A$
is the forcing amplitude. The experiments were conducted by starting each time from initially unperturbed condition, i.e. interface at rest. The displacement of the shaker was measured using a Wenglor CP24 laser displacement sensor with a resolution of
 $20~\unicode[STIX]{x03BC}\text{m}$
. Wave amplitude and wave trough and shapes were measured by visualizations and image analysis only. Images were captured using a Photron FASTCAM Mini UX100 high-speed camera with an acquisition speed of
$20~\unicode[STIX]{x03BC}\text{m}$
. Wave amplitude and wave trough and shapes were measured by visualizations and image analysis only. Images were captured using a Photron FASTCAM Mini UX100 high-speed camera with an acquisition speed of
 $2000{-}8000$
frames per second.
$2000{-}8000$
frames per second.

Figure 1. Instability threshold for the two container sizes: ▫, experimental instability threshold for axisymmetric mode (0,1) for
 $2R=10~\text{cm}$
; ♦, coexistence of (2,1) and (0,1);
$2R=10~\text{cm}$
; ♦, coexistence of (2,1) and (0,1);
 $\star$
, coexistence of (0,1) and (3,1); ▪, stability threshold for larger container
$\star$
, coexistence of (0,1) and (3,1); ▪, stability threshold for larger container
 $2R=15~\text{cm}$
; *, non-pinching; ○, pinch-off;
$2R=15~\text{cm}$
; *, non-pinching; ○, pinch-off;
 $\times$
, splash/incomplete cavity collapse. The natural frequency
$\times$
, splash/incomplete cavity collapse. The natural frequency
 $\unicode[STIX]{x1D714}_{0}=27.32~\text{rad}~\text{s}^{-1}$
for
$\unicode[STIX]{x1D714}_{0}=27.32~\text{rad}~\text{s}^{-1}$
for
 $2R=10~\text{cm}$
and
$2R=10~\text{cm}$
and
 $22.31~\text{rad}~\text{s}^{-1}$
for
$22.31~\text{rad}~\text{s}^{-1}$
for
 $2R=15~\text{cm}$
, where
$2R=15~\text{cm}$
, where
 $\unicode[STIX]{x1D714}_{0}=\unicode[STIX]{x1D714}_{01}(1-\unicode[STIX]{x1D6FF})$
. The solid lines are theoretical instability threshold curves (Miles & Henderson Reference Miles and Henderson1990).
$\unicode[STIX]{x1D714}_{0}=\unicode[STIX]{x1D714}_{01}(1-\unicode[STIX]{x1D6FF})$
. The solid lines are theoretical instability threshold curves (Miles & Henderson Reference Miles and Henderson1990).
3 Wave amplitude response
Figure 1 shows experimental and theoretical forcing amplitude–frequency instability threshold for water with 1 % detergent. For
 $2R=10~\text{cm}$
, the lowest threshold forcing amplitude is
$2R=10~\text{cm}$
, the lowest threshold forcing amplitude is
 $A_{c}/R=0.006$
with corresponding frequency
$A_{c}/R=0.006$
with corresponding frequency
 $\unicode[STIX]{x1D714}_{0}=27.32~\text{rad}~\text{s}^{-1}$
; for
$\unicode[STIX]{x1D714}_{0}=27.32~\text{rad}~\text{s}^{-1}$
; for
 $2R=15~\text{cm}$
, the instability threshold is
$2R=15~\text{cm}$
, the instability threshold is
 $A_{c}/R=0.0036$
with natural frequency
$A_{c}/R=0.0036$
with natural frequency
 $\unicode[STIX]{x1D714}_{0}=22.31~\text{rad}~\text{s}^{-1}$
. Note that
$\unicode[STIX]{x1D714}_{0}=22.31~\text{rad}~\text{s}^{-1}$
. Note that
 $\unicode[STIX]{x1D714}_{0}=\unicode[STIX]{x1D714}_{01}(1-\unicode[STIX]{x1D6FF})$
, with
$\unicode[STIX]{x1D714}_{0}=\unicode[STIX]{x1D714}_{01}(1-\unicode[STIX]{x1D6FF})$
, with
 $\unicode[STIX]{x1D714}_{01}$
the natural frequency of the wave mode obtained from the dispersion relation (Lighthill Reference Lighthill1978)
$\unicode[STIX]{x1D714}_{01}$
the natural frequency of the wave mode obtained from the dispersion relation (Lighthill Reference Lighthill1978)
 $$\begin{eqnarray}\unicode[STIX]{x1D714}_{mn}^{2}=gk_{mn}\left(1+\frac{k_{mn}^{2}\unicode[STIX]{x1D70E}}{g\unicode[STIX]{x1D70C}}\right)\tanh (k_{mn}h),\end{eqnarray}$$
where
 $\unicode[STIX]{x1D714}_{mn}$
is the natural frequency and the wave mode (
$\unicode[STIX]{x1D714}_{mn}$
is the natural frequency and the wave mode (
 $m,n$
) expresses
$m,n$
) expresses
 $m$
nodal diameters and
$m$
nodal diameters and
 $n$
nodal circles with
$n$
nodal circles with
 $m=0,1,\ldots$
and
$m=0,1,\ldots$
and
 $n=1,2,\ldots .$
The damping ratio,
$n=1,2,\ldots .$
The damping ratio,
 $\unicode[STIX]{x1D6FF}=\unicode[STIX]{x1D705}/\unicode[STIX]{x1D714}$
, is given by the measured decay rate,
$\unicode[STIX]{x1D6FF}=\unicode[STIX]{x1D705}/\unicode[STIX]{x1D714}$
, is given by the measured decay rate,
 $\unicode[STIX]{x1D705}$
, of stable wave motion excited close to
$\unicode[STIX]{x1D705}$
, of stable wave motion excited close to
 $A_{c}/R$
. Figure 2 shows the decay rates for water with 1 % detergent for the smaller container (10 cm, symbol ▫) and the larger container (15 cm, symbol ▪). The decay of the wave amplitude is exponential:
$A_{c}/R$
. Figure 2 shows the decay rates for water with 1 % detergent for the smaller container (10 cm, symbol ▫) and the larger container (15 cm, symbol ▪). The decay of the wave amplitude is exponential:
 $b=b_{0}\exp (-\unicode[STIX]{x1D705}t)$
, where
$b=b_{0}\exp (-\unicode[STIX]{x1D705}t)$
, where
 $b_{0}$
is the amplitude when the forcing is stopped. This gives a damping ratio
$b_{0}$
is the amplitude when the forcing is stopped. This gives a damping ratio
 $\unicode[STIX]{x1D6FF}=\unicode[STIX]{x1D705}/\unicode[STIX]{x1D714}\simeq 0.018$
for the small container and
$\unicode[STIX]{x1D6FF}=\unicode[STIX]{x1D705}/\unicode[STIX]{x1D714}\simeq 0.018$
for the small container and
 $0.010$
for the larger one. The solid lines shown in figure 1 are theoretical stability thresholds based on the damping ratio calculated from the decay experiments. The frequency domain of existence of stable wave motion is given by a detuning parameter (Henderson & Miles Reference Henderson and Miles1990). Here, in the 10 cm container, the axisymmetric mode bifurcates to (2,1) mode at
$0.010$
for the larger one. The solid lines shown in figure 1 are theoretical stability thresholds based on the damping ratio calculated from the decay experiments. The frequency domain of existence of stable wave motion is given by a detuning parameter (Henderson & Miles Reference Henderson and Miles1990). Here, in the 10 cm container, the axisymmetric mode bifurcates to (2,1) mode at
 $\unicode[STIX]{x1D714}/\unicode[STIX]{x1D714}_{0}=0.935$
and to (3,1) mode at
$\unicode[STIX]{x1D714}/\unicode[STIX]{x1D714}_{0}=0.935$
and to (3,1) mode at
 $\unicode[STIX]{x1D714}/\unicode[STIX]{x1D714}_{0}=1.027$
. The shapes of the wave and wave depression for the respective modes are indicated in the images in figure 1. Above the instability threshold there is coexistence of (0,1) and (2,1) in the overlap region (
$\unicode[STIX]{x1D714}/\unicode[STIX]{x1D714}_{0}=1.027$
. The shapes of the wave and wave depression for the respective modes are indicated in the images in figure 1. Above the instability threshold there is coexistence of (0,1) and (2,1) in the overlap region (
 $\diamond$
). Coexistence is also observed in the overlap region of (0,1) and (3,1) (
$\diamond$
). Coexistence is also observed in the overlap region of (0,1) and (3,1) (
 $\star$
). The behaviour is similar in the larger container but is not shown here.
$\star$
). The behaviour is similar in the larger container but is not shown here.

Figure 2. Log–linear plot of gravity wave amplitude as a function of time. Here
 $b_{0}$
is the wave amplitude when the forcing is stopped. The solid lines are fitted with slope
$b_{0}$
is the wave amplitude when the forcing is stopped. The solid lines are fitted with slope
 $\unicode[STIX]{x1D705}=0.485~\text{s}^{-1}$
at
$\unicode[STIX]{x1D705}=0.485~\text{s}^{-1}$
at
 $\unicode[STIX]{x1D714}=27.33~\text{rad}~\text{s}^{-1}$
(▫,
$\unicode[STIX]{x1D714}=27.33~\text{rad}~\text{s}^{-1}$
(▫,
 $2R=10~\text{cm}$
) and
$2R=10~\text{cm}$
) and
 $\unicode[STIX]{x1D705}=0.22~\text{s}^{-1}$
at
$\unicode[STIX]{x1D705}=0.22~\text{s}^{-1}$
at
 $\unicode[STIX]{x1D714}=22.30~\text{rad}~\text{s}^{-1}$
(
$\unicode[STIX]{x1D714}=22.30~\text{rad}~\text{s}^{-1}$
(
 $\times$
,
$\times$
,
 $2R=15~\text{cm}$
).
$2R=15~\text{cm}$
).
In the breaking regime at
 $\unicode[STIX]{x1D714}/\unicode[STIX]{x1D714}_{0}=0.95$
, amplitude sweeps with deviations from axisymmetry are shown in figure 3. The collapsing axisymmetric cavity has a (2,1) mode superimposed (figure 3
a;
$\unicode[STIX]{x1D714}/\unicode[STIX]{x1D714}_{0}=0.95$
, amplitude sweeps with deviations from axisymmetry are shown in figure 3. The collapsing axisymmetric cavity has a (2,1) mode superimposed (figure 3
a;
 $A/R=0.0281$
). The behaviour is similar at
$A/R=0.0281$
). The behaviour is similar at
 $\unicode[STIX]{x1D714}/\unicode[STIX]{x1D714}_{0}=1.035$
where the modes (0,1) and (3,1) coexists (figure 3
b;
$\unicode[STIX]{x1D714}/\unicode[STIX]{x1D714}_{0}=1.035$
where the modes (0,1) and (3,1) coexists (figure 3
b;
 $A/R=0.0208$
), but with steady-state wave motion.
$A/R=0.0208$
), but with steady-state wave motion.
4 Cavity shape and collapse
4.1 Cavity shapes
Figure 4 shows images of the shapes of the cavity, starting from its maximum depth and diameter (figure 4
e), to the singular shape at
 $t_{0}$
just before jet emergence. The forcing amplitude here is
$t_{0}$
just before jet emergence. The forcing amplitude here is
 $A/R=0.0223$
and
$A/R=0.0223$
and
 $\unicode[STIX]{x1D714}/\unicode[STIX]{x1D714}_{0}=0.995$
,
$\unicode[STIX]{x1D714}/\unicode[STIX]{x1D714}_{0}=0.995$
,
 $2R=15~\text{cm}$
.
$2R=15~\text{cm}$
.

Figure 3. (a) Coexistence of two different modes in the breaking regime. Modes (2,1) and (0,1) coexist in the breaking regime of axisymmetric (0,1) mode (
 $\unicode[STIX]{x1D714}/\unicode[STIX]{x1D714}_{0}=0.954$
,
$\unicode[STIX]{x1D714}/\unicode[STIX]{x1D714}_{0}=0.954$
,
 $A/R=0.0281$
). The dominant mode is (0,1). The three images show the last wave amplitude (stable wave before breaking), cavity formation and jetting (
$A/R=0.0281$
). The dominant mode is (0,1). The three images show the last wave amplitude (stable wave before breaking), cavity formation and jetting (
 $T$
is the period). The (2,1) mode interference results in loss of axisymmetry. (b) Coexistence of (0,1) and (3,1) modes at
$T$
is the period). The (2,1) mode interference results in loss of axisymmetry. (b) Coexistence of (0,1) and (3,1) modes at
 $\unicode[STIX]{x1D714}/\unicode[STIX]{x1D714}_{0}=1.04$
,
$\unicode[STIX]{x1D714}/\unicode[STIX]{x1D714}_{0}=1.04$
,
 $A/R=0.0208$
. The (3,1) mode is more dominant and if the forcing amplitude
$A/R=0.0208$
. The (3,1) mode is more dominant and if the forcing amplitude
 $A/R$
is increased, breaking occurs in (3,1) mode.
$A/R$
is increased, breaking occurs in (3,1) mode.
Composite images of the wave-depression cavity and of jet formation (upper part of each image) are shown in figure 5, obtained in container
 $2R=15~\text{cm}$
. When
$2R=15~\text{cm}$
. When
 $A/R=0.0223$
and
$A/R=0.0223$
and
 $\unicode[STIX]{x1D714}/\unicode[STIX]{x1D714}_{0}=0.995$
(figure 5
a), the cavity collapses without pinch-off at the bottom, whereas when
$\unicode[STIX]{x1D714}/\unicode[STIX]{x1D714}_{0}=0.995$
(figure 5
a), the cavity collapses without pinch-off at the bottom, whereas when
 $A/R=0.0224$
pinch-off occurs (figure 5
b), resulting in a lower jet velocity because of dissipation of some of the energy in the form of a bubble and the resulting cavity depth is less.
$A/R=0.0224$
pinch-off occurs (figure 5
b), resulting in a lower jet velocity because of dissipation of some of the energy in the form of a bubble and the resulting cavity depth is less.

Figure 4. Sequence of images showing the shape of the cavity during collapse (
 $A/R=0.0223$
and
$A/R=0.0223$
and
 $\unicode[STIX]{x1D714}/\unicode[STIX]{x1D714}_{0}=0.995$
) in a near singular event in the
$\unicode[STIX]{x1D714}/\unicode[STIX]{x1D714}_{0}=0.995$
) in a near singular event in the
 $2R=15~\text{cm}$
container. The shape at
$2R=15~\text{cm}$
container. The shape at
 $t=t_{0}$
here is the singular state. Images (a–e) are respectively at times 1, 1.5, 2, 3 and 6 ms before the collapse time
$t=t_{0}$
here is the singular state. Images (a–e) are respectively at times 1, 1.5, 2, 3 and 6 ms before the collapse time
 $t_{0}$
. Time at
$t_{0}$
. Time at
 $Z_{c}$
(maximum depth of cavity after last stable wave amplitude) here is 20 ms before
$Z_{c}$
(maximum depth of cavity after last stable wave amplitude) here is 20 ms before
 $t_{0}$
.
$t_{0}$
.
The bubble pinch-off in the collapsing cavity, when the wave depression is created by a large-amplitude wave, forms an interface similar to vapour bubble collapse/drop impact. Based on potential flow theory of collapsing cavities by Longuet-Higgins (Reference Longuet-Higgins1983), the critical value of vertex angle is
 $109.5^{\circ }$
. For cavity collapse with bubble pinch-off, the vertex angle (
$109.5^{\circ }$
. For cavity collapse with bubble pinch-off, the vertex angle (
 $\unicode[STIX]{x1D6FE}$
) is obtained close to the theoretical value (see figure 6
b–d) with an exception when the pinched-off bubble is small (figure 6
a) or very close to the singular event. For near-singular collapse the vertex angle is found to be less than
$\unicode[STIX]{x1D6FE}$
) is obtained close to the theoretical value (see figure 6
b–d) with an exception when the pinched-off bubble is small (figure 6
a) or very close to the singular event. For near-singular collapse the vertex angle is found to be less than
 $90^{\circ }$
.
$90^{\circ }$
.
The decay rate
 $\unicode[STIX]{x1D705}$
of capillary waves (internal damping) is in the linear theory limit and for a clean surface,
$\unicode[STIX]{x1D705}$
of capillary waves (internal damping) is in the linear theory limit and for a clean surface,
 $\unicode[STIX]{x1D705}=2\unicode[STIX]{x1D708}k^{2}$
(Lamb Reference Lamb1932) and is valid when viscosity effects are weak, which is the case when the wavenumber
$\unicode[STIX]{x1D705}=2\unicode[STIX]{x1D708}k^{2}$
(Lamb Reference Lamb1932) and is valid when viscosity effects are weak, which is the case when the wavenumber
 $k\ll \sqrt{\unicode[STIX]{x1D714}/\unicode[STIX]{x1D708}}$
(Denner Reference Denner2016). Krishnan, Hopfinger & Puthenveettil (Reference Krishnan, Hopfinger and Puthenveettil2017) showed that this damping rate is a good approximation for damping of small-amplitude capillary waves on the cavity boundary in bubble collapse in water and even in glycerine–water. Adding detergent may, besides lowering the surface tension, give rise to surface tension gradients (hence induced fluid motion) due to straining by waves, in a way similar to that shown by Hürhnerfuss, Lange & Walter (Reference Hürhnerfuss, Lange and Walter1985) for other additives. In the present situation, the amplitude of capillary waves on the cavity boundary is small so that wave straining is most likely also small. Decay experiments (figure 7) are conducted with capillary waves in water and with 1 % detergent water solution. As seen in figure 7, the wave amplitude decay is exponential with constant
$k\ll \sqrt{\unicode[STIX]{x1D714}/\unicode[STIX]{x1D708}}$
(Denner Reference Denner2016). Krishnan, Hopfinger & Puthenveettil (Reference Krishnan, Hopfinger and Puthenveettil2017) showed that this damping rate is a good approximation for damping of small-amplitude capillary waves on the cavity boundary in bubble collapse in water and even in glycerine–water. Adding detergent may, besides lowering the surface tension, give rise to surface tension gradients (hence induced fluid motion) due to straining by waves, in a way similar to that shown by Hürhnerfuss, Lange & Walter (Reference Hürhnerfuss, Lange and Walter1985) for other additives. In the present situation, the amplitude of capillary waves on the cavity boundary is small so that wave straining is most likely also small. Decay experiments (figure 7) are conducted with capillary waves in water and with 1 % detergent water solution. As seen in figure 7, the wave amplitude decay is exponential with constant
 $\unicode[STIX]{x1D705}$
, but in both water and 1 % detergent solution the decay rate is slightly larger than given by the classical expression. Writing
$\unicode[STIX]{x1D705}$
, but in both water and 1 % detergent solution the decay rate is slightly larger than given by the classical expression. Writing
 $\unicode[STIX]{x1D705}=C\unicode[STIX]{x1D708}k^{2}$
, experiments give
$\unicode[STIX]{x1D705}=C\unicode[STIX]{x1D708}k^{2}$
, experiments give
 $C=2.1$
for water and
$C=2.1$
for water and
 $C=2.4$
for water with 1 % detergent. The wavenumbers
$C=2.4$
for water with 1 % detergent. The wavenumbers
 $k$
are determined by measuring the wavelengths in the experiments and are respectively
$k$
are determined by measuring the wavelengths in the experiments and are respectively
 $k=1100$
and
$k=1100$
and
 $1220~\text{m}^{-1}$
. A prefactor larger than 2 is plausible for real fluids as is shown by Rajan & Henderson (Reference Rajan and Henderson2018) (their equation (75c)). To study capillary wave damping in more detail goes beyond the scope of the present work. The interest here is to show the scaling for wave damping and get an estimation for complete damping of capillary waves.
$1220~\text{m}^{-1}$
. A prefactor larger than 2 is plausible for real fluids as is shown by Rajan & Henderson (Reference Rajan and Henderson2018) (their equation (75c)). To study capillary wave damping in more detail goes beyond the scope of the present work. The interest here is to show the scaling for wave damping and get an estimation for complete damping of capillary waves.

Figure 5. Composite images of cavity just before collapse (bottom of each image) and the jetting (upper part of each image) in container
 $2R=15~\text{cm}$
: (a)
$2R=15~\text{cm}$
: (a)
 $A/R=0.0223$
and
$A/R=0.0223$
and
 $\unicode[STIX]{x1D714}/\unicode[STIX]{x1D714}_{0}=0.995$
, near singular case with jet velocity as high as
$\unicode[STIX]{x1D714}/\unicode[STIX]{x1D714}_{0}=0.995$
, near singular case with jet velocity as high as
 $44~\text{m}~\text{s}^{-1}$
; (b)
$44~\text{m}~\text{s}^{-1}$
; (b)
 $A/R=0.0224$
,
$A/R=0.0224$
,
 $\unicode[STIX]{x1D714}/\unicode[STIX]{x1D714}_{0}=0.995$
; the velocity is
$\unicode[STIX]{x1D714}/\unicode[STIX]{x1D714}_{0}=0.995$
; the velocity is
 $18~\text{m}~\text{s}^{-1}$
.
$18~\text{m}~\text{s}^{-1}$
.
The characteristic time can be taken as half the gravity wave (mode 0,1) period
 $t=\unicode[STIX]{x03C0}/\sqrt{3.832g/R}$
. Disturbances of wavelength
$t=\unicode[STIX]{x03C0}/\sqrt{3.832g/R}$
. Disturbances of wavelength
 $\unicode[STIX]{x1D706}$
can thus be considered fully damped when
$\unicode[STIX]{x1D706}$
can thus be considered fully damped when
 $\unicode[STIX]{x1D705}t\approx 4$
. Thus, waves of wavelength
$\unicode[STIX]{x1D705}t\approx 4$
. Thus, waves of wavelength
 $$\begin{eqnarray}\unicode[STIX]{x1D706}/R\lesssim 3.98\sqrt{C/Re_{I}}\end{eqnarray}$$
will be damped, where
 $Re_{I}=(R^{3}g)^{1/2}/\unicode[STIX]{x1D708}$
is a Reynolds number defined with the gravitational velocity. For water, in a container of 10 cm in diameter,
$Re_{I}=(R^{3}g)^{1/2}/\unicode[STIX]{x1D708}$
is a Reynolds number defined with the gravitational velocity. For water, in a container of 10 cm in diameter,
 $Re_{I}=3.5\times 10^{4}$
; hence
$Re_{I}=3.5\times 10^{4}$
; hence
 $\unicode[STIX]{x1D706}/R<0.073$
. In glycerine–water of
$\unicode[STIX]{x1D706}/R<0.073$
. In glycerine–water of
 $10^{2}$
times the viscosity of water,
$10^{2}$
times the viscosity of water,
 $\unicode[STIX]{x1D706}/R\approx 0.3$
(assuming
$\unicode[STIX]{x1D706}/R\approx 0.3$
(assuming
 $C=2$
), which is sufficient for obtaining smooth wave-depression contours. However, it is likely that also in glycerine–water
$C=2$
), which is sufficient for obtaining smooth wave-depression contours. However, it is likely that also in glycerine–water
 $C>2$
, so that in glycerine–water waves
$C>2$
, so that in glycerine–water waves
 $\unicode[STIX]{x1D706}/R>0.3$
are already damped. Composite images of last stable wave amplitude and cavity shape 2.5 ms before implosion are shown in figure 7(b). Water shows the presence of capillary waves on the cavity interface just before cavity implosion. As the decay rate in 1 % detergent solution is larger, the capillary waves are damped resulting in a smoother cavity.
$\unicode[STIX]{x1D706}/R>0.3$
are already damped. Composite images of last stable wave amplitude and cavity shape 2.5 ms before implosion are shown in figure 7(b). Water shows the presence of capillary waves on the cavity interface just before cavity implosion. As the decay rate in 1 % detergent solution is larger, the capillary waves are damped resulting in a smoother cavity.

Figure 6. The vertex angles of the interface in four different pinch-off collapses for
 $2R=15~\text{cm}$
are shown. (a) Just pinch-off for near singular case
$2R=15~\text{cm}$
are shown. (a) Just pinch-off for near singular case
 $A/R=0.02796$
with vertex angle
$A/R=0.02796$
with vertex angle
 $\unicode[STIX]{x1D6FE}=90^{\circ }$
; (b)
$\unicode[STIX]{x1D6FE}=90^{\circ }$
; (b)
 $A/R=0.0281$
,
$A/R=0.0281$
,
 $\unicode[STIX]{x1D6FE}\approx 108.5^{\circ }$
; (c)
$\unicode[STIX]{x1D6FE}\approx 108.5^{\circ }$
; (c)
 $A/R=0.02987$
,
$A/R=0.02987$
,
 $\unicode[STIX]{x1D6FE}\approx 110^{\circ }$
; (d)
$\unicode[STIX]{x1D6FE}\approx 110^{\circ }$
; (d)
 $A/R=0.030$
,
$A/R=0.030$
,
 $\unicode[STIX]{x1D6FE}\approx 105.6^{\circ }$
.
$\unicode[STIX]{x1D6FE}\approx 105.6^{\circ }$
.

Figure 7. (a) Log–linear plot of capillary wave amplitude verses time after forcing is stopped:
 $+$
, water,
$+$
, water,
 $\unicode[STIX]{x1D705}=2.53~\text{s}^{-1}$
;
$\unicode[STIX]{x1D705}=2.53~\text{s}^{-1}$
;
 $\times$
, water with 1 % detergent,
$\times$
, water with 1 % detergent,
 $\unicode[STIX]{x1D705}=3.58~\text{s}^{-1}$
;
$\unicode[STIX]{x1D705}=3.58~\text{s}^{-1}$
;
 $\unicode[STIX]{x1D714}=110~\text{rad}~\text{s}^{-1}$
. (b) Composite images of last wave amplitude (in the upper half) and cavity shape
$\unicode[STIX]{x1D714}=110~\text{rad}~\text{s}^{-1}$
. (b) Composite images of last wave amplitude (in the upper half) and cavity shape
 $2.5~\text{ms}$
before cavity implosion (in the lower half) for water with
$2.5~\text{ms}$
before cavity implosion (in the lower half) for water with
 $b/R=0.944$
in the left-hand image and 1 % detergent solution with
$b/R=0.944$
in the left-hand image and 1 % detergent solution with
 $b/R=0.956$
in the right-hand image.
$b/R=0.956$
in the right-hand image.
4.2 Cavity dynamics
The exponents of the power law in time of cavity radius change are directly related to the relevant forces that act on the cavity (Longuet-Higgins & Oguz Reference Longuet-Higgins and Oguz1995, Reference Longuet-Higgins and Oguz1997). Figure 8 indicates how
 $(Z(t)-Z_{0}(t_{0}))$
(the axial change of cavity) and the radial changes are measured when jetting conditions are approached from the full-size cavity
$(Z(t)-Z_{0}(t_{0}))$
(the axial change of cavity) and the radial changes are measured when jetting conditions are approached from the full-size cavity
 $Z_{c}$
(after last stable wave amplitude). As indicated in the inset,
$Z_{c}$
(after last stable wave amplitude). As indicated in the inset,
 $Z_{0}(t_{0})$
represents the cavity depth at time
$Z_{0}(t_{0})$
represents the cavity depth at time
 $t_{0}$
(
$t_{0}$
(
 $t_{0}$
corresponds to jet initiation) measured from the free surface and
$t_{0}$
corresponds to jet initiation) measured from the free surface and
 $Z(t)$
refers to the depth at any time instant before the collapse.
$Z(t)$
refers to the depth at any time instant before the collapse.

Figure 8. Cavity shapes with definitions of
 $Z_{c}$
,
$Z_{c}$
,
 $r_{1}$
,
$r_{1}$
,
 $r_{0}$
and
$r_{0}$
and
 $Z_{0}$
.
$Z_{0}$
.
 $Z_{c}$
is the maximum depth following the last stable wave amplitude
$Z_{c}$
is the maximum depth following the last stable wave amplitude
 $b$
and
$b$
and
 $r_{1}$
is the initial minimum cavity radius.
$r_{1}$
is the initial minimum cavity radius.
 $Z_{0}$
is the depth of the cavity when jetting starts and
$Z_{0}$
is the depth of the cavity when jetting starts and
 $r_{0}$
is the radius. Parameters
$r_{0}$
is the radius. Parameters
 $r_{m}$
and
$r_{m}$
and
 $Z$
represent the minimum radius and depth of the cavity at any instant of time
$Z$
represent the minimum radius and depth of the cavity at any instant of time
 $\unicode[STIX]{x1D70F}$
. The dashed lines correspond to
$\unicode[STIX]{x1D70F}$
. The dashed lines correspond to
 $z=0$
for pinch-off and non-pinching cases separately.
$z=0$
for pinch-off and non-pinching cases separately.

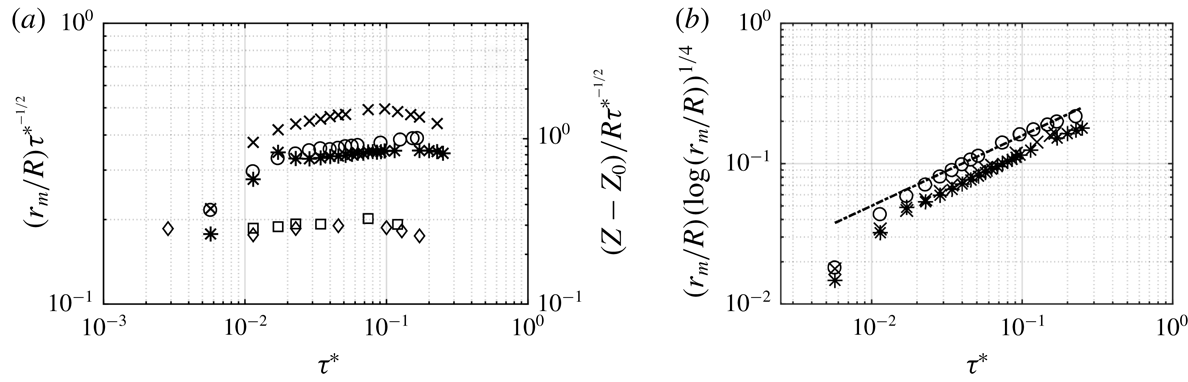
Figure 9. (a) Log–log plot of radial change of cavity, without pinch-off, as a function of time
 $\unicode[STIX]{x1D70F}^{\ast }=\unicode[STIX]{x1D70F}/\sqrt{(R/g)}$
for three different forcing amplitudes
$\unicode[STIX]{x1D70F}^{\ast }=\unicode[STIX]{x1D70F}/\sqrt{(R/g)}$
for three different forcing amplitudes
 $A/R$
in container
$A/R$
in container
 $2R=15~\text{cm}$
. At the beginning, radial cavity shrinkage follows
$2R=15~\text{cm}$
. At the beginning, radial cavity shrinkage follows
 $r_{m}/R\propto \unicode[STIX]{x1D70F}^{\ast \unicode[STIX]{x1D6FC}}$
with
$r_{m}/R\propto \unicode[STIX]{x1D70F}^{\ast \unicode[STIX]{x1D6FC}}$
with
 $\unicode[STIX]{x1D6FC}=0.5$
over a short time; then,
$\unicode[STIX]{x1D6FC}=0.5$
over a short time; then,
 $\unicode[STIX]{x1D6FC}$
is slightly larger,
$\unicode[STIX]{x1D6FC}$
is slightly larger,
 $\unicode[STIX]{x1D6FC}=0.53$
, with a viscous cut-off of
$\unicode[STIX]{x1D6FC}=0.53$
, with a viscous cut-off of
 $\unicode[STIX]{x1D6FC}\approx 1$
at small
$\unicode[STIX]{x1D6FC}\approx 1$
at small
 $\unicode[STIX]{x1D70F}^{\ast }$
. *,
$\unicode[STIX]{x1D70F}^{\ast }$
. *,
 $A/R=0.0223$
,
$A/R=0.0223$
,
 $U_{j}=45~\text{m}~\text{s}^{-1}$
; ○,
$U_{j}=45~\text{m}~\text{s}^{-1}$
; ○,
 $A/R=0.0273$
,
$A/R=0.0273$
,
 $U_{j}=36~\text{m}~\text{s}^{-1}$
;
$U_{j}=36~\text{m}~\text{s}^{-1}$
;
 $\times$
,
$\times$
,
 $A/R=0.0368$
,
$A/R=0.0368$
,
 $U_{j}=28~\text{m}~\text{s}^{-1}$
; ▫, axial change of cavity,
$U_{j}=28~\text{m}~\text{s}^{-1}$
; ▫, axial change of cavity,
 $(Z(t)-Z_{0}(t_{0}))$
, corresponding to
$(Z(t)-Z_{0}(t_{0}))$
, corresponding to
 $A/R=0.0223,U_{j}=45~\text{m}~\text{s}^{-1}$
with ‘a’–‘e’ corresponding to the cavity images in figure 4. (b) Radial change of cavity with pinch-off as a function of
$A/R=0.0223,U_{j}=45~\text{m}~\text{s}^{-1}$
with ‘a’–‘e’ corresponding to the cavity images in figure 4. (b) Radial change of cavity with pinch-off as a function of
 $\unicode[STIX]{x1D70F}^{\ast }$
for
$\unicode[STIX]{x1D70F}^{\ast }$
for
 $A/R=0.0224$
(see figure 5
b). As in (a),
$A/R=0.0224$
(see figure 5
b). As in (a),
 $\unicode[STIX]{x1D6FC}$
changes from 0.5 to
$\unicode[STIX]{x1D6FC}$
changes from 0.5 to
 $\unicode[STIX]{x1D6FC}\approx 1$
.
$\unicode[STIX]{x1D6FC}\approx 1$
.
Figure 9(a) shows the radial and axial shrinkage of the cavity as a function of dimensionless time
 $\unicode[STIX]{x1D70F}^{\ast }=\unicode[STIX]{x1D70F}/\sqrt{(R/g)}$
, where
$\unicode[STIX]{x1D70F}^{\ast }=\unicode[STIX]{x1D70F}/\sqrt{(R/g)}$
, where
 $\unicode[STIX]{x1D70F}=(t_{0}-t)$
, for three singular (
$\unicode[STIX]{x1D70F}=(t_{0}-t)$
, for three singular (
 $b$
close to singular wave amplitude
$b$
close to singular wave amplitude
 $b_{s}$
) non-pinch-off regimes, respectively for
$b_{s}$
) non-pinch-off regimes, respectively for
 $A/R=0.0223$
,
$A/R=0.0223$
,
 $A/R=0.0273$
and
$A/R=0.0273$
and
 $A/R=0.0368$
. Clearly, two exponents
$A/R=0.0368$
. Clearly, two exponents
 $\unicode[STIX]{x1D6FC}$
in
$\unicode[STIX]{x1D6FC}$
in
 $r_{m}/R\propto \unicode[STIX]{x1D70F}^{\ast \unicode[STIX]{x1D6FC}}$
exist. At larger times,
$r_{m}/R\propto \unicode[STIX]{x1D70F}^{\ast \unicode[STIX]{x1D6FC}}$
exist. At larger times,
 $\unicode[STIX]{x1D70F}>1~\text{ms}$
, the exponent is 0.5, for both radial and axial shrinkage. However, close to the singularity, when
$\unicode[STIX]{x1D70F}>1~\text{ms}$
, the exponent is 0.5, for both radial and axial shrinkage. However, close to the singularity, when
 $\unicode[STIX]{x1D70F}<1~\text{ms}$
, the time exponent of radial shrinkage is
$\unicode[STIX]{x1D70F}<1~\text{ms}$
, the time exponent of radial shrinkage is
 $\unicode[STIX]{x1D6FC}\approx 1$
which is characteristic of viscous effects. The radial shrinkage of the cavity with pinch-off is shown in figure 9(b), where the change in exponent from
$\unicode[STIX]{x1D6FC}\approx 1$
which is characteristic of viscous effects. The radial shrinkage of the cavity with pinch-off is shown in figure 9(b), where the change in exponent from
 $\unicode[STIX]{x1D6FC}\approx 0.5$
to 1 also occurs. The small deviation of
$\unicode[STIX]{x1D6FC}\approx 0.5$
to 1 also occurs. The small deviation of
 $\unicode[STIX]{x1D6FC}$
from
$\unicode[STIX]{x1D6FC}$
from
 $0.5$
is highlighted when the radial and axial changes are compensated by
$0.5$
is highlighted when the radial and axial changes are compensated by
 $\unicode[STIX]{x1D70F}^{-1/2}$
as shown in figure 10(a). Furthermore, with logarithmic correction
$\unicode[STIX]{x1D70F}^{-1/2}$
as shown in figure 10(a). Furthermore, with logarithmic correction
 $r_{m}/R(-\log (r_{m}/R))^{1/4}$
as proposed in bubble pinch-off (Gordillo et al.
Reference Gordillo, Sevilla, Rodríguez-Rodríguez and Martinez-Bazan2005; Bergmann et al.
Reference Bergmann, van der Meer, Stijnman, Sandtke, Prosperetti and Lohse2006) and axisymmetric bubble collapse (Eggers et al.
Reference Eggers, Fontelos, Leppinen and Snoeijer2007), the exponent is
$r_{m}/R(-\log (r_{m}/R))^{1/4}$
as proposed in bubble pinch-off (Gordillo et al.
Reference Gordillo, Sevilla, Rodríguez-Rodríguez and Martinez-Bazan2005; Bergmann et al.
Reference Bergmann, van der Meer, Stijnman, Sandtke, Prosperetti and Lohse2006) and axisymmetric bubble collapse (Eggers et al.
Reference Eggers, Fontelos, Leppinen and Snoeijer2007), the exponent is
 $\unicode[STIX]{x1D6FC}=0.5$
(figure 10
b). Since both radial and axial length scale follow the same power-law exponent (
$\unicode[STIX]{x1D6FC}=0.5$
(figure 10
b). Since both radial and axial length scale follow the same power-law exponent (
 $\unicode[STIX]{x1D6FC}\approx 1/2$
), the cavity collapse is self-similar. Figure 11(a) shows the surface profiles of the collapsing cavity at different instants of time. When the radial and axial changes are normalized by
$\unicode[STIX]{x1D6FC}\approx 1/2$
), the cavity collapse is self-similar. Figure 11(a) shows the surface profiles of the collapsing cavity at different instants of time. When the radial and axial changes are normalized by
 $\unicode[STIX]{x1D70F}^{-1/2}$
(figure 11
b) all the profiles collapse to one curve confirming the self-similar cavity collapse. The self-similarity is lost when crossover from
$\unicode[STIX]{x1D70F}^{-1/2}$
(figure 11
b) all the profiles collapse to one curve confirming the self-similar cavity collapse. The self-similarity is lost when crossover from
 $\unicode[STIX]{x1D6FC}=0.5$
to 1 is approached. This crossover is similar to the one observed by Burton & Taborek (Reference Burton and Taborek2007) for coalescence of liquid lenses where they observed viscous scaling of neck radius (
$\unicode[STIX]{x1D6FC}=0.5$
to 1 is approached. This crossover is similar to the one observed by Burton & Taborek (Reference Burton and Taborek2007) for coalescence of liquid lenses where they observed viscous scaling of neck radius (
 $\unicode[STIX]{x1D6FC}\approx 1$
) until 1 ms and thereafter inertial scaling (
$\unicode[STIX]{x1D6FC}\approx 1$
) until 1 ms and thereafter inertial scaling (
 $\unicode[STIX]{x1D6FC}\approx 0.5$
). In capillary-driven flow, onset of viscous effects is related to a critical value of Ohnesorge number
$\unicode[STIX]{x1D6FC}\approx 0.5$
). In capillary-driven flow, onset of viscous effects is related to a critical value of Ohnesorge number
 $Oh_{c}=\unicode[STIX]{x1D707}/\sqrt{\unicode[STIX]{x1D70C}R\unicode[STIX]{x1D70E}}\approx 0.03$
which is the inverse of a Reynolds number defined with the capillary velocity. In the present case, the transition is inertial–viscous, hence determined by a critical value of the inertial Reynolds number
$Oh_{c}=\unicode[STIX]{x1D707}/\sqrt{\unicode[STIX]{x1D70C}R\unicode[STIX]{x1D70E}}\approx 0.03$
which is the inverse of a Reynolds number defined with the capillary velocity. In the present case, the transition is inertial–viscous, hence determined by a critical value of the inertial Reynolds number
 $Re_{I}=(R^{3}g)^{1/2}/\unicode[STIX]{x1D708}$
. A time of 1 ms corresponds to
$Re_{I}=(R^{3}g)^{1/2}/\unicode[STIX]{x1D708}$
. A time of 1 ms corresponds to
 $Re_{I}\approx 500$
.
$Re_{I}\approx 500$
.
Zeff et al. (Reference Zeff, Kleber, Fineberg and Lathrop2000) in their experiments on wave-depression cavity collapse in a container of size similar (12.5 cm in diameter) to that used in the present experiments, assumed that the collapse is driven by surface tension which is related to a power law
 $(Z(t)-Z_{0}(t_{0}))\propto \unicode[STIX]{x1D70F}^{2/3}$
. The choice of surface tension and inertia as the competing forces, based on the analysis of Keller & Miksis (Reference Keller and Miksis1983) in breaking of liquid sheets, limits their analyses to an exponent
$(Z(t)-Z_{0}(t_{0}))\propto \unicode[STIX]{x1D70F}^{2/3}$
. The choice of surface tension and inertia as the competing forces, based on the analysis of Keller & Miksis (Reference Keller and Miksis1983) in breaking of liquid sheets, limits their analyses to an exponent
 $2/3$
. Clearly, as shown in figure 9(a), in the present experiments, cavity shrinkage
$2/3$
. Clearly, as shown in figure 9(a), in the present experiments, cavity shrinkage
 $(Z(t)-Z_{0}(t_{0}))$
scales as
$(Z(t)-Z_{0}(t_{0}))$
scales as
 $(Z(t)-Z_{0}(t_{0}))\propto (t_{0}-t)^{\unicode[STIX]{x1D6FC}}$
, with
$(Z(t)-Z_{0}(t_{0}))\propto (t_{0}-t)^{\unicode[STIX]{x1D6FC}}$
, with
 $\unicode[STIX]{x1D6FC}=0.527$
for container size
$\unicode[STIX]{x1D6FC}=0.527$
for container size
 $2R=15~\text{cm}$
with a similar value in the case of container size
$2R=15~\text{cm}$
with a similar value in the case of container size
 $2R=10~\text{cm}$
. The considerably more viscous liquid used by Zeff et al. (Reference Zeff, Kleber, Fineberg and Lathrop2000) limits the time range of existence of exponent 0.5 and hence might lead to a larger apparent value of the exponent.
$2R=10~\text{cm}$
. The considerably more viscous liquid used by Zeff et al. (Reference Zeff, Kleber, Fineberg and Lathrop2000) limits the time range of existence of exponent 0.5 and hence might lead to a larger apparent value of the exponent.
In the case of a large cavity generated by a moving circular disc (Bergmann et al.
Reference Bergmann, van der Meer, Stijnman, Sandtke, Prosperetti and Lohse2006), collapse always results in bubble pinch-off. In these experiments the time evolution of radial length scale follows a time exponent
 $\unicode[STIX]{x1D6FC}\approx 0.6$
. The cavity collapse with bubble pinch-off, as shown in figure 5(b), is similar. It occurs in the present experiments when the last stable wave amplitude
$\unicode[STIX]{x1D6FC}\approx 0.6$
. The cavity collapse with bubble pinch-off, as shown in figure 5(b), is similar. It occurs in the present experiments when the last stable wave amplitude
 $b$
exceeds the singular wave amplitude
$b$
exceeds the singular wave amplitude
 $b_{s}$
. As in the case of no pinch-off, the radial change of the collapsing cavity follows a power law
$b_{s}$
. As in the case of no pinch-off, the radial change of the collapsing cavity follows a power law
 $r_{m}/R\propto \unicode[STIX]{x1D70F}^{\ast \unicode[STIX]{x1D6FC}}$
up to certain time with a crossover from 0.5 to nearly
$r_{m}/R\propto \unicode[STIX]{x1D70F}^{\ast \unicode[STIX]{x1D6FC}}$
up to certain time with a crossover from 0.5 to nearly
 $\unicode[STIX]{x1D6FC}\approx 1$
at
$\unicode[STIX]{x1D6FC}\approx 1$
at
 $\unicode[STIX]{x1D70F}\approx 1~\text{ms}$
as is seen in figure 9(b). This differs from the results of Bergmann et al. (Reference Bergmann, van der Meer, Stijnman, Sandtke, Prosperetti and Lohse2006) where the exponent is closer to 0.6, tending towards 0.5 only at large Froude number, defined with the disc radius and speed. In the present experiments, a similar Froude number
$\unicode[STIX]{x1D70F}\approx 1~\text{ms}$
as is seen in figure 9(b). This differs from the results of Bergmann et al. (Reference Bergmann, van der Meer, Stijnman, Sandtke, Prosperetti and Lohse2006) where the exponent is closer to 0.6, tending towards 0.5 only at large Froude number, defined with the disc radius and speed. In the present experiments, a similar Froude number
 $Fr_{c}$
can be defined with cavity radius
$Fr_{c}$
can be defined with cavity radius
 $r_{1}$
and wave velocity
$r_{1}$
and wave velocity
 $V_{w}=b\unicode[STIX]{x1D714}$
in the form
$V_{w}=b\unicode[STIX]{x1D714}$
in the form
 $Fr_{c}=(b\unicode[STIX]{x1D714})^{2}/gr_{1}$
which has a value
$Fr_{c}=(b\unicode[STIX]{x1D714})^{2}/gr_{1}$
which has a value
 $Fr_{c}\approx 10$
. The difference in exponents for similar Froude numbers in the Bergmann et al. (Reference Bergmann, van der Meer, Stijnman, Sandtke, Prosperetti and Lohse2006) experiments is attributed to the initial shapes of the cavities. In the present experiments, the initial shape is already close to self-similar shape which is not the case in with the cavity created by a moving disc.
$Fr_{c}\approx 10$
. The difference in exponents for similar Froude numbers in the Bergmann et al. (Reference Bergmann, van der Meer, Stijnman, Sandtke, Prosperetti and Lohse2006) experiments is attributed to the initial shapes of the cavities. In the present experiments, the initial shape is already close to self-similar shape which is not the case in with the cavity created by a moving disc.

Figure 10. (a) Log–log plot of radial change of cavity compensated with
 $\unicode[STIX]{x1D70F}^{\ast -1/2}$
as a function of
$\unicode[STIX]{x1D70F}^{\ast -1/2}$
as a function of
 $\unicode[STIX]{x1D70F}^{\ast }$
. The left-hand axis shows the radial evolution of cavity and the right-hand axis (of different scale) shows the axial change of collapsing cavity. The symbols
$\unicode[STIX]{x1D70F}^{\ast }$
. The left-hand axis shows the radial evolution of cavity and the right-hand axis (of different scale) shows the axial change of collapsing cavity. The symbols
 $\ast$
,
$\ast$
,
 $A/R=0.0223$
,
$A/R=0.0223$
,
 $U_{j}=45~\text{m}~\text{s}^{-1}$
;
$U_{j}=45~\text{m}~\text{s}^{-1}$
;
 $\times$
,
$\times$
,
 $A/R=0.0273$
,
$A/R=0.0273$
,
 $U_{j}=36~\text{m}~\text{s}^{-1}$
; and
$U_{j}=36~\text{m}~\text{s}^{-1}$
; and
 $\circ$
,
$\circ$
,
 $A/R=0.0368$
,
$A/R=0.0368$
,
 $U_{j}=28~\text{m}~\text{s}^{-1}$
represent the radial changes similar to figure 9(a), and the symbols ▫ and ♢ show the axial change of cavity for
$U_{j}=28~\text{m}~\text{s}^{-1}$
represent the radial changes similar to figure 9(a), and the symbols ▫ and ♢ show the axial change of cavity for
 $2R=15~\text{cm}$
and
$2R=15~\text{cm}$
and
 $2R=10~\text{cm}$
, respectively. (b) Log–log plot of radial change of cavity with time with logarithmic correction
$2R=10~\text{cm}$
, respectively. (b) Log–log plot of radial change of cavity with time with logarithmic correction
 $(r_{m}/R)(-\text{log}(r_{m}/R))^{1/4}$
for the same conditions as in (a). The dashed line shows the 0.5 slope.
$(r_{m}/R)(-\text{log}(r_{m}/R))^{1/4}$
for the same conditions as in (a). The dashed line shows the 0.5 slope.

Figure 11. (a) Cavity shapes of the near singular collapse for
 $A/R=0.0223$
, at times 20, 18, 14, 10, 5, 2 and 1 ms before
$A/R=0.0223$
, at times 20, 18, 14, 10, 5, 2 and 1 ms before
 $t_{0}$
for container of
$t_{0}$
for container of
 $2R=15~\text{cm}$
. The radial and axial changes follow the power law
$2R=15~\text{cm}$
. The radial and axial changes follow the power law
 $\unicode[STIX]{x1D70F}^{1/2}$
. (b) Cavity shapes scaled with the power law
$\unicode[STIX]{x1D70F}^{1/2}$
. (b) Cavity shapes scaled with the power law
 $\unicode[STIX]{x1D70F}^{1/2}$
. The axes are non-dimensionalized with container radius and compensated with
$\unicode[STIX]{x1D70F}^{1/2}$
. The axes are non-dimensionalized with container radius and compensated with
 $\unicode[STIX]{x1D70F}^{-1/2}$
. The surface profiles at different times collapse well into one self-similar form.
$\unicode[STIX]{x1D70F}^{-1/2}$
. The surface profiles at different times collapse well into one self-similar form.
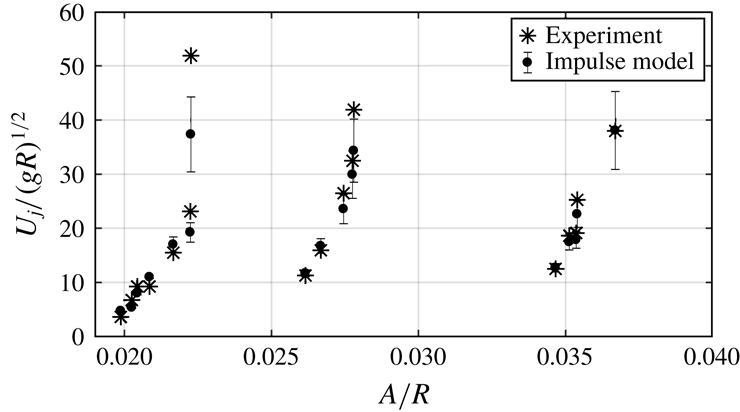
5 Jet velocity scaling
5.1 Forcing amplitude dependency
When the wave-depression cavity collapses, a jet is formed, a phenomenon observed by Longuet-Higgins (Reference Longuet-Higgins1983) and analysed in terms of finite-time singularity by Zeff et al. (Reference Zeff, Kleber, Fineberg and Lathrop2000). As discussed in § 4, in the present experiments the collapse is driven by gravity as is indicated by the time dependency of the cavity shrinkage. The cavity aspect ratio,
 $Z_{c}/r_{1}$
(see figure 8 for definition), plays an important role in generating high-velocity jets. A small diameter and deep cavity give rise to high jet velocity.
$Z_{c}/r_{1}$
(see figure 8 for definition), plays an important role in generating high-velocity jets. A small diameter and deep cavity give rise to high jet velocity.

Figure 12. (a) Jet velocities plotted against
 $A/R$
as indicated in figure 1, at
$A/R$
as indicated in figure 1, at
 $\unicode[STIX]{x1D714}/\unicode[STIX]{x1D714}_{0}=0.995$
for the container
$\unicode[STIX]{x1D714}/\unicode[STIX]{x1D714}_{0}=0.995$
for the container
 $2R=15~\text{cm}$
. The highest values correspond to near singular events. The non-pinching (*) is followed by pinching (○). For higher bands, pinching is followed by splash or incomplete cavity collapse (
$2R=15~\text{cm}$
. The highest values correspond to near singular events. The non-pinching (*) is followed by pinching (○). For higher bands, pinching is followed by splash or incomplete cavity collapse (
 $0.031<A/R<0.033$
) which is again followed by a non-pinch-off zone. The highest velocity obtained is
$0.031<A/R<0.033$
) which is again followed by a non-pinch-off zone. The highest velocity obtained is
 $45~\text{m}~\text{s}^{-1}$
. The dotted lines show the transition from non-pinch-off to pinch-off cavity collapse. (b) The dimensionless last stable wave amplitude
$45~\text{m}~\text{s}^{-1}$
. The dotted lines show the transition from non-pinch-off to pinch-off cavity collapse. (b) The dimensionless last stable wave amplitude
 $b/R$
as a function of forcing amplitude
$b/R$
as a function of forcing amplitude
 $A/R$
.
$A/R$
.
At a given frequency,
 $b/R$
depends (nonlinearly) on the forcing amplitude
$b/R$
depends (nonlinearly) on the forcing amplitude
 $A/R$
(figure 12
b) which suggests representing the jet velocity as a function of
$A/R$
(figure 12
b) which suggests representing the jet velocity as a function of
 $A/R$
. This is shown in figure 12(a) where the non-dimensional jet velocity is plotted as a function of
$A/R$
. This is shown in figure 12(a) where the non-dimensional jet velocity is plotted as a function of
 $A/R$
for a range of forcing amplitudes
$A/R$
for a range of forcing amplitudes
 $0.0198\leqslant A/R\leqslant 0.038$
and at constant frequency close to the natural frequency (
$0.0198\leqslant A/R\leqslant 0.038$
and at constant frequency close to the natural frequency (
 $\unicode[STIX]{x1D714}/\unicode[STIX]{x1D714}_{0}=0.995$
) to obtain a clear mode (0,1) wave. The results would be the same if the frequency were different as long as there is no contamination by other modes of the type indicated in figure 3. Jetting starts above a certain forcing amplitude and when it is increased further the jet velocity increases rapidly. The aspect ratio
$\unicode[STIX]{x1D714}/\unicode[STIX]{x1D714}_{0}=0.995$
) to obtain a clear mode (0,1) wave. The results would be the same if the frequency were different as long as there is no contamination by other modes of the type indicated in figure 3. Jetting starts above a certain forcing amplitude and when it is increased further the jet velocity increases rapidly. The aspect ratio
 $(Z_{c}/r_{1})$
of the fully grown cavity increases with forcing amplitude until pinch-off occurs when
$(Z_{c}/r_{1})$
of the fully grown cavity increases with forcing amplitude until pinch-off occurs when
 $b>b_{s}$
(
$b>b_{s}$
(
 $b_{s}$
is referred to as singular wave amplitude). Then, there is a range of
$b_{s}$
is referred to as singular wave amplitude). Then, there is a range of
 $A/R$
over which pinch-off persists and the wave amplitude decreases, until, at larger forcing amplitudes, the last stable wave amplitude starts to increase again. This pattern is repeated with the bands having varying width (figure 12
a). At higher
$A/R$
over which pinch-off persists and the wave amplitude decreases, until, at larger forcing amplitudes, the last stable wave amplitude starts to increase again. This pattern is repeated with the bands having varying width (figure 12
a). At higher
 $A/R$
, splashing with incomplete cavity collapse can occur. This incomplete cavity collapse is again followed by proper cavity collapse with no bubble pinch-off. As it is very difficult to continually operate the shaker with high precision, the bands cannot be determined with greater accuracy. Nevertheless, their existence is well established. From figure 12 it is clear that the transition from non-pinch-off to pinch-off is very sensitive to
$A/R$
, splashing with incomplete cavity collapse can occur. This incomplete cavity collapse is again followed by proper cavity collapse with no bubble pinch-off. As it is very difficult to continually operate the shaker with high precision, the bands cannot be determined with greater accuracy. Nevertheless, their existence is well established. From figure 12 it is clear that the transition from non-pinch-off to pinch-off is very sensitive to
 $A/R$
. Nearly perfect singularity (perfect collapse of cavity) needs a very fine adjustment of
$A/R$
. Nearly perfect singularity (perfect collapse of cavity) needs a very fine adjustment of
 $A/R$
. At large values of
$A/R$
. At large values of
 $A/R$
, the axisymmetric mode starts to coexist with the asymmetric mode (2,1) and the wave motion tends to become chaotic.
$A/R$
, the axisymmetric mode starts to coexist with the asymmetric mode (2,1) and the wave motion tends to become chaotic.
In figure 13 wave-amplitude growth rates are shown for different forcing amplitudes. It is seen that the last stable wave amplitude is reached in less than 10 wave periods and the growth rate increases with
 $A/R$
. Symbols
$A/R$
. Symbols
 $\times$
and
$\times$
and
 $\circ$
represent non-pinch-off cases at
$\circ$
represent non-pinch-off cases at
 $A/R=0.0216$
and
$A/R=0.0216$
and
 $A/R=0.027$
(see figure 12
a) with the same value of
$A/R=0.027$
(see figure 12
a) with the same value of
 $b/R$
, and hence result in a similar jet velocity. This also holds for the pinch-off cases. Since the growth rate increases with
$b/R$
, and hence result in a similar jet velocity. This also holds for the pinch-off cases. Since the growth rate increases with
 $A/R$
, the bands of non-pinching to pinching get narrower with forcing amplitude (figure 12
a).
$A/R$
, the bands of non-pinching to pinching get narrower with forcing amplitude (figure 12
a).

Figure 13. Wave-amplitude growth as a function of
 $t/T$
: ▫,
$t/T$
: ▫,
 $A/R=0.0198$
(no pinch-off), with very low jet velocity;
$A/R=0.0198$
(no pinch-off), with very low jet velocity;
 $\times$
,
$\times$
,
 $A/R=0.0216$
and ○,
$A/R=0.0216$
and ○,
 $A/R=0.027$
with same jet velocity,
$A/R=0.027$
with same jet velocity,
 $U_{j}\approx 13~\text{m}~\text{s}^{-1}$
;
$U_{j}\approx 13~\text{m}~\text{s}^{-1}$
;
 $+$
,
$+$
,
 $A/R=0.0224$
(pinch-off) and
$A/R=0.0224$
(pinch-off) and
 $\ast$
,
$\ast$
,
 $A/R=0.0281$
with similar jet velocity. In the two no-pinch-off and pinch-off cases the last stable wave amplitudes (
$A/R=0.0281$
with similar jet velocity. In the two no-pinch-off and pinch-off cases the last stable wave amplitudes (
 $b/R$
) are the same, but
$b/R$
) are the same, but
 $t/T$
is less when
$t/T$
is less when
 $A/R$
is larger. Dotted horizontal line indicates the same last stable wave amplitude for different bands.
$A/R$
is larger. Dotted horizontal line indicates the same last stable wave amplitude for different bands.
5.2 Power-law scaling
The jet velocity has been measured just above the free surface and each experimental run has been started with the fluid interface at rest. As demonstrated here, the jet velocity is also given by the final, near singular cavity collapse rate. The cavity starts to shrink rapidly in the radial and to a lesser extent in the vertical direction and after the cavity radius has decreased to
 $r_{0}$
and
$r_{0}$
and
 $Z_{0}$
there is vertical retraction at the jet speed.
$Z_{0}$
there is vertical retraction at the jet speed.
Experiments show that
 $Z_{c}(t)$
is proportional to the last stable wave amplitude and when there is no pinch-off
$Z_{c}(t)$
is proportional to the last stable wave amplitude and when there is no pinch-off
 $Z_{0}(t_{0})$
is proportional to
$Z_{0}(t_{0})$
is proportional to
 $Z_{c}(t)$
, thus
$Z_{c}(t)$
, thus
 $$\begin{eqnarray}Z_{0}(t_{0})/b=B_{1},\end{eqnarray}$$
where
 $B_{1}\approx 0.62$
(no pinch-off) is a constant.
$B_{1}\approx 0.62$
(no pinch-off) is a constant.
After the singular time
 $t_{0}$
, the cavity retracts vertically at a constant velocity so that the jet velocity is given by
$t_{0}$
, the cavity retracts vertically at a constant velocity so that the jet velocity is given by
 $$\begin{eqnarray}U_{j}=Z_{0}(t_{0})/t_{j}=B_{1}b/t_{j},\end{eqnarray}$$
where
 $t_{j}$
is the time from the start of vertical retraction (from
$t_{j}$
is the time from the start of vertical retraction (from
 $Z_{0}(t_{0})$
) to jet emergence at the free surface. A constant jet velocity inside the cavity implies that the impulse that initiates the jet happens over a distance
$Z_{0}(t_{0})$
) to jet emergence at the free surface. A constant jet velocity inside the cavity implies that the impulse that initiates the jet happens over a distance
 $\unicode[STIX]{x0394}z\ll Z_{0}$
. The dimensionless jet velocity is then given by
$\unicode[STIX]{x0394}z\ll Z_{0}$
. The dimensionless jet velocity is then given by
 $$\begin{eqnarray}\frac{U_{j}}{\sqrt{Rg}}=\frac{B_{1}}{t_{j}\sqrt{g/R}}\frac{b}{R}.\end{eqnarray}$$
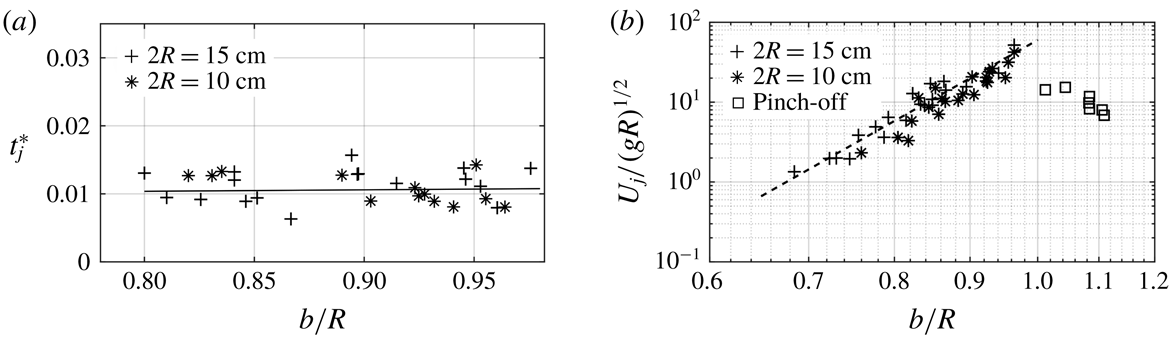
Experiments show that the dimensionless time
 $t_{j}\sqrt{g/R}$
decreases rapidly with
$t_{j}\sqrt{g/R}$
decreases rapidly with
 $b/R$
, i.e.
$b/R$
, i.e.
 $t_{j}/(\sqrt{R/g}\sim (b/R)^{-n})$
, and figure 11
a, in which is plotted
$t_{j}/(\sqrt{R/g}\sim (b/R)^{-n})$
, and figure 11
a, in which is plotted
 $t_{j}^{\ast }=t_{j}/(\sqrt{R/g}(b/R)^{-9})$
as a function of
$t_{j}^{\ast }=t_{j}/(\sqrt{R/g}(b/R)^{-9})$
as a function of
 $b/R$
, indicates that
$b/R$
, indicates that
 $n\approx 9$
and
$n\approx 9$
and
 $t_{j}^{\ast }\approx 0.0104$
. Substitution of these values in (5.2) gives
$t_{j}^{\ast }\approx 0.0104$
. Substitution of these values in (5.2) gives
 $$\begin{eqnarray}\frac{U_{j}}{\sqrt{Rg}}=\frac{0.62}{0.0104}\left(\frac{b}{R}\right)^{n+1}\approx 60\left(\frac{b}{R}\right)^{10}.\end{eqnarray}$$
In figure 14(b) the dimensionless jet velocity
 $U_{j}/\sqrt{Rg}$
is plotted as a function of
$U_{j}/\sqrt{Rg}$
is plotted as a function of
 $b/R$
in a doubly logarithmic plot. It is seen that the measured jet velocities are in good agreement with the power-law model. The square symbols in figure 14(b) represent jetting with bubble pinch-off.
$b/R$
in a doubly logarithmic plot. It is seen that the measured jet velocities are in good agreement with the power-law model. The square symbols in figure 14(b) represent jetting with bubble pinch-off.

Figure 14. (a), Dimensionless time
 $t_{j}^{\ast }=t_{j}/(\sqrt{R/g}(b/R)^{-9})$
as a function of
$t_{j}^{\ast }=t_{j}/(\sqrt{R/g}(b/R)^{-9})$
as a function of
 $b/R$
. The solid line shows the best least-squares fit of the data. (b) Log–log plot of dependency of jet velocity (
$b/R$
. The solid line shows the best least-squares fit of the data. (b) Log–log plot of dependency of jet velocity (
 $U_{j}/(gR)^{1/2}$
) on last stable wave amplitude (
$U_{j}/(gR)^{1/2}$
) on last stable wave amplitude (
 $b/R$
). The dashed line shows the power-law fit with an exponent 10 and prefactor 60 in (5.4). Symbol ▫ shows the pinch-off cavity collapse, where the jet velocities are reduced due to the loss of energy by the downward jet.
$b/R$
). The dashed line shows the power-law fit with an exponent 10 and prefactor 60 in (5.4). Symbol ▫ shows the pinch-off cavity collapse, where the jet velocities are reduced due to the loss of energy by the downward jet.
5.3 Finite-time singularity scaling
The behaviour shown in figure 12(a) suggests a finite-time singularity scaling. Zeff et al. (Reference Zeff, Kleber, Fineberg and Lathrop2000) proposed a constant Weber number behaviour,
 $We=\unicode[STIX]{x1D70C}U_{j}^{2}(b-b_{s})/\unicode[STIX]{x1D70E}$
, where
$We=\unicode[STIX]{x1D70C}U_{j}^{2}(b-b_{s})/\unicode[STIX]{x1D70E}$
, where
 $b_{s}$
is the singular wave amplitude beyond which pinch-off occurs and the jet velocity decreases rapidly as is seen in figure 12(a). This capillary scaling is of dimensionless form:
$b_{s}$
is the singular wave amplitude beyond which pinch-off occurs and the jet velocity decreases rapidly as is seen in figure 12(a). This capillary scaling is of dimensionless form:
 $$\begin{eqnarray}\frac{U_{j}}{\sqrt{\unicode[STIX]{x1D70E}/\unicode[STIX]{x1D70C}R}}=\left[We_{c}\frac{R}{|b-b_{s}|}\right]^{1/2},\end{eqnarray}$$
where
 $We_{c}$
is determined from the best fit of the data. As mentioned above, the diameter in their experiments is in the range of those of the present cylindrical containers used. The collapse should, therefore, be driven by inertia as indicated by the value of the exponent
$We_{c}$
is determined from the best fit of the data. As mentioned above, the diameter in their experiments is in the range of those of the present cylindrical containers used. The collapse should, therefore, be driven by inertia as indicated by the value of the exponent
 $\unicode[STIX]{x1D6FC}$
(see § 4.2). Furthermore, the ratio of static pressure
$\unicode[STIX]{x1D6FC}$
(see § 4.2). Furthermore, the ratio of static pressure
 $\unicode[STIX]{x1D70C}gZ_{c}$
to the surface tension force
$\unicode[STIX]{x1D70C}gZ_{c}$
to the surface tension force
 $\unicode[STIX]{x1D70E}/r_{1}$
gives a modified Bond number
$\unicode[STIX]{x1D70E}/r_{1}$
gives a modified Bond number
 $(\unicode[STIX]{x1D70C}gR^{2}/\unicode[STIX]{x1D70E})(r_{1}Z_{c})/R^{2}\approx 40$
indicating that inertial forces are dominant and suggesting a Froude number scaling.
$(\unicode[STIX]{x1D70C}gR^{2}/\unicode[STIX]{x1D70E})(r_{1}Z_{c})/R^{2}\approx 40$
indicating that inertial forces are dominant and suggesting a Froude number scaling.
In § 5.2 it is shown that
 $t_{j}$
, in (5.2), scales as
$t_{j}$
, in (5.2), scales as
 $\sqrt{R/g}$
, with a prefactor that depends strongly on
$\sqrt{R/g}$
, with a prefactor that depends strongly on
 $b$
. In finite-time singularity scaling, when the singularity is approached, i.e.
$b$
. In finite-time singularity scaling, when the singularity is approached, i.e.
 $b\rightarrow b_{s}$
, the time
$b\rightarrow b_{s}$
, the time
 $t_{j}\rightarrow 0$
. Thus, the expression of the time
$t_{j}\rightarrow 0$
. Thus, the expression of the time
 $t_{j}$
can be written as
$t_{j}$
can be written as
 $$\begin{eqnarray}t_{j}=B_{2}\left[\frac{|b-b_{s}|}{b}\right]^{1/2}\sqrt{R/g}.\end{eqnarray}$$
In figure 15(a), the dimensionless time
 $t_{j}/(\sqrt{(R/g)|b-b_{s}|/b})$
corresponding to
$t_{j}/(\sqrt{(R/g)|b-b_{s}|/b})$
corresponding to
 $B_{2}$
is plotted as a function of
$B_{2}$
is plotted as a function of
 $b/R$
. The solid line is the best fit and is
$b/R$
. The solid line is the best fit and is
 $B_{2}=0.252$
. Substituting the expression for
$B_{2}=0.252$
. Substituting the expression for
 $t_{j}$
, equation (5.6), in (5.2) gives for the dimensionless jet velocity
$t_{j}$
, equation (5.6), in (5.2) gives for the dimensionless jet velocity
 $$\begin{eqnarray}\frac{U_{j}}{\sqrt{Rg}}=\frac{B_{1}}{B_{2}}\left[\frac{b}{R}\right]^{3/2}\left[\frac{R}{|b-b_{s}|}\right]^{1/2},\end{eqnarray}$$
where
 $B_{1}/B_{2}\approx 2.5$
. In figure 15(b) the dimensionless jet velocity
$B_{1}/B_{2}\approx 2.5$
. In figure 15(b) the dimensionless jet velocity
 $U_{j}/\sqrt{Rg}$
is compared with the singular scaling (5.7). There is good agreement and the singular amplitude
$U_{j}/\sqrt{Rg}$
is compared with the singular scaling (5.7). There is good agreement and the singular amplitude
 $b_{s}$
at which the jet velocity could theoretically be infinite is well identified.
$b_{s}$
at which the jet velocity could theoretically be infinite is well identified.

Figure 15. (a) Dimensionless time
 $t_{j}/(\sqrt{(R/g)|b-b_{s}|/b})$
as a function of
$t_{j}/(\sqrt{(R/g)|b-b_{s}|/b})$
as a function of
 $b/R$
. The error bars show that the experimental error gets larger close to the singular cases when
$b/R$
. The error bars show that the experimental error gets larger close to the singular cases when
 $t_{j}$
gets close to the frame resolution. The constant line (——) corresponds to the best least-squares fit. (b) Singular scaling for the first band in
$t_{j}$
gets close to the frame resolution. The constant line (——) corresponds to the best least-squares fit. (b) Singular scaling for the first band in
 $A/R$
(
$A/R$
(
 $\unicode[STIX]{x1D714}/\unicode[STIX]{x1D714}_{0}=0.995$
) for two different container sizes
$\unicode[STIX]{x1D714}/\unicode[STIX]{x1D714}_{0}=0.995$
) for two different container sizes
 $2R=15~\text{cm}$
(
$2R=15~\text{cm}$
(
 $0.0198<A/R<0.0257$
, figure 12
a) and
$0.0198<A/R<0.0257$
, figure 12
a) and
 $2R=10~\text{cm}$
. Symbols
$2R=10~\text{cm}$
. Symbols
 $\times$
,
$\times$
,
 $\ast$
show the non-pinching cavities and ▫,
$\ast$
show the non-pinching cavities and ▫,
 $\circ$
show the pinch-off cavities for
$\circ$
show the pinch-off cavities for
 $2R=15~\text{cm}$
and
$2R=15~\text{cm}$
and
 $2R=10~\text{cm}$
, respectively. The dashed line shows the theoretical line plotted with
$2R=10~\text{cm}$
, respectively. The dashed line shows the theoretical line plotted with
 $B_{1}/B_{2}=2.5$
.
$B_{1}/B_{2}=2.5$
.
5.4 Impulse model
It is of interest to develop an impulse model in an attempt to clarify how the jet velocity is related to
 $U_{r}$
, the radial cavity shrinkage velocity, and to determine the vertical extent of the pressure impulse. As the cavity collapses, fluid particles move towards the centre of the cavity and then accelerate axially, resulting in a thin, high-velocity jet. In other words, strong radial momentum creates a high-pressure peak at the centre whereas pressure at the free surface is constant. This gives rise to strong acceleration of the fluid particle in the form of a jet as observed by Longuet-Higgins (Reference Longuet-Higgins2001). The pressure is localized (flip-through) in a way similar to wave impact in shallow water (Cooker & Peregrine Reference Cooker and Peregrine1995). The pressure builds up in a very short time, so that the momentum equation is dominated by the time-dependent pressure gradient. The viscous and surface tension terms are negligible (large Reynolds and Weber numbers) and the gravity term is of the order of the convective term or less (Froude number of order one or larger). The importance of the convective term with respect to the unsteady terms in the momentum equation is of order
$U_{r}$
, the radial cavity shrinkage velocity, and to determine the vertical extent of the pressure impulse. As the cavity collapses, fluid particles move towards the centre of the cavity and then accelerate axially, resulting in a thin, high-velocity jet. In other words, strong radial momentum creates a high-pressure peak at the centre whereas pressure at the free surface is constant. This gives rise to strong acceleration of the fluid particle in the form of a jet as observed by Longuet-Higgins (Reference Longuet-Higgins2001). The pressure is localized (flip-through) in a way similar to wave impact in shallow water (Cooker & Peregrine Reference Cooker and Peregrine1995). The pressure builds up in a very short time, so that the momentum equation is dominated by the time-dependent pressure gradient. The viscous and surface tension terms are negligible (large Reynolds and Weber numbers) and the gravity term is of the order of the convective term or less (Froude number of order one or larger). The importance of the convective term with respect to the unsteady terms in the momentum equation is of order
 $U\unicode[STIX]{x1D6FF}t/L$
and taking for
$U\unicode[STIX]{x1D6FF}t/L$
and taking for
 $U$
the jet velocity
$U$
the jet velocity
 $U_{j}$
, for
$U_{j}$
, for
 $\unicode[STIX]{x1D6FF}t$
the impulse time and for the spatial gradient scale
$\unicode[STIX]{x1D6FF}t$
the impulse time and for the spatial gradient scale
 $L=R$
, the ratio of convective term is of order
$L=R$
, the ratio of convective term is of order
 $U_{j}\unicode[STIX]{x1D6FF}t/R$
. It has been shown above that
$U_{j}\unicode[STIX]{x1D6FF}t/R$
. It has been shown above that
 $U_{j}t_{j}\leqslant 0.6R$
and, since the velocity inside the cavity is constant, it is necessary that
$U_{j}t_{j}\leqslant 0.6R$
and, since the velocity inside the cavity is constant, it is necessary that
 $\unicode[STIX]{x1D6FF}t\ll t_{j}$
so that
$\unicode[STIX]{x1D6FF}t\ll t_{j}$
so that
 $U_{j}\unicode[STIX]{x1D6FF}t/R\ll 1$
. This also applies in the radial direction where
$U_{j}\unicode[STIX]{x1D6FF}t/R\ll 1$
. This also applies in the radial direction where
 $L\sim r_{1}$
, but
$L\sim r_{1}$
, but
 $U$
is also less than
$U$
is also less than
 $U_{j}$
. Hence, the governing equation reduces to (Cooker & Peregrine Reference Cooker and Peregrine1991)
$U_{j}$
. Hence, the governing equation reduces to (Cooker & Peregrine Reference Cooker and Peregrine1991)
 $$\begin{eqnarray}\frac{\unicode[STIX]{x2202}u_{i}}{\unicode[STIX]{x2202}t}=-\frac{1}{\unicode[STIX]{x1D70C}}\frac{\unicode[STIX]{x2202}p(r,z,t)}{\unicode[STIX]{x2202}x_{i}},\end{eqnarray}$$
where
 $i=(r,z)$
and
$i=(r,z)$
and
 $z=0$
is at the free surface (see figure 8). Integrating (5.8) over the time interval
$z=0$
is at the free surface (see figure 8). Integrating (5.8) over the time interval
 $t_{a}$
to
$t_{a}$
to
 $t_{b}$
, we get
$t_{b}$
, we get
 $$\begin{eqnarray}u_{ib}-u_{ia}=-\frac{1}{\unicode[STIX]{x1D70C}}\frac{\unicode[STIX]{x2202}P}{\unicode[STIX]{x2202}x_{i}},\end{eqnarray}$$
where
 $P(x_{i})$
is the pressure impulse:
$P(x_{i})$
is the pressure impulse:
 $$\begin{eqnarray}P(r,z)=\int _{t_{a}}^{t_{b}}p(r,z,t)\,\text{d}t,\end{eqnarray}$$
where
 $(t_{b}-t_{a})$
is the pressure impulse time interval
$(t_{b}-t_{a})$
is the pressure impulse time interval
 $({\sim}1~\text{ms})$
, and
$({\sim}1~\text{ms})$
, and
 $r$
and
$r$
and
 $z$
are of range
$z$
are of range
 $r\approx r_{0}$
and
$r\approx r_{0}$
and
 $z\approx (Z_{0}+\unicode[STIX]{x1D6FF}z)$
. At the free surface, the pressure is constant and we take as reference
$z\approx (Z_{0}+\unicode[STIX]{x1D6FF}z)$
. At the free surface, the pressure is constant and we take as reference
 $P=0$
. In the radial direction, at time
$P=0$
. In the radial direction, at time
 $t_{b}$
the radial velocity
$t_{b}$
the radial velocity
 $u_{rb}=0$
and
$u_{rb}=0$
and
 $\unicode[STIX]{x2202}P/\unicode[STIX]{x2202}r=0$
. At time
$\unicode[STIX]{x2202}P/\unicode[STIX]{x2202}r=0$
. At time
 $t<t_{a}$
 $(r>r_{0})$
, the radial velocity
$(r>r_{0})$
, the radial velocity
 $u_{ra}$
scales with the cavity collapse velocity
$u_{ra}$
scales with the cavity collapse velocity
 $U_{r}=-C_{r}\sqrt{gR}$
. The coefficient
$U_{r}=-C_{r}\sqrt{gR}$
. The coefficient
 $C_{r}$
can be evaluated from figure 10(a), which shows that
$C_{r}$
can be evaluated from figure 10(a), which shows that
 $r_{m}/R\approx 0.4\unicode[STIX]{x1D70F}^{\ast 1/2}$
for
$r_{m}/R\approx 0.4\unicode[STIX]{x1D70F}^{\ast 1/2}$
for
 $\unicode[STIX]{x1D70F}^{\ast }>10^{-2}$
, recalling that
$\unicode[STIX]{x1D70F}^{\ast }>10^{-2}$
, recalling that
 $\unicode[STIX]{x1D70F}^{\ast }=\unicode[STIX]{x1D70F}/\sqrt{R/g}$
,
$\unicode[STIX]{x1D70F}^{\ast }=\unicode[STIX]{x1D70F}/\sqrt{R/g}$
,
 $\unicode[STIX]{x1D70F}=(t_{0}-t)$
and
$\unicode[STIX]{x1D70F}=(t_{0}-t)$
and
 $r_{m}$
is the minimum radius of cavity at any instant of time. The radial velocity is then
$r_{m}$
is the minimum radius of cavity at any instant of time. The radial velocity is then
 $$\begin{eqnarray}U_{r}=-\frac{\text{d}r_{m}}{\text{d}\unicode[STIX]{x1D70F}}\approx -\frac{0.2}{\unicode[STIX]{x1D70F}^{\ast 1/2}}\sqrt{Rg}\approx -0.08\frac{R}{r_{m}}\sqrt{Rg},\end{eqnarray}$$
giving
 $C_{r}=0.08(R/r_{m})$
. Equation
$C_{r}=0.08(R/r_{m})$
. Equation
 $(5.11)$
indicates that
$(5.11)$
indicates that
 $U_{r}$
increases with decreasing
$U_{r}$
increases with decreasing
 $r_{m}$
and is constant in the viscous regime when
$r_{m}$
and is constant in the viscous regime when
 $\unicode[STIX]{x1D70F}^{\ast }<10^{-2}$
(see figure 10
a).
$\unicode[STIX]{x1D70F}^{\ast }<10^{-2}$
(see figure 10
a).


The vertical velocity at
 $t_{a}$
is
$t_{a}$
is
 $u_{za}=0$
and at time
$u_{za}=0$
and at time
 $t_{b}$
 $$\begin{eqnarray}u_{zb}=U_{j}=-\frac{1}{\unicode[STIX]{x1D70C}}\frac{\unicode[STIX]{x2202}P}{\unicode[STIX]{x2202}z}.\end{eqnarray}$$
Equation (5.12) shows that the jet velocity is determined by the vertical gradient of the pressure impulse, which is of order
 $\unicode[STIX]{x1D6FF}P/\unicode[STIX]{x1D6FF}z$
. From (5.9) we get
$\unicode[STIX]{x1D6FF}P/\unicode[STIX]{x1D6FF}z$
. From (5.9) we get
 $\unicode[STIX]{x1D6FF}P\sim -\unicode[STIX]{x1D70C}U_{r}\unicode[STIX]{x1D6FF}r$
, hence
$\unicode[STIX]{x1D6FF}P\sim -\unicode[STIX]{x1D70C}U_{r}\unicode[STIX]{x1D6FF}r$
, hence
 $$\begin{eqnarray}U_{j}\sim U_{r}\frac{\unicode[STIX]{x1D6FF}r}{\unicode[STIX]{x1D6FF}z}\sim -0.08\frac{R}{r_{m}}\sqrt{Rg}\frac{\unicode[STIX]{x1D6FF}r}{\unicode[STIX]{x1D6FF}z}.\end{eqnarray}$$
Taking
 $\unicode[STIX]{x1D6FF}r\approx r_{m}$
and the axial impulse variation order
$\unicode[STIX]{x1D6FF}r\approx r_{m}$
and the axial impulse variation order
 $\unicode[STIX]{x1D6FF}z\sim r_{0}$
, and noting that
$\unicode[STIX]{x1D6FF}z\sim r_{0}$
, and noting that
 $z$
is downwards, we get
$z$
is downwards, we get
 $$\begin{eqnarray}\frac{U_{j}}{\sqrt{Rg}}\sim 0.08\frac{R}{r_{0}}.\end{eqnarray}$$
The experimentally obtained dimensionless jet velocities (non-pinch-off data in figure 12
a) are plotted as a function of
 $A/R$
and compared with impulse model in figure 16. The theoretical predictions of jet velocity (5.14) with a prefactor of
$A/R$
and compared with impulse model in figure 16. The theoretical predictions of jet velocity (5.14) with a prefactor of
 $5$
, i.e.
$5$
, i.e.
 $U_{j}/\sqrt{Rg}\approx 0.4(R/r_{0})$
, are in good agreement with experiments. At the largest jet velocity, agreement tends to be somewhat less good, which is attributed to measurement errors because, in this case, the singular cavity radius
$U_{j}/\sqrt{Rg}\approx 0.4(R/r_{0})$
, are in good agreement with experiments. At the largest jet velocity, agreement tends to be somewhat less good, which is attributed to measurement errors because, in this case, the singular cavity radius
 $r_{0}$
is very small. The singular radius is a function of the last stable wave amplitude
$r_{0}$
is very small. The singular radius is a function of the last stable wave amplitude
 $b$
, container radius
$b$
, container radius
 $R$
and viscosity. The dependency on
$R$
and viscosity. The dependency on
 $b$
and
$b$
and
 $R$
can be obtained from the singular scaling (5.7) which gives
$R$
can be obtained from the singular scaling (5.7) which gives
 $$\begin{eqnarray}\left[\frac{R}{r_{o}}\right]_{s}\approx \frac{b}{R}\left[\frac{b}{b-b_{s}}\right]^{1/2}.\end{eqnarray}$$
The ratio
 $(r_{0}/R)/(r_{0}/R)_{s}\approx 0.22$
. This gives a prefactor of
$(r_{0}/R)/(r_{0}/R)_{s}\approx 0.22$
. This gives a prefactor of
 $0.36$
in (5.14), which is close 0.4 used in figure 16.
$0.36$
in (5.14), which is close 0.4 used in figure 16.
The main interest of the impulse model is to demonstrate the parameters that determine the jet velocity. Further theoretical development of the model would be of interest but goes beyond the scope of the present work.
6 Conclusions and further discussions
It has been demonstrated that the collapse of the gravity wave-depression cavity in a circular cylindrical container of a size of the order of 10 cm or larger is an inertial process: the Bond number on the cavity scale
 $Bo_{c}=(\unicode[STIX]{x1D70C}gR^{2}/\unicode[STIX]{x1D70E})r_{1}/R$
is large,
$Bo_{c}=(\unicode[STIX]{x1D70C}gR^{2}/\unicode[STIX]{x1D70E})r_{1}/R$
is large,
 $Bo_{c}\sim 10^{2}$
, and the time variation of the cavity radius, in the form
$Bo_{c}\sim 10^{2}$
, and the time variation of the cavity radius, in the form
 $r_{m}/R\propto \unicode[STIX]{x1D70F}^{\unicode[STIX]{x1D6FC}}$
, where
$r_{m}/R\propto \unicode[STIX]{x1D70F}^{\unicode[STIX]{x1D6FC}}$
, where
 $r_{m}$
is the cavity radius,
$r_{m}$
is the cavity radius,
 $\unicode[STIX]{x1D70F}=(t-t_{0})$
with
$\unicode[STIX]{x1D70F}=(t-t_{0})$
with
 $t_{0}$
the instant of singular collapse, is shown to have an exponent
$t_{0}$
the instant of singular collapse, is shown to have an exponent
 $\unicode[STIX]{x1D6FC}\approx 0.5$
that is indicative of inertial collapse. With logarithmic correction, the exponent is
$\unicode[STIX]{x1D6FC}\approx 0.5$
that is indicative of inertial collapse. With logarithmic correction, the exponent is
 $\unicode[STIX]{x1D6FC}=0.5$
. At small times
$\unicode[STIX]{x1D6FC}=0.5$
. At small times
 $\unicode[STIX]{x1D70F}\leqslant 1~\text{ms}$
, there is a viscous transition to
$\unicode[STIX]{x1D70F}\leqslant 1~\text{ms}$
, there is a viscous transition to
 $\unicode[STIX]{x1D6FC}\simeq 1$
. This is the case for cavity collapse with and without bubble pinch-off at the cavity base. In the case of no pinch-off, the axial cavity shrinkage exhibits the same time dependency as the radial variation; hence, the no-pinch-off cavity shape is shown to be self-similar up to the viscous regime. In the pinch-off case the cavity has a well-defined vertex angle close to the potential flow theory value of
$\unicode[STIX]{x1D6FC}\simeq 1$
. This is the case for cavity collapse with and without bubble pinch-off at the cavity base. In the case of no pinch-off, the axial cavity shrinkage exhibits the same time dependency as the radial variation; hence, the no-pinch-off cavity shape is shown to be self-similar up to the viscous regime. In the pinch-off case the cavity has a well-defined vertex angle close to the potential flow theory value of
 $109.5^{\circ }$
.
$109.5^{\circ }$
.
Collapse of a cavity of similar size, but created by a moving disc (Bergmann et al.
Reference Bergmann, van der Meer, Stijnman, Sandtke, Prosperetti and Lohse2006), exhibits an exponent
 $\unicode[STIX]{x1D6FC}$
closer to 0.6, tending towards 0.5 at large Froude number defined with the disc radius and disc speed. In the present experiments, a similar Froude number, defined with the cavity radius and the wave velocity, is about 10. The difference in exponents, at similar Froude numbers, is attributed to the initial shapes of the cavities that are closer to the self-similar shape in the case of the wave-depression cavity.
$\unicode[STIX]{x1D6FC}$
closer to 0.6, tending towards 0.5 at large Froude number defined with the disc radius and disc speed. In the present experiments, a similar Froude number, defined with the cavity radius and the wave velocity, is about 10. The difference in exponents, at similar Froude numbers, is attributed to the initial shapes of the cavities that are closer to the self-similar shape in the case of the wave-depression cavity.
A novel result is the demonstration that jetting, for a given forcing frequency, occurs in bands of forcing amplitudes. Above the wave-breaking threshold, the wave amplitude grows in time until the wave-depression cavity implodes. The rate of amplification depends on the forcing amplitude and in each band the amplification rate increases with forcing amplitude and leads to bubble pinch-off when
 $b>b_{s}$
, the singular wave amplitude, which is nearly equal to the container radius. This scenario is repeated at larger forcing amplitudes, although wave amplification rates are higher. Bands with irregular cavity collapse and splashing can exist.
$b>b_{s}$
, the singular wave amplitude, which is nearly equal to the container radius. This scenario is repeated at larger forcing amplitudes, although wave amplification rates are higher. Bands with irregular cavity collapse and splashing can exist.
The cavity depth (more precisely the cavity aspect ratio), proportional to the last stable wave amplitude, determines the jet velocity
 $U_{j}$
emerging at the water surface. When scaled with the gravitational velocity
$U_{j}$
emerging at the water surface. When scaled with the gravitational velocity
 $U_{g}=\sqrt{Rg}$
it can be expressed in terms of a power law. The large value of the exponent indicates the strong dependency of jet velocity on the cavity depth proportional to the last stable wave amplitude. When
$U_{g}=\sqrt{Rg}$
it can be expressed in terms of a power law. The large value of the exponent indicates the strong dependency of jet velocity on the cavity depth proportional to the last stable wave amplitude. When
 $b/R$
is close to 1 and above, bubble pinch-off at the base of the cavity occurs and the jet velocity drops off rapidly. This transition from non-pinching to pinch-off occurs at a singular wave amplitude
$b/R$
is close to 1 and above, bubble pinch-off at the base of the cavity occurs and the jet velocity drops off rapidly. This transition from non-pinching to pinch-off occurs at a singular wave amplitude
 $b_{s}$
at which the jet velocity can, theoretically, be infinite but of negligible mass. However, in viscous fluids there is a viscous cut-off, limiting the jet velocity to finite values in accordance with the power-law scaling. An expression for
$b_{s}$
at which the jet velocity can, theoretically, be infinite but of negligible mass. However, in viscous fluids there is a viscous cut-off, limiting the jet velocity to finite values in accordance with the power-law scaling. An expression for
 $U_{j}/\sqrt{Rg}$
in terms of
$U_{j}/\sqrt{Rg}$
in terms of
 $|b-b_{s}|$
and
$|b-b_{s}|$
and
 $b/R$
is given. This finite-time singularity scaling is also in good agreement with experiments. The power-law scaling is more practical because it does not rely on an implicit variable, here the singular wave amplitude.
$b/R$
is given. This finite-time singularity scaling is also in good agreement with experiments. The power-law scaling is more practical because it does not rely on an implicit variable, here the singular wave amplitude.
An expression of the jet velocity in terms of the cavity dimensions is derived via the impulse model. This model is of interest because it gives some physical insight about the cavity implosion and the radial and axial gradients of the impulse.
Up-scaling of the results to container sizes of the order of 1 m may not be straightforward. Perturbations on the wave crest and cavity will be larger as viscous and surface tension effects will be less active in preventing perturbations. This behaviour is similar to that of smaller scale cavity collapse in very low-viscosity and low-surface-tension liquids as for instance FC-72 used by Das & Hopfinger (Reference Das and Hopfinger2008). In a larger container there is, in addition, the possibility of Rayleigh–Taylor instability of the wave crest because its downward acceleration can exceed gravity and the unstable wavelength can be less than the diameter of the wave near its crest. However, the time during which the downward acceleration exceeds gravity is only a fraction of the wave period so that the instability may not grow sufficiently to cause notable perturbation or even splitting of the wave crest.
Acknowledgements
The authors thank Professor S. F. Ali, Department of Applied Mechanics and Professor S. Sarkar, Department of Metallurgical and Materials Engineering, Indian Institute of Technology Madras for allowing them to use the laboratory facilities and equipment to conduct the experiments. E.J.H. acknowledges some support during his stay at IITM.