


Introduction
Growing up in an impoverished socio-economic environment is associated with environmental, health and developmental disparities in children that persist well into adulthood. Although genetic factors clearly affect brain development, there is also substantial evidence for early sociocultural influences on the risk of developing both schizophrenia (van Os et al. 2010) and relatively lower cognitive functioning (Nisbett et al. Reference Nisbett, Aronson, Blair, Dickens, Flynn, Halpern and Turkheimer2012). Socio-economic status (SES), in particular, has been examined frequently for its impact on cognitive skills (Hanscombe et al. Reference Hanscombe, Trzaskowski, Haworth, Davis, Dale and Plomin2012). The effects of low SES are probably greater in some cognitive domains than others. Executive or ‘frontal lobe’ skills may be especially affected (Hackman et al. Reference Hackman, Farah and Meaney2010). The neurological substrate for these skills includes diverse prefrontal regions that frequently show morphological abnormalities in schizophrenia (Eisenberg & Berman, Reference Eisenberg and Berman2010). The adverse effects of low SES may also be greater for some individuals than others, including individuals vulnerable to schizophrenia. We have suggested that a cardinal feature of schizophrenia is reduced canalization, or difficulty in getting development back on a normal trajectory following significant perturbations (Yeo et al. Reference Yeo, Gangestad, Edgar and Thoma1999, Reference Yeo, Gangestad and Thoma2007). Consistent with this perspective, individuals at risk for schizophrenia have been found to be more influenced by such environmental issues as obstetric complications (McNeil et al. Reference McNeil, Cantor-Graae and Weinberger2000) and marijuana (Habets et al. Reference Habets, Marcelis, Gronenschild, Drukker and van Os2011) and alcohol use (Welch et al. Reference Welch, McIntosh, Job, Whalley, Moorhead, Hall, Owens, Lawrie and Johnstone2011). The current study thus sought to test the hypothesis that low parental SES (pSES) has a greater adverse impact on executive skills and cortical morphology in individuals with schizophrenia than in healthy controls.
Impaired executive functioning is one of the most commonly noted deficits associated with schizophrenia (Eisenberg & Berman, Reference Eisenberg and Berman2010). Several different types of correlated skills are typically subsumed under ‘executive’ or ‘frontal lobe’ skills, including planning, monitoring, working memory, fluency, cognitive control and self-regulation/impulse control. Of course, other cognitive deficits are common in schizophrenia and recent large-scale factor analytic studies demonstrate the existence of a generalized cognitive deficit, in addition to deficits in secondary factors (Dickinson et al. Reference Dickinson, Goldberg, Gold, Elvevag and Weinberger2011). Executive deficits may also be central to the endophenotype of schizophrenia (Gottesman & Gould, Reference Gottesman and Gould2003) for several reasons. Executive ability is heritable (Friedman et al. Reference Friedman, Miyake, Young, Defries, Corley and Hewitt2008) and non-schizophrenic relatives of individuals with schizophrenia have relatively impaired executive performance (Snitz et al. Reference Snitz, MacDonald and Carter2006) and reduced prefrontal gray matter (GM) volumes (Goghari et al. Reference Goghari, Sponheim and MacDonald2010). Moreover, a study with first-episode patients showed that severe impairment of executive functioning was present at the beginning of the disease (Hutton et al. Reference Hutton, Puri, Duncan, Robbins, Barnes and Joyce1998). It is also important to note that executive deficits have important real-world consequences for individuals with schizophrenia. Lower executive skills predict reduced insight (Chan et al. Reference Chan, Chan, Lam, Chiu, Hui, Wong, Chang and Chen2012), reduced daily living skills (Puig et al. Reference Puig, Penades, Baeza, Sanchez-Gistau, De La Serna, Fonrodona, Andres-Perpina, Bernardo and Castro-Fornieles2012) and reduced levels of remission (Hofer et al. Reference Hofer, Bodner, Kaufmann, Kemmler, Mattarei, Pfaffenberger, Rettenbacher, Trebo, Yalcin and Fleischhacker2011). Despite these prominent correlates, caution must be exercised in asserting the primary cognitive importance of executive deficits, as general intellectual ability (‘g’) correlates substantially with most measures of executive skill.
The manner in which low pSES might impact executive skill and its anatomical substrates is poorly understood. A meta-analysis of functional neuroimaging studies concluded that similar brain networks were activated in both individuals with schizophrenia and controls during performance of executive tasks, for example dorsolateral, ventrolateral and midline prefrontal regions, in addition to the anterior cingulate gyrus (Minzenberg et al. Reference Minzenberg, Laird, Thelen, Carter and Glahn2009). We are not aware of any studies that have specifically examined the impact of pSES on these brain structures, although studies of related social factors have started to emerge. Healthy children of healthy parents with low income were found to have reduced hippocampal volume in a recent voxel-based morphometry (VBM) study (Hanson et al. Reference Hanson, Chandra, Wolfe and Pollak2011), but prefrontal regions were not examined. Another study focusing on adverse childhood experiences found that healthy adults with substantial early life stress had reduced anterior cingulate and caudate volumes (Cohen et al. Reference Cohen, Grieve, Hoth, Paul, Sweet, Tate, Gunstad, Stroud, McCaffery, Hitsman, Niaura, Clark, MacFarlane, Bryant, Gordon and Williams2006), and a related study noted that childhood emotional maltreatment was associated with reduced medial prefrontal cortex volumes (van Harmelen et al. Reference van Harmelen, van Tol, van der Wee, Veltman, Aleman, Spinhoven, van Buchem, Zitman, Penninx and Elzinga2010). An important question is whether the regions identified in these studies are affected by low pSES in individuals with schizophrenia.
The first aim of the current study was to investigate the association of pSES with executive function in both healthy controls and patients with schizophrenia. The results indicated a greater impact of pSES in patients than controls. To follow up this finding, the second major aim of the current study was to evaluate the impact of pSES on cortical GM in both groups using VBM.
Method
Participants
Data were collected from four different sites: the Mind Research Network/University of New Mexico in Albuquerque, New Mexico, the University of Minnesota, Massachusetts General Hospital, and the University of Iowa. Patients were recruited from hospitals and out-patient clinics associated with the sites. Patients with a history of neurologic or psychiatric diseases other than schizophrenia were excluded. Additionally, patients who experienced head injuries, a history of substance dependence or abuse, or an IQ ⩽70 were excluded. All study participants underwent an extensive clinical diagnostic assessment that included either the SCID-I/P or the SCID-NP (First et al. Reference First, Spitzer, Gibbon and Williams2002) or the Comprehensive Assessment of Symptoms and History (CASH; Andreasen et al. Reference Andreasen, Flaum and Arndt1992). Control participants were recruited using flyers, newspaper advertisements and by word-of-mouth. For statistical purposes, ethnicity was quantified as ‘minority’ (African American, Asian, Native American, Hispanic/Latino, or mixed) or ‘non-minority’. Patient and control groups did not differ in terms of age, handedness or pSES. As expected, however, controls had significantly more education than patients, better self-SES (sSES), and were more likely to be male and minority group members. Participants included 102 schizophrenia patients (76 male, 26 female) and 125 healthy controls (76 male, 49 female). Demographic information, including age, ethnicity, pSES and sSES, is shown in Table 1.
Table 1. Demographic information

SES, Socio-economic status; M, male; F, female; s.d., standard deviation; n.s., not significant.
Significance levels determined by an independent-samples t test or χ 2 analysis. Ethnicity was coded as ‘minority’ and ‘not-minority’.
Measures
Cognitive tests
Participants completed several tests of diverse cognitive skills (Sponheim et al. Reference Sponheim, Jung, Seidman, Mesholam-Gately, Manoach, O'Leary, Ho, Andreasen, Lauriello and Schulz2010). However, only measures of intelligence and executive functioning are discussed in the current report, as these skills have been most frequently studied with respect to SES. For additional information on the neuropsychological assessments used in the current study, see Lezak et al. (Reference Lezak, Howieson, Bigler and Tranel2012). Intelligence was assessed with selected subtests of the Wechsler Adult Intelligence Scale III (WAIS-III; Wechsler, Reference Wechsler1997): Block Design, Letter Number, Vocabulary, and Similarities. An estimate of intelligence was calculated from the average of these age-corrected subtest scaled scores. Executive skills were assessed with a battery of six tests, yielding a total of 10 variables. Verbal fluency was assessed with the letter fluency (letters F, A and S) and category fluency tests (animals, fruits) from the Delis–Kaplan Executive Functional System (Delis et al. Reference Delis, Kaplan and Kramer2001). Both total time and number of errors on the Trail Making Test B, a measure of processing speed, working memory and sequencing, were also assessed. A computerized version of the Tower of London test (Shallice, Reference Shallice1982) was administered to assess planning and problem solving. Three variables from this test were used: excess moves on the three-, four- and five-ring problems. The California Computerized Assessment Package (CalCap) taps processing speed, attention and executive skills (LaPointe et al. Reference LaPointe, Heald, Stierwalt, Kemker and Maurice2007). We included false positive errors from the Serial Pattern Matching 1 and 2 (Sequential Reaction Time SEQ1 and SEQ2) subtests, as false positive errors in part reflect impulsive responding, a core component of executive skill. A measure of general intellectual functioning was obtained by averaging scaled scores from the four subtests of the WAIS-III.
SES
SES is generally viewed in terms of capital, including material resources (financial capital), non-material resources such as education (human capital), and resources obtained through social connection (social capital) (Bradley & Corwyn, Reference Bradley and Corwyn2002). For the purposes of this study, pSES was calculated using the modified Hollingshead–Redlich scale (Hollingshead & Redlich, Reference Hollingshead and Redlich1958). This scale established a ‘global’ rating of the highest SES level sustained for a significant period of time; it is based on occupation and educational level of both parents and comprises a five-point scale (1 = highest, 5 = lowest). Occasionally, classification involved some clinical judgment.
Symptom scales
The global ratings for delusions and hallucinations on the Scale for the Assessment of Positive Symptoms (SAPS; Andreasen, Reference Andreasen1983) provided a measure of positive symptoms. Negative symptoms were represented by the sum of global ratings for alogia, affective flattening, anhedonia and avolition on the Scale for the Assessment of Negative Symptoms (SANS; Andreasen et al. Reference Andreasen, Flaum and Arndt1992). Disorganized symptoms were assessed through the global rating of formal thought disorder, bizarre behaviors and inappropriate affect on the SAPS.
VBM
Analyses were conducted to assess the potential impact and importance of pSES on regional GM volumes. VBM was used to assess GM of the entire cortex, as opposed to a region of interest (ROI) analysis, which requires a priori selection of a few regions. VBM is a computerized structural magnetic resonance imaging (MRI) analysis technique that enables an unbiased voxel-by-voxel comparison of cortical volumes (Whitwell, Reference Whitwell2009).
MRI acquisition
Pulse sequences and field strengths (three sites at 1.5 T and one site at 3.0 T) implemented according to the scanner manufacturers (General Electric and Siemens) differed across the four sites. For a more details on the MRI parameters and differences across sites, see Segall et al. (Reference Segall, Turner, van Erp, White, Bockholt, Gollub, Ho, Magnotta, Jung, McCarley, Schulz, Lauriello, Clark, Voyvodic, Diaz and Calhoun2009).
VBM analyses
All VBM procedures were conducted using Statistical Parametric Mapping (SPM, www.fil.ion.ucl.ac.uk/spm; Wellcome Department of Cognitive Neurology, UK), a program running through Mathworks (Matlab 7.2, MathWorks, USA). Each T1 image was segmented into GM, white matter and cerebrospinal fluid images using unified segmentation parameters (Ashburner & Friston, Reference Ashburner and Friston2005). Total cortical GM volume measures were obtained as a result of this analysis. Unmodulated normalized GM images were smoothed using a 10-mm Gaussian kernel. (For a more comprehensive description of VBM preprocessing procedures used on this dataset, see Segall et al. Reference Segall, Turner, van Erp, White, Bockholt, Gollub, Ho, Magnotta, Jung, McCarley, Schulz, Lauriello, Clark, Voyvodic, Diaz and Calhoun2009.) Multiple regressions were conducted to assess the effect of pSES on GM concentration within the schizophrenia group and the healthy control group. In each analysis, age, sex, ethnicity and image acquisition site (dummy coded) were entered as covariates. A false discovery rate (FDR) correction for multiple comparisons (p = 0.05) and a cluster size threshold of 10 voxels (K = 10) were used for all analyses. Regions significantly associated with pSES were examined next to determine whether GM variation in these regions was related to the executive function measures.
Statistical analysis
All statistical analyses were conducted in SPSS version 17.0 (SPSS Inc., USA). A principal components analysis (PCA) with oblimin rotation (which allows for the emergence of correlated factors) was performed on the 10 executive function variables, from participants of both groups, to determine a smaller number of latent factors. Subsequently, multiple regression procedures were used to evaluate the relationship between pSES and cognitive skills, controlling for various extraneous factors (e.g. sex, age and ethnicity). We also report a secondary analysis with additional covariates (general intellectual ability, education level and sSES). As each of these additional covariates is related to the diagnosis of schizophrenia, we have substantially less power to detect group effects in this analysis. Thus, our initial analysis provides the most accurate estimate of effect sizes whereas the secondary analysis potentially provides insight into the robustness of any possible pSES effects.
Results
Demographic characteristics of both groups are provided in Table 1. The patient group had significantly less education and lower sSES. It was also composed of relatively more males and more members of minority groups. Age and pSES did not differ across groups. The largest percentage of our sample (47.6%) was at level-3 pSES. sSES and pSES were correlated at r = 0.47 (p < 0.001) in controls and r = 0.44 (p < 0.001) in patients. Specific diagnoses of individuals within the patient group were: paranoid (n = 65; 64%), undifferentiated (n = 25; 24%), disorganized (n = 6; 5%), schizophreniform (n = 4; 4%), residual (n = 2; 2%) and schizo-affective (n = 1; 1%). For descriptive purposes, the patient group obtained these mean scores on schizophrenia symptom scales: positive symptoms = 4.97 (s.d. = 2.78); negative symptoms = 7.91 (s.d. = 3.92), and disorganized symptoms = 1.93 (s.d. = 2.00). Test data for the executive ability variables (raw scores), the intellectual ability variable (average of scaled scores) and executive components are provided in Table 2.
Table 2. Test performance of controls and patients with significance testing

CalCap, California Computerized Assessment Package; s.d., standard deviation.
Significance levels determined by independent-samples t tests. See Method section for test details.
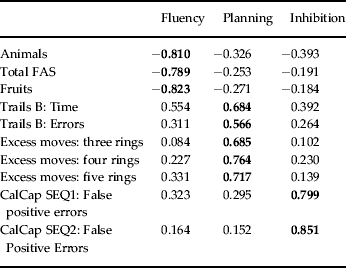
A PCA of the 10 executive function measures revealed three components with an eigenvalue > 1. These were retained as measures of executive function and the loadings of individual tests on these components are shown in Table 3. Component 1 (35.14% of total variance accounted for), labeled ‘Fluency’, had the highest loadings from the animals, total FAS and fruits fluency tasks. Component 2 (13.06%), labeled ‘Planning’, included Trails B: time, Trails B: errors, and excess moves on the three-, four- and five-ring versions of the Tower of London test. Component 3 (11.16% variance) was termed ‘Inhibition’ and had strong loadings from the CalCap SEQ1: False Positive and CalCap SEQ2: False Positive variables. Table 4 shows correlations among the three executive function components and correlations of each with intelligence.
Table 3. Structure matrix for test loadings on executive function components
CalCap, California Computerized Assessment Package.
Bold values indicate strongest test loadings.
Table 4. Correlations between major cognitive measures, by group (patients/controls)

*p < 0.05, ** p < 0.01, *** p < 0.001.
A general linear model multivariate analysis was conducted with the three components. Dependent variables included the three executive functions; fixed factors included group, ethnicity, pSES and sex; age was entered as a covariate. The model also included an interaction of group and pSES. The overall model was significant, and there was a significant effect of group, as the patient group performed worse than the control group on each component. A main effect was noted for pSES across the three executive functioning components (F 12,212 = 3.79, p < 0.001).
The main effect of pSES was significant for all three executive functioning components individually (Fluency: F 4,214 = 2.47, p < 0.05; Planning: F 4,214 = 2.95, p < 0.05; Inhibition: F 4,214 = 7.95, p < 0.001). However, the interaction of group and pSES was also significant overall (F 12,212 = 3.02, p < 0.001). The interaction of group and pSES was significant individually for Planning (F 4,214 = 4.60, p < 0.001) and Inhibition (F 4,214 = 4.63, p < 0.001). Within-group follow-up analyses of the interaction revealed a significant adverse effect for pSES among individuals with schizophrenia, but not controls, on these two executive components.
An additional, supplementary general linear model multivariate analysis was performed adding three more covariates (WAIS-III mean scaled score, sSES and education level). Despite reduced power to detect main effects and interactions with the group variable due to the additional covariates, significant multivariate main effects were noted for group (F 3,204 = 3.54, p = 0.016) and pSES (F 12,204 = 3.21, p < 0.001), and also for their interaction (F 12,204 = 2.11, p = 0.015). Looking more closely at effects for each executive function variable, the main effect of pSES was significant for Planning (F 4,206 = 3.74, p = 0.006) and Inhibition (F 4,206 = 5.85, p < 0.01), whereas the interaction of pSES with group was significant only for the Inhibition variable (F 4,206 = 4.03 p = 0.004). These results indicate the robust nature of the pSES by group interaction, as it remains a significant predictor of overall executive function, even when central features of the extended phenotype of schizophrenia are covaried.
Imaging results
Given the interactions described above, VBM analyses and correlations with overall GM volume were conducted independently in each group. pSES was negatively correlated with total cortical GM in the patient group after partialling age, sex and ethnicity, such that lower pSES categories were associated with reduced GM (r = −0.25, p = 0.01); among controls, no relationship was observed (r = −0.04, n.s.). Partial correlations also revealed that total cortical GM volume was significantly correlated with Planning (r = 0.30, p = 0.002) and Inhibition (r = 0.26, p = 0.01) in the patient group; no significant relationships were observed in controls.
In VBM, regional analyses were localized using WFU-PickAtlas (Maldjian et al. Reference Maldjian, Laurienti, Kraft and Burdette2003), a toolbox running in SPM5. In the patient group, smaller GM volumes were observed bilaterally in the frontal cortex and limbic lobe, and in select regions of the left temporal, occipital and parietal cortices. More specifically, smaller volumes in the right frontal cortex were observed in the medial frontal gyrus (t = 4.86), inferior frontal gyrus (t = 3.91, t = 3.66) and superior frontal gyrus (t = 3.82, t = 3.71). Smaller volumes in the left frontal cortex were observed in the middle frontal gyrus (t = 4.53, t = 4.42), inferior frontal gyrus (t = 4.45), precentral gyrus (t = 4.01, t = 3.68) and paracentral lobule (t = 3.49). Smaller volumes were observed in the right cingulate gyrus (t = 3.77, t = 3.74) and left cingulate gyrus (t = 3.71). Additionally, smaller volumes were observed in the left inferior occipital gyrus (t = 4.12), left middle temporal gyrus (t = 3.81) and left precuneus (t = 3.68). pSES was not positively correlated with any GM volumes in this sample. Table 5 shows the corresponding Montreal Neurological Institute (MNI) coordinates, t values, cluster size and localizations of each cluster. Figure 1 shows these results displayed on axial slices.

Fig. 1. Voxel-based morphometry (VBM) analysis of the effects of parental SES (pSES) on gray matter (GM) volume in the patient group, controlling for age, sex and site. (a) Coronal view; (b) sagittal view of the left hemisphere; (c) axial view. All regions indicated were significant at false discovery rate (FDR) p < 0.05.
Table 5. Voxel-based morphometry (VBM) analysis of the effects of parental SES (pSES) on gray matter (GM) volume in the patient group, controlling for age, sex and site. All regions indicated were significant at false discovery rate (FDR) p < 0.05. K indicates cluster size and x, y and z indicate the location of the peak significance for each cluster. See Fig. 1 for a graphic representation

R, Right; L, left; BA, Brodmann area; TD, Talairach Daemon.
Given these results, we next used VBM to evaluate the relationship between GM variations in these regions with the three executive function variables in the patient group. Rather than examining the total brain, we limited our analyses to the major regions indicated in Table 5. To do so we placed spheres centered on the coordinates for the three largest clusters, covering approximately 80% of the identified voxels significantly linked with pSES, again controlling for age, sex, ethnicity and site. No regions exceeded the FDR significance threshold for either group.
Discussion
The central results of the current study are that (1) low SES in childhood was related to lower planning and inhibition skills in individuals with schizophrenia but not controls, and (2) low SES in childhood was related to reduced GM in diverse anterior brain regions, especially the superior frontal gyrus, in individuals with schizophrenia but not in controls. These cognitive results were specific to Planning and Inhibition, as no trend was noted for Fluency. Adding additional covariates correlated with the diagnosis of schizophrenia (reduced intellectual functioning, education and sSES) attenuated significance levels, as expected, but left intact the significant interaction of group with pSES. Overall, individuals with schizophrenia showed greater sensitivity to early environmental stress than controls, consistent with our hypothesis (Yeo et al. Reference Yeo, Gangestad, Edgar and Thoma1999, Reference Yeo, Gangestad and Thoma2007) that reduced canalization, or reduced buffering to adversity, is central to the phenotype of schizophrenia.
Our negative VBM results relating regional GM density to executive function should be interpreted in the context of our prior report on group differences in regional GM morphology. Widespread GM reductions were found in the patient group, most prominently in the frontotemporal cortex (Segall et al. Reference Segall, Turner, van Erp, White, Bockholt, Gollub, Ho, Magnotta, Jung, McCarley, Schulz, Lauriello, Clark, Voyvodic, Diaz and Calhoun2009), including the smaller set of regions we now find linked with pSES. The current VBM analyses show that most of the GM correlates of pSES in the patient group were in the prefrontal cortex. The largest cluster was in bilateral superior-medial frontal regions, followed by smaller clusters localized mostly to the anterior half of the left hemisphere. Follow-up VBM analyses revealed no significant association (positive or negative) of GM concentration with executive skills in the patient group. Perhaps this is not surprising, however, as the integrity of many other cortical regions may contribute to the observed levels of executive functioning. Consistent with this formulation, total cortical GM volume was correlated with Planning and Inhibition in patients, but not in controls. Furthermore, other aspects of superior-medial frontal regions besides GM concentration may be important. For example, variation in cortical surface area and thickness, the two determinants of volume, reflect different neurodevelopmental processes that could be more related to executive skill levels than volume or concentration measures (Winkler et al. Reference Winkler, Kochunov, Blangero, Almasy, Zilles, Fox, Duggirala and Glahn2010). Our finding of superior-medial prefrontal GM reduction resembles the superior frontal gyrus GM volume reductions reported by van Harmelen et al. (Reference van Harmelen, van Tol, van der Wee, Veltman, Aleman, Spinhoven, van Buchem, Zitman, Penninx and Elzinga2010), albeit for a somewhat different aspect of childhood environment, emotional maltreatment.
A wealth of important functions has been linked with superior-middle prefrontal regions, in addition to traditional cognitive skills. These include reality monitoring (Buda et al. Reference Buda, Fornito, Bergstrom and Simons2011) and dynamic social comparison (Zink et al. Reference Zink, Tong, Chen, Bassett, Stein and Meyer-Lindenberg2008). Perhaps most important is the fact that this region seems to serve as a cortical hub, a hyper-connected region central to many functional brain networks (Hagmann et al. Reference Hagmann, Cammoun, Gigandet, Meuli, Honey, Wedeen and Sporns2008) that seems to be abnormal in individuals with schizophrenia (van den Heuvel et al. Reference van den Heuvel, Mandl, Stam, Kahn and Hulshoff Pol2010). Network models suggest that dysfunction of this region leads to a substantial reduction in the brain's global efficiency (van den Heuvel & Sporns, Reference van den Heuvel and Sporns2011).
The current results add to a growing body of research identifying non-genetic psychosocial risk factors for developing schizophrenia (van Os et al. Reference van Os, Kenis and Rutten2010). Healthy adult controls do not seem to be adversely affected by low pSES, although other studies have reported important effects in healthy children (Hackman et al. Reference Hackman, Farah and Meaney2010), a pattern consistent with the general reduction in the importance of shared environmental factors with increasing age (Haworth et al. Reference Haworth, Wright, Luciano, Martin, de Geus, van Beijsterveldt, Bartels, Posthuma, Boomsma, Davis, Kovas, Corley, Defries, Hewitt, Olson, Rhea, Wadsworth, Iacono, McGue, Thompson, Hart, Petrill, Lubinski and Plomin2010). Psychosocial interventions would thus be most effective if targeted at families specifically at risk for developing schizophrenia.
There are several important limitations to this study, and foremost among these is the nature of the specific cognitive variables used. Our measure of intelligence, although based on subtests from the WAIS-III, included primarily verbal tests. Fluency was also assessed with only verbal tests. Future investigations might benefit from the addition of more comprehensive estimates of intelligence and non-verbal measures of fluency. Similarly, our results are specific to the executive tasks used. Our executive measures did not emphasize working memory skill, which is a central component of most models of executive functioning. Another important consideration stems from the use of pSES, a rather non-specific marker available to characterize environment. We do not know which components of pSES are most important. Important correlates of pSES that could plausibly impact cognitive functioning and morphology include prenatal health care, community or neighborhood variables linked with psychosocial stress, and parental emotional environment. It is also important to note that because our groups were matched on pSES, we cannot evaluate the risk of low pSES for developing schizophrenia. However, matching facilitates analysis of the impact of pSES on specific features of schizophrenia, avoiding the complexities of treating it as a covariate.
Acknowledgments
This research was supported by grants from the Department of Energy under Award Number DE-FG02-08ER64581 and the National Institutes of Health (nos 5P20RR021938, 1RC1MH089257 and R01EB005846).
Declaration of Interest
None.


