


1. Introduction
The gas kinetic theory developed by Maxwell (Reference Maxwell1867) and Boltzmann (Reference Boltzmann1872) has turned out to be extremely successful in describing the rarefied gas dynamics of dilute gas, and it has found a wide range of applications in space vehicle re-entry, microelectromechanical systems, shale gas transport and so on. Especially, when the intermolecular potentials are known, transport coefficients of monatomic gases such as the shear viscosity  $\mu _s$ and thermal conductivity
  $\kappa$, obtained from the Chapman–Enskog expansion of the Boltzmann equation (Chapman & Cowling Reference Chapman and Cowling1970) agree well with experimental data. However, when the Boltzmann equation was extended to the Wang-Chang & Uhlenbeck (Reference Wang-Chang and Uhlenbeck1951) equation for molecular gases, difficulty arose in accurately determining the transport coefficients, e.g. the translational and internal Eucken factors (
 $\, f_{tr}$ and
  $f_{int}$, respectively) that appear in the thermal conductivity of a molecular gas
 \begin{equation} \frac{\kappa{M}}{\mu_s}=\frac{3R}{2}f_{tr}+\left(c_v-\frac{3R}{2}\right)f_{int}\equiv{c_v}{f_u}, \end{equation}
where  $M$ is the molar mass,
  $R$ is the universal gas constant,
  $c_v$ is the molar heat capacity at constant volume and
  $f_u$ is the total Eucken (Reference Eucken1913) factor.
It is also difficult to determine  $f_{tr}$ and
  $f_{int}$ experimentally, despite that the total thermal conductivity (or equivalently, the Eucken factor
  $f_u$) can be measured straightforwardly. However, in rarefied gas dynamics,
  $f_{tr}$ is an important parameter since rarefaction effects corresponding to the translational and internal motions of gas molecules are generally different. For example, in thermal transpiration where the gas automatically moves from a cold region to a hot region in the absence of a pressure gradient (Maxwell Reference Maxwell1879; Reynolds Reference Reynolds1879), the mass flow rate is proportional to
  $f_{tr}$, rather than
  $f_u$ (Porodnov, Kulev & Tuchvetov Reference Porodnov, Kulev and Tuchvetov1978; Loyalka & Storvick Reference Loyalka and Storvick1979; Loyalka, Storvick & Lo Reference Loyalka, Storvick and Lo1982). Although
  $f_{tr}$ can be measured in thermal transpiration flows (Mason Reference Mason1963; Gupta & Storvick Reference Gupta and Storvick1970), the result cannot be accurate as it is hampered by the inaccurate gas–surface interaction (Sharipov Reference Sharipov2011; Wu & Struchtrup Reference Wu and Struchtrup2017).
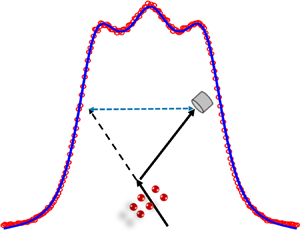
Recent advances in Rayleigh–Brillouin scattering (RBS) experiments of molecular gases provide an excellent method to retrieve the information on thermodynamic properties of gases (Pan, Shneider & Miles Reference Pan, Shneider and Miles2002, Reference Pan, Shneider and Miles2004; Meijer et al. Reference Meijer, de Wijn, Peters, Dam and van de Water2010; Vieitez et al. Reference Vieitez, van Duijn, Ubachs, Witschas, Meijer, de Wijn, Dam and van de Water2010; Gerakis, Shneider & Barker Reference Gerakis, Shneider and Barker2013; Gu & Ubachs Reference Gu and Ubachs2013; Gu et al. Reference Gu, Ubachs, Marques and van de Water2015), where the gas–surface interaction is absent, i.e. only a local volume inside the gas cell is probed by laser light, see figure 1. This extraction of gas information is achieved by comparing the experimental RBS line shapes with theoretical ones. The RBS line shape can be obtained by solving the linearized Boltzmann equation for monatomic gas and the Wang-Chang & Uhlenbeck (Reference Wang-Chang and Uhlenbeck1951) equation for molecular gas (Sugawara, Yip & Sirovich Reference Sugawara, Yip and Sirovich1968). However, due to the complexity of Boltzmann-type collision operators, simplified kinetic models like the Hanson & Morse (Reference Hanson and Morse1967) model, on which the prevailing Tenti, Boley & Desai (Reference Tenti, Boley and Desai1974) line shape models are based, were proposed. Most attention has been paid to the extraction of bulk viscosity, which is related only to the rotational relaxation time as the vibrational modes, even when they are activated fully or partially, remain ‘frozen’ at the high frequencies used in light scattering experiments (Meijer et al. Reference Meijer, de Wijn, Peters, Dam and van de Water2010).

Figure 1. Schematic of the spontaneous RBS process, where the light is scattered by the spontaneous density fluctuations in the gas. The vectors  $k_i$ and
  $k_s$ represent the incident and scattered light wave momentum vectors, respectively, while
  $k$ represents the Brillouin scattering vector, in both directions for Stokes and anti-Stokes scattering. The scattering wavelength is
  $L={\rm \pi} /|\boldsymbol {k}_i|\sin ({\theta }/{2})$. Figure modified from figure 1(a) in Wu & Gu (Reference Wu and Gu2020).
The Tenti model requires four input parameters: (i) the uniformity parameter  $y$ which is controlled by the shear viscosity, pressure, temperature, laser wavelength, and the angle of scattering; (ii) the internal degrees of freedom; (iii) the rotational relaxation time which determines the bulk viscosity in RBS experiments; and (iv) the effective thermal conductivity
  $\kappa _e$ involved in the light scattering. Since the vibrational relaxation is ‘frozen’ in RBS experiments, the internal degrees of freedom only correspond to the rotational degrees of freedom. Similarly, in the determination of effective thermal conductivity
  $\kappa _e$ the contribution from vibrational degrees of freedom should be subtracted (Wang et al. Reference Wang, Yu, Liang, Marques, van de Water and Ubachs2017, Reference Wang, Liang, van de Water, Marques and Ubachs2018; Wang, Ubachs & van de Water Reference Wang, Ubachs and van de Water2019),
 \begin{equation} \kappa_e=\frac{\mu_s}{M}\left(\frac{3R}{2}f_{tr}+\frac{d_rR}{2}f_{int}\right)\equiv\kappa-\frac{\mu_sd_vR}{2M}f_{int}, \end{equation}
where  $d_r$ is the number of rotational degrees of freedom and
  $d_v=2c_v/R-3-d_r$ is the number of all other internal degrees of freedom that are able to hold heat energy. However, this subtraction imposes an uncertainty on the value of
  $\kappa _e$, because
  $f_{int}$ and
  $f_{tr}$ cannot be determined accurately from previous theoretical and experimental works (Mason & Monchick Reference Mason and Monchick1962; Mason Reference Mason1963; Gupta & Storvick Reference Gupta and Storvick1970). Therefore, in order to extract the bulk viscosity accurately, the rotational relaxation time and translational Eucken factor should be varied simultaneously in gas kinetic models to find the minimum residual between the theoretical and experimental RBS line shapes. This cannot be achieved in the Tenti model, where
  $f_{tr}$ is a function of the rotational relaxation time.
In this paper we will use the kinetic model proposed by Wu et al. (Reference Wu, White, Scanlon, Reese and Zhang2015b), which not only allows an independent variation of bulk viscosity and translational Eucken factor, but also incorporates the physical velocity-dependent collision frequency of gas molecules, such that this kinetic model is reduced to the Boltzmann equation in the limit of infinite rotational relaxation time. We will show that the bulk viscosity and the translational Eucken factor can be extracted simultaneously from RBS experiments. Note that the prevailing direct simulation Monte Carlo (DSMC) method (Bird Reference Bird1994) with the Borgnakke & Larsen (Reference Borgnakke and Larsen1975) phenomenological model is not used here, since it cannot always recover the bulk viscosity and thermal conductivity of molecular gas simultaneously, as we will show later.
2. Transport coefficients of molecular gas
The essential difference between monatomic and molecular gases is that molecules exhibit relaxation that exchanges translational and internal energies, which lead to several new transport coefficients including the bulk viscosity and internal thermal conductivity; they also affect the translational thermal conductivity, making  $f_{tr}$ less than
  $5/2$ of monatomic gases (Mason & Monchick Reference Mason and Monchick1962).
For simplicity we consider the case where the rotational and vibrational internal modes are activated. In spatially homogeneous problems, the relaxation of rotational and vibrational temperatures ( $T_r$ and
  $T_v$, respectively) are described by the Jeans–Landau–Teller equation,
 \begin{equation} \frac{\partial{T_\ell}}{\partial t}=\frac{T_t-T_\ell}{\tau_\ell}, \quad \ell=r, v, \end{equation}
where  $\tau _r$ and
  $\tau _v$ are, respectively, the rotational and vibrational relaxation times, and
  $T_t$ is the translational temperature.
When the relaxation times are much smaller than the characteristic flow frequency  $\omega$ (e.g. the sound frequency or the frequency associated with the scattering wave vector in RBS), i.e.
  $\omega \tau _\ell \ll 1$, the bulk viscosity can be exactly derived as follows (Chapman & Cowling Reference Chapman and Cowling1970):
 \begin{equation} {\mu_b}=2n_0k_BT_t\frac{d_r\tau_r+d_v\tau_v}{(3+d_r+d_v)^2}, \end{equation}
where  $n_0$ is the number density of the gas and
  $k_B$ is the Boltzmann constant. However, when the characteristic flow frequency is comparable to or larger than
  $\tau ^{-1}_\ell$, the bulk viscosity becomes frequency dependent (Bruno, Frezzotti & Ghiroldi Reference Bruno, Frezzotti and Ghiroldi2015; Jaeger, Matar & Muller Reference Jaeger, Matar and Muller2018; Wang et al. Reference Wang, Ubachs and van de Water2019); it can be roughly described by (Meador, Miner & Townsend Reference Meador, Miner and Townsend1996; Meijer et al. Reference Meijer, de Wijn, Peters, Dam and van de Water2010)
 \begin{equation} \mu_b=2n_0k_BT_t\frac{\sum_\ell{}d_\ell\tau_\ell/(1+\omega^2\tau^2_\ell)}{\left[3+\sum_\ell{}d_\ell/(1+\omega^2\tau^2_\ell)\right]^2}. \end{equation}
At room temperature,  $\tau _{r}$ is approximately
  $10^{-10}\ \textrm {s}$, while
  $\tau _{v}$ is usually larger than
  $10^{-6}\ \textrm {s}$. Since in RBS the light frequency is operated in the gigahertz domain, the relaxation of vibrational modes is ‘frozen’, so the measured bulk viscosity is only determined through
 \begin{equation} \frac{\mu_b}{\mu_s}=\frac{2d_rZ}{3(d_r+3)}, \quad Z=\frac{3\tau_r}{(d_r+3)\tau}, \end{equation}
where  $Z$ is the rotational collision number, with
  $\tau ={\mu _s}/{n_0k_BT_t}$ being the mean collision time of gas molecules due to the translational motion.
Unlike the bulk viscosity (2.2) that can be exactly derived when  $\omega \tau _\ell \ll 1$, the thermal conductivities of molecular gases can only be approximately determined from the Wang-Chang & Uhlenbeck (Reference Wang-Chang and Uhlenbeck1951) equation through the Chapman–Enskog expansion (Chapman & Cowling Reference Chapman and Cowling1970); the corresponding Eucken factors are (Mason & Monchick Reference Mason and Monchick1962)
 \begin{equation} \left. \begin{aligned} f_{tr} & =\frac{5}{2}\left[1-\frac{5d_r}{4(d_r+3)Z}\left(1-\frac{2\rho{D'}}{5\mu_s}\right)\right],\\ f_{int} & =\frac{\rho{D'}}{\mu_s}\left[ 1+\frac{15d_r}{4(d_r+d_v)(d_r+3)Z}\left(1-\frac{2\rho{D'}}{5\mu_s}\right) \right], \end{aligned} \right\} \end{equation}
where  $\rho$ is the mass density of the gas,
  $D'$ is the average diffusion coefficient, which can be markedly different from the self-diffusion coefficient
  $D$ if strong resonant collision occurs. The fact that
  $f_{tr}$ decreases along with
  $Z$ can be explained as follows: due to the internal energy exchanges, the translational thermal conductivity decreases because during the transport of gas molecules part of the translational energy is converted to the internal energy; the intensity of this conversion becomes stronger when
  $Z$ decreases, and when
  $D'$ increases. The internal Eucken factor
  $f_{int}$ changes with respect to
  $Z$ in opposite direction. This shows that (2.5) is physically reasonable.
It is clear from (2.5) that when the gas species is chosen, its dynamics is affected by two free parameters: the rotational collision number that determines the bulk viscosity and the average diffusion coefficient  $D'$ (or equivalently
  $f_{tr}$), which should guarantee the total thermal conductivity (as well as its components) to agree with experimental data. For monatomic gas, the structure of the Boltzmann collision operator ensures that
  $f_{tr}$ is very close to 2.5, which agrees with experimentally measured values. Since it can be rigorously proved that the DSMC method and the Boltzmann equation are equivalent for monatomic gas (Wagner Reference Wagner1992), DSMC can also produce reasonable values of thermal conductivity. However, despite the overwhelming success of DSMC over deterministic solvers of gas kinetic equations for hypersonic flow simulations, whether it can produce the exact translational and internal thermal conductivities of molecular gases or not has been overlooked. The variable-soft-sphere model has been developed to recover the experimental values of shear viscosity and self-diffusion coefficients, while the Borgnakke & Larsen (Reference Borgnakke and Larsen1975) phenomenological collision model has been developed to recover the energy exchange rate (Boyd Reference Boyd1990; Haas et al. Reference Haas, Hash, Bird, Lumpkin III and Hassan1994; Gimelshein, Gimelshein & Lavin Reference Gimelshein, Gimelshein and Lavin2002) so that the bulk viscosity is obtained exactly. However, whether the total thermal conductivities,
  $f_{tr}$ and
  $f_{int}$ have been accurately modelled in DSMC or not has not been investigated in detail (Gallis, Rader & Torczynski Reference Gallis, Rader and Torczynski2004) as, actually, there is no mechanism dedicated to recovering the thermal conductivity correctly. These parameters, however, affect the thermal transpiration (Gupta & Storvick Reference Gupta and Storvick1970) and the RBS line shape (as we shall see in § 3.2 below).
The approximate solution (2.5) implies that the DSMC might also be able to recover the total thermal conductivity of molecular gas, by adjusting the self-diffusion coefficient. This is illustrated in figure 2, for the non-polar gas nitrogen and polar gas hydrogen chloride, where the self-diffusion coefficient  $D$ satisfies
  $\rho {D}/\mu _s=1.34$ at room temperature. It can be seen that the thermal conductivities are functions of the diffusion coefficient
  $D'$ and the inelastic collision probability
  $\varLambda$. Compared with (5.67) and (4.50) in the book by Bird (Reference Bird1994),
  $\varLambda$ is related to the collision number
  $Z$ through the Jeans equation (2.1) as
 \begin{equation} Z=\frac{1}{\varLambda}\frac{\alpha(5-2\omega)(7-2\omega)}{5(\alpha+1)(\alpha+2)}, \end{equation}
where  $\alpha$ is the exponent in the variable-soft-sphere model and
  $\omega$ is the viscosity index such that the shear viscosity varies with the temperature as
 \begin{equation} \mu_s(T)=\mu_s(T_0)\left(\frac{T}{T_0}\right)^\omega. \end{equation}
Thus, if we know the total thermal conductivity and bulk viscosity of molecular gas from experiments,  $Z$ and
  $\varLambda$ can be determined first, and then the average diffusion coefficient
  $D'$ can be varied to recover the total thermal conductivity. Nevertheless, at the same values of bulk viscosity and thermal conductivity, the approximate solution (2.5) and DSMC with the phenomenological Borgnakke & Larsen (Reference Borgnakke and Larsen1975) model possess different values of
  $f_{tr}$, and one does not know which one is accurate, or maybe both are not. For hydrogen chloride, the resonant interaction leads to a significant reduction of
  $\rho {}D'/\mu _s$ from 1.34 to 0.89 (Mason & Monchick Reference Mason and Monchick1962); in order to recover the total thermal conductivity measured from experiments, figure 2(b) shows that the inelastic collision probability
  $\varLambda$ in DSMC should approach unity, which seems not physical as the maximum possible rate of exchange between translational and internal energy is reached. If one wants to use a reasonable value of
  $\varLambda$ (or the bulk viscosity),
  ${D'}$ should be much smaller than the self-diffusion coefficient. This will pose another difficulty: in gas mixtures where both diffusion and thermal conductivity are important, how to recover them in DSMC with the Borgnakke & Larsen (Reference Borgnakke and Larsen1975) model? On the contrary, the approximate solution (2.5) seems to give a reasonable value of the inelastic collision probability.

Figure 2. The thermal conductivity obtained from the analytical solution (2.5) and the DSMC at room temperature, as a function of the inelastic collision probability  $\varLambda$. The open source DSMC code SPARTA (https://sparta.sandia.gov/) is used to simulate the Fourier flow between two parallel plates, at a Knudsen number of 0.05, and the translational and internal thermal conductivities are extracted in the bulk region (a few mean free paths away from the plates) using the Fourier heat conduction law. The variable-soft-sphere model is used and the self-diffusion coefficient
  $D$ in DSMC takes the value of
  $D'$. Open diamonds, squares and triangles represent the translational, internal and total Eucken factors from (2.5), respectively, while the filled symbols are the corresponding results from DSMC. Dashed lines show the total Eucken factor obtained from experiments at a temperature of 300 K.
  $(a)$ Nitrogen,
  $\rho {D'}/\mu _s=1.34$;
  $(b)$ hydrogen chloride,
  $\rho {D'}/\mu _s=0.89$.
Therefore, although the phenomenological Borgnakke & Larsen (Reference Borgnakke and Larsen1975) model has been widely used, we believe that more tests should be done to validate it. In addition, in terms of RBS application the DSMC is very time-consuming. This is because to compute a single RBS line shape it would take several hours of wall-clock time (Bruno et al. Reference Bruno, Capitelli, Longo and Minelli2006; Bruno, Frezzotti & Ghiroldi Reference Bruno, Frezzotti and Ghiroldi2017), while to extract the bulk viscosity and translational Eucken factor (through the adjustment of average diffusion coefficient) from RBS experiments it needs hundreds of hours. Therefore, the Wu et al. (Reference Wu, White, Scanlon, Reese and Zhang2015b) model will be used in this paper, since (i) it has the flexibility to adjust the bulk viscosity and translational Eucken factor independently; (ii) in the limit of no internal-translational energy exchange, the Boltzmann equation, DSMC and Wu et al. model all yield same results; and (iii) it can produce one RBS line shape in just a few seconds in a laptop, due to the fast spectral method for the Boltzmann collision operator (Wu et al. Reference Wu, Liu, Zhang and Reese2015a) and the general synthetic iterative scheme (Su et al. Reference Su, Zhu, Wang, Zhang and Wu2020).
3. The Wu et al. model for molecular gas
The spectrum of scattered light in spontaneous RBS processes shown in figure 1 is strongly influenced by the rarefaction parameter  $\delta _{rp}$ (i.e. the ratio of the scattering wavelength
  $L$ to the molecular mean free path)
 \begin{equation} \delta_{rp}=\frac{n_0k_BT_0}{\mu_s{(T_0)}v_m}L\equiv2{\rm \pi}{y}, \end{equation}
where  $y$ is the uniformity parameter frequently used in RBS experiments,
  $T_0$ is the gas temperature,
 \begin{equation} v_m=\sqrt{\frac{2k_BT_0}{m}} \end{equation}
is the most probable speed and  $m$ is the mass of gas molecules.
The dynamics of molecular gas is described by Wang-Chang & Uhlenbeck (Reference Wang-Chang and Uhlenbeck1951), where each individual energy level of molecules was assigned a velocity distribution function. This brings tremendous analytical and computational difficulties; therefore it is necessary to develop kinetic models to simplify the Boltzmann-type collision operator. In RBS, the Hanson & Morse (Reference Hanson and Morse1967) model, on which the Tenti et al. (Reference Tenti, Boley and Desai1974) model is based, serves this purpose. When the vibrational relaxation is ‘frozen’ in RBS experiments, the bulk viscosity in Tenti's model satisfies (2.4a,b). On the other hand, when the effective thermal conductivity  $\kappa _e$ in (1.2) and the bulk viscosity (controlled by
  $Z$) are known, the translational Eucken factor is uniquely determined as (Loyalka & Storvick Reference Loyalka and Storvick1979)
 \begin{equation} f_{tr}=\frac{5f_u^e+10Z}{5+4Z}, \end{equation}
where  $f_u^e={2m\kappa _e}/{(3+d_r)\mu _s{k_B}}$.
However, since the interaction between molecules is not in all cases governed by a symmetric Maxwellian potential as assumed by Wang-Chang & Uhlenbeck (Reference Wang-Chang and Uhlenbeck1951), (3.3) might not hold for all molecules. More seriously, in many previous papers  $f_u^e$ is chosen as
  $f_u$, such that the thermal conductivity due to the vibrational motion of gas molecules, which is not involved in RBS scattering, is considered. Therefore, a kinetic model for a molecular gas which allows the independent change of
  $Z$ and
  $f_{tr}$ is needed. The model developed by Wu et al. (Reference Wu, White, Scanlon, Reese and Zhang2015b), which introduces two velocity distribution functions
  $h_0$ and
  $h_2$ to describe the system state, satisfies the following requirement:
 \begin{equation} \left. \begin{aligned} & \frac{\partial{h_0}}{\partial {t}}+v_1\frac{\partial h_0}{\partial x_1}=\mathcal{C}_0\equiv\mathcal{L}(h_0)-\nu_{eq}(\boldsymbol{v}){h_0}\\ & \quad + \delta_{rp}\frac{f_{eq}}{Z}\left[(T-T_t)\left(v^2-\frac{3}{2}\right)+\frac{4(\omega_0-1)}{15}q_tv_1\left(v^2-\frac{5}{2}\right)\right],\\ & \frac{\partial{h_2}}{\partial {t}}+v_1\frac{\partial h_2}{\partial x_1}=\mathcal{C}_2\equiv\delta_{rp}\left[\frac{d_r}{2}T_rf_{eq}-h_2\right] + \frac{d_r\delta_{rp}}{2Z}(T-T_r)f_{eq}\\ & \quad +\delta_{rp}\frac{{2(Z+\omega_1-1)(1-\delta)}}{Z} q_rv_1f_{eq}, \end{aligned} \right\} \end{equation}
where  $\delta$ is the Schmidt number of the gas,
  $f_{eq}(\boldsymbol {v})={\exp (-v^2)}/{{\rm \pi} ^{3/2}}$ is the global equilibrium distribution function,
  $\mathcal {L}(h_0)$ is the gain part of the linearized Boltzmann collision operator
  $\mathcal {L}(h_0)=\iint {}B [\,f_{eq}(\boldsymbol {v}')h_0({\boldsymbol {v}}')+h_0(\boldsymbol {v}')f_{eq}({\boldsymbol {v}}'_{\ast })-f_{eq}(\boldsymbol {v})h_0({\boldsymbol {v}}_{\ast })]\,\textrm {d}\varOmega \,\textrm {d}{\boldsymbol {v}}_{\ast }$ and
  $\nu _{eq}(\boldsymbol {v})=\iint B f_{eq}(\boldsymbol {v}_{\ast })\,\textrm {d}\varOmega {}\,\textrm {d}{\boldsymbol {v}}_{\ast }$ is the equilibrium collision frequency, with
  $\boldsymbol {v}$ and
  $\boldsymbol {v}_{\ast }$ being the velocity of two molecules before the binary collision,
  $\boldsymbol {v}'$ and
  $\boldsymbol {v}'_{\ast }$ the corresponding velocities after collision,
  $\textrm {d}\varOmega$ the solid angle of binary scattering and
  $B$ the elastic collision probability determined by the intermolecular potential. Here we consider the inverse power law intermolecular potential, where the shear viscosity is given by (2.7). For hard-sphere and Maxwellian molecules we have
  $\omega =0.5$ and 1, respectively. The collisional behaviour of other gases usually falls between these two cases, and the viscosity index
  $\omega$ normally has value between 0.5 and 1 (Bird Reference Bird1994). Details of the collision probability
  $B$ have been presented by Wu et al. (Reference Wu, Liu, Zhang and Reese2015a).
Note that in (3.4) the molecular velocity  $\boldsymbol {v}$, spatial coordinate
  $x_1$ and time
  $t$ have been normalized by the most probable speed
  $v_m$, the scattering wavelength
  $L$, and
  $L/v_m$, respectively. Also, the translational temperature is
  $T_t=\int {(2v^2/3-1)h_0}\,\textrm {d}\boldsymbol {v}$, the rotational temperature is
  $T_r=(2/d_r)\int {h_2}\,\textrm {d}\boldsymbol {v}$, the total temperature is
  $T=(3T_t+d_rT_r)/(3+d_r)$, the translational and rotational heat flux are, respectively,
  $q_t=\int {(v^2-5/2)v_1h_0}\,\textrm {d}\boldsymbol {v}$ and
  $q_r=\int {v_1h_2}\,\textrm {d}\boldsymbol {v}$.
While the bulk viscosity is determined by  $Z$ in (2.4a,b), the translational and internal Eucken factors,
 \begin{equation} f_{tr}=\frac{5}{2}\left(1+\frac{1-\omega_0}{2Z}\right)^{-1}, \quad f_{int}=\delta^{-1}\left[1+\frac{(1-\delta)(1-\omega_1)}{\delta{}Z}\right]^{-1}, \end{equation}
are controlled by  $\omega _0$ and
  $\omega _1$, respectively. This is one of the advantages of the Wu et al. model, where the two Eucken factors can be varied independently, while in the Tenti model
  $f_{tr}$ is uniquely determined by
  $Z$ in (3.3).
The RBS spectrum  $S=\int \textrm {Re}(\hat {h}_0)\,\textrm {d}\boldsymbol {v}$ of a molecular gas, where
  $\mathrm {Re}$ is the real part of a variable, can be obtained by solving the following equations iteratively (Wu et al. Reference Wu, White, Scanlon, Reese and Zhang2015b):
 \begin{equation} \hat{h}_0^{(j+1)}(\boldsymbol{v})=\frac{f_{eq}+\hat{\mathcal{C}}_0^{(j)}+\nu{\hat{h}_0^{(j)}} }{2{\rm \pi}{}i(f_s-v_1)+\bar{\nu}},\quad \hat{h}_2^{(j+1)}(\boldsymbol{v})=\frac{\hat{\mathcal{C}}_2^{(j)}+\nu{\hat{h}_2^{(j)}} }{2{\rm \pi}{}i(f_s-v_1)+\bar{\nu}}, \end{equation}
where  $j$ is the iteration step,
  $f_s$ is the frequency shift in the scattering process normalized by
  $v_m/L$, and
  $\bar {\nu }=1.5\delta _{rp}(1+1/Z)$ is chosen to ensure the stability of iterations. Given the uniformity
  $y$ and frequency shift
  $f_s$, the iteration is terminated when the relative difference in the RBS spectrum between two consecutive iterations is less than
  $10^{-6}$. Starting from zero disturbance (i.e.
  $\hat {h}^{(0)}=\hat {h}^{(2)}=0$), typically 20 iterations are sufficient to reach convergence at any value of
  $y$ when the general synthetic iterative scheme (Su et al. Reference Su, Zhu, Wang, Zhang and Wu2020) is used; and only a few seconds is needed to compute a line shape on a laptop.
3.1. Role of the rotational collision number
When  $y$ is small, the gas dynamics is described by the collisionless Boltzmann equation so any internal relaxations are frozen. That is, the RBS spectrum adopts a Gaussian shape determined solely by the temperature. To study the influence of the rotational collision number on the RBS line shapes we need to choose larger values of
  $y$.
$y$.
Figure 3 shows the RBS spectra for  $y=4$. It can be seen that the spectrum near the central Rayleigh peak increases with
  $Z$. Also, for diatomic gases (
 $d_r=2$), the position of the side Brillouin peak shifts from
  $f_s=0.83$ to 0.90 when
  $Z$ increases from 2 to 100, while in the case of nonlinear polyatomic gases (
 $d_r=3$) this peak moves from 0.81 to 0.90. Since this position is approximately determined by the sound speed normalized by the most probable speed
  $v_m$, it is concluded that the rotational relaxation is gradually frozen with increasing
  $Z$, such that the sound speed of the molecular gas increases from
  $\sqrt {(5+d_r)/2(3+d_r)}$ to that of a monatomic gas
  $\sqrt {5/6}$. Note that the collision number corresponding to vibrational modes is of the order of
  $10^4$ for
  $\textrm {CO}_2$ and
  $\textrm {SF}_6$, and even larger for other molecules (Meijer et al. Reference Meijer, de Wijn, Peters, Dam and van de Water2010). Therefore, this example further confirms that, when applying the gas kinetic model, the internal degrees of freedom should be the rotational degrees of freedom
  $d_r$, and the total thermal conductivity should only take into account the contribution from the translational and rotational motions. Indeed, in the analysis of experimental RBS spectra it was concluded that the vibrational relaxation was found to be frozen in various molecular gases (Wang et al. Reference Wang, Yu, Liang, Marques, van de Water and Ubachs2017, Reference Wang, Liang, van de Water, Marques and Ubachs2018, Reference Wang, Ubachs and van de Water2019).

Figure 3. Computed RBS spectra showing the influence of rotational collision number in  $(a)$ a diatomic gas and
  $(b)$ nonlinear polyatomic gas with
  $d_r=3$, when
  $f_{tr}=f_{int}=2$ and
  $y=4$. In this and following figures, if not further specified, the RBS spectrum is normalized by the area
  $\int _{-\infty }^{\infty }S(\,f_s)\,\textrm {d}f_s$ of each line shape.
3.2. Role of the translational Eucken factor
In the hydrodynamic regime (i.e. when  $y$ is large), the RBS line shape is determined by the total thermal conductivity, while in the free-molecular regime only the gas temperature determines the Gaussian line shape. However, the role of thermal conductivity in the kinetic regime, as an intermediate between these two limiting cases, is not a priori determined. Here we investigate the influence of
  $f_{tr}$ on the RBS line shape when the total thermal conductivity (or equivalently
  $f_u$) is fixed. In this case, the internal Eucken factor can be calculated as
  $f_{int}={[(3+d_r+d_v)f_u-3f_{tr}]}/{(d_r+d_v)}$.
We first consider the case where the vibrational degrees of freedom are not activated, i.e.  $d_v=0$; this occurs in, for example, oxygen at a temperature (e.g. room temperature) far smaller than the characteristic temperature of activation (around 2274 K) of the vibrational energy. We choose the total Eucken factor
  $f_u=2$ and the rotational collision number
  $Z=2$. The computational results for the kinetic regime are summarized in figure 4, where we see that the variation of
  $f_{tr}$ leads to a strong change of the RBS line shape: the RBS spectrum near the Rayleigh peak decreases when
  $f_{tr}$ increases; the strongest variation occurs around
  $y\sim 1$, and vanishes when
  $y\gtrsim 5$ or
  $y\lesssim 0.2$, i.e. in the hydrodynamic regime and in the near-collisionless regime, respectively.

Figure 4. Computed RBS spectra displaying the influence of translational Eucken factor on RBS spectra of molecular gases with  $d_r=2$ and
  $d_v=0$, when the total Eucken factor is
  $f_u=2$ and the rotational collision number is
  $Z=2. \ (a) \ y = 4; \ (b) \ y = 3; \ (c) \ y = 2; \ (d) \ y = 1.$
We then consider the case when the vibrational degrees of freedom are activated. For example,  $d_r=3$ and
  $d_v=15$ for
  $\mathrm {SF}_6$ at room temperature. In this case, even at relatively large values of
  $y$, different values of
  $f_{tr}$ lead to different RBS spectra (the difference is most prominent at the relative intensity of the central Rayleigh peak), see figure 5. This is because only the translational and rotational heat conductivities are reflected in RBS spectra (Wang et al. Reference Wang, Yu, Liang, Marques, van de Water and Ubachs2017, Reference Wang, Liang, van de Water, Marques and Ubachs2018, Reference Wang, Ubachs and van de Water2019), and their sum varies with
  $f_{tr}$ even when
  $f_u$ is fixed.

Figure 5. Computed RBS spectra showing the influence of  $f_{tr}$ on the RBS spectra of Maxwellian molecules with
  $d_r=3$ and
  $d_v=15$. The rotational collision number is
  $Z=3$ and the total Eucken factor is
  $f_u=1.429$. Triangles,
  $f_{tr}=2.5$; lines,
  $f_{tr}=2$.
4. Extraction of bulk viscosity and translational Eucken factor
From the above numerical simulations we see that the RBS line shape is affected by  $Z$ and
  $f_{tr}$. Here we compare the theoretical RBS line shapes based on the Wu et al. model with experimental ones, to extract both bulk viscosity and translational Eucken factor.
4.1. An analysis of uncertainties in extracting  $Z$ and $f_{tr}$


Uncertainties in pressure, temperature, wavelength, scattering angle and full width at half-maxima (FWHM) of the instrumental resolution are inevitable in RBS experiments, which affect the accuracy in extracting  $Z$ and
  $f_{tr}$. Here, uncertainties will be quantified in an error modelling approach. To be specific, we first generate the reference spectrum
  $S_{ref}$ using the Wu et al. model with designated values of
  $Z$,
$Z$,  $f_{tr}$,
  $f_{int}$ and the instrumental function. Then we assume one of the measured parameters has an uncertainty while others are accurate. Many numerical spectra
  $S_{num}$ will be generated with different values of
  $Z$ and
  $f_{tr}$, but the same value of total Eucken factor
  $f_u$; this corresponds to the case that the total thermal conductivity is known but its separate contributions from the translational and internal motions of gas molecules are not known. Then the ‘real’ values of
  $Z$ and
  $f_{tr}$ are extracted when the following error:
 \begin{equation} E(Z,f_{tr})=\int_0^\infty{(S_{ref}-S_{num})^2}\,\textrm{d}f_s, \end{equation}
reaches the minimum value. Without loss of generality we consider the Maxwell gas with  $d_r=2, d_v=0$ and
  $Z=f_{tr}=f_{int}=y_{ref}=2$ in the reference solution.
First, suppose the ‘real’ number density of gas molecules is larger than the average number density  $n_0$ by
  $n_0\varDelta {}$ per cent. According to (3.1), the
  $y$ parameter used in the ‘numerical’ spectra is
  $y_{num}=y_{ref}(1+\varDelta )$. Given the value of
  $\varDelta$, we obtain the error function
  $E(Z,f_{tr})$, which possesses a global minimum in the
  $Z-f_{tr}$ space, see figure 6(a). Thus
  $Z$ and
  $f_{tr}$ can be extracted from this minimum point through cubic interpolation, these are shown in figure 6(c). It is seen that (i) the uncertainties in
  $Z$ and
  $f_{tr}$ are nearly linear functions of
  $\varDelta$; and (ii) a
  $1\,\%$ uncertainty in the gas pressure yields approximately
  $2\,\%$ and
  $6\,\%$ uncertainties in
  $Z$ and
  $f_{tr}$, respectively. The absolute difference between the numerical and reference spectra is shown in figure 6(b), where we see large discrepancies occur around the Rayleigh and Brillouin peaks.

Figure 6.  $(a)$ The error function (4.1) when the relative error in pressure is
  $\varDelta =2\,\%$.
  $(b)$ The difference in numerical (when
  $E$ is minimum) and reference spectra when
  $\varDelta =2\,\%$.
  $(c)$ Relative errors in the extracted
  $Z$ and
  $f_{tr}$.
Second, the influence of the relative errors  $\varDelta _T$ and
  $\varDelta _\theta$ in temperature and scattering angle on the extracted
  $Z$ and
  $f_{tr}$ is shown in figure 7(d,e), from which we see that
  $Z$ can be extracted with fair accuracy, while the error in
  $f_{tr}$ is large. However, the influence of the scattering angle is larger, especially when the ‘real’ scattering angle is less than the measured one. The absolute difference between the numerical and reference spectra is shown in figure 7(a,b), where we see that, unlike the case of uncertainty in number density, the discrepancy around the Brillouin peak is larger than that around the Rayleigh peak.

Figure 7. Effect of the relative error in ( $a$,
$a$, $d$) temperature, (
 $b$,
$b$, $e$) scattering angle and (
 $c$,
$c$, $\,f$) FWHM. (
 $a$–
$a$– $c$) The difference in numerical (when
  $E$ in (4.1) is minimum) and reference spectra when
  $\varDelta =2\,\%$. (
 $d$–
$d$– $f$) Relative errors in the extracted
  $Z$ and
  $f_{tr}$. The reference scattering angle is
  $90^\circ$ as used in most RBS experiments.
Third, the effect of the uncertainty  $\varDelta _{\lambda }$ in wavelength is the same as that caused by a
  $-4\varDelta _{\lambda }/{\rm \pi}$ uncertainty in scattering angle when the scattering angle is
  $90^\circ$. Fourth, we consider the influence of FWHM in the following instrumental function:
 \begin{equation} I= \left\{1+\left(\frac{2\cdot\text{FSR}}{{\rm \pi}\cdot\text{FWHM}}\right)^2\sin^2\left(\frac{{\rm \pi}{}}{\text{FSR}}f_s\right) \right\}^{-1}, \end{equation}
where we take  $\text {FWHM}=0.15$ and free spectral range
  $\text {FSR}=5$ as relevant in the RBS experiment (Gu & Ubachs Reference Gu and Ubachs2013). Results in figures 7(c) and 7(f) show that uncertainties in
  $Z$ and
  $f_{tr}$ are approximately one, and twice of that in FWHM.
Finally, in addition to these systematic errors, there is still noise in the spectrum. However, the advanced scattering set-up involving the combination of a powerful narrowband laser with an enhancement cavity as well as signal averaging over several hours yields high signal-to-noise spectral profiles with uncertainty below the 1 % level (Gu et al. Reference Gu, Vieitez, van Duijn and Ubachs2012). Thus its influence on the extraction of  $Z$ and
  $f_{tr}$ is negligible.
In recent RBS experiments (Wang et al. Reference Wang, Yu, Liang, Marques, van de Water and Ubachs2017, Reference Wang, Liang, van de Water, Marques and Ubachs2018, Reference Wang, Ubachs and van de Water2019), the uncertainties in number density, temperature, scattering angle and wavelength are approximately 0.25 %, 0.03 %, 0.3 % and 0.25 %, respectively. Therefore, the induced uncertainty in  $Z$ and
  $f_{tr}$ is less than 2 %. However, the uncertainty in FWHM can be as high as 3 % (Wang et al. Reference Wang, Yu, Liang, Marques, van de Water and Ubachs2017), which results in 3 % and 6 % uncertainties in
  $Z$ and
  $f_{tr}$, respectively. By using more accurate devices the uncertainty in FWHM may be reduced (Shang et al. Reference Shang, Wu, Wang, Yang, Ye, Hu, Tao and He2019).
4.2. $\mathrm {N}_2$

We first extract the bulk viscosity and translational Eucken factor of  $\mathrm {N}_2$ based on the experimental data of Gu & Ubachs (Reference Gu and Ubachs2013), where the laser wavelength of 366.8 nm is used and the scattering angle is
  $90^\circ$, i.e.
  $\theta ={\rm \pi} /2$. Therefore, the effective wavelength is
  $L=259.4\ \textrm {nm}$. The rotational and vibrational degrees of freedom of
  $\mathrm {N}_2$ in the experimental condition are
  $d_r=2$ and
  $d_v=0$, respectively. The shear viscosity and thermal conductivity are calculated based on the Sutherland formula (White Reference White1998). The viscosity index
  $\omega$ is calculated according to (2.7) based on the Sutherland formula and listed in table 1. The translational and internal Eucken factors in the Wu et al. model (3.4) are chosen to recover the correct value of the thermal conductivity.
Table 1. Experimental conditions in RBS of  $\mathrm {N}_2$ (Gu & Ubachs Reference Gu and Ubachs2013) and extracted values of the bulk viscosity and translational/internal Eucken factor based on the Wu et al. model (3.4). The shear viscosity
  $\mu _s$ and total thermal conductivity
  $\kappa$ are shown in SI units. The translational and internal Eucken factors
  $f'_{tr}$ and
  $f'_{int}$ are calculated according to (2.5) with
  ${\rho {D'}}/{\mu _s}=1.32$ (Mason & Monchick Reference Mason and Monchick1962), using the extracted rotational collision number related to the bulk viscosity (2.4a,b), while
  $f''_{tr}$ and
  $f''_{int}$ are also calculated according to (2.5) using the rotational collision number from Parker (Reference Parker1959).

From the above results we find that the error function  $E(Z,f_{tr})$ has one global minimum and is convex. Therefore, to accurately and efficiently determine
  $Z$ and
  $f_{tr}$, we adopt the following procedure.
(i) We fix the value of
$f_{tr}$, vary the value of $Z$, and calculate the RBS spectrum based on the Wu et al. model. Then the obtained analytical spectrum is convolved with the instrumental response function to yield the spectrum $S_{WU}(f_s)$. The error is defined as
(4.3)where\begin{equation} E(Z)=\sum_{\ell=1}^N\frac{\{S_{exp}[\,f_s(\ell)]-S_{WU}[\,f_s(\ell)]\}^2}{N}, \end{equation}$N$ is the number of discrete frequencies measured in experiments. The minimum error $E_m(f_{tr})$ is found by fitting $E$ as the quartic polynomial function of $Z$ and finding the minimum of this quartic function. Typically six different values of $Z$ are calculated.(ii) Repeat (i) for different values of
$f_{tr}$. Typically six different values of $f_{tr}$ are calculated.(iii) Fitting
$E_m(f_{tr})$ as the quartic polynomial function of $f_{tr}$ we can determine $f_{tr}$ corresponding to the minimum point of this quartic function.(iv) With
$f_{tr}$ determined in (iii) we do (i) once again to determine $Z$. Hence the bulk viscosity is obtained according to (2.4a,b).


Comparisons between the experimental data and the theory (3.4) are visualized in figure 8. The residuals between the experimental and theoretical line shapes are generally within 1 %. According to the acoustic experiment (Lambert Reference Lambert1977) the rotational relaxation time of  $\mathrm {N}_2$ at standard temperature and pressure is
  $\tau _r=7.4\times 10^{-10}\ \textrm {s}$, therefore according to (2.4a,b) the bulk viscosity is
  $\mu _b=2p\tau _r{d_r}/{(3+d_r)^2} =1.18\times 10^{-5}\ \textrm {kg}\,\textrm {m}^{-1}\,\textrm {s}^{-1}$, which agrees well with the extracted bulk viscosity
  $\mu _b=1.22\times 10^{-5}\ \textrm {kg}\,\textrm {m}^{-1}\,\textrm {s}^{-1}$ at
  $T=296.7\ \textrm {K}$.

Figure 8. Extraction of the bulk viscosity and translational Eucken factor of  $\mathrm {N}_2$ from the experimental RBS spectra
  $S_{exp}$ (circles) measured by Gu & Ubachs (Reference Gu and Ubachs2013). Lines in panels (
 $a$–
$a$– $d$) show the RBS spectra
  $S_{WU}$ obtained from the Wu et al. model with the minimum error (4.3) over a wide range of
  $f_{tr}$ and
  $Z$, while those in panels (
 $e$–
$e$– $h$) show the corresponding residuals between the experimental and theoretical spectra. Experimental conditions and extracted parameters are summarized in table 1.
The translational and internal Eucken factors are also extracted from the RBS experiment. We would like to compare these values with analytical solutions (2.5) derived by Mason & Monchick (Reference Mason and Monchick1962) from the Wang-Chang & Uhlenbeck (Reference Wang-Chang and Uhlenbeck1951) equation. In the paper of Mason & Monchick (Reference Mason and Monchick1962),  ${\rho {D'}}/{\mu }$ takes the value of
  $1.32$ for nitrogen, for the temperatures listed in table 1. With the extracted rotational collision number
  $Z$ from the RBS experiment, we can assess the accuracy of analytical expressions for translational and internal Eucken factors. Results are compared with the corresponding extracted values in table 1. The agreements between
  $f_{tr}$ and
  $f'_{tr}$ as well as
  $f_{int}$ and
  $f'_{int}$ are good, with maximum relative deviation less than 10 %. We also calculate the analytical translational Eucken factors
  $f''_{tr}$ and
  $f''_{int}$ by using the rotational collision number from the theory of Parker (Reference Parker1959), and find larger deviations from the experimentally extracted values. Generally speaking, compared with the transport coefficients obtained from the Boltzmann equation for monatomic gas, where the relative deviation is less than
  ${\sim }2\,\%$, analytical transport coefficients of molecular gas (2.5) give less satisfactory agreements with the experimental data, probably due to the introduced approximations in analytical derivations.
4.3. $\mathrm {CO}_2$

We now extract the bulk viscosity and translational Eucken factor of  $\mathrm {CO}_2$ based on the experimental data of Gu et al. (Reference Gu, Ubachs and van de Water2014) at the temperature of 296.5 K. The laser wavelength is 366.8 nm and the scattering angle is
  $90^\circ$, thus the effective scattering wavelength is
  $L=259.4\ \textrm {nm}$. The shear viscosity is
  $\mu _s=1.49\times 10^{-5}\ \textrm {kg}\,\textrm {m}^{-1}\,\textrm {s}^{-1}$ and the thermal conductivity is
  $\kappa =1.67\times 10^{-2}\ \textrm {W}\,\textrm {K}^{-1}\,\textrm {m}^{-1}$. The viscosity index used in the Boltzmann equation is
  $\omega =0.933$ (Chapman & Cowling Reference Chapman and Cowling1970), the rotational degrees of freedom is
  $d_r=2$ and the vibrational degrees of freedom is
  $d_v=1.87$, using the data from the National Institute of Standards and Technology. Comparisons between the experimental and theoretical RBS line shapes are shown in figure 9, where the extracted rotational collision numbers are
  $Z=1.72$, 1.56, 1.64, the translational Eucken factors are
  $f_{tr}=2.30$, 2.23 and 2.18, and the internal Eucken factors are
  $f_{int}=1.28$, 1.34 and 1.37, at pressures 2, 3 and 4 bar, respectively. We do not consider the case of 1 bar pressure because the uniformity parameter is
  $y=0.83$ so that the line shape is not sensitive to
  $f_{tr}$ and
  $Z$. Taking the average value we find that the translational and internal Eucken factors are
  $f_{tr}=2.24$ and
  $f_{int}=1.33$, respectively. The average value for the rotational collision number is
  $Z=1.60$ and hence the bulk viscosity is
  $\mu _b=6.6\times 10^{-6}\ \textrm {kg}\,\textrm {m}^{-1}\,\textrm {s}^{-1}$. Note that the rotational relaxation time of
  $\mathrm {CO}_2$ at standard temperature and pressure is
  $\tau _r=3.8\times 10^{-10}\ \textrm {s}$ (Lambert Reference Lambert1977), therefore the bulk viscosity is
  $\mu _b=6.1\times 10^{-6}\ \textrm {kg}\,\textrm {m}^{-1}\,\textrm {s}^{-1}$, which agrees well with the bulk viscosity extracted from the RBS experiment (Gu et al. Reference Gu, Ubachs and van de Water2014) using the Wu et al. model (3.4). Note that this bulk viscosity only takes into account the contribution from rotational relaxation; it is smaller than that obtained from the acoustic experiment by approximately four orders of magnitude (Lambert Reference Lambert1977; Pan, Shneider & Miles Reference Pan, Shneider and Miles2005).

Figure 9. Same as figure 8, except the experimental data of  $\mathrm {CO}_2$ measured by Gu, Ubachs & van de Water (Reference Gu, Ubachs and van de Water2014) is used here. The
  $y$ parameters corresponding to the pressures 2, 3 and 4 bar are
  $y=1.66$, 2.48 and 3.31, respectively.
4.4. $\mathrm {SF}_6$

The experimental data of Wang et al. (Reference Wang, Yu, Liang, Marques, van de Water and Ubachs2017) for  $\textrm {SF}_6$ molecules recorded at pressures 0.754, 1.002, 2.002, 3, 4 and 5 bar are compared with the Wu et al. model, where the laser wavelength is 403 nm and the scattering angle is
  $89.6^\circ$, so the effective wavelength is
  $L=286\ \textrm {nm}$. With the viscosity data given by Quinones-Cisneros, Huber & Deiters (Reference Quinones-Cisneros, Huber and Deiters2012) we find that the shear viscosity is
  $\mu _s=1.52\times 10^{-5}\ \textrm {kg}\,\textrm {m}^{-1}\,\textrm {s}^{-1}$ and the viscosity index is
  $\omega =0.885$ at temperature 298 K, while the heat conductivity is
  $\kappa =1.30\times 10^{-2} \ \textrm {W}\,\textrm {m}^{-1}\,\textrm {K}^{-1}$. The rotational degrees of freedom is
  $d_r=3$, while from the heat capacity data of Guder & Wagner (Reference Guder and Wagner2009) we have
  $d_v=15.32$. Comparisons between the experimental and theoretical RBS line shapes are shown in figure 10, where the extracted rotational collision numbers are
  $Z=1.85$, 1.81, 1.90, 2.25, 2.64 and 3.31, while the translational Eucken factors are
  $f_{tr}=2.29$, 2.23, 2.10, 2.07, 1.80 and 2.07, at pressures 0.754, 1.002, 2.002, 3, 4 and 5 bar, respectively. It is noted from figure 10(c,d) that the residuals between experimental and theoretical data increase significantly with pressure; it is postulated by Wang et al. (Reference Wang, Yu, Liang, Marques, van de Water and Ubachs2017) that this might be due to the dense gas effect. However, the simulation results based on the Enskog–Vlasov equation, which takes into account the dense gas effect, still produce line shapes that have large deviations from the RBS experimental data, see figure 8 in Bruno & Frezzotti (Reference Bruno and Frezzotti2019). We leave this to future investigation and in the present paper we consider the extracted gas thermodynamic properties for pressure below 3 bar. Taking the average value at pressures of 0.754, 1.002 and 2.002 bars we have
  $f_{tr}=2.21$ and
  $f_{int}=1.28$. The average value for
  $Z$ is
  $1.85$, hence the ratio of bulk to shear viscosities is 0.62. Note that the rotational relaxation time of
  $\mathrm {SF}_6$ at standard temperature and pressure is
  $\tau _r=6\times 10^{-10}\ \textrm {s}$ (Haebel Reference Haebel1968), therefore the viscosity ratio is
  ${\mu _b}/{\mu _s}=0.66$, which agrees with the extracted value from the RBS experiment. Note that again this bulk viscosity only takes into account the contribution from the rotational relaxation of gas molecules.

Figure 10. Same as figure 9, except the experimental data of  $\mathrm {SF}_6$ measured by Wang et al. (Reference Wang, Yu, Liang, Marques, van de Water and Ubachs2017) is used here. The
  $y$ parameters corresponding to the pressures 0.754, 1.002, 2.002, 3, 4 and 5 bar are
  $y=1.22$, 1.64, 3.26, 4.88, 6.49 and 8.14, respectively.
5. Conclusions
We have analysed how an RBS spectrum in the kinetic regime (when the uniformity parameter falls in the region  $1.2\precapprox {}y\precapprox 3.3$) is sensitive to both the bulk viscosity and the translational Eucken factor
  $f_{tr}$ and how the effect of these thermodynamic gas properties can be disentangled and determined separately from experiments. This is because for the very small values of
  $y$, collisions are virtually absent and the RBS spectrum approaches that of a Gaussian (determined by temperature only), while for the very large values of
  $y$, the hydrodynamic regime is entered where only the total thermal conductivity is important. The Wu et al. (Reference Wu, White, Scanlon, Reese and Zhang2015b) model is used to extract the bulk viscosity (due to the rotational relaxation of gas molecules only) and
  $f_{tr}$ from recent RBS experiments of
  $\mathrm {N}_2$,
  $\mathrm {CO}_2$ and
  $\mathrm {SF}_6$. The extracted bulk viscosity agrees well with the measurements from acoustic experiments when only the rotational relaxation is considered. For the extraction of
  $f_{tr}$, our method using the RBS line shapes is unique. This is because historically
  $f_{tr}$ is measured in thermal transpiration flows in the kinetic regime, but this measurement approach is essentially hampered by gas–surface boundary effects; this problem is entirely absent in RBS experiments, since only a local volume inside the gas cell is probed by the laser light.
Although the extracted value of  $f_{tr}$ has no application in hydrodynamic flows where only the total thermal conductivity is important, it will affect the heat transfer and flow patterns in rarefied gas flows, as the rarefaction effects corresponding to the translational and internal motions are different due to the difference between the mean molecular collision time and the rotational/vibrational relaxation time. Thus, when analysing the results of RBS spectral measurements in the context of presented theoretical approach, the RBS experiments provide critical information on translational/internal Eucken factors. This will allow for more reliable simulations of rarefied gas dynamics.
Acknowledgements
This work is supported by the National Natural Science Foundation of China (No. 51876170), the Natural Science Basic Research Plan in Shaanxi Province of China (No. 2019JM-343) and the National Key Research and Development Project of China (No. 2016YFB0200902).
Declaration of interests
The authors report no conflict of interest.


