


1. Introduction
Shallow films of spreading fluid feature in a wide variety of problems in the geosciences and engineering. In a number of settings, the film spreads with little traction over a surface, and the main resistance to flow then stems from the extensional stresses of the material, rather than the vertical shear stresses (which control shallow flow over a no-slip substrate). For thin viscous flow, a common approach is then to exploit the low aspect ratio of the film to develop a free-film model to compactly capture the spreading dynamics (Oron, Davis & Bankoff Reference Oron, Davis and Bankoff1997; Craster & Matar Reference Craster and Matar2009). This type of approach has been exploited to explore, for example, the spreading of oil over a fluid surface (di Pietro & Cox Reference di Pietro and Cox1979; Koch & Koch Reference Koch and Koch1995), and generalized to power-law fluids to describe the motion of ice streams and shelves (MacAyeal & Barcilon Reference MacAyeal and Barcilon1988; MacAyeal Reference MacAyeal1989; Pegler, Lister & Worster Reference Pegler, Lister and Worster2012; Schoof & Hewitt Reference Schoof and Hewitt2013) or the deformation of the Earth's crust (England & McKenzie Reference England and McKenzie1982, Reference England and McKenzie1983). Even when the surface over which the fluid flows would normally satisfy a no-slip condition, the phenomenon of effective slip means that the spreading dynamics becomes more comparable to a free film (Liu, Balmforth & Hormozi Reference Liu, Balmforth and Hormozi2018). Alternatively, the surface can be treated to promote significant sliding of such fluids (Luu & Forterre Reference Luu and Forterre2009, Reference Luu and Forterre2013).
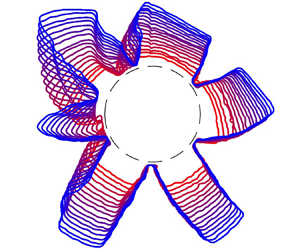
Although experiments with radially spreading free viscous films have suggested that the flow is stable towards non-axisymmetric disturbances (Pegler & Worster Reference Pegler and Worster2012; Sayag & Worster Reference Sayag and Worster2019a), shear-thinning suspensions suffer a dramatic instability (Sayag, Pegler & Worster Reference Sayag, Pegler and Worster2012; Sayag & Worster Reference Sayag and Worster2019a). An illustration of this type of instability is displayed in figure 1. Here, an aqueous suspension of Carbopol is extruded from a vent onto a shallow bath of water. Such suspensions are viscoplastic fluids, possessing both a yield stress and shear-thinning plastic viscosity (Balmforth, Frigaard & Ovarlez Reference Balmforth, Frigaard and Ovarlez2014). The Xanthan gum solutions used by Sayag et al. are more commonly modelled without a yield stress (although one can be measurable at sufficiently high concentration). Despite this, and the much deeper baths over which they floated the Xanthan gum, the fingers seen in figure 1 are strikingly similar to those reported by Sayag et al. and also reported anecdotally in the squeeze flow of pastes and cement (Mascia et al. Reference Mascia, Patel, Rough, Martin and Wilson2006; Roussel, Lanos & Toutou Reference Roussel, Lanos and Toutou2006).

Figure 1. An experiment in which an aqueous suspension of Carbopol (with a density that is almost matched with water) is extruded from a vent onto a launch stage and then into a shallow bath of dyed water, as sketched in (a). The pump rate is  $Q \simeq 10$ ml min
 $^{-1}$, the launch stage has diameter 5 cm and the water depth is approximately 3 mm; a Herschel–Bulkley fit to the Carbopol rheology provided by a rheometer is
  $(n,\tau _Y,K)=(0.41,8.0\ \mathrm {Pa},5.9\ \mathrm {Pa}\ \textrm {s}^n)$. Panels (b–e) show photographs (from above) at the times indicated (the spatial scale is indicated by the diameter of the launch stage). Note, the black circle in the images indicates the vent and the larger circle indicates the edge of the launch stage. In (f) we show snapshots of the outline of the Carbopol, equally spaced,
  ${\rm \Delta} t=6.7$ s, and coloured by time; the dashed circle identifies the launch stage and the inset shows the initial condition from which pumping commenced. In (g) we plot the light intensity transmitted through the dyed water along the cross-sections through each of the six fingers shown in (e). The light intensity corresponding to the water bath is shown by the grey bar. The variation of this intensity along the finger indicates the local depth of water below the finger, with a measurement close to
  $0.5$ suggesting very little water underneath the central parts of the fingers, and the lower values near the stage and flow front implying deeper underlying water.
To rationalize their observations, Sayag & Worster (Reference Sayag and Worster2019b) analysed the linear stability of a radially expanding cylinder of power-law fluid towards two-dimensional, non-axisymmetric perturbations in the inertialess limit (cf. Sayag (Reference Sayag2019) for the stability of extensional flow of a power-law fluid on a sphere). They observed that perturbations could grow exponentially for limited durations of time, provided the fluid was shear thinning. Nevertheless, the experiments feature an expanding fluid film that thins as it flows radially, possessing a fully three-dimensional flow field and stress state, both of which may affect the linear stability. Moreover, although the degree of instability becomes pronounced as the fluid is made more shear thinning, the non-axisymmetric perturbations also decay strongly before and after the interval over which they are unstable, lessening the impact for typical laboratory experiments. In particular, focussing purely on the intervals over which angular modes have a positive instantaneous growth rate can be misleading in comparison to their net amplification (Ball, Balmforth & Dufresne Reference Ball, Balmforth and Dufresne2021a). The fingering patterns in radial extensional flows in both Hele-Shaw cells and shallow films may, in fact, have an entirely different origin: localized fractures forming at the surface of the film, facilitated by changes in the interfacial properties due to the presence of water (Ball et al. Reference Ball, Balmforth and Dufresne2021a,Reference Ball, Balmforth, Morris and Dufresneb).
In view of these concerns, we therefore revisit Sayag and Worster's stability analysis but in the context of three-dimensional, thinning films. Moreover, to generalize the theory to apply to viscoplastic films such as the Carbopol experiments shown in figure 1, we consider a more general constitutive law. In particular we study shallow, spreading films of Herschel–Bulkley fluid. We thereby assess the impact of both the structure of the extensional flow and a yield stress on Sayag and Worster's instability.
In § 2, we formulate the theoretical problem and provide some details of the viscoplastic version of the asymptotic reduction that furnishes a free-film-type model. In § 3, we consider axisymmetric spreading, constructing the base state for the stability analysis conducted in § 4. The base state corresponds to the viscoplastic generalization of the solutions provided by Pegler & Worster (Reference Pegler and Worster2012) for spreading viscous films. Additional details of the analysis of some asymptotic limits are provided in the appendices.
2. Formulation
Consider the spreading of a viscoplastic film that slides without friction over a horizontal surface. The flow is fed by a source located at an inner radius  $r_v$ that delivers a constant flux
  $Q$ with a prescribed depth. A key feature of the flow is that it is shallow, with a typical vertical length scale
  ${\mathcal {H}}$ that is much smaller than a characteristic horizontal (radial) scale
  ${\mathcal {L}}$. We set
  ${\epsilon }={\mathcal {H}}/{\mathcal {L}}\ll 1$ for the typical aspect ratio, and define a characteristic horizontal flow speed,
  ${\mathcal {V}} = Q/({\mathcal {H}}{\mathcal {L}})$. We choose
  ${\mathcal {L}}\equiv r_v$, but leave the vertical length scale
  ${\mathcal {H}}$ free for the moment, demanding only that the incoming flow depth at the vent is of order
  ${\mathcal {H}}$.
In cylindrical polar coordinates,  $(r,{\vartheta },z)$, the governing equations for an incompressible fluid with negligible inertia and velocity field
  $\boldsymbol {u}=(u,v,w)$ are
 \begin{gather} \boldsymbol{\nabla \cdot u} = 0, \end{gather}
 \begin{gather}0 = -\boldsymbol{\nabla} p + \boldsymbol{\nabla}\boldsymbol{\cdot} \boldsymbol{\tau} + \rho {\boldsymbol g}, \end{gather}
where  $\rho$ and
  ${\boldsymbol g}=(0,0,-g)$ are density and gravity, and the deviatoric stress tensor and pressure are
  $\boldsymbol \tau$ and
  $p$. The Herschel–Bulkley constitutive law is
 \begin{equation} \left.\begin{aligned} & \boldsymbol{\dot\gamma} =\boldsymbol{0},\quad \tau<{{\tau_{{Y}}}},\\ & \boldsymbol{\tau} =\left(K{\dot\gamma}^{n-1}+\frac{{{\tau_{{Y}}}}}{\dot\gamma}\right)\boldsymbol{\dot\gamma},\quad \tau\geq {{\tau_{{Y}}}}, \end{aligned}\right\} \end{equation}
where  ${{\tau _{{Y}}}}$,
  $K$ and
  $n$ represent the yield stress, consistency and power-law index. The deformation rates are given by
 \begin{equation} \boldsymbol{\dot{\gamma}}=\begin{pmatrix} 2u_r & r^{-1} (u_{\vartheta}-v)+v_r & u_z+w_r \\ r^{-1} (u_{\vartheta}-v)+v_r & 2(u+v_{\vartheta})/r & v_z+r^{-1}w_{\vartheta} \\ u_z+w_r & v_z+r^{-1}w_{\vartheta} & 2w_z \end{pmatrix}, \end{equation}
and the scalars,  ${\dot \gamma }=\sqrt {{\frac {1}{2}}\sum _\textrm {j,k}\dot \gamma _\textrm {jk}^2}$ and
  $\tau =\sqrt {{\frac {1}{2}}\sum _\textrm {j,k}\tau _\textrm {jk}^2}$, denote tensorial invariants. Above, and hereon, we use subscript to represent partial derivatives, except when referring to tensor components or the yield stress.
At the top surface of the fluid, located by  $z=h(r,{\vartheta },t)$, we have the kinematic and stress conditions,
 \begin{gather} h_t + u h_r + r^{-1} vh_{\vartheta} = w, \end{gather}
 \begin{gather}(\boldsymbol{\tau}-p\boldsymbol{I})\boldsymbol{\cdot} \boldsymbol{\hat{n}} = \boldsymbol{0}, \end{gather}
(ignoring surface tension), where  $\boldsymbol {\hat {n}}$ is the unit normal vector and
  $\boldsymbol {I}$ is the identity matrix. On the underlying surface
  $z=0$, free sliding without penetration demands
  ${\tau _{rz}}=\tau_{z\theta}=w=0$.
2.1. Reduced model
We remove dimensions from the equations by scaling vertical and radial distances by  ${\mathcal {H}}$ and
  ${\mathcal {L}}$, the horizontal velocity components
  $u$ and
  $v$ by
  ${\mathcal {V}}=Q/({\mathcal {H}}{\mathcal {L}})$, the vertical velocity
  $w$ by
  ${\epsilon }{\mathcal {V}}$ and time by
  ${\mathcal {L}}/{\mathcal {V}}$. The stresses and pressure can then be scaled by the hydrostatic pressure
  $\rho g {\mathcal {H}}$. The net effect of these scalings is to replace the gravity term in (2.2) by the unit vertical vector, and make the replacement
  $K{\dot \gamma }^{n-1}+{{\tau _{{Y}}}} {\dot \gamma }^{-1} \to {\dot \gamma }^{n-1}+\textrm {Bi}{\dot \gamma }^{-1}$ in the constitutive law (2.3), where the dimensionless yield stress, or Bingham number, is
 \begin{equation} \textrm{Bi} = \frac{{{\tau_{{Y}}}} {\mathcal{H}}^n{\mathcal{L}}^{2n}}{KQ^n}, \end{equation}
once we make the convenient choice for the vertical length scale,
 \begin{equation} {\mathcal{H}}^{1+n}=\frac{KQ^n}{\rho g{\mathcal{L}}^{2n}}. \end{equation}
 When the dome is able to slide freely, the normal and horizontal shear stresses control the spreading of a shallow fluid layer, with vertical shear stresses remaining relatively weak (MacAyeal & Barcilon Reference MacAyeal and Barcilon1988; MacAyeal Reference MacAyeal1989; Oron et al. Reference Oron, Davis and Bankoff1997; Pegler & Worster Reference Pegler and Worster2012; Balmforth Reference Balmforth2018; Liu et al. Reference Liu, Balmforth and Hormozi2018). The flow becomes plug like throughout its depth, with horizontal velocity components,  $u\sim u(r,{\vartheta },t)+O({\epsilon }^2)$ and
  $v\sim v(r,{\vartheta },t)+O({\epsilon }^2)$. The preceding scalings then ensure that the extensional and horizontal shear stresses counter the pressure gradients in the force balance equations. Also, in view of (2.4), the vertical shear rates
  ${\dot \gamma }_{rz}$ and
  ${\dot \gamma }_{\theta z}$ are
  $O({\epsilon })$ in comparison to the other components of the deformation rate tensor, a discrepancy that carries over to the stress components in view of the constitutive law. We therefore set
  $({\tau _{rz}},{\tau _{z\theta }})={\epsilon }({\tilde \tau _{rz}},{\tilde \tau _{z\theta }})$, reducing the force balance equations to
 \begin{gather} \frac{\partial p}{\partial r} = \frac{1}{r}\frac{\partial}{\partial r}(r{\tau_{rr}})+ \frac{1}{r}\frac{\partial{\tau_{r\theta}}}{\partial {\vartheta}}- \frac{{\tau_{\theta\theta}}}{r} + \frac{\partial{\tilde\tau_{rz}} }{\partial z},\quad \frac{1}{r}\frac{\partial p}{\partial {\vartheta}} =\frac{1}{r^2}\frac{\partial}{\partial r}(r^2{\tau_{r\theta}})+ \frac{1}{r}\frac{\partial{\tau_{\theta\theta}}}{\partial {\vartheta}}+ \frac{\partial{\tilde\tau_{z\theta}} }{\partial z}, \end{gather}
 \begin{gather}\frac{\partial p}{\partial z} + 1 - \frac{\partial{\tau_{zz}}}{\partial z} = O({\epsilon}^2), \end{gather}
along with the surface stress conditions,
 \begin{gather} {\tilde\tau_{rz}}+h_r(p-{\tau_{rr}})-r^{-1}h_{\vartheta} {\tau_{r\theta}} = 0, \end{gather}
 \begin{gather}{\tilde\tau_{z\theta}}-h_r{\tau_{r\theta}}+r^{-1}h_{\vartheta} (p-{\tau_{\theta\theta}}) = 0, \end{gather}
 \begin{gather}p-{\tau_{zz}} = O({\epsilon}^2), \end{gather}
at  $z=h(r,{\vartheta },t)$. Thus,
  $p={\tau _{zz}}+h-z$.
Introducing this pressure solution into (2.9a,b), then integrating these relations and the continuity equation (2.1) over the fluid depth (bearing in mind the plug-like form of the horizontal velocity components, the stress boundary conditions and the surface kinematic condition (2.5)) gives
 \begin{gather} hh_r-\left[h(2{\tau_{rr}}+{\tau_{\theta\theta}})\right]_r - \frac{1}{r}\left(h{\tau_{r\theta}}\right)_{{\vartheta}} + \frac{h}{r}({\tau_{\theta\theta}}-{\tau_{rr}}) = 0, \end{gather}
 \begin{gather}\frac{hh_{{\vartheta}}}{r}-\frac{1}{r}\left[h(2{\tau_{\theta\theta}}+{\tau_{rr}})\right]_{{\vartheta}} -\left(h{\tau_{r\theta}}\right)_{r}-\frac{2}{r}h{\tau_{r\theta}} = 0, \end{gather}
 \begin{gather}h_t+\frac{1}{r}(r hu)_r +\frac{1}{r}\left(vh\right)_{{\vartheta}} = 0, \end{gather}
where, on dropping the vertical shear rates, the leading-order constitutive law implies
 \begin{align} \left.\begin{aligned} & \dot\gamma = 0,\quad \tau<\textrm{Bi},\\ & [{\tau_{rr}},{\tau_{\theta\theta}},{\tau_{r\theta}}] =\left(\frac{\textrm{Bi}}{{\dot\gamma}}+{\dot\gamma}^{n-1}\right) \left[2u_r, \frac{2}{r}(u+v_{{\vartheta}}),\frac{1}{r}(u_{{\vartheta}}-v)+v_r\right],\quad \tau\geq \textrm{Bi}, \end{aligned}\right\} \end{align}
with  ${\dot \gamma }=\sqrt {{\dot \gamma }_{rr}^2+{\dot \gamma }_{r\theta }^2+{\dot \gamma }_{\theta \theta }^2 +{\dot \gamma }_{rr}{\dot \gamma }_{\theta \theta }}$ and
  $\tau =\sqrt {{\tau _{rr}}^2+{\tau _{r\theta }}^2+{\tau _{\theta \theta }}^2+{\tau _{rr}}{\tau _{\theta \theta }}}$.
Finally, we state the radial boundary conditions, which follow conveniently for the reduced model by imposing net force balance at the outer edge and flux balance at the inner edge or vent. The outer edge of the dome is defined as  $r=R({\vartheta },t)$. Here, the radial boundary conditions are
 \begin{gather} R_t+\frac{v}{R}R_{{\vartheta}}=u, \end{gather}
 \begin{gather}\frac{1}{2}h^2-h\left[{\tau_{rr}}+{\tau_{\theta\theta}}+\frac{R}{\sqrt{R^2+R_{{\vartheta}}^2}}\left({\tau_{rr}} -2\frac{R_{{\vartheta}}}{R}{\tau_{r\theta}}+\frac{R_{{\vartheta}}^2}{R^2}{\tau_{\theta\theta}}\right)\right]=0, \end{gather}
 \begin{gather}{\tau_{r\theta}}-\frac{R_{{\vartheta}}}{R}({\tau_{\theta\theta}}-{\tau_{rr}})-\frac{R_{{\vartheta}}^2}{R^2}{\tau_{r\theta}}=0, \end{gather}
where (2.18) is the kinematic condition and (2.19) and (2.20) are the conditions that there is no normal or tangential stress there, respectively. At the inner vent  $r=1$, we impose the incoming flux and depth
 \begin{equation} 2{\rm \pi} H_0u(1,{\vartheta},t)=1, \quad h(1,{\vartheta},t)=H_0, \quad v(1,{\vartheta},t)=0 . \end{equation}
Note that the constant influx conditions in (2.21a–c) demand that fluid must yield at the vent and remain above the yield stress if spreading continues in a nearly axisymmetric fashion at subsequent times. Thus, for our axisymmetric base state and non-axisymmetric linear perturbations, the fluid will not become rigid anywhere during its evolution, with whatever force required to maintain the flux necessarily exerted at the vent. This permits us to ignore the yield condition and consider only the yielded part of the constitutive law in (2.17).
The model in (2.14)–(2.17) amounts to the viscoplastic generalization of models of free (inertialess) viscous films (Oron et al. Reference Oron, Davis and Bankoff1997; Craster & Matar Reference Craster and Matar2009). With  $\textrm {Bi}\to 0$, we recover the power-law fluid model popular for ice shelves (ignoring any buoyancy due to flotation over an underlying ocean) and streams (MacAyeal & Barcilon Reference MacAyeal and Barcilon1988; MacAyeal Reference MacAyeal1989; Pegler et al. Reference Pegler, Lister and Worster2012; Schoof & Hewitt Reference Schoof and Hewitt2013), and similar to that proposed for crustal deformation (England & McKenzie Reference England and McKenzie1982, Reference England and McKenzie1983). The viscoplastic model in (2.14)–(2.17) has been considered previously in exploring the collapse by sliding of axisymmetric or planar reservoirs (Balmforth Reference Balmforth2018; Liu et al. Reference Liu, Balmforth and Hormozi2018).
3. Axisymmetric spreading
From (2.14)–(2.17), axisymmetric spreading states with
 \begin{equation} \left.\begin{aligned} & h = H(r,t),\quad u = U(r,t),\quad v = 0,\quad R = {\bar{R}}(t),\\ & [{\tau_{rr}},{\tau_{r\theta}},{\tau_{\theta\theta}}] = [{T_{rr}}(r,t),{T_{r\theta}}(r,t),{T_{\theta\theta}}(r,t)] \end{aligned}\right\} \end{equation}
satisfy the equations
 \begin{gather} HH_r - \left[H(2{T_{rr}}+{T_{\theta\theta}})\right]_r + \frac{H}{r}({T_{\theta\theta}}-{T_{rr}}) = 0, \end{gather}
 \begin{gather}H_t+\frac{1}{r}(r HU)_r = 0, \end{gather}
 \begin{gather}{[}{T_{rr}},{T_{\theta\theta}}] = \left(\frac{\textrm{Bi}}{{\dot\Gamma}}+{\dot\Gamma}^{n-1}\right) \left[2U_r, \frac{2U}{r}\right],\quad {\dot\Gamma} = 2\sqrt{ U_r^2 + \frac1r UU_r + \frac{1}{r^2} U^2 }, \end{gather}
along with the boundary conditions,
 \begin{align} {\bar{R}}_t = U({\bar{R}},t),\quad \big[\tfrac{1}{2}h^2-h(2{T_{rr}}+{T_{\theta\theta}})\big]_{r={\bar{R}}} = 0, \quad 2{\rm \pi} H_0U(1,t)=1, \quad H(1,t)=H_0. \end{align}
Although the most natural initial condition is to begin without any fluid in the domain  $r>1$ and commence pumping at
  $t=0$, computations of the axisymmetric states and their non-axisymmetric perturbations (§ 4) are eased by beginning with a finite, but narrow, fluid annulus. In particular, for the axisymmetric base states we launch numerical solutions of (3.2)–(3.5a–d) from
  ${\bar {R}}(0) = 1 + 10^{-4}$ and
  $H(r, 0) = H_0$ for
  $1 < r < {\bar {R}}(0)$. These conditions correspond to the solution of the most natural initial-value problem, but beginning from a short time interval after the commencement of pumping (of duration
  $10^{-4}(2{\rm \pi} H_0)$, see § 3.3 and (3.18a,b)).
3.1. Generalized Newtonian limit
As shown by Pegler & Worster (Reference Pegler and Worster2012) and illustrated in figure 2, a freely sliding, Newtonian current converges to steady profile as it expands away from the vent, with the outer edge approaching a constant speed. The steady profile corresponds to a constant-flux, time-independent solution to (3.2)–(3.5a–d), in which we abandon the kinematic condition and instead impose the normal stress condition at a fixed outer radius given by the instantaneous value of  ${\bar {R}}$ (which is also displayed in the figure). The profile is characterized by an adjustment near the vent over which the depth adjusts from the value set at the vent to that for the
  $H_0-$independent solution,
 \begin{equation} H\sim r^{-1}\sqrt{3/{\rm \pi}},\quad U\sim (2{\rm \pi})^{-1}\sqrt{{\rm \pi}/3}, \end{equation}
which satisfies (3.2)–(3.5a–d) but for the stress condition at the outer edge. In the solutions of the initial-value problem, the stress condition forces a departure from (3.6a,b) over a region near the outer edge, where the solution remains time dependent and given by a local similarity solution of the form  $U={\mathcal {U}}(\zeta )$,
  $H=t^{-1}F(\zeta )$ and
  $\zeta \propto r/t$ (cf. Pegler & Worster (Reference Pegler and Worster2012); appendix A.1). The outer edge is
 \begin{equation} {\bar{R}}\sim 1+\varLambda t, \quad \varLambda\approx0.173, \end{equation}
which is compared with the numerical solutions of the initial-value problem in figure 2.

Figure 2. Sample Newtonian solutions ( $n=1$,
  $\textrm {Bi}=0$), showing snapshots of (a)
  $H(r,t)$ and (b)
  $U(r,t)$, and time series of (c)
  ${\bar {R}}(t)$ and (d)
  $H_{min}(t)=H({\bar {R}},t)$ for
  $H_0=0.5$, 1 and 2, with colour representing time (from green, grey or red to blue, respectively). The times of the snapshots are indicated in (c,d). The insets in (a,b) show the corresponding, true, steady solutions with a fixed outer radius given by that of the final solutions to the initial-value problem. The dots in the insets show (3.6a,b). Also included in (c,d) are the results for the solutions for power-law fluid shown in figure 3. The dots in (c) show the predictions in (3.7a,b) and (3.10); in (d), the dots show
  $4t^{-1}$ and
  $0.8t^{-0.4}$.
This Newtonian behaviour generalizes to the case of a power-law fluid ( $n\ne 1$ and
  $\textrm {Bi}=0$): as illustrated in figure 3, the sliding current again converges to a steady profile except near the outer edge. The steady,
  $H_0-$independent, constant-flux solution generalizing (3.6a,b) is
 \begin{equation} H\sim \tilde{H}_0r^{-2n/(n+1)},\quad U\sim (2{\rm \pi}\tilde{H}_0)^{-1} r^{-(1-n)/(n+1)}, \end{equation}
with
 \begin{equation} \tilde{H}_0 = \left[\frac{ (3n^2+1)^{({1}/{2})(n-1)} (6n^2-n+1)} {n(n+1)^n{\rm \pi}^n}\right]^{{1}/{(n+1)}}. \end{equation}
The time-dependent region bordering the outer edge now has the self-similar form,  $H=t^{-n}F(\zeta )$,
  $U=t^{-({1}/{2})(1-n)}{\mathcal {U}}(\zeta )$ and
  $\zeta \propto r t^{-({1}/{2})(1+n)}$, which is explored in more detail in appendix A.1. The self-similar form indicates that the fluid depth at the outer edge is
  $H(R,t)\propto t^{-n}$, as seen in figure 2(d) (for the Newtonian case, Pegler and Worster established
  $H(R,t)\sim 4t^{-1}$). The radial expansion of the outer edge is given by
 \begin{equation} {\bar{R}}\sim 1+ \varLambda t^{({1}/{2})(1+n)}, \end{equation}
where  $\varLambda$ depends on
  $n$; for
  $n=0.4$,
  $\varLambda =0.328$ which is again compared with the numerical solutions in figure 3. A more detailed illustration of the approach of the solutions to the self-similar form with
  $n=1$ and
  $n=0.4$ is shown in figure 4. Here, we plot the numerical solutions of the initial-value problem for different initial conditions in terms of the similarity variables.

Figure 3. Solutions for power-law fluid ( $n=0.4$,
  $\textrm {Bi}=0$), showing snapshots of (a)
  $H(r,t)$ and (b)
  $U(r,t)$, for
  $H_0=1$,
  $1.5$ and 2, with colour representing time (from green, grey or red to blue, respectively). The time series of
  ${\bar {R}}(t)$ for these solutions is included in figure 2(c), as well as the times of the snapshots. The insets show the corresponding, true, steady solutions with a fixed outer radius given by that of the final solutions to the initial-value problem. The dots show (3.8a,b) and (3.10).

Figure 4. A comparison of numerical solutions of the initial-value problem (solid lines) with self-similar solutions (dots) for (a) Newtonian ( $n=1,\ \textrm {Bi}=0$) with
  $H_0=0.5, 1$ and 2, and (b) power-law fluid (
 $n=0.4,\ \textrm {Bi}=0$) with
  $H_0=1,\ 1.5$ and 2. Plotted are the scaled variables
  $t^{({1}/{2})(1-n)} (r/{\bar {R}})^{-(1-n)/(n+1)} U\equiv \zeta ^{-(1-n)/(n+1)}{\mathcal {U}}(\zeta )$ and
  $t^n (r/{\bar {R}})^{2n/(n+1)} H \equiv \zeta ^{2n/(n+1)}F(\zeta )$ against
  $\zeta \equiv r/{\bar {R}}(t)$ every 100 time units. The two panels present the initial-value problem solutions shown in figures 2 and 3, with colour again representing time (from green, grey or red to blue, as indicated by the arrows), and omitting the earliest snapshot in each computation.
The convergence of the steady states to (3.6a,b) or (3.8a,b) therefore guarantees that the initial depth  $H_0$ has little impact on the evolution, and the self-similar structure at the edge permits the current to become steady behind the flow front. At late times, the self-similar structure occupies the bulk of the current. By contrast, as we see below, because the rates of extension decay with radius, the effect of the yield stress gradually amplifies towards the outer edge when
  $\textrm {Bi}\ne 0$. This prevents any approach to such a steady profile, qualitatively changing the spreading dynamics and introducing a different self-similar late-time structure.
3.2. Sample numerical solutions
Figure 5 displays a numerical solution to (3.2)–(3.5a–d) for  $n=0.4$ and
  $\textrm {Bi}=H_0=1$. For this viscoplastic material, the fluid initially expands outwards at constant speed, but the advance then slows, damming up the flow and causing the dome to deepen near the vent. The dynamics is therefore different to that for a Newtonian or power-law fluid (
 $\textrm {Bi}=0$). In particular, the expansion of the viscoplastic dome slows towards the weaker advance
  ${\bar {R}}\propto t^{1/2}$ over long times, and the dome continues to thicken at the vent and thin at the outer edge.

Figure 5. Sample solution for  $n=0.4$ and
  $\textrm {Bi}=H_0=1$, showing snapshots of (a)
  $H(r,t)$ and (b)
  $U(r,t)$, and time series of (c)
  ${\bar {R}}(t)-1$ and (d)
  $H_{max}(t)$ (solid) and
  $H_{min}(t)$ (dashed). The stars in (c,d) indicate the times of the snapshots in (a,b). Slopes of unity and
  ${{\frac {1}{2}}}$ are indicated in (c).
As shown in figure 6, varying the depth at the vent,  $H_0$, alters the solution at earlier times, delaying the build up of material nearby. However, the solutions with different
  $H_0$ subsequently converge to similar forms over longer times and larger radii. Thus, aside from a thin region near the vent, the solutions again become insensitive to
  $H_0$.

Figure 6. Sample snapshots of  $H(r,t)$ for
  $n=0.4$ and
  $\textrm {Bi}=1$ for varying
  $H_0$. The inset shows the time series of
  ${\bar {R}}(t)$.
The viscoplastic evolution over even longer times is illustrated in figure 7 (for  $n=\textrm {Bi}=1$). This example shows more clearly the convergence of the outer radius to
  ${\bar {R}}\sim \varLambda \sqrt {t/\textrm {Bi}}$, for a constant
  $\varLambda \approx {{\frac {1}{2}}}$ and dependence on
  $\textrm {Bi}$ that is rationalized below. We further plot snapshots of the solution against the scaled radial coordinate
  $\zeta =r/{\bar {R}}(t)$ and scale the horizontal flow speed
  $U(r,t)$ by
  $\varLambda \sqrt {t\textrm {Bi}}$. The rescalings emphasize how the solution converges to a self-similar form in which
  $H\sim \textrm {Bi} F(\zeta )$ and
  $U\sim \varLambda {\mathcal {U}}(\zeta )/\sqrt {t\textrm {Bi}}$, with
  $\zeta =r\sqrt {\textrm {Bi}/t}/\varLambda$. Such self-similar solutions arise because the decline of the strain rates over long times paves the way to a plastic limit of the problem in (2.14)–(2.21a–c). This limit is analysed in more detail in § 3.4, which provides a direct construction of the self-similar states. That corresponding to the long-time limit of the solution of the initial-value problem in figure 7 is also included there for comparison.

Figure 7. Numerical solution for  $n=\textrm {Bi}=H_0=1$, showing snapshots of (a)
  $H(r,t)/\textrm {Bi}$ and (b)
  $U(r,t)\sqrt {t\textrm {Bi}}/\varLambda$ every 100 time units, plotted against
  $r/{\bar {R}}(t)$, with
  $\varLambda \approx {{\frac {1}{2}}}$. The dots and darker (blue) line show the self-similar solution of § 3.4 with
  ${\varepsilon }\ll 1$. In (c,d), we plot times series of
  ${\bar {R}}(t)$,
  $H_{max}(t)$ (solid) and
  $H_{min}(t)$ (dashed). The dashed line in (c) shows
  ${\bar {R}}=\varLambda \sqrt {t/\textrm {Bi}}$, and the initial linear scaling is indicated. In (e,f), solutions with
  $H_0=1$, 2, 4, 6, 8 and 12 are plotted at the times indicated and again compared with the similarity solution; time series of the edge
  ${\bar {R}}(t)$ for the solutions with
  $H_0>1$ are included in (c) as the lighter grey lines, and (d) includes
  $H_{max}(t)$ and
  $H_{min}(t)$ for
  $H_0=2$ and 4.
3.3. Early-time solution,  $t \ll 1$

For small times, we set  $r=1+\delta x$ and
  $t=\delta {\hat {t}}$, where
  $\delta \ll 1$ and
  $x$ and
  ${\hat {t}}$ are
  $O(1)$. In this limit, the variables remain close to their values at vent and so
 \begin{equation} H = H_0 + \delta H_1(x,{\hat{t}}),\quad U = (2{\rm \pi} H_0)^{-1} + \delta U_1(x,{\hat{t}}),\quad {\bar{R}} = 1 + \delta {\bar{R}}_1({\hat{t}}). \end{equation}
At leading order, (3.2) and (3.4a,b) become
 \begin{gather} \frac{\partial}{\partial x}\left[\frac{1}{2}H_0^2-H_0(2{T_{rr}}+ {T_{\theta\theta}})\right] = 0, \end{gather}
 \begin{gather}({T_{rr}},{T_{\theta\theta}})= \left(\frac{\textrm{Bi}}{{\dot\Gamma}}+{\dot\Gamma}^{n-1}\right) \left(2U_{1x}, \frac{1}{{\rm \pi} H_0}\right),\quad {\dot\Gamma} = \sqrt{\left(2U_{1x}+\frac{1}{2{\rm \pi} H_0}\right)^2 + \frac{3}{4{\rm \pi}^2 H_0^2}}. \end{gather}
In view of the stress conditions at the edge, we therefore have
 \begin{equation} \frac{1}{4}H_0{\dot\Gamma}= (\textrm{Bi}+{\dot\Gamma}^n)\sqrt{{\dot\Gamma}^2-\frac{3}{4{\rm \pi}^2 H_0^2}},\quad U_{1x} = \frac12\sqrt{{\dot\Gamma}^2-\frac{3}{4{\rm \pi}^2 H_0^2}} - \frac{1}{4{\rm \pi} H_0}. \end{equation}
That is,  $U_{1x}$ is constant, and so
 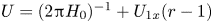 $U=(2{\rm \pi} H_0)^{-1} + U_{1x}(r-1)$ in terms of the original variables. For
  $\textrm {Bi}\gg 1$, we arrive at the limit,
 \begin{equation} {\dot\Gamma}\to\frac{\sqrt3}{2{\rm \pi} H_0},\quad U_{1x} \to - \frac{1}{4{\rm \pi} H_0}, \end{equation}
whereas for a Newtonian fluid,
 \begin{equation} {\dot\Gamma} \to \frac{1}{4{\rm \pi} H_0}\sqrt{12+{\rm \pi}^2 H_0^4},\quad U_{1x} \to \frac{{\rm \pi} H_0^2-2}{8{\rm \pi} H_0}. \end{equation}
Hence,  $U$ always decreases away from the vent in the plastic limit, but more generally it may increase for a sufficiently deep inflow.
Continuing on, the mass conservation and kinematic conditions become
 \begin{equation} H_{1{\hat{t}}} + H_0 U_{1x}+\frac{H_{1x}}{2{\rm \pi} H_0} +\frac{1}{2{\rm \pi}}= 0 \quad \textrm{and}\quad {\bar{R}}_{1{\hat{t}}} = (2{\rm \pi} H_0)^{-1}. \end{equation}
The first can be solved using the method of characteristics, noting that  $H_1=0$ for
  $x=0$. In terms of the original variables, we find
 \begin{equation} H = H_0 - H_0(1+2{\rm \pi} H_0 U_{1x}) (r-1)\quad \textrm{and} \quad {\bar{R}} = 1+(2{\rm \pi} H_0)^{-1} t. \end{equation}
3.4. Plastic similarity solution in the long-time limit
In the plastic limit,  ${\dot \Gamma }\to 0$, the system (2.14)–(2.21a–c) admits a similarity solution described by
 \begin{equation} \left.\begin{aligned} & \zeta \equiv \frac{\textrm{Bi}^{1/2}r}{\varLambda t^{1/2}}, \quad F(\zeta)\equiv \frac{H}{\textrm{Bi}},\quad {\mathcal{U}}(\zeta)\equiv \varLambda^{-1}(t\textrm{Bi})^{1/2}U,\\ & [{{\mathcal{T}}_{rr}}(\zeta),{{\mathcal{T}}_{\theta\theta}}(\zeta)] \equiv \textrm{Bi}^{-1}[{T_{rr}},{T_{\theta\theta}}], \end{aligned}\right\} \end{equation}
and satisfying
 \begin{gather} 0=FF_{\eta}-\left[F(2{{\mathcal{T}}_{rr}}+{{\mathcal{T}}_{\theta\theta}})\right]_{\zeta}+({{\mathcal{T}}_{\theta\theta}}-{{\mathcal{T}}_{rr}})\frac{F}{\zeta}, \end{gather}
 \begin{gather}({{\mathcal{T}}_{rr}},{{\mathcal{T}}_{\theta\theta}}) = \left({\mathcal{U}}_{\zeta}^2 + \frac{1}{\zeta}{\mathcal{U}}{\mathcal{U}}_{\zeta} + \frac{1}{\zeta^2}{\mathcal{U}}^2\right)^{-({1}/{2})} \left({\mathcal{U}}_{\zeta},\frac{{\mathcal{U}}}{\zeta}\right), \end{gather}
 \begin{gather}\tfrac{1}{2}\zeta^2F_{\zeta}=\left(\zeta {\mathcal{U}} F\right)_{\zeta}, \end{gather}
subject to
 \begin{equation} {\mathcal{U}}(1)=\tfrac{1}{2} \quad \mathrm{and} \quad \big[\tfrac{1}{2}F^2-F(2{{\mathcal{T}}_{rr}}+{{\mathcal{T}}_{\theta\theta}})\big]_{\zeta=1}=0 \end{equation}
at the edge of the dome,  $\zeta =1$ or
  ${\bar {R}}=\varLambda \sqrt {t/\textrm {Bi}}$, and
 \begin{equation} 2{\rm \pi} \zeta F_0 {\mathcal{U}} \varLambda^2 = 1 \quad \textrm{and} \quad F = F_0\equiv \frac{H_0}{\textrm{Bi}} \end{equation}
at the vent.
Awkwardly, in the initial-value problem, the vent is located at  $\zeta = {\varepsilon } = \varLambda ^{-1} \sqrt {\textrm {Bi}/t}$, which shrinks constantly in time. We can only therefore expect convergence to the self-similar solution of (3.20)–(3.23a,b) if that solution becomes independent of
  ${\varepsilon }$ for
  ${\varepsilon }\to 0$. Alternatively, one can adjust the initial-value problem and apply the inner boundary condition on a vent with radius,
  $r=\varLambda {\varepsilon }\sqrt {t/\textrm {Bi}}$, to permit an exact similarity solution.
An analysis of the singular point at the edge  $\zeta =1$ indicates that
 \begin{equation} \left.\begin{array}{c@{}} F \\ {\mathcal{U}} \end{array}\right\} \to \left\{\begin{array}{@{}c} A(1-\zeta)^{1/3} \\ {{\tfrac{1}{2}}}+{\tfrac{1}{4}}(1-\zeta) \end{array}\right.\quad \textrm{for}\ \zeta\to1, \end{equation}
for some constant  $A$. Rather than employing the inner boundary conditions in (3.24a,b), one can therefore fix
  $A$ and solve (3.20)–(3.23a,b) as a shooting problem, integrating from a point close to the outer edge into the inner edge at
  $\zeta ={\varepsilon }$. On arrival, one then determines the value of
  $F_0$ corresponding to that choice of
  $A$. In practice, this procedure provides solutions only for larger values of
  ${\varepsilon }$, as the integration becomes relatively stiff for
  $\zeta \to 0$. Instead, one can then switch to solving (3.20)–(3.23a,b) as a boundary-value problem, using the shooting solution as an initial guess. Sample solutions and their behaviour are illustrated in figure 8. Evidently, the bulk of the solution is insensitive to the choices of both
  $F_0$ and
  ${\varepsilon }$.

Figure 8. Similarity solutions solved (a,b) by shooting for five values of  $A$ over the range
  $[1.0112,1.0465]$, and (c,d) as boundary-value problems for varying
  ${\varepsilon }$ at fixed
  $F_0=8.57$ (darker blue) and varying
  $F_0$ for fixed
  ${\varepsilon }=0.00625$ (lighter grey). The blue dots in (c,d) show the shooting solution used to initiate the boundary-value computations. The red dashed and dotted lines indicate the approximations shown by the legends (with
  $A=1$), as given in (3.25) and (3.26a,b). In (e,f), solutions are continued to still smaller
  ${\varepsilon }$ (as indicated by the stars) using the alternative inner boundary condition
  $F({\varepsilon })=-\sqrt 3\log {\varepsilon }$. The dashed line in (f) shows the limiting solution expected for
  $\zeta \ll 1$ (appendix B.1) with a pre-factor chosen to be
  $c=0.4$.
Note that  $2{{\mathcal {T}}_{rr}}+{{\mathcal {T}}_{\theta \theta }}\ll 1$ throughout the interval in
  $\zeta$, leading to the simple approximations,
 \begin{equation} F \sim -\sqrt3\log\zeta \quad \textrm{and}\quad {\mathcal{U}} \sim {{\tfrac{1}{2}}}\zeta^{-({1}/{2})} \end{equation}
(see appendix B.1), the first of which can be bridged to the limit for  $\zeta \to 1$ by the interpolant,
 \begin{equation} F \sim -[\sqrt3-A+A(1-\zeta)^{-2/3}]\log\zeta. \end{equation}
Also, the approximation for  $F(\zeta )$ in (3.26a,b) permits one to construct solutions for arbitrarily small
  ${\varepsilon }$ by employing the alternative boundary condition
  $F({\varepsilon })=-\sqrt 3\log {\varepsilon }$, in place of
  $F({\varepsilon })=F_0$. This alternative construction takes advantage of the limiting form of the solution for
  ${\varepsilon }\to 0$, namely
  $F \propto -\log \zeta$ and
  ${\mathcal {U}} \propto -(\zeta \log \zeta )^{-1}$ (see figure 7(f) and appendix B.1). The logarithmic growth of the fluid depth for
  $\zeta \to 0$ corresponds to the piling up of material close to the vent in figure 7.
Finally, turning to the inner flux condition in (3.24a,b), we observe that
 \begin{equation} \varLambda = [2{\rm \pi} {\varepsilon} F({\varepsilon}) {\mathcal{U}}({\varepsilon})]^{-({1}/{2})}\to 0.4897\quad \textrm{for}\ {\varepsilon}\to0,\end{equation}
in view of the numerical solutions in figure 8(c). Thus, despite the corresponding logarithmic divergence of the fluid depth as  $\zeta \to 0$, the solution does become independent of the vent radius.
4. Stability analysis
To study non-axisymmetric perturbations to the base flows of § 3, we set
 \begin{gather} h = H(r,t)+\hat h(r,t)\,\textrm{e}^{\textrm{i}m{\vartheta}}, \quad u = U(r,t)+\hat u(r,t)\,\textrm{e}^{\textrm{i}m{\vartheta}}, \end{gather}
 \begin{gather}v = \hat v(r,t)\,\textrm{e}^{\textrm{i}m{\vartheta}}, \quad R = {\bar{R}}(t) +\hat R(t)\,\textrm{e}^{\textrm{i}m{\vartheta}}, \end{gather}
where  $m$ is the angular wavenumber. Linearizing the force balance and continuity equations (2.14)–(2.16), we find the amplitudes
  $\{\hat h,\hat u,\hat v,\hat R\}$ satisfy
 \begin{gather} 0 = [H(\hat{h}-2{\hat{\tau}_{rr}}-{\hat{\tau}_{\theta\theta}})-\hat{h}(2{T_{rr}}+{T_{\theta\theta}})]_r -\frac{{\rm i}m}{r}H{\hat{\tau}_{r\theta}}+\frac{H}{r}({\hat{\tau}_{\theta\theta}}-{\hat{\tau}_{rr}}) +\frac{\hat{h}}{r}({T_{\theta\theta}}-{T_{rr}}), \end{gather}
 \begin{gather}0 = \frac{1}{r} (r^2H{\hat{\tau}_{r\theta}})_r - \textrm{i}m[H(\hat{h}-2{\hat{\tau}_{\theta\theta}}-{\hat{\tau}_{rr}})-\hat{h}(2{T_{\theta\theta}}+{T_{rr}})] , \end{gather}
 \begin{gather}\hat{h}_t + \frac{1}{r}[r(U\hat{h}+H\hat{u})]_r + \frac{\textrm{i}m}{r}H\hat{v} = 0, \end{gather}
where the perturbations to the stress components are given by
 \begin{gather} {\hat{\tau}_{rr}} = {\alpha_{rr}} \hat{u}_r+ \frac{1}{r}{\beta_{rr}} (\hat{u}+\textrm{i}m\hat{v}),\quad {\hat{\tau}_{\theta\theta}} ={\alpha_{\theta\theta}} \hat{u}_r+ \frac{1}{r}{\beta_{\theta\theta}} (\hat{u}+\textrm{i}m\hat{v}), \end{gather}
 \begin{gather}{\hat{\tau}_{r\theta}} = \mu\left[r\frac{\partial}{\partial r}\left(\frac{\hat{v}}{r}\right)+\frac{{\rm i}m}{r}\hat{u} \right], \end{gather}
with
 \begin{gather} {\alpha_{rr}} = 2\left[\mu+4\mu'U_r\left(2U_r+\frac{1}{r}U\right)\right],\quad {\beta_{rr}} = 8\mu'U_r\left(\frac{2}{r}U+U_r\right), \end{gather}
 \begin{gather}{\alpha_{\theta\theta}}=\frac{8}{r}\mu'U\left(2U_r+\frac{1}{r}U\right),\quad {\beta_{\theta\theta}}=2\left[\mu+\frac{4}{r}\mu' U\left(\frac{2}{r}U+U_r\right)\right], \end{gather}
 \begin{gather}\mu = \frac{1}{{\dot\Gamma}}(\textrm{Bi}+{\dot\Gamma}^{n}),\quad \mu' = -\frac{1}{2{\dot\Gamma}^3}[\textrm{Bi}+(1-n){\dot\Gamma}^{n}]. \end{gather}
The outer boundary conditions, after a Taylor expansion about the unperturbed edge, are
 \begin{equation} \left.\begin{array}{l@{}} \hat{R}_t = U_r\hat{R}+\hat{u} \\ H(\hat{h}-2{\hat{\tau}_{rr}}-{\hat{\tau}_{\theta\theta}}) -\hat{h}(2{T_{rr}}+{T_{\theta\theta}})\\ \quad + \ \big[{{\tfrac{1}{2}}} H^2-H(2{T_{rr}}+{T_{\theta\theta}})\big]_r\hat{R}=0 \\ {\hat{\tau}_{r\theta}}- {\rm i}m \hat{R}({T_{\theta\theta}}-{T_{rr}})/{\bar{R}}=0 \end{array}\right\} \quad \textrm{at}\ r={\bar{R}}. \end{equation}
At the vent we demand
 \begin{equation} \hat{u}=\hat{h}=\hat{v}=0 \quad \mathrm{at}\ r=1. \end{equation}
These equations can be solved numerically as an initial-value problem. Alternatively, once the base states have converged to self-similar form (power law or plastic), the corresponding solutions are independent of time once expressed in terms of the similarity coordinates. This permits one to reduce the relevant linear stability analysis to a conventional eigenvalue problem via the coordinate change described in appendices A.2 and B.2. Before heading down either route, we first consider the early-time limit in which this stability problem simplifies substantially and becomes analytically solvable (cf. Sayag & Worster Reference Sayag and Worster2019b).
4.1. Early times, $t \ll 1$

For the early-time solution derived in § 3.3, the coefficients in (4.3)–(4.7) become constant to leading order in the small parameter  $\delta$. Moreover, assuming that
  $M=m\delta =O(1)$ and the perturbation amplitudes all remain of comparable order, the leading-order terms in the force-balance equations (4.3)–(4.4) are those with the highest radial and angular derivatives. Thus,
 \begin{align} \left.\begin{aligned} 0 = (2{\hat{\tau}_{rr}}+{\hat{\tau}_{\theta\theta}})_x + \textrm{i}M {\hat{\tau}_{r\theta}} = (2{\alpha_{rr}}+{\alpha_{\theta\theta}})\hat{u}_{xx} + \textrm{i}M (\mu+2{\beta_{rr}}+{\beta_{\theta\theta}})\hat{v}_x - M^2 \mu\hat{u},\\ 0 = ({\hat{\tau}_{r\theta}})_x + \textrm{i}m(2{\hat{\tau}_{\theta\theta}}+{\hat{\tau}_{rr}}) = \mu \hat{v}_{xx} + \textrm{i}M (\mu+{\alpha_{rr}}+2{\alpha_{\theta\theta}})\hat{u}_x - M^2 ({\beta_{rr}}+2{\beta_{\theta\theta}}) \hat{v}, \end{aligned}\right\} \end{align}
where the coefficients are given by the early-time limits of (4.8a,b)–(4.10a,b) (with  $U/r\to (2{\rm \pi} H_0)^{-1}$,
  $U_r\to U_{1x}$ and the stress components and
  ${\dot \Gamma }$ given by (3.13a,b)–(3.14a,b)). These two relations can be combined into
 \begin{equation} 0=\hat{u}_{xxxx}+\varSigma M^2\hat{u}_{xx}+\varGamma M^4\hat{u}, \end{equation}
with
 \begin{align} \varSigma = \frac{3({\beta_{rr}}{\alpha_{\theta\theta}}-{\alpha_{rr}}{\beta_{\theta\theta}})+\mu(2{\alpha_{\theta\theta}}+{\alpha_{rr}}+2{\beta_{rr}}+{\beta_{\theta\theta}})}{\mu(2{\alpha_{rr}}+{\alpha_{\theta\theta}})},\quad \varGamma=\frac{2{\beta_{\theta\theta}}+{\beta_{rr}}}{2{\alpha_{rr}}+{\alpha_{\theta\theta}}}. \end{align}
Similarly, the boundary conditions become
 \begin{equation} \hat{u}=0,\quad \hat{v}=0 \quad \mathrm{at}\ x=0, \end{equation}
and
 \begin{equation} \left. \begin{array}{l@{}} (2{\alpha_{rr}}+\alpha_{\theta\theta})\hat{u}_x +(2{\beta_{rr}}+\beta_{\theta\theta})\textrm{i}M\hat{v} = 0 \\ \mu(\hat{v}_x+\textrm{i}M\hat{u})-\textrm{i}M\hat{R}({T_{\theta\theta}}-{T_{rr}}) = 0 \end{array}\right\}\quad \mathrm{at}\ x=X \equiv (2{\rm \pi} H_0)^{-1}\hat{t}. \end{equation}
This system is closed, with the time dependence entering through the motion of the outer edge,  $\hat {R}_{\hat {t}} = \delta [ U_{1x} \hat {R} + \hat {u}(X,{\hat {t}}) ]$, and the depth perturbation following separately from (4.5).
We may therefore solve (4.14) subject to (4.16a,b) and (4.17), and then determine the instantaneous growth rate, which we express in terms of the original variables,
 \begin{equation} G(t) =\hat{R}^{-1}\hat{R}_t = U_{1x} + \hat{R}^{-1} \hat{u}({\bar{R}},t) . \end{equation}
Despite this rewrite, the growth rate on the  ${\hat {t}}-$time scale is evidently of
  $O(\delta )$, and so perturbations are predicted to grow far less quickly than the rate of expansion of the base state (
 $X=\delta ^{-1}({\bar {R}}-1)=(2{\rm \pi} H_0)^{-1} {\hat {t}}$). Also, because depth perturbations decouple from the force balance in this limit (and
  $H=H_0$), the situation is similar to the two-dimensional extensional flow problem considered by Sayag & Worster (Reference Sayag and Worster2019b) (the viscoplastic version of which is explored further by Ball et al. Reference Ball, Balmforth and Dufresne2021a). The two problems are not, however, equivalent because, for the sliding shallow current, the radial flow field is not the same as that for a two-dimensional incompressible fluid (with
  $U\propto r^{-1}$) and the stress state is fully three-dimensional with
  ${\tau _{\theta \theta }}\ne -{\tau _{rr}}$. We investigate the impact of both features on the stability characteristics below.
Irrespective of the rheology, the perturbation amplitude  $\hat {u}\to 0$ for
  $MX=m({\bar {R}}-1)\to 0$, and so the instantaneous growth rate
  $G \to U_{1x} \equiv U_r(1)$ for the lower angular wavenumbers. This term corresponds to the geometrical spreading contribution discussed by Sayag & Worster (Reference Sayag and Worster2019b), which is always equal to
  $-1$ in their incompressible two-dimensional problem. Here, in contrast,
  $U_{1x}$ can become positive for sufficiently large
  $H_0$ (see figure 9) owing to the thinning of the base state as the fluid leaves the vent when the inflow is relatively deep (cf. figure 2). In such cases, the base state is therefore unstable at early times.

Figure 9. Instantaneous growth rates  $G(t)$ as functions of
  $\textrm {Bi}$ and
  $MX=m({\bar {R}}-1)$ for (a)
  $H_0=\frac {2}{3}$ and (b)
  $H_0=\frac {4}{3}$, with
  $n=1$. The blue curves highlight the contour
  $G=0$. In (c,d), we plot the limiting growth rates
  $G_0=U_{1x}$ and
  $G_\infty =\lim _{M\to \infty }(G)$ against
  $\textrm {Bi}$ for
  $n=0.25$,
  $0.4$,
  $0.6$,
  $0.8$ and 1, with the values of
  $H_0$ indicated.
In the Newtonian limit,  $\varSigma \to -2$ and
  $\varGamma \to 1$, leading to
 \begin{align} G(t)=\frac{{\rm \pi} H_0^2-2}{8{\rm \pi} H_0}+ \frac{(6-{\rm \pi} H_0^2)}{8{\rm \pi} H_0} \frac{9(MX)^2-5\sinh^2(MX)}{9(MX)^2+1+15\cosh^2(MX)},\quad MX \equiv m({\bar{R}}-1).\end{align}
The first term corresponds to  $U_{1x}$ and controls the growth if
  $MX\to 0$; for
  $MX\gg 1$, on the other hand,
  $G\to ({\rm \pi} H_0^2-3)/(6{\rm \pi} H_0)$. All wavenumbers become unstable if
  $H_0>\sqrt {3/{\rm \pi} }$.
In the plastic limit,  $\textrm {Bi} \gg 1$, we find
  $\varSigma =1$ and
  $\varGamma ={\frac {1}{4}}$, giving an instantaneous growth rate,
 \begin{equation} G = - \frac{1}{16{\rm \pi} H_0}[1 + 3\cos( m\sqrt{2}({\bar{R}}-1))]. \end{equation}
In this case,  $U_{1x}<0$ and so instability can only appear when
  $MX$ is not small. In fact, although
  $G(t)$ is sometimes positive, there is no net growth, with the average decay rate of
  $(8{\rm \pi} H_0)^{-1}$. Thus, the spreading shallow plastic current is initially more stable than two-dimensional plastic extensional flow as a result of its different stress state and rate of extension.
Instantaneous growth rates away from either of these limits are shown in figure 9. Although  $G$ always oscillates in the plastic limit, the instantaneous growth rate eventually reaches a limit
  $G_\infty$ for
  $MX\to \infty$ for any finite
  $\textrm {Bi}$, defining a time-independent growth rate that is independent of
  $m$. This limit is also plotted in figure 9(c) for several values of
  $n$ and
  $H_0$.
At early times, the spreading flow is therefore unstable to non-axisymmetric perturbations provided the inflow is sufficiently deep and the yield stress is not too large. However, the growth rate is small ( $O(\delta )$ on the time scale at which the relatively narrow annulus expands), and so the fluid is expected to spread beyond the small-time regime before there is much exponential growth. We demonstrate this feature explicitly below in § 4.2 on numerical solving of the full initial-value problem.
4.2. Numerical results
To proceed beyond the limit of a relatively narrow annulus, we solve the linear stability equations numerically beginning with the initial conditions,  $\hat {R}(0) = 1$ and
  $\hat {h}(r,0)=0$ for
  $1 < r < {\bar {R}}(0)=1+10^{-4}$. These initial conditions are arguably the most straightforward, corresponding to launching a non-axisymmetric perturbation with angular wavenumber
  $m$ on top of the axisymmetric base state by modifying the position of the outer edge without any associated changes in local depth (as the stability problem is linear, the initial amplitude may be scaled to unity). Indeed, the analysis of § 4.1 demonstrates that local depth perturbations decouple from the primary instability at early times, suggesting that any
  $\hat {h}(r,0) \ne 0$ is insignificant.
Figure 10 displays solutions for Newtonian fluid with three values of  $m$ and
  $H_0$. For the entrance depths chosen (
 $H_0=1$, 3 and 5), the stability theory for early times predicts exponentially growing instabilities at early times (
 ${\rm \pi} H_0^2>2$). For wavenumbers of
  $m=2$ and 10, the instantaneous growth rate
  $G=G_0=U_{1x}$ for
  $MX\ll 1$ characterizes the amplification until the base state has spread beyond a narrow annulus. The highest wavenumber of
  $m=100$, however, is sufficiently large to trigger a transition towards the growth rate
  $G=G_\infty$ applying in the limit
  $MX\gg 1$.

Figure 10. Solutions of the initial-value problem for linear perturbations to Newtonian spreading flow ( $n=1,\ \textrm {Bi}=0$), showing (a) time series of the perturbed radius scaled by the base state radius for the values of
  $H_0$ and
  $m$ indicated, and (b) the perturbed radial velocity
  $\hat {u}$ for
  $H_0=1$ at the times indicated (successively offset and with the colour coding representing
  $m$ as in (a)). The inset to (a) shows the early-time behaviour of
  $\hat {R}(t)$ along with the asymptotic predictions of § 4.1 (dashed); the dotted lines show the power laws
  $t^{-0.8}$ (top),
  $t^{-0.81}$ and
  $t^{-0.76}$ (bottom) predicted by the analysis in appendix A.2. In (c–e), with
  $m=2$ and
  $H_0=1$, the solutions for
  $\hat {u}(r,t)$,
  $\hat {v}(r,t)$ and
  $\hat {h}(r,t)$ are scaled and plotted against
  $r/{\bar {R}}(t)$ every 50 time units up to the extended time of
  $t=10^3$; the dashed lines show the self-similar solutions from appendix A.2, taking
  ${\varepsilon }=0.006$.
Once the fluid has spread beyond the early-time regime, instability gradually switches off, giving way to a late-time algebraic decay relative to the expansion of the base state (the perturbations actually continue to grow algebraically in time in this latter phase, but with a power of time that is less than that of  ${\bar {R}}(t)\sim t$). This decay becomes independent of the entrance depth
  $H_0$ at the latest times, with a weak dependence on
  $m$. During this evolution, the linear solutions do not inherit a great deal of spatial structure, although they become more localized to the outer edge at later times and for higher wavenumber (figure 10b).
The late-time power-law decay corresponds to the convergence of the perturbations towards a self-similar spatial structure equivalent to that of the base state (§ 3.1), in which  $\zeta =r/{\bar {R}}$ and
  $[\hat {u}(r,t),\hat {v}(r,t),\hat {h}(r,t)] =\hat {u}({\bar {R}},t)[\check {\mathcal {U}}(\zeta ),\check {\mathcal {V}}(\zeta ),\check F(\zeta )/{\bar {R}}]$. Figure 10(c–e) illustrates this structure over longer times for the case with
  $H_0=1$ and
  $m=2$. Further details of this limit are given in appendix A.2, where the transformation to the similarity variables facilities a standard normal-mode-style stability analysis. That analysis predicts that the Newtonian problem is stable; the damping rates and perturbation amplitudes are indicated in figure 10 and compare well with the results from numerical solution of the initial-value problem. Note the increasingly abrupt rise in
  $\hat {h}(r,t)$ near the outer edge, emerging because the base state develops an infinite slope in the self-similar limit.
Figure 11 shows an analogous set of examples with a yield stress. In this case, the expansion of the basic spreading flow out competes the perturbations in the early-time limit (with  $\hat {R}/\bar {R}$ decaying), but modes begin to grow relative to the base state at later times. The lowest yield-stress case for
  $\textrm {Bi}=0.1$ displays little overall amplification of the linear modes, with the lowest angular wavenumber remaining strongest at the termination of the computation. For
  $\textrm {Bi}=1$, the modes (with
  $m=2$ to 16) grow at comparable late-time rates. With
  $\textrm {Bi}=10$, however, the higher-wavenumber modes amplify quicker and substantially. Unlike the Newtonian case, the perturbations do not become confined to the outer edge as the fluid expands, but retain significant amplitudes throughout the fluid, displaying spatial oscillations that narrow with increasing angular wavenumber (figure 11b), a feature mirroring results in the two-dimensional problem of Sayag & Worster (Reference Sayag and Worster2019b). For the higher values of
  $m$, the perturbation to the edge
  $\hat {R}(t)$ also begins to oscillate in time with a frequency that increases with
  $m$.
$m$.

Figure 11. Solutions of the initial-value problem for linear perturbations to Bingham spreading flow ( $n=1,\ \textrm {Bi}>0$) with
  $H_0=1$. (a) Time series of the perturbed radius scaled by the base state radius,
  $\hat {R}/{\bar {R}}$, for the values of
  $m$ indicated; the solid lines show results for
  $\textrm {Bi}=1$, the dotted lines for
  $\textrm {Bi}=0.1$ and the dot-dashed lines for
  $\textrm {Bi}=10$ (computations are terminated when
  $|\hat {R}|/\bar {R}=10^6$). The black dashed lines show the growth expected from appendix B.2, based on the final value of
  ${\varepsilon }={\bar {R}}^{-1}$. The inset shows the early-time behaviour of
  $\hat {R}(t)$ along with the approximation
  $\textrm {e}^{U_{1x}t}$ (dashed). (b) Snapshots of
  $(\hat {u},\hat {v},(2{\rm \pi} )^{-1}\hat {h})/Max(\hat {u})$ at
  $t=100$ for
  $\textrm {Bi}=1$ (solid, dashed and dotted, respectively, with the colour coding representing
  $m$ as in (a)). (c) The final snapshots of
  $\hat {v}$ for
  $\textrm {Bi}=10$. The dots show the corresponding self-similar solutions of appendix B.2; for the complex modes with
  $m=8$ and 16, a constant phase is chosen arbitrarily.
As discussed in appendix B.2, stronger instability at higher  $m$, oscillatory growth and persistent spatial oscillations also feature for the linear modes in the self-similar plastic limit. The analysis there, in fact, predicts a (power-law) growth rate that increases as
  $m^2$, implying a rather singular limit to the stability problem. The enhanced amplification at larger
  $\textrm {Bi}$ and
  $m$ seen in figure 11 evidently points to the emergence of this divergent behaviour. A quantitative comparison of the numerical results in this figure with the self-similar solutions is not possible, however, because these Bingham computations have yet to converge to self-similar form. Moreover, since the vent radius is not fixed but expanding in the similarity solutions, such a comparison only makes sense if results are insensitive to the position and conditions at the inner edge, which is far from the case in the plastic limit. Despite this, if we take the value of
  ${\varepsilon }={\bar {R}}\;^{-1}$ implied at the end of the computations for
  $\textrm {Bi}=10$ (which is the closest to the plastic limit) and compute
  $\lambda$ using the analysis in appendix B.2, we emerge with a qualitative guide to the instantaneous growth rate (see the dashed lines in the main panel of figure 11a). Similarly, the corresponding self-similar solutions broadly reproduce the spatial structure of the final snapshots (figure 11c).
The addition of a yield stress therefore significantly destabilizes the spreading, shallow current at late times. The situation is somewhat similar for a power-law fluid ( $\textrm {Bi}=0$), with a decrease of
  $n$ playing the same role as an increase in
  $\textrm {Bi}$. Figure 12 presents results for
  $m=4$ and 1, with a variety of values for
  $n$. For these two modes, the linear stability analysis of the self-similar solutions in appendix A.2 predicts instability for
  $n$ slightly less than
  $0.2$ and
  $0.55$, respectively, with the
  $m=4$ mode having a finite frequency. These predictions are again broadly reproduced in the numerical computations. Moreover, unlike in the plastic limit, a more detailed comparison of the mode shapes shows satisfying agreement (see appendix B.2), primarily because the perturbations decay more strongly towards the inner boundary, rendering the solutions less sensitive to the inflow conditions. The growth rates also remain bounded, at least with finite
  $n$.
$n$.

Figure 12. Solutions of the initial-value problem for linear perturbations for power-law fluid ( $\textrm {Bi}=0$) for the values of
  $n$ indicated and
  $H_0=2$. In the main panels, perturbed radius scaled by the base state radius is plotted for (a)
  $m=4$ and (b)
  $m=1$. The dotted lines indicate the power laws
  $t^{\lambda _r}$ predicted for the self-similar solutions in appendix B.2. The insets show the final snapshots of
  $\hat {v}$.
5. Discussion
In this paper we have investigated the stability of sliding viscoplastic films. This work is motivated by experiments in which a dramatic non-axisymmetric instability appears in radially expanding films of Xanthan gum solution (Sayag et al. Reference Sayag, Pegler and Worster2012; Sayag & Worster Reference Sayag and Worster2019a) and Carbopol suspensions (figure 1; Ball et al. Reference Ball, Balmforth, Morris and Dufresne2021b). Sayag & Worster (Reference Sayag and Worster2019b) rationalized these observations in terms of an instability of two-dimensional, radial extensional flow of a power-law fluid. However, this instability may be weak under typical experimental conditions (Ball et al. Reference Ball, Balmforth and Dufresne2021a) and different for base flows that thin as they spread and possess three-dimensional stress states. In view of this, and to provide a theoretical discussion that is also relevant for yield-stress fluids, we considered in this paper the instability of spreading thinning films of Herschel–Bulkley fluids.
As a first step, we constructed axisymmetric spreading states. Without a yield stress, power-law fluids develop a steady flow structure near the source but evolve to a self-similar form further away, as discussed by Pegler & Worster (Reference Pegler and Worster2012) for Newtonian fluid. The addition of a yield stress eliminates such states, however, because the continued fall of the rate of extension as the fluid spreads inexorably promotes the importance of the yield stress in comparison to the viscous stresses. Instead, the current reaches a different self-similar regime corresponding to a plastic limit dominated by the yield stress; i.e. flow dictated by perfectly plastic deformation (Prager & Hodge Reference Prager and Hodge1951).
A linear stability analysis of the base states demonstrates the instability of Sayag & Worster (Reference Sayag and Worster2019b) and Sayag (Reference Sayag2019) still operates for a spreading thinning film, although the details are somewhat different. The dynamics breaks down into an early-time phase wherein the spreading current remains a relatively narrow annulus, and a late-time, self-similar regime. In the early time phase, the thinning of the base flow can drive linear instability provided the yield stress is not too large, although amplification is always weak, with perturbations growing more slowly than the expansion of the base state. Currents with relatively strong yield stresses are linearly stable at early times, in contrast to the viscoplastic version of Sayag and Worster's two-dimensional problem (Ball et al. Reference Ball, Balmforth and Dufresne2021a).
In the late-time, self-similar regime, non-axisymmetric perturbations subside in Newtonian fluids, in line with experimental observations (Pegler & Worster Reference Pegler and Worster2012; Sayag & Worster Reference Sayag and Worster2019a). However, with either a yield stress or a sufficiently strongly shear-thinning viscosity, non-axisymmetric perturbations begin to grow relative to the expansion of the base state. In the plastic limit, to which the fluid inevitably approaches whenever there is a yield stress, the instability becomes especially pronounced, the linear stability analysis predicting singular behaviour. The viscoplastic, spreading and thinning current therefore appears to be rather more unstable than its two-dimensional analogue, but only over late times when the fluid has expanded over distances well exceeding the initial radius. Of course, it is also true that our exploration has been limited to a linear analysis and it is conceivable that nonlinearity plays a more intrusive role.
Awkwardly, in experiments like that shown in figure 1, the non-axisymmetric patterns develop immediately, as soon as the fluid leaves the launch stage and begins to thin above the ambient bath. There is also evidence from both the free-surface experiments and from other experiments in Hele-Shaw cells that an extensional flow instability cannot be the complete story (Ball et al. Reference Ball, Balmforth and Dufresne2021a,Reference Ball, Balmforth, Morris and Dufresneb): in order to develop extensional flow without significant shear across the spreading film, one must avoid any friction with the underlying surface. This was achieved by Sayag et al. and in the Carbopol experiment of figure 1 by floating the complex fluid over a bath of water. Particularly with the Carbopol experiment, however, the water bath is relatively shallow, and there is little sign that much water remains underneath the Carbopol a short distance from the launch stage. In experiments in which Carbopol was pumped into water-filled Hele-Shaw cells, there was similarly little evidence for relatively thick residual wall layers of water. For both experiments it is likely that there is therefore significant vertical shear across the film. Despite this, fingering patterns still develop, and appear much like the Xanthan gum experiments of Sayag et al., which use much deeper water baths. Crucially, if a different, immiscible liquid with comparable viscosity (such as paraffin or mineral oil) is used for the ambient fluid the experiments are substantially different, with non-axisymmetric patterns eliminated entirely. Thus, interfacial interaction with the bath appears to play an important role. In fact, the Hele-Shaw experiments (Ball et al. Reference Ball, Balmforth and Dufresne2021a) suggest that a completely different mechanism might be at play: the local fracturing under tension of the material, exacerbated by a lowering of the fracture toughness due to the presence of water. How the extensional flow instability competes or cooperates with fracture to create the finger pattern remains unclear.
Acknowledgements
We thank M. Martinez, S. Morris, R. Sayag and M.G. Worster for helpful discussions.
Declaration of interests
The authors report no conflict of interest.
Appendix A. Self-similar solutions for $\textrm {Bi}=0$

A.1. Base states
We set
 \begin{equation} \zeta = \frac{r}{\varLambda t^{({1}/{2})(1+n)}},\quad F(\zeta) = t^n H,\quad {\mathcal{U}}(\zeta) = \varLambda^{-1} t^{({1}/{2})(1-n)} U . \end{equation}
The equations for the base state become
 \begin{equation} {\mathcal{U}}_\zeta = \frac{F}{8{\scriptstyle{\mathcal{M}}}}-\frac{Z}{4{\scriptstyle{\mathcal{M}}} F}-\frac{{\mathcal{U}}}{2\zeta},\quad F_\zeta = \frac{(n-\zeta^{-1}{\mathcal{U}}-{\mathcal{U}}_\zeta)F}{{\mathcal{U}}-\tfrac{1}{2}(n+1)\zeta},\quad Z_\zeta = 2{\scriptstyle{\mathcal{M}}} F\left(\frac{{\mathcal{U}}}{\zeta}\right)_\zeta, \end{equation}
where  $Z(\zeta )\equiv t^{2n} [\frac {1}{2} H^2 - H(2{T_{rr}}+{T_{\theta \theta }})]$ and
 \begin{equation} {\scriptstyle{\mathcal{M}}}(\zeta) \equiv \left(2\sqrt{ {\mathcal{U}}_\zeta^2 + \zeta^{-1}{\mathcal{U}}{\mathcal{U}}_\zeta+\zeta^{-2}{\mathcal{U}}^2}\right)^{n-1}. \end{equation}
The outer boundary conditions are
 \begin{equation} {\mathcal{U}} \to {{\tfrac{1}{2}}}(1+n), Z\to0,\quad \textrm{for} \ \zeta\to 1, \end{equation}
which leaves free the amplitude of a singular solution of the form  $(1-\zeta )^{(3n-1)/4}$ for
  $n>{\frac {1}{3}}$ (in which case
  $F \to 2{\scriptstyle {\mathcal {M}}} ( 3n-1 )$) or
  $(1-\zeta )^{(1-3n)/3(n+1)}$ for
  $n<{\frac {1}{3}}$ (and
  $F \to 0$). The solution is therefore fully specified by the inner boundary condition, which corresponds to the match to the steady profile in § 3.1
 \begin{equation} F \to \tilde{H}_0 (\varLambda \zeta)^{-2n/(n+1)}, \quad {\mathcal{U}} \to \frac{\zeta(\varLambda \zeta)^{-2/(n+1)}}{2{\rm \pi} \tilde{H}_0}, \end{equation}
and
 \begin{equation} Z \to {{\tfrac{1}{2}}} F^2 - 2^n(3n-1)(1+3n^2)^{(n-1)/2}(1+n)^{-n} F ({\mathcal{U}}/\zeta)^n . \end{equation}
The last relation proves convenient to impose the inner boundary condition at a finite position,  $\zeta ={\varepsilon }$, with
  ${\varepsilon }$ sufficiently small to ensure that its value has little impact on the solution. Finally, the inner flux condition demands
 \begin{equation} 1 = 2{\rm \pi} r HU \to \varLambda^2 \zeta F {\mathcal{U}} \end{equation}
at  $\zeta ={\varepsilon }$, which determines
  $\varLambda$, and therefore the position of the outer edge,
  ${\bar {R}} \equiv \varLambda t^{({1}/{2})(1+n)}$. For example, we find
  $\varLambda =0.173$ for
  $n=1$ and
  $\varLambda =0.328$ for
  $n=0.4$. The corresponding self-similar solutions are plotted in figure 4 and compared with the (suitably scaled) solutions of the initial-value problems in figures 2 and 3 (including factors of the powers of
  $\zeta$ required to suppress divergence for
  $\zeta \to 0$).
A.2. Linear stability
To explore the linear stability, we set
 \begin{gather} h = t^{-n}[ F(\zeta) + t^\lambda \,\textrm{e}^{\textrm{i}m{\vartheta}} {\check{F}}(\zeta)],\quad u = \varLambda t^{-({1}/{2})(1-n)} [ {\mathcal{U}}(\zeta)+ t^\lambda \,\textrm{e}^{\textrm{i}m{\vartheta}} {\check{\mathcal{U}}}(\zeta)], \end{gather}
 \begin{gather}v = \textrm{i}m \varLambda t^{\lambda-({1}/{2})(1-n)}\,\textrm{e}^{\textrm{i}m{\vartheta}} {{\Psi}}(\zeta),\quad R = \varLambda t^{({1}/{2})(1+n)} [ 1 + t^\lambda \,\textrm{e}^{\textrm{i}m{\vartheta}} {\check{R}}], \end{gather}
 \begin{gather}{\check{F}} = \frac{{\check{X}} - \zeta F {\check{\mathcal{U}}}}{\zeta[{\mathcal{U}}-\tfrac{1}{2}(n+1) \zeta]},\quad {\check{Y}} = {\zeta^2 {\scriptstyle{\mathcal{M}}} F}\left(\frac{{\check{\mathcal{U}}}-{{\Psi}}}{\zeta}+{{\Psi}}_\zeta\right), \end{gather}
and
 \begin{equation} t^{\lambda-2n} \,\textrm{e}^{\textrm{i}m{\vartheta}}{\check{Z}}(\zeta) = H(\hat{h} - 2{\hat{\tau}_{rr}} - {\hat{\tau}_{\theta\theta}}) - \hat{h}(2{T_{rr}}+{T_{\theta\theta}}). \end{equation}
The linear equations can then be written as
 \begin{gather} {\check{\mathcal{U}}}_\zeta = \frac{[\zeta F-2{\scriptstyle{\mathcal{M}}}(2\zeta{\mathcal{U}}_\zeta+{\mathcal{U}})]{\check{F}} - \zeta {\check{Z}} - F(2{\tilde{\beta}_{rr}}+{\tilde{\beta}_{\theta\theta}})({\check{\mathcal{U}}}-m^2{{\Psi}})}{(2{\tilde{\alpha}_{rr}}+{\tilde{\alpha}_{\theta\theta}})\zeta F}, \end{gather}
 \begin{gather}{\check{X}}_\zeta = m^2 F {{\Psi}} - \zeta (1+\lambda) {\check{F}} , \end{gather}
 \begin{gather}{\check{Z}}_\zeta = \frac{2{\scriptstyle{\mathcal{M}}}}{\zeta^2}(\zeta{\mathcal{U}}_\zeta-{\mathcal{U}}){\check{F}} + \frac{F}{\zeta^2} [({\tilde{\alpha}_{rr}}-{\tilde{\alpha}_{\theta\theta}})\zeta{\check{\mathcal{U}}}_\zeta + ({\tilde{\beta}_{rr}}-{\tilde{\beta}_{\theta\theta}})({\check{\mathcal{U}}}-m^2{{\Psi}})]-\frac{m^2}{\zeta^3}{\check{Y}} , \end{gather}
 \begin{gather}{{\Psi}}_\zeta = \frac{{{\Psi}}-{\check{\mathcal{U}}}}{\zeta}+\frac{{\check{Y}}}{\zeta^2 {\scriptstyle{\mathcal{M}}} F}, \end{gather}
 \begin{gather}{\check{Y}}_\zeta = [ \zeta F-2{\scriptstyle{\mathcal{M}}}(2{\mathcal{U}}+\zeta{\mathcal{U}}_\zeta)] {\check{F}} - \zeta F (2{\tilde{\alpha}_{\theta\theta}}+{\tilde{\alpha}_{rr}}) {\check{\mathcal{U}}}_\zeta - F (2{\tilde{\beta}_{\theta\theta}}+{\tilde{\beta}_{rr}})({\check{\mathcal{U}}}-m^2{{\Psi}}), \end{gather}
where  $({\tilde {\alpha }_{rr}},{\tilde {\alpha }_{\theta \theta }},{\tilde {\beta }_{rr}},{\tilde {\beta }_{\theta \theta }})=t^{n-1}({\alpha _{rr}},{\alpha _{\theta \theta }},{\beta _{rr}},{\beta _{\theta \theta }})$. At the unperturbed outer radius
  $\zeta =1$, we impose
 \begin{equation} {\check{\mathcal{U}}} = [\lambda+{{\tfrac{1}{2}}}(n+1)-{\mathcal{U}}_\zeta]{\check{R}},\quad {\check{Z}} + Z_\zeta {\check{R}} = 0, \quad {\check{Y}} - 2 {\scriptstyle{\mathcal{M}}} F ({\mathcal{U}}-{\mathcal{U}}_\zeta) {\check{R}} = 0, \end{equation}
and set  ${{\Psi }}({\varepsilon }) = {\check {X}}({\varepsilon }) = {\check {\mathcal {U}}}({\varepsilon }) = 0$ to ensure that the solution does not diverge at the inner boundary (although the solution appears to be insensitive to these conditions as long as it remains regular for
  $\zeta \to 0$ and
  $n$ and
  $m$ are not too small).
The numerical solution of this linear problem furnishes only stable eigenvalues with  $\lambda _r\equiv$ Re
 $(\lambda )<0$ for the Newtonian problem (
 $n=1$). However, a reduction in
  $n$ increases
  $\lambda _r$ and eventually unstable modes appear; see figure 13. The
  $m=1$ mode becomes unstable for
  $n$ slightly below
  $0.6$ (and remains real); instabilities with higher wavenumber require
  $n<{\frac {1}{3}}$, and are complex with frequencies
  $\lambda _i\equiv \textrm {Im}(\lambda )\ne 0$. Solutions for the perturbation amplitudes are compared with numerical solutions of the Newtonian initial-value problem in figure 10, and figure 14 displays a selection of solutions for
  ${{\Psi }}(\zeta )$ for various values of
  $n$,
$n$,  ${\varepsilon }$ and
  $m$. The cases with different
  ${\varepsilon }$ are hard to distinguish in figure 14, except at smaller
  $m$ and
  $n$ where the solutions become sensitive to
  ${\varepsilon }$ because the corresponding mode shapes fail to decay towards the inner boundary and begin to pile up against it. Also, the flattening out of the growth-rate curves in figure 13(a) can be rationalized by a Wentzel–Kramers–Brillouin (WKB)-style analysis in the limit
  $m\gg 1$, where the solutions decay rapidly away from the outer boundary and depend on the spatial coordinate
  $m(1-\zeta )$. The analysis is complicated by the presence of the singular point at
  $\zeta =1$, and the fact that its nature switches for
  $n={\frac {1}{3}}$, but otherwise predicts that
  $\lambda$ becomes independent of
  $m$.
$m$.

Figure 13. Eigenmodes of the linear stability problem for self-similar solutions with  $\textrm {Bi}=0$, showing (a)
  $\lambda _r$ against
  $m$ for
  $n=[0.1, 0.15, 0.2, 0.4,\ldots ,1]$ and
  $\lambda _i$ against
  $m$ for
  $n=[0.1, 0.15, 0.2]$, and (b)
  $\lambda _r$ against
  $n$ for
  $m=1$. In both panels, data for
  ${\varepsilon }=10^{-3}$ (solid),
  $0.01$,
  $0.05$ and
  $0.1$ (all dashed) are shown.

Figure 14. Eigenfunctions  ${{\Psi }}$ for (a)
  $n=1$, (b)
  $n=0.4$ and (c)
  $n=0.1$, with
  ${\varepsilon }=0.1$ (dashed) and
  $0.01$ (solid). Modes with
  $m=1$, 4 and 10 are plotted (as indicated by colour). The dash-dot lines show more
  $m=1$ solutions for
  ${\varepsilon }=10^{-3}$. In (c), the real parts of the complex modes with
  $m>1$ are plotted. The dots show numerical solutions of the initial-value problem at
  $t\approx 300$ for a selection of the cases (
 $m=10$ in (a);
  $m=1$ and 4 in (b);
  $m=4$ in (c)).
Appendix B. Plastic self-similar solutions
B.1. The limit ${\varepsilon }\to 0$

Writing
 \begin{align} Z = F\left(\frac{1}{2} F - 2 C\right),\quad 2{\mathcal{U}}_\zeta + \frac{{\mathcal{U}}}{\zeta} = {\dot\gamma} C(\zeta),\quad \sqrt3\frac{{\mathcal{U}}}{\zeta} = {\dot\gamma} S(\zeta)\quad \textrm{and}\quad 1 = C^2+S^2, \end{align}
the equations for the axisymmetric similarity solution read
 \begin{equation} F_\zeta = \frac{F{\mathcal{U}}({\sqrt3C} + S)}{\zeta S(\zeta-2{\mathcal{U}})},\quad {\mathcal{U}}_\zeta = \frac{{\mathcal{U}}}{2S\zeta} ( {\sqrt3C} - S),\quad Z_\zeta = \frac{F}{\zeta} ( C - \sqrt{3}S ). \end{equation}
 In addition to the limits in (3.25),  $Z= O(\zeta ^{4/3})$ for
  $\zeta \to 1$, which implies that
  $C(1) = 0$. A simple approximation for the bulk of the current is furnished by assuming that
  $C\ll 1$ and
  $S\approx 1$ everywhere, corresponding to
  $2{{\mathcal {T}}_{rr}}+{{\mathcal {T}}_{\theta \theta }}\ll 1$. This assumption immediately implies that
  $Z\approx {{\frac {1}{2}}} F^2$,
  ${\mathcal {U}}_{\zeta } \approx - {\mathcal {U}} / (2\zeta )$ and
  $Z_\zeta \approx - \sqrt {3} F / \zeta$, leading to (3.26a,b).
For  $\zeta \to 0$, the solution for
  $F$ diverges logarithmically, whereas
  $|C|$ is bounded by unity. Thus,
  $Z\to F^2/2$. The first and last equations in (B2a–c) can then only be consistent if
  $C\to -S/\sqrt 3$, or
  $(C,S)\to {{\frac {1}{2}}}(-1,\sqrt 3)$. This further implies that
  $F\sim -2\log \zeta$ and
  ${\mathcal {U}} \propto \zeta ^{-1}$; logarithmic corrections obscure this limit in the numerical solutions. In particular, we note that
  $C\sim -S/\sqrt 3+2/F$, retaining the next correction. Thence,
  ${\mathcal {U}}_\zeta \sim - (1-2/F){\mathcal {U}}/\zeta$, which furnishes
  ${\mathcal {U}}\sim -c (\zeta \log \zeta )^{-1}$, for some constant
  $c$, as seen in figure 8(f) (where
  $c$ is chosen to be
  $0.4$).
We may also observe from (B2a–c) that  $(\zeta F {\mathcal {U}})_\zeta \sim O(\zeta )$ for
  $\zeta \to 0$. It follows that
 \begin{equation} [\zeta F {\mathcal{U}}]_{\zeta\to0} = \int_0^1 F(\zeta) \zeta\,\textrm{d}\zeta\approx 0.664, \end{equation}
using the computations in figure 8(c), which simply corresponds to mass conservation for the self-similar solution. This result leads to the limit in (3.28).
B.2. Linear stability
For the perturbations to the similarity solution we set
 \begin{gather} h = \textrm{Bi}[ F(\zeta) + t^\lambda \,\textrm{e}^{\textrm{i}m{\vartheta}} {\check{F}}(\zeta)],\quad u = \varLambda t^{-({1}/{2})} \textrm{Bi}^{-({1}/{2})}[ {\mathcal{U}}(\zeta) + t^\lambda \,\textrm{e}^{\textrm{i}m{\vartheta}} {\check{\mathcal{U}}}(\zeta)], \end{gather}
 \begin{gather}v = \textrm{i}m \varLambda t^{\lambda-({1}/{2})} \textrm{Bi}^{-({1}/{2})} \,\textrm{e}^{\textrm{i}m{\vartheta}} {{\Psi}}(\zeta),\quad R = \varLambda t^{{1}/{2}} \textrm{Bi}^{-({1}/{2})}[ 1 + t^\lambda \,\textrm{e}^{\textrm{i}m{\vartheta}} {\check{R}}]. \end{gather}
Now we define  ${\check {Y}}$,
  ${\check {Z}}$ and
  ${\check {X}}$ through the relations
 \begin{gather} {\check{Y}} = \frac{\zeta^2 F}{{\dot{\Gamma}}}\left(\frac{{\check{\mathcal{U}}}-{{\Psi}}}{\zeta}+{{\Psi}}_\zeta\right),\quad {\check{Z}} = (F-2C){\check{F}} - F(2{\check{\tau}_{rr}}+{\check{\tau}_{\theta\theta}}), \end{gather}
 \begin{gather}{\check{F}} = \frac{{\check{X}} - \zeta F {\check{\mathcal{U}}}}{\zeta({\mathcal{U}}-{{\frac{1}{2}}} \zeta)} \quad \textrm{and} \quad {\dot{\Gamma}} = 2 \sqrt{{\mathcal{U}}_\zeta^2+\frac{{\mathcal{U}}{\mathcal{U}}_\zeta}{\zeta}+\frac{{\mathcal{U}}^2}{\zeta^2}} \equiv \frac{\sqrt3{\mathcal{U}}}{\zeta S}, \end{gather}
where the normal stress perturbations are
 \begin{equation} ({\check{\tau}_{rr}}, {\check{\tau}_{\theta\theta}}) = \frac{1}{2F} [(F-2C){\check{F}}-{\check{Z}}] \left(1+\frac{C}{S\sqrt3},-\frac{2C}{S\sqrt3}\right). \end{equation}
The linearized equations for the perturbations can then be written as
 \begin{gather} {\check{\mathcal{U}}}_\zeta = \frac{\zeta {\dot{\Gamma}}[(F-2C){\check{F}}-{\check{Z}}] - 2FS(S-\sqrt3C)({\check{\mathcal{U}}}-m^2{{\Psi}}) } {4\zeta F S^2}, \end{gather}
 \begin{gather}{\check{X}}_\zeta = m^2 F {{\Psi}} - \zeta (1+\lambda) {\check{F}}, \end{gather}
 \begin{gather}{\check{Z}}_\zeta = \frac{1}{\zeta}(C-\sqrt3S){\check{F}}+ \frac{1}{2\zeta S} (S+\sqrt{3}C) [(F-2C){\check{F}}-{\check{Z}}] -\frac{m^2}{\zeta^3}{\check{Y}}, \end{gather}
 \begin{gather}{{\Psi}}_\zeta = \frac{{{\Psi}}-{\check{\mathcal{U}}}}{\zeta}+\frac{{\dot{\Gamma}} {\check{Y}}}{\zeta^2 F}, \end{gather}
 \begin{gather}{\check{Y}}_\zeta = \zeta (F-C-\sqrt{3}S) {\check{F}} - \frac{\zeta}{2S}(S-C\sqrt3) [(F-2C){\check{F}}-{\check{Z}}]. \end{gather}
The boundary conditions are, at  $\zeta ={\varepsilon }$,
 \begin{equation} {{\Psi}} = {\check{F}} = {\check{\mathcal{U}}} = 0 , \end{equation}
and, near the unperturbed outer radius  $\zeta =1$,
 \begin{equation} {\check{\mathcal{U}}} \sim \left(\lambda+{\tfrac{3}{4}}\right){\check{R}},\quad {\check{Z}} \sim \sqrt3 F{\check{R}},\quad {\check{Y}} \sim \sqrt3 F{\check{R}}. \end{equation}
The singular point at the edge again impacts the linear stability problem: in order to shift the outer boundary, the perturbation to the depth at  $\zeta =1$ must diverge according to
  ${\check {F}} \sim -F_\zeta {\check {R}}$. The dependent variables above, however, avoid any divergences. Nevertheless, one must be careful to exclude solutions to (B9)–(B13) that diverge more strongly than implied by (B15a–c). Indeed, we find numerical evidence for infinitely many solutions with Real
 $(\lambda )$ close to
  $-1$ that possess unphysical behaviour at the edge. Eliminating these leaves a finite set of physically relevant modes that can be unstable.
Numerical solutions to the linear stability problem are shown in figures 15 and 16. The first figure displays a pair of unstable modes that arises for smaller angular wavenumbers  $m$ for a base state with
  ${\varepsilon }=0.05$. With increasing
  $m$, the eigenvalues of these modes pass through a curious sequence of interactions wherein the pair either splits into distinct, real values or collide into a complex conjugate pair. Overall, the growth rate
  $\lambda _r$ increases with
  $m^2$, whereas the frequency of the conjugate pair scales with
  $m$. As displayed by the eigenfunctions for
  ${\check {\mathcal {U}}}(\zeta )$ included in the plot, the modes acquire more spatial oscillations as
  $m$ increases. At higher
  $m$, further unstable modes appear, but at the values of
  $m$ plotted, no other growing eigenvalues were found. Some additional analytical progress is possible in the high-wavenumber limit using WKB theory; the eigenfunctions acquire an oscillatory structure given by
  $\exp ({{\frac {1}{2}}} \textrm {i} m\sqrt 2 \log \zeta )$, with a more slowly varying amplitude that is roughly independent of
  $m$.
$m$.

Figure 15. Eigenvalues  $\lambda =\lambda _r+\textrm {i}\lambda _i$ against
  $m$ for a base state with
  $A=1.03$ (
 $F_0=5.86$) and
  ${\varepsilon }=0.05$. The eigenvalues are computed treating
  $m$ as a real number; the solution with integer
  $m$ are shown as circles, coloured according to whether they are real (blue and red, with the former having a
  $\lambda$ greater than that of the latter) or complex (green). The insets show the mode shapes for
  ${\check {\mathcal {U}}}(\zeta )$.

Figure 16. Eigenvalues  $\lambda =\lambda _r+\textrm {i}\lambda _i$ against
  $m$ for the values of
  ${\varepsilon }$ indicated (with
  $A=1.029112$ for
  ${\varepsilon }=0.015$,
  $A=1.03$ for
  ${\varepsilon }=0.05$, and
  $A=1$ for the cases with larger
  ${\varepsilon }$). The dashed lines show the linear and quadratic curves of figure 15.
Growth rates for varying domain sizes (i.e.  ${\varepsilon }$) are shown in figure 16. Notably, the growth rates appear to diverge in the limit
  ${\varepsilon }\to 0$, with
  $\lambda _r = O({\varepsilon }^{-a}m^2)$ and
  $1.5 < a < 2$. Conversely, the instability is much reduced in the limit of a relatively narrow annulus,
  ${\varepsilon }\to 1$, where further asymptotic analysis demonstrates that
  $\lambda _r\approx (1-{\varepsilon })^2m^2/12$. In the plastic limit, the instability is therefore markedly different from the two-dimensional instability explored by Sayag & Worster (Reference Sayag and Worster2019b). For that problem, the instantaneous growth rate is maximized for
  $m=1$ and all the higher angular modes pass repeatedly through phases of stability and instability as the fluid expands (Ball et al. Reference Ball, Balmforth and Dufresne2021a). Here, the instability grows monotonically with the expansion of the dome and the shorter-wavelength modes amplify fastest, at least until angular wavelength becomes comparable to the thickness of the dome and the shallow-layer approximation breaks down. Consequently, the extensional flow instability appears to be stronger for a thinning expanding dome.


