Nomenclature
Nomenclature
- C
-
Mean Aerodynamic chord, 2.309D
- C
 $_d$
$_d$
-
Drag force coefficient, drag force/
${q_\infty }$
cS
- C
$_L$
-
Lift force coefficient, lift force/
${q_\infty }$
S
- C
$_{L\alpha }$
-
Lift curve slope at C
$_L$
= 0 (dC
$_L$
/d
$\alpha $
c) - C
$_P$
-
Coefficient of static pressure, (P-P
$_S$
)/
${q_{\infty} }$
- C
$_{PM}$
-
Pitching moment coefficient about MRP, Moment/
${q_\infty }$
Sc - C
$_{P{rms}}$
-
Coefficient of fluctuating pressure, P
$_{rms}$
/
${q_{\infty} }$
-
${C_{\mu} }$
-
Blowing coefficient,
${\dot m_J}{V_J}$
/
${q_{\infty} }S$
- D
-
Model Diameter, 34.3 mm
- f
-
Frequency in Hz
-
$J$
-
Momentum coefficient,
${q_J}$
/
${q_{\infty} }$
-
M
$_{\infty} $
-
Free-stream Mach number
- MRP
-
Distance of Moment reference point aft of model nose in body diameter, 5.943D
-
${\dot m_J}$
-
Mass flow rate of the control jet, kg/s
- P
-
Local static pressure, bar
-
P
$_S$
-
Free-stream static pressure, bar
-
P
$_0$
-
Free-stream total pressure, bar
-
P
$_{rms}$
-
Root mean square value of unsteady pressure fluctuations, bar
-
${q_J}$
-
Dynamic pressure of the control jet, bar
-
${q_{\infty} }$
-
Free-stream dynamic pressure, 0.7 P
$_S$
M
$_{\infty}^2$
bar - S
-
Model reference area (wing area), 6.92D
$^2$
-
S
$_t$
-
Strouhal number, f (X
$_{RC}$
)/V
$_{\infty} $
-
V
$_J$
-
Velocity of the control jet at exit in m/s
-
V
$_{\infty} $
-
Free-stream velocity, m/s
- X
-
Streamwise coordinate, m
-
X
$_C$
-
Streamwise distance measured from the apex of the wing, m
-
X
$_{RC}$
-
Root chord, 2.598D, m
- Z
-
Spanwise coordinate, m


Greek symbols
Greek symbols
-
$\alpha $
-
Angle-of-attack, deg
-
${\alpha _{crit}}$
-
Critical angle-of-attack, deg
-
$\Delta $
-
Change or error in quantity
-
$\Lambda $
-
Sweep-back angle of wing, deg


1.0 Introduction
The aerodynamic characteristics of thin, sharp-edged delta wings are of interest for supersonic aircraft design and have been the subject of theoretical and experimental studies for many years in the subsonic, transonic and supersonic speed ranges. The formation of the two counter-rotating vortices [Reference Delery1] and its interaction with the spanwise and cross-flow shocks resulting in an abrupt vortex breakdown (VB) is of particular interest, especially at transonic speeds. The critical angle-of-attack where VB occurs is significantly lower at the transonic speed [Reference Bannink, Houtman and Ottachian2] as compared to the subsonic speeds. This not only limits the flight envelope for fighter aircraft, but also seriously deteriorates the flight performance [Reference Hall and Woodson3]. The occurrence of an abrupt and an asymmetric vortex breakdown on the delta wing compromises the controllability of flight as the fighter aircraft are aerodynamically unstable configurations. This has led several researchers to study the complex three-dimensional transonic flow field over a delta wing and device several novel control strategies to alleviate or postpone the VB.
Several researchers have reconstructed the flow field over the leeward side of delta wing in the transonic regime experimentally [Reference Sutton4–Reference Kalkhoran and Smart9] and computationally [Reference Rizzi10–Reference Schiavetta, Boelens, Crippa, Cummings, Fritz and Badcock16] in the past. The outcome of these studies mainly revealed an interaction of the leading edge vortex and shock wave on the leeward surface of the wing resulting into an onset of VB. The advancement in experimental and computational studies revealed the finer details about the shock and vortex interaction that cause a sudden upstream motion of VB towards apex of the wing with an increase in the angle-of-attack. The presence of shock, shock/vortex interaction, asymmetric VB etc. results in three typical types of uncommanded motions at transonic speeds, viz. heavy wing, wing drop and wing rock [Reference Hall and Woodson3]. Thus, VB in transonic flow regime gives rise to many lateral and directional stability problems in an aircraft. This problem has led several researchers to investigate several flow control devices viz. mechanical and pneumatic controls to postpone VB on delta wings.
A detail review of various vortex breakdown control by Mitchell and Délery [Reference Mitchell and Délery17] and Gursul et al. [Reference Gursul, Wang and Vardaki18] shows that various mechanical controls like strakes, canards, tapered leading-edge flaps, apex flaps, vortex tabs, cavity flaps, variable sweep etc. used to control the vortex breakdown have been studied, and some of these have been successfully implemented on the aircrafts like Saab Viggen, F-16, F/A-18 etc. Techniques involving mechanical devices are found to be effective in the subsonic flow regime as they fix the location of the separation and thereby alter the flow field downstream. However, they offer a serious limitation at off-design conditions and in the transonic flow field. On the other hand, various pneumatic controls like suction at trailing edge/leading edge, blowing at trailing edge, spanwise blowing, blowing normal to root chord, blowing parallel to leading edge, tangential blowing around leading edge, along-the-core blowing etc. have been reported. Amongst the diverse pneumatic techniques, along-the-core blowing [Reference Guillot, Gutmark and Garrison19, Reference Mitchell, Molton, Barberis and Délery20], wing blowing [Reference Farcy and Renier21], trailing-edge blowing [Reference Miyaji and Arasawa22] and periodic suction and blowing have been the focus of the several studies. These studies have revealed that the injection using a jet adds momentum into the core of the leading edge vortices and thus delays VB. Additionally, studies reveal that the pneumatic controls show promise as it does not alter the trajectory of vortex core or the vortical structure upstream of VB location significantly. The effectiveness of various pneumatic methods were reviewed by Gursul et al. [Reference Gursul, Wang and Vardaki18] who concluded that along-the-core blowing as the most effective method in terms of delaying VB. Dixon et al. [Reference Dixon and Dansby23] introduced a spanwise-directed jet on a semi-span basic wing geometry having 40° sweep angle at the free-stream Mach number of 0.9. They reported that the spanwise nozzles located on the wing controlled the shock-induced separations. Riou et al. [Reference Riou, Garnier and Basdevant24] investigated efficacy of a suction slot on a leeward side of a 65° swept wing and reported that the cross flow shock are altered due to the suction. Several other researchers investigated mechanical and fluidic vortex generators (VG) [Reference Ashill, Fulker and Hackett25–Reference Tejero, Doerffer and Szulc27] on a transonic aerofoil wing and reported that the VG’s were effective in controlling the shock-induced separation.
To the best of our knowledge, most of the research work reported on various pneumatic control techniques for the delta wing is in the low subsonic flow regime, and no published literature is reported for the transonic flow regime. Further, a most published research concentrates on delta wings without a fuselage, but the fuselage is shown to have a profound effect on the delta wing VB [Reference Ericsson28]. In view of this, the shock-induced VB over a delta-wing-body configuration and flow control effects to postpone the VB in the transonic flow regime remains a significant and intriguing research problem. The aim of the present work was to experimentally investigate the transonic flow over a delta-wing-body configuration and efficacy of momentum injection using a pneumatic jet and it’s injection location to delay VB. The applied measurement techniques were force measurement, surface oil flow visualisation, shadowgraph, surface pressure measurement using PSP, and unsteady pressure fluctuation measurement.
2.0 Experimental facility and procedure
An AGARD (Advisory Group for Aeronautical Research and Development) calibration model B (AGARD-B), being geometrically simple yet having all the requisite features of a delta winged aircraft model, was chosen as the test article. The AGARD-B is extensively used for the calibration of supersonic and transonic wind tunnels to ascertain the accuracy and repeatability of measurements. A large body of aerodynamic force data in the subsonic, transonic and supersonic Mach number regime for this configuration is therefore available in literature [Reference Milillo29–Reference Amiri, Soltani and Haghiri37]. Though the AGARD-B is a simple delta-wing-body configuration as compared to modern-day fighter aircraft that have complex geometries, the configuration exhibits a sudden and a significant jump or a break in lift force and pitching moment coefficients in the transonic regime [Reference Lombardi, Morelli and Haghiri38]. This behaviour observed at moderate angles of attack (12°–17°) in the transonic regime makes this choice of configuration a good starting point to understand the flow behaviour responsible for such breaks. It also serves to evaluate the efficacy of a flow control using a sonic jet in delaying the breaks to extend the usable range of angles of attack. For the remainder of this paper, these sonic jets used for flow control will be referred to as the ‘control jet(s)’.
2.1 Details of model and model support system
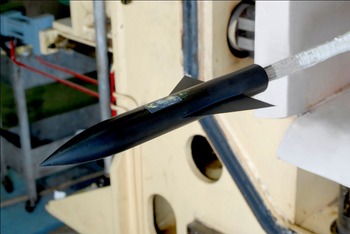
The AGARD-B calibration model is an ogive cylinder with a delta wing in the form of an equilateral triangle with a span four times the body diameter. The wing has a 4% thickness to chord ratio and a biconvex cross section. The model size for force measurement was chosen with blockage constraints of the tunnel in mind, resulting in a blockage of 0.36% at zero angle-of-attack. The aerodynamic data was obtained on the model with a natural transition, and no boundary layer trips were employed. The angle-of-attack measurement was corrected for the deflection of the model support system under aerodynamic loads by estimating the deflection from the known stiffness of the support system. Figure 1 shows a two-dimensional sketch of the model with the pertinent dimensions given in terms of the body diameter (D) of the test paper. A photograph of the model used for force measurement, mounted in test section, is shown in Fig. 2.

Figure 1. 2D sketch showing the geometry of the AGARD-B model and support system.

Figure 2. Photograph of the AGARD-B model mounted in the tunnel test section.
A separate model (D = 55mm) was designed for the pressure measurement that had a provision of 10 circular jets of 1mm diameter, strategically placed on the port and starboard wing. A schematic of the model indicating the control jet locations is shown in Fig. 3 (a). The control jets, namely
 ${S_1}$
,
${S_1}$
,
 ${S_2}$
,
${S_2}$
,
 ${S_3}$
,
${S_3}$
,
 ${P_1}$
,
${P_1}$
,
 ${P_2}$
and
${P_2}$
and
 ${P_3}$
, were located on the leeward side, just above the junction of fuselage and wing root. These holes were normal to local surface of the fuselage and issued a jet normal to the surface, which enabled the spanwise blowing (SWB). An isometric closeup view of control jets located on port wing and the direction of control jets blowing is shown in Detail A, and a CAD model showing the close up of SWB from port wing is shown in Fig. 3 (b) for clarity.
${P_3}$
, were located on the leeward side, just above the junction of fuselage and wing root. These holes were normal to local surface of the fuselage and issued a jet normal to the surface, which enabled the spanwise blowing (SWB). An isometric closeup view of control jets located on port wing and the direction of control jets blowing is shown in Detail A, and a CAD model showing the close up of SWB from port wing is shown in Fig. 3 (b) for clarity.
 ${S_4}$
,
${S_4}$
,
 ${S_5}$
and
${S_5}$
and
 ${P_4}$
,
${P_4}$
,
 ${P_5}$
were located on the leeward side of starboard and port wing, respectively, and were normal to local surface. These control jets were located on an imaginary line drawn between apex of the wing and a point on trailing edge, which is 1.25D and 1.5D from the centreline of the fuselage for starboard and port wing, respectively. The model was designed in such a way that any one circular opening on each side of wing can be connected to a high-pressure source for using it as a control jet while the other circular openings can be used as pressure taps for a given test. The model was also instrumented with four unsteady pressure transducers of Kulite® make,
${P_5}$
were located on the leeward side of starboard and port wing, respectively, and were normal to local surface. These control jets were located on an imaginary line drawn between apex of the wing and a point on trailing edge, which is 1.25D and 1.5D from the centreline of the fuselage for starboard and port wing, respectively. The model was designed in such a way that any one circular opening on each side of wing can be connected to a high-pressure source for using it as a control jet while the other circular openings can be used as pressure taps for a given test. The model was also instrumented with four unsteady pressure transducers of Kulite® make,
 ${K_1}$
to
${K_1}$
to
 ${K_4}$
on the leeward side of wing as shown in Fig. 3. The geometric location of the control jets and the unsteady pressure taps is given in Table 1, which show that the control jets were located approximately at 2.5%, 6%, 10%, 20%, and 30% of the root chord length from the apex of the wing.
${K_4}$
on the leeward side of wing as shown in Fig. 3. The geometric location of the control jets and the unsteady pressure taps is given in Table 1, which show that the control jets were located approximately at 2.5%, 6%, 10%, 20%, and 30% of the root chord length from the apex of the wing.
Table 1. Geometric locations of the control jets and unsteady pressure taps


Figure 3. A schematic and CAD model of the AGARD-B configuration showing the location of various control jet injection and unsteady pressure taps.
2.2 Wind tunnel test facility and test conditions
The CSIR-NAL 0.6m Trisonic wind tunnel is of the intermittent blowdown type with a Mach number range 0.2–4.0. The transonic test section to achieve free-stream Mach number of 0.2–1.4 is of a slotted configuration, with an open area ratio of 6% on the top and bottom walls and 4% on the side walls. The force and moment measurement were carried out on the test model in the Mach number range of 0.7 to 1.2 with a stagnation pressure of 1.723 bar and the angle-of-attack (
 $\alpha $
) was varied in the range of −4° to 25° continuously at a rate of 2
$\alpha $
) was varied in the range of −4° to 25° continuously at a rate of 2
 $^{\circ}$
/s. The Reynold’s number based on mean aerodynamic chord (C) was in the range of 1.7 to 2 million, depending on the free-stream Mach number.
$^{\circ}$
/s. The Reynold’s number based on mean aerodynamic chord (C) was in the range of 1.7 to 2 million, depending on the free-stream Mach number.
2.3 Details of strain gauge balance for force and moment measurement
The forces and moments were measured using a five-component internal strain gauge balance. The maximum capacity of the balance is 549 N for axial force, 441 N for side force, 883 N for normal force, 34 N.m for the pitching moment and 17 N.m for the yawing moment with an accuracy of approximately 0.20% of full-scale capacity. The balance was calibrated in the full range by applying single component loading to each of the five balance components. Calibration results showed a linear behaviour of all the balance components with the loading. A second-order calibration matrix with 120 constants was used for deducing the electrical output to the loads in the engineering unit. Prior to testing, the balance was checked by applying the single component loads different than the calibration loads and the accuracy was confirmed using the residual loads.
2.4 Instrumentation and data recording
The stagnation pressure in the settling chamber (P
 $_0$
) and static pressure (P
$_0$
) and static pressure (P
 $_S$
) in the test section was measured using ±1.034 bar differential Druck® transducers, with an accuracy of 0.1% of full scale. The base pressure used to correct the axial force coefficient was measured at four locations behind the fore-body using two differential Druck® pressure transducers of the range ±0.689 bar. The angle-of-attack (
$_S$
) in the test section was measured using ±1.034 bar differential Druck® transducers, with an accuracy of 0.1% of full scale. The base pressure used to correct the axial force coefficient was measured at four locations behind the fore-body using two differential Druck® pressure transducers of the range ±0.689 bar. The angle-of-attack (
 $\alpha $
) was measured by a potentiometer mounted onto the pitch mechanism with an accuracy of 0.05°. The balance data was acquired such that at least a data point is available at every 0.25° angle-of-attack. Therefore, the balance data is represented as a line plot in the subsequent result discussions. The balance output, the signals from pressure transducers and the pitch system signals were acquired on-line through a PC and processed off-line later.
$\alpha $
) was measured by a potentiometer mounted onto the pitch mechanism with an accuracy of 0.05°. The balance data was acquired such that at least a data point is available at every 0.25° angle-of-attack. Therefore, the balance data is represented as a line plot in the subsequent result discussions. The balance output, the signals from pressure transducers and the pitch system signals were acquired on-line through a PC and processed off-line later.
The unsteady pressure fluctuations were measured using a 3.2mm diameter, +10 psid range Kulite pressure transducer. The transducers were flush mounted on the surface of the model to maximise the frequency response. In order to maximise the signal to noise ratio in the measurement of pressure fluctuations, the steady pressure measured by the transducer was minimised by feeding a reference pressure close to the steady pressure from outside the test section, just before the test. The common reference pressure was given using a Druck® calibrator from outside the test section. The unsteady pressure transducer was excited with a voltage of 10V and the differential output was passed through a pre-amplifier AD620 (precision instrumentation amplifier) to convert the differential input to single-ended and also to increase the signal gain. The transducer was calibrated and the respective sensitivity was used to process the signals obtained during the test. All the unsteady data were acquired using a specially in-house developed LabVIEW® based multi-channel high-speed data acquisition and processing system.
All the unsteady data were acquired with an input signal bandwidth chosen as 40 kHz, with a sampling frequency of 102.4 kHz. The time duration of data is 8 seconds so that a minimum of 40 blocks with 20,480 scans per block would be available for analysis. Power spectral density analysis has been carried out on the pressure fluctuation data with 819,200 samples and a frequency resolution of 12.5 Hz using a Matlab® program.
2.5 Flow visualization
Shadowgraph images of the flow field were recorded with a single-pass system, using a continuous 220 Watt halogen light source and a Phantom V341 high-speed digital camera. The shadowgraph images were captured at 1,000 frames per second with shutter speeds of 10 microseconds. The surface flow patterns were captured using the conventional technique, which consists of coating the wind tunnel model uniformly with a layer of oil mixture. The oil mixture consists of oleic acid, oil and titanium oxide in a ratio of 1:2:3, respectively.
2.6 Pressure sensitive paint (PSP)
PSP tests were carried out on the test article to obtain the steady surface pressure distribution on the leeward side of the wing. The tests were carried out in CSIR-NAL 0.6m trisonic wind tunnel. The details of the PSP setup adapted in the present tests are described by Raju et al. [Reference Raju and Viswanath39,Reference Raju and Venkatakrishnan40]. More details of the PSP technique and applications may be found in reviews by Gregory et al. [Reference Gregory, Asai, Kameda, Liu and Sullivan41] and Bell et al. [Reference Bell, Schairer, Hand and Mehta42].
The paint used for these tests is binary unicoat, dual-luminophore pressure-sensitive paint supplied by Innovative Scientific Solutions Incorporated®. This paint is an effective quantitative PSP for wind tunnel tests and is suitable for transonic flows where strong pressure variations are present [43]. An utmost care was taken during the painting of the model surface to obtain an even coating.
Excitation of the PSP on the model was provided by a flash lamp system from RAPP® Opto Gmbh, with four light guides attached to four UV anti-reflection-coated quartz optics each consisting of collector and objective lenses emitting in the range of 400 (±10) nm. The light source was triggered externally at 20 Hz, with single pulse duration of 20
 $\mu$
s. Optimum distribution of illumination on the entire model surface was obtained by using four rotatable illuminator heads connected to the lamp system by four 15m long optical fibre cables. The paint emission data was acquired by two air-cooled scientific grade, 12-bit Sensicam CCD slow scan cameras with resolution of
$\mu$
s. Optimum distribution of illumination on the entire model surface was obtained by using four rotatable illuminator heads connected to the lamp system by four 15m long optical fibre cables. The paint emission data was acquired by two air-cooled scientific grade, 12-bit Sensicam CCD slow scan cameras with resolution of
 $1,280 \times 1,024$
pixels. A pressure-sensitive image in the band of 500–600nm and an excitation reference image in the band of 600–700nm was acquired using green transparent and red transparent filter sets, respectively. The acquired image data is then processed using the PSP software developed in-house by NAL. More details about the image registration techniques used in this software are given by Venkatakrishnan [Reference Venkatakrishnan44]. The software uses the resection-based approach, which incorporates the collinearity equations of photogrammetry. A comprehensive camera model, which takes into account the lens distortions as well as errors in identifying marker locations, is used to resect each of the wind-on and wind-off images from both cameras onto a three-dimensional body surface grid, prior to ratioing. A total number of 20 markers were used as control points during the image processing. The image integration time (camera exposure time) was approximately 15 seconds, for each of pressure and reference image (one image each acquired simultaneously from the two cameras), so as to have a large pixel fill ratio in the CCD array (to have large signal to noise ratio). Therefore, with blow-down test duration of about 20 seconds, only one set of images was acquired with sufficient time for flow stabilisation.
$1,280 \times 1,024$
pixels. A pressure-sensitive image in the band of 500–600nm and an excitation reference image in the band of 600–700nm was acquired using green transparent and red transparent filter sets, respectively. The acquired image data is then processed using the PSP software developed in-house by NAL. More details about the image registration techniques used in this software are given by Venkatakrishnan [Reference Venkatakrishnan44]. The software uses the resection-based approach, which incorporates the collinearity equations of photogrammetry. A comprehensive camera model, which takes into account the lens distortions as well as errors in identifying marker locations, is used to resect each of the wind-on and wind-off images from both cameras onto a three-dimensional body surface grid, prior to ratioing. A total number of 20 markers were used as control points during the image processing. The image integration time (camera exposure time) was approximately 15 seconds, for each of pressure and reference image (one image each acquired simultaneously from the two cameras), so as to have a large pixel fill ratio in the CCD array (to have large signal to noise ratio). Therefore, with blow-down test duration of about 20 seconds, only one set of images was acquired with sufficient time for flow stabilisation.
2.7 Uncertainty of measurements
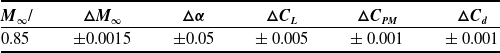
An estimate of the uncertainty of measurements was made by analyzing the data from repeat tests using currently accepted statistical methods, recommended in the AIAA standards document [45,Reference Sundaramurthy and Krishnan46]. Table 2 summarises the uncertainty obtained at M
 $_\infty $
= 0.85. No correction has been applied for tunnel flow angularity, which is of the order of 0.2°.
$_\infty $
= 0.85. No correction has been applied for tunnel flow angularity, which is of the order of 0.2°.
Table 2. Estimation of uncertainty of measurements
3.0 Results and discussions
3.1 Baseline configuration
3.1.1 Aerodynamic force and moment measurement
The experiments were carried out at various free-stream Mach numbers in the range of 0.7 to 1.2. The result showed that the lift force coefficient varies linearly in the range of angle-of-attack tested, for Mach numbers less than 0.7 and more than 1. A sudden loss of lift or a break in the lift curve was observed in the Mach number range of 0.7 to 1.0. The present results (Model blockage = 0.36%) were compared with the reported experimental data on the AGARD-B configuration (Model blockage = 0.056%) [Reference Lombardi, Morelli and Haghiri38] at selected Mach numbers. Figure 4 (a) through (c) show the variation of coefficient of pitching moment (C
 $_{PM}$
) with the lift coefficient (C
$_{PM}$
) with the lift coefficient (C
 $_{L}$
) for
$_{L}$
) for
 $M_{\infty}$
= 0.8, 0.9 and 1.0, respectively. The coefficient of pitching moment and the lift showed a good agreement with the results reported by Lombardi et al. [Reference Lombardi, Morelli and Haghiri38]. It is also interesting to note that the breaks in the coefficients observed in the present results were evident in the results reported by Lombardi et al. [Reference Lombardi, Morelli and Haghiri38]. Figure 4(d) shows the variation of zero lift drag (C
$M_{\infty}$
= 0.8, 0.9 and 1.0, respectively. The coefficient of pitching moment and the lift showed a good agreement with the results reported by Lombardi et al. [Reference Lombardi, Morelli and Haghiri38]. It is also interesting to note that the breaks in the coefficients observed in the present results were evident in the results reported by Lombardi et al. [Reference Lombardi, Morelli and Haghiri38]. Figure 4(d) shows the variation of zero lift drag (C
 $_{d0}$
) with Mach number and the comparison of the experimental data obtained from various wind tunnels. The results available in the literature were obtained on a 0.01% blockage model in AEDC tunnel [Reference Milillo30], 0.2% and 0.5% blockage model in CALSPAN and ONERA tunnel [Reference Valk and Van der Zwaan32], respectively, while the blockage of the test model used in the present study was 0.36%. In general, the zero lift drag showed a scatter over the range of transonic Mach number tested. The present results generally lie in the data band obtained from the literature at Mach numbers between 0.7 to 1.05, but the present results were close to the upper boundary of the data band beyond Mach number of 1.05. The scatter in the zero lift drag values might be due to several factors viz. test section wall configurations, open area ratios, sting support, model blockage etc., which influence the accuracy of the measurements. However, investigation of this aspect was not in the scope of the present study.
$_{d0}$
) with Mach number and the comparison of the experimental data obtained from various wind tunnels. The results available in the literature were obtained on a 0.01% blockage model in AEDC tunnel [Reference Milillo30], 0.2% and 0.5% blockage model in CALSPAN and ONERA tunnel [Reference Valk and Van der Zwaan32], respectively, while the blockage of the test model used in the present study was 0.36%. In general, the zero lift drag showed a scatter over the range of transonic Mach number tested. The present results generally lie in the data band obtained from the literature at Mach numbers between 0.7 to 1.05, but the present results were close to the upper boundary of the data band beyond Mach number of 1.05. The scatter in the zero lift drag values might be due to several factors viz. test section wall configurations, open area ratios, sting support, model blockage etc., which influence the accuracy of the measurements. However, investigation of this aspect was not in the scope of the present study.

Figure 4. Comparison of the present data with the literature (blockage of the model for present tests = 0.36%, Lombardi et al. [Reference Lombardi, Morelli and Haghiri38] = 0.056%, AEDC[Reference Milillo30] = 0.01%, CALSPAN[Reference Valk and Van der Zwaan32] = 0.2% and ONERA[Reference Valk and Van der Zwaan32] = 0.5%).
Since the breaks were evident in the present results and the literature in the Mach number range of 0.7 to 1.0, a detailed investigation was carried out at
 ${M_\infty }$
= 0.85. A typical variation of important aerodynamic coefficients such as lift force coefficient (C
${M_\infty }$
= 0.85. A typical variation of important aerodynamic coefficients such as lift force coefficient (C
 $_L$
), pitching moment coefficient (C
$_L$
), pitching moment coefficient (C
 $_{PM}$
), and drag force coefficient (C
$_{PM}$
), and drag force coefficient (C
 $_d$
) with angle-of-attack (
$_d$
) with angle-of-attack (
 $\alpha $
) obtained at
$\alpha $
) obtained at
 ${M_\infty }$
= 0.85 is shown in Fig. 5 (a) through (c). All the aerodynamic coefficients shown, varied linearly at the lower angle of attack. However, a sudden change or ‘break’ in the aerodynamic quantity was observed at around
${M_\infty }$
= 0.85 is shown in Fig. 5 (a) through (c). All the aerodynamic coefficients shown, varied linearly at the lower angle of attack. However, a sudden change or ‘break’ in the aerodynamic quantity was observed at around
 $\alpha $
= 13.2°. A zoomed view of the data near the break is shown in the inset for clarity. The loss in the lift near the break was significant and resulted in a corresponding sudden nose-up pitching moment (Fig. 5 (b)) and a sudden change in the coefficient of drag force (Fig. 5 (c)). The angle-of-attack where such a break was observed is termed as the critical angle-of-attack in the subsequent discussions. The critical angle-of-attack and corresponding change in important aerodynamic coefficients across it for the test model obtained at various free-stream Mach numbers are tabulated in Table 3.
$\alpha $
= 13.2°. A zoomed view of the data near the break is shown in the inset for clarity. The loss in the lift near the break was significant and resulted in a corresponding sudden nose-up pitching moment (Fig. 5 (b)) and a sudden change in the coefficient of drag force (Fig. 5 (c)). The angle-of-attack where such a break was observed is termed as the critical angle-of-attack in the subsequent discussions. The critical angle-of-attack and corresponding change in important aerodynamic coefficients across it for the test model obtained at various free-stream Mach numbers are tabulated in Table 3.
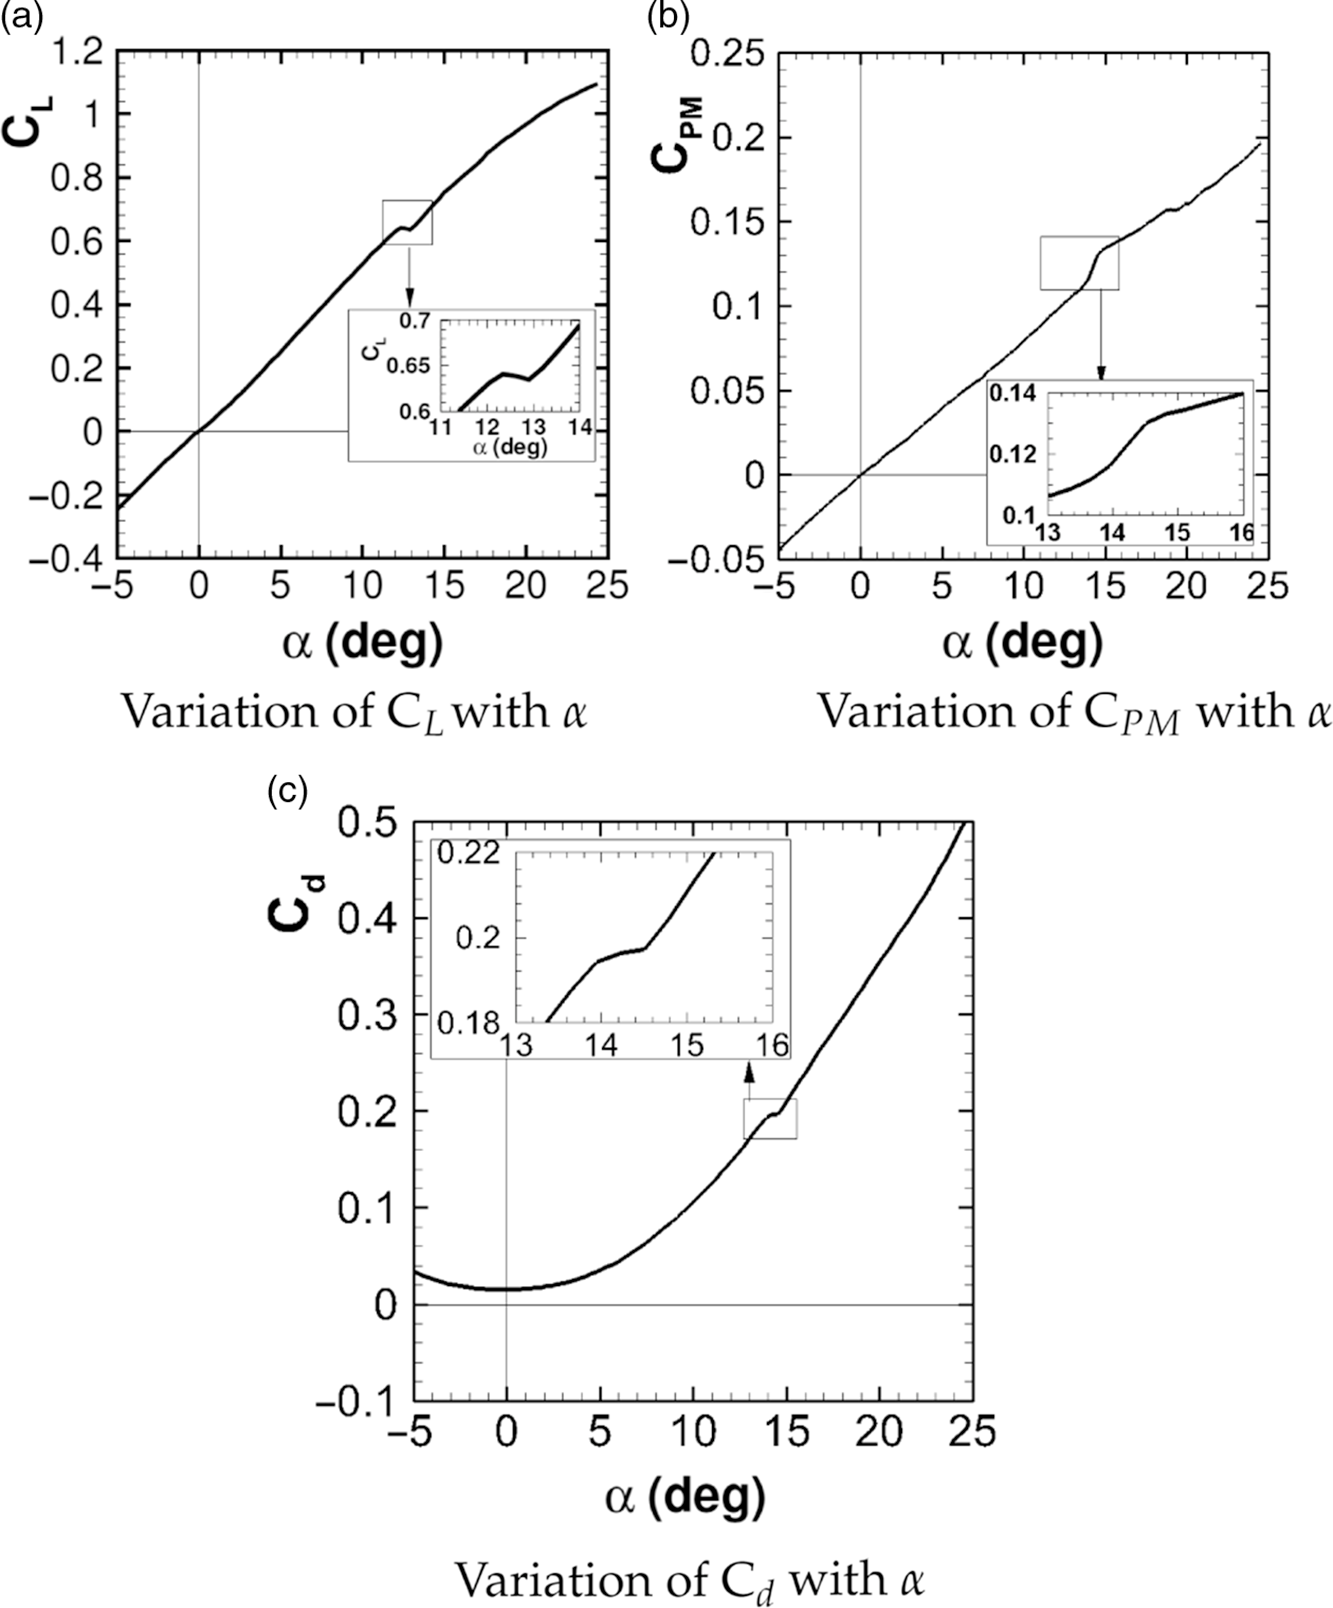
Figure 5. Variation of various aerodynamic coefficients with the angle-of-attack (
 $\alpha$
) at
$\alpha$
) at
 $M_{\infty} = 0.85$
.
$M_{\infty} = 0.85$
.
Table 3. The change in the aerodynamic coefficients across the critical angle-of-attack for the AGARD-B model in the transonic regime

The critical angle-of-attack for various free-stream Mach numbers obtained from the present study were compared with the experimental data from the closed-circuit wind tunnel [Reference Lombardi, Morelli and Haghiri38]. Further, the experimental data available on a 65° swept delta-wing planform alone (without a fuselage) [Reference Elsenaar and Hoeijmakers7,Reference Erickson8] and computational data [Reference Longo12] available on the 60° swept delta-wing planform alone (without a fuselage) is superimposed and presented in Fig. 6. The present data agreed well at at M
 $_\infty $
= 0.8 and 0.9 with the data from the closed-circuit wind tunnel [38]. The computational data [12] available on a 60° swept pure delta-wing planform (without a fuselage) showed a significantly higher value of critical angle-of-attack at M
$_\infty $
= 0.8 and 0.9 with the data from the closed-circuit wind tunnel [38]. The computational data [12] available on a 60° swept pure delta-wing planform (without a fuselage) showed a significantly higher value of critical angle-of-attack at M
 $_\infty $
= 0.8. This shows that the presence of a fuselage reduces the critical angle-of-attack and the observation was consistent with the work reported by Ericsson [Reference Ericsson28].
$_\infty $
= 0.8. This shows that the presence of a fuselage reduces the critical angle-of-attack and the observation was consistent with the work reported by Ericsson [Reference Ericsson28].

Figure 6. Variation of the critical angle-of-attack with free-stream Mach number.
Although the break was observed in the Mach number range of 0.7 to 1.0, a detailed investigation was carried out at the free-stream Mach number of 0.85 and the subsequent discussion is pertinent to the free-stream Mach number of 0.85, unless stated otherwise.
3.1.2 Flow visualisation
In order to investigate the anomaly in the aerodynamic coefficients near the critical angle-of-attack in detail, the surface oil flow visualisation and the shadowgraph were employed at 1
 $^{\circ}$
before and after the critical angle-of-attack and the images obtained on leeward side of wing are shown in Fig. 7 (a) and (b), respectively. The left panel and the right panel of Fig. 7 show the results obtained at approximately 1
$^{\circ}$
before and after the critical angle-of-attack and the images obtained on leeward side of wing are shown in Fig. 7 (a) and (b), respectively. The left panel and the right panel of Fig. 7 show the results obtained at approximately 1
 $^{\circ}$
before and after the critical angle-of-attack, respectively.
$^{\circ}$
before and after the critical angle-of-attack, respectively.
The surface flow features (Fig. 7(a)) obtained showed that the primary separation line (S
 $_1$
) was at the sharp leading edge irrespective of the angle of attack. The flow features captured at
$_1$
) was at the sharp leading edge irrespective of the angle of attack. The flow features captured at
 $\alpha $
= 12.25° showed that the slopes of the primary attachment line (A
$\alpha $
= 12.25° showed that the slopes of the primary attachment line (A
 $_1$
) and the secondary separation line (S
$_1$
) and the secondary separation line (S
 $_2$
) remained constant. These flow features clearly indicate that the vortex was attached to the wing till the trailing edge. The surface streamlines approached the secondary separation line (S
$_2$
) remained constant. These flow features clearly indicate that the vortex was attached to the wing till the trailing edge. The surface streamlines approached the secondary separation line (S
 $_2$
) at a glancing angle indicating that the primary vortex separates without the shock [8]. However, as the angle of attack was increased to
$_2$
) at a glancing angle indicating that the primary vortex separates without the shock [8]. However, as the angle of attack was increased to
 $\alpha $
= 14.3°, a sharp change in the slope of secondary separation line (S
$\alpha $
= 14.3°, a sharp change in the slope of secondary separation line (S
 $_2$
) and an inboard movement of the secondary separation line (S
$_2$
) and an inboard movement of the secondary separation line (S
 $_2$
) was observed at
$_2$
) was observed at
 ${X_C}/{X_{RC}}$
 $ \approx $
0.66. Further, a significant reduction in the axially attached flow (AA) at
$ \approx $
0.66. Further, a significant reduction in the axially attached flow (AA) at
 $\alpha $
= 14.3° was observed as compared to
$\alpha $
= 14.3° was observed as compared to
 $\alpha $
= 12.25°. The surface streamlines approached the secondary separation line (S
$\alpha $
= 12.25°. The surface streamlines approached the secondary separation line (S
 $_2$
) at a sharp angle indicating that the primary vortex separation was shock-induced [Reference Erickson8]. The footprint of a cross-flow shock wave (S
$_2$
) at a sharp angle indicating that the primary vortex separation was shock-induced [Reference Erickson8]. The footprint of a cross-flow shock wave (S
 $_C$
) is highlighted due to the accumulation of oil particles as seen in the image corresponding to
$_C$
) is highlighted due to the accumulation of oil particles as seen in the image corresponding to
 $\alpha $
= 14.3°. The secondary attachment line (A
$\alpha $
= 14.3°. The secondary attachment line (A
 $_2$
) showed an insignificant change with the change in angle-of-attack. The shadowgraph visualisation carried out at an identical angles of attack and M
$_2$
) showed an insignificant change with the change in angle-of-attack. The shadowgraph visualisation carried out at an identical angles of attack and M
 $_\infty $
= 0.85, is shown in Fig. 7(b). The wing root chord is shown in the shadowgraph, however it may be noted that the thickness of the wing is not to the scale and exaggerated for the clarity. The shadowgraph images show a system of curved normal shocks on the leeward side of the wing when the angle-of-attack is increased from 12.25° to 14.3° i.e. when the VB occurs.
$_\infty $
= 0.85, is shown in Fig. 7(b). The wing root chord is shown in the shadowgraph, however it may be noted that the thickness of the wing is not to the scale and exaggerated for the clarity. The shadowgraph images show a system of curved normal shocks on the leeward side of the wing when the angle-of-attack is increased from 12.25° to 14.3° i.e. when the VB occurs.

Figure 7. Visualisation at
 $M_{\infty}$
= 0.85 near the critical angle-of-attack.
$M_{\infty}$
= 0.85 near the critical angle-of-attack.
The shadowgraph images show a two-dimensional, integrated (through line-of-sight) picture of a three-dimensional shock structure. Two disturbances, each at the mid chord of wing and just before trailing edge, are therefore seen in the shadowgraph image. The first and the second disturbance seen at each location correspond to the location of the shock front on the fuselage and to the end of the curved shock spanning over the wing, respectively. For the first disturbance corresponding to the shock present in the mid chord of the wing, the shock foot was traced to the location
 ${X_C}/{X_{RC}}$
 $ \approx $
0.51 on the fuselage centreline. The second disturbance observed, corresponding to the shock present at the mid chord of the wing, yields the location of the shock foot at
$ \approx $
0.51 on the fuselage centreline. The second disturbance observed, corresponding to the shock present at the mid chord of the wing, yields the location of the shock foot at
 ${X_C}/{X_{RC}}$
 $ \approx $
0.58 on the leeward wing. A similar exercise, carried out for the disturbance observed for the shock near the trailing edge of the wing, locates the shock foot at
$ \approx $
0.58 on the leeward wing. A similar exercise, carried out for the disturbance observed for the shock near the trailing edge of the wing, locates the shock foot at
 ${X_C}/{X_{RC}}$
 $ \approx $
0.91 on fuselage and for the second disturbance at the
$ \approx $
0.91 on fuselage and for the second disturbance at the
 $X/D$
of 7 or
$X/D$
of 7 or
 ${X_C}/{X_{RC}}$
 $ \approx $
0.96 on the wing. The shape and the location of these shocks will be discussed in detail later in section 3.1.5. The separated flow behind the trailing edge observed at angle-of-attack of 14.3
$ \approx $
0.96 on the wing. The shape and the location of these shocks will be discussed in detail later in section 3.1.5. The separated flow behind the trailing edge observed at angle-of-attack of 14.3
 $^{\circ}$
is significantly turbulent.
$^{\circ}$
is significantly turbulent.
The sharp change in the slope of the secondary separation line (
 ${S_2}$
) observed on the mid-board indicates that the primary vortex grows in the size as a result of the VB due to a shock-vortex interaction [Reference Kandil, Kandil and Liu11,Reference Schiavetta, Boelens, Crippa, Cummings, Fritz and Badcock16]. As the primary vortex rolls up from the leading edge of the wing and interacts with a shock, it experiences an adverse pressure gradient, which induces a rapid deceleration in its axial motion [Reference Delery1]. The overall suction created on the aft portion of the leeward surface of wing is significantly reduced due to the VB, resulting in a sudden loss of the lift and a corresponding change in the pitching moment. Therefore, the break in aerodynamic coefficients observed in the force and moment data, is due to the VB. Table 3 indicates that despite the AGARD-B being a very simple delta wing-body geometry, it experiences a large variation in longitudinal aerodynamic coefficients at a moderately low angle-of-attack due to the VB at transonic Mach numbers.
${S_2}$
) observed on the mid-board indicates that the primary vortex grows in the size as a result of the VB due to a shock-vortex interaction [Reference Kandil, Kandil and Liu11,Reference Schiavetta, Boelens, Crippa, Cummings, Fritz and Badcock16]. As the primary vortex rolls up from the leading edge of the wing and interacts with a shock, it experiences an adverse pressure gradient, which induces a rapid deceleration in its axial motion [Reference Delery1]. The overall suction created on the aft portion of the leeward surface of wing is significantly reduced due to the VB, resulting in a sudden loss of the lift and a corresponding change in the pitching moment. Therefore, the break in aerodynamic coefficients observed in the force and moment data, is due to the VB. Table 3 indicates that despite the AGARD-B being a very simple delta wing-body geometry, it experiences a large variation in longitudinal aerodynamic coefficients at a moderately low angle-of-attack due to the VB at transonic Mach numbers.
3.1.3 Unsteady pressure measurements
The occurrence of VB on the leeward side of the wing can be associated not only with an increase in the magnitude of unsteady pressure fluctuations or buffet loads in the aft portion of the wing planform but also several unsteady phenomena, which exist in the flow over the delta wings like vortex breakdown oscillation, turbulence downstream of breakdown, helical mode instability, shear layer instabilities, vortex shedding, vortex core rotation, etc [Reference Menke, Yang and Gursul47]. Ideally, a separate study of an aero-elastic wind tunnel model is required to determine the magnitude of the buffet loads. However, localised information regarding the fluctuating flow obtained by analysing the unsteady pressure fluctuations on the aft portion of the wing at a few discrete locations can be an indicator to the magnitude of the buffet loads.
Figure 8 shows the effect of the angle-of-attack on the nondimensional pressure spectra at the inboard location of
 $Z/D$
= −0.863, located at
$Z/D$
= −0.863, located at
 ${X_C}/{X_{RC}}$
= 0.71. The unsteady pressure fluctuations were measured at the discrete angles of attack of 8°, 12° and 15°. The spectral analyses of the pressure fluctuations at an angle-of-attack of 8° showed a very low amplitude of the pressure fluctuations with no dominant frequency peak. However, the distinct peaks centered around
${X_C}/{X_{RC}}$
= 0.71. The unsteady pressure fluctuations were measured at the discrete angles of attack of 8°, 12° and 15°. The spectral analyses of the pressure fluctuations at an angle-of-attack of 8° showed a very low amplitude of the pressure fluctuations with no dominant frequency peak. However, the distinct peaks centered around
 ${S_t}$
of 0.142 and 0.172 were identified at the angles of attack of 12° and 15°, respectively. This frequency is associated with the oscillation of the vortex breakdown location and falls in the range which has been previously identified by Menke et al. [Reference Menke, Yang and Gursul47]. A second distinct peak was also evident at approximately
${S_t}$
of 0.142 and 0.172 were identified at the angles of attack of 12° and 15°, respectively. This frequency is associated with the oscillation of the vortex breakdown location and falls in the range which has been previously identified by Menke et al. [Reference Menke, Yang and Gursul47]. A second distinct peak was also evident at approximately
 ${S_t}$
= 3 at an angle-of-attack of 15°, and is likely to be associated with the helical mode instability and winding. A more detailed description of the spiral mode of breakdown is described by Lambourne and Bryer [Reference Lambourne and Bryer48]. The results clearly indicated that the dominant frequency associated with an oscillation of the vortex breakdown location (
${S_t}$
= 3 at an angle-of-attack of 15°, and is likely to be associated with the helical mode instability and winding. A more detailed description of the spiral mode of breakdown is described by Lambourne and Bryer [Reference Lambourne and Bryer48]. The results clearly indicated that the dominant frequency associated with an oscillation of the vortex breakdown location (
 ${S_t}$
= 0.172) becomes significant from an angle-of-attack of 12° onwards, however, the helical mode instability and winding are found to be present only at an angle-of-attack of 15°. This implies that the formation and an onset of helical mode instability associated with the spiral-type VB was present beyond the critical angle-of-attack.
${S_t}$
= 0.172) becomes significant from an angle-of-attack of 12° onwards, however, the helical mode instability and winding are found to be present only at an angle-of-attack of 15°. This implies that the formation and an onset of helical mode instability associated with the spiral-type VB was present beyond the critical angle-of-attack.

Figure 8. Effect of an angle-of-attack on the unsteady pressure fluctuations measured at
 $Z/D$
= −0.863 and
$Z/D$
= −0.863 and
 $X_{C}/X_{RC}$
= 0.71.
$X_{C}/X_{RC}$
= 0.71.
3.1.4 Steady pressure measurement using PSP technique
In order to get a detailed surface steady pressure distribution on the leeward side of the wing post the VB, tests using pressure sensitive paint (PSP) were carried out on the test model at
 ${M_\infty }$
= 0.85 and
${M_\infty }$
= 0.85 and
 $\alpha $
= 15°. The PSP results were compared with the results obtained at few discrete locations using an electronically scanned pressure scanner (ESP). Fig. 9 shows the surface contour plots of coefficient of pressure (
$\alpha $
= 15°. The PSP results were compared with the results obtained at few discrete locations using an electronically scanned pressure scanner (ESP). Fig. 9 shows the surface contour plots of coefficient of pressure (
 ${C_P}$
) and superimposed 2D plots of the spanwise variation of coefficient of pressure (
${C_P}$
) and superimposed 2D plots of the spanwise variation of coefficient of pressure (
 ${C_P}$
) at the several stream-wise (
${C_P}$
) at the several stream-wise (
 ${X_C}$
/
${X_C}$
/
 ${X_{RC}}$
) locations. A good agreement between the results obtained using PSP and ESP was observed at all the
${X_{RC}}$
) locations. A good agreement between the results obtained using PSP and ESP was observed at all the
 ${X_C}$
/
${X_C}$
/
 ${X_{RC}}$
locations which is of the order of 0.02 in
${X_{RC}}$
locations which is of the order of 0.02 in
 ${C_P}$
.
${C_P}$
.

Figure 9. Comparison of
 $C_{P}$
contours measured using PSP and
$C_{P}$
contours measured using PSP and
 $C_{P}$
measured at discrete locations using ESP obtained on baseline configuration at
$C_{P}$
measured at discrete locations using ESP obtained on baseline configuration at
 $M_{\infty}$
= 0.85,
$M_{\infty}$
= 0.85,
 $\alpha$
= 15
$\alpha$
= 15
 $^{\circ}$
.
$^{\circ}$
.
The surface contour plot of
 ${C_P}$
obtained using the PSP shows that the leading edge vortex creates a considerable suction in the upstream portion of the wing till about
${C_P}$
obtained using the PSP shows that the leading edge vortex creates a considerable suction in the upstream portion of the wing till about
 ${X_C}$
/
${X_C}$
/
 ${X_{RC}}$
= 0.5. The 2D plots at
${X_{RC}}$
= 0.5. The 2D plots at
 ${X_C}$
/
${X_C}$
/
 ${X_{RC}}$
= 0.2, 0.3 and 0.4 clearly show the primary and secondary peaks in
${X_{RC}}$
= 0.2, 0.3 and 0.4 clearly show the primary and secondary peaks in
 ${C_P}$
which are due to the primary and secondary vortices. However, the surface pressure coefficient contours show an abrupt vortex breakdown downstream of
${C_P}$
which are due to the primary and secondary vortices. However, the surface pressure coefficient contours show an abrupt vortex breakdown downstream of
 ${X_C}$
/
${X_C}$
/
 ${X_{RC}}$
 $ \approx $
0.5. It is clear that the vortex system is coherent and strong upstream, however, the vortices disappear quite abruptly in the downstream. The span-wise variation of
$ \approx $
0.5. It is clear that the vortex system is coherent and strong upstream, however, the vortices disappear quite abruptly in the downstream. The span-wise variation of
 ${C_P}$
at
${C_P}$
at
 ${X_C}$
/
${X_C}$
/
 ${X_{RC}}$
= 0.7 and 0.95 is much flatter indicating the absence of primary and secondary vortices in the aft portion of the wing resulting in a loss of suction. It is also interesting to note that the breakdown of secondary vortex occurs slightly upstream of the primary vortex for this test case. The surface contour plot of
${X_{RC}}$
= 0.7 and 0.95 is much flatter indicating the absence of primary and secondary vortices in the aft portion of the wing resulting in a loss of suction. It is also interesting to note that the breakdown of secondary vortex occurs slightly upstream of the primary vortex for this test case. The surface contour plot of
 ${C_P}$
also indicates that the major loss in suction occurs in the inboard region of the wing near the trailing edge.
${C_P}$
also indicates that the major loss in suction occurs in the inboard region of the wing near the trailing edge.
3.1.5 Flow topology based on the experimental investigation
Based on the spanwise pressure distribution obtained through the PSP and the experimental flow visualisation, the shock location was determined and a schematic of the flow topology is shown in Fig. 10. The topology shows that a single shock is observed at around
 ${X_C}/{X_{RC}}$
= 0.7 on the fuselage centreline prior to the vortex breakdown (
${X_C}/{X_{RC}}$
= 0.7 on the fuselage centreline prior to the vortex breakdown (
 $\alpha $
= 12.25°). However, the existence of two spanwise shocks and a cross-flow shock was evident after the vortex breakdown i.e at
$\alpha $
= 12.25°). However, the existence of two spanwise shocks and a cross-flow shock was evident after the vortex breakdown i.e at
 $\alpha $
= 14.3°. Though, the first spanwise shock and the cross-flow shock are located in the vicinity over the wing, it is difficult to comment if the cross flow shock and the first spanwise shock are interconnected. The first shock moves upstream (
$\alpha $
= 14.3°. Though, the first spanwise shock and the cross-flow shock are located in the vicinity over the wing, it is difficult to comment if the cross flow shock and the first spanwise shock are interconnected. The first shock moves upstream (
 ${X_C}/{X_{RC}}$
 $ \approx $
0.5 on fuselage centreline) with an increase in the angle of attack and interacts with the oncoming vortices near the midspan. As seen from the surface flow visualization, there is a reduction in the axially attached flow beyond the critical angle of attack which might be due to an increase in the size of the vortex after bursting. The burst vortex eventually creates a constricted flow passage for the axially attached flow downstream of the first shock (
$ \approx $
0.5 on fuselage centreline) with an increase in the angle of attack and interacts with the oncoming vortices near the midspan. As seen from the surface flow visualization, there is a reduction in the axially attached flow beyond the critical angle of attack which might be due to an increase in the size of the vortex after bursting. The burst vortex eventually creates a constricted flow passage for the axially attached flow downstream of the first shock (
 ${X_C}/{X_{RC}}$
 $ \approx $
0.5 on fuselage centreline) and allows the flow to expand further which is terminated by an another shock at
$ \approx $
0.5 on fuselage centreline) and allows the flow to expand further which is terminated by an another shock at
 ${X_C}/{X_{RC}}$
 $ \approx $
0.9 on the fuselage centreline to match the flow conditions at the trailing edge. The flow topology constructed, clearly indicates the presence of a system of shocks, a shock-induced vortex breakdown and a bulging of the primary vortex as the angle-of-attack is increased beyond the critical angle of attack.
$ \approx $
0.9 on the fuselage centreline to match the flow conditions at the trailing edge. The flow topology constructed, clearly indicates the presence of a system of shocks, a shock-induced vortex breakdown and a bulging of the primary vortex as the angle-of-attack is increased beyond the critical angle of attack.

Figure 10. Schematic of the flow topology before and after the vortex breakdown (VB) at M
 $_\infty$
= 0.85.
$_\infty$
= 0.85.
3.2 Effect of flow control
Based on the literature survey, ‘along the core or near core blowing (ACB)’ [Reference Guillot, Gutmark and Garrison19] on a delta wing delayed the VB at low speeds while a ‘spanwise blowing (SWB)’ [Reference Dixon and Dansby23] on a rectangular wing at the transonic speed showed promise to delay the shock-induced separation. Hence, an experimental investigation was carried out to determine the efficacy of such pneumatic controls and method of blowing for postponement of VB on the AGARD-B configuration at M
 $_\infty$
= 0.85 and an angle-of-attack of 15
$_\infty$
= 0.85 and an angle-of-attack of 15
 $^{\circ}$
, which is post VB (refer Table 3).
$^{\circ}$
, which is post VB (refer Table 3).
The test model was provided with a ‘spanwise blowing (SWB)’ very close to the apex (
 ${X_C}$
/
${X_C}$
/
 ${X_{RC}}$
location of 0.025, 0.06 and 0.1) and ‘along the core blowing (ACB)’ was accommodated at
${X_{RC}}$
location of 0.025, 0.06 and 0.1) and ‘along the core blowing (ACB)’ was accommodated at
 ${X_C}$
/
${X_C}$
/
 ${X_{RC}}$
location of 0.2 and 0.3. The jet was blown through a 1mm diameter opening at the exit at all the locations. Though, it would have been ideal to compare the spanwise blowing (SWB) and along the core blowing (ACB) from an identical
${X_{RC}}$
location of 0.2 and 0.3. The jet was blown through a 1mm diameter opening at the exit at all the locations. Though, it would have been ideal to compare the spanwise blowing (SWB) and along the core blowing (ACB) from an identical
 ${X_C}$
/
${X_C}$
/
 ${X_{RC}}$
location, ACB from close to the apex of the wing was not feasible due to the constraint of the model size. The experimental results obtained using PSP, the unsteady pressure measurements and the force and moment measurements are discussed in the following sections.
${X_{RC}}$
location, ACB from close to the apex of the wing was not feasible due to the constraint of the model size. The experimental results obtained using PSP, the unsteady pressure measurements and the force and moment measurements are discussed in the following sections.
3.2.1 Steady pressure distribution using PSP technique
Figure 11 shows the effect of control jet injection location on the surface contour plot of
 ${C_P}$
and compares it with the baseline case. The jet locations are marked in each of the contour plot for clarity. A single sonic jet, each on starboard and port wing was injected from the same stream wise location (
${C_P}$
and compares it with the baseline case. The jet locations are marked in each of the contour plot for clarity. A single sonic jet, each on starboard and port wing was injected from the same stream wise location (
 ${X_C}$
/
${X_C}$
/
 ${X_{RC}}$
), and the air was drawn from the common source where the required stagnation pressure was held constant during each experiment. The stagnation pressure of the sonic jet for all these cases shown in Fig. 11, was chosen such that the momentum coefficient (
${X_{RC}}$
), and the air was drawn from the common source where the required stagnation pressure was held constant during each experiment. The stagnation pressure of the sonic jet for all these cases shown in Fig. 11, was chosen such that the momentum coefficient (
 $J$
) was 1.38 and corresponding coefficient of blowing (C
$J$
) was 1.38 and corresponding coefficient of blowing (C
 $_\mu $
) obtained was 0.000062. The justification for the selection of momentum coefficient (
$_\mu $
) obtained was 0.000062. The justification for the selection of momentum coefficient (
 $J$
) of 1.38 is discussed in section 3.2.4.
$J$
) of 1.38 is discussed in section 3.2.4.

Figure 11. Surface pressure contours obtained using PSP showing the effect of control jet injection and injection location on AGARD-B configuration at
 $M_{\infty}$
= 0.85,
$M_{\infty}$
= 0.85,
 ${\alpha}$
= 15
${\alpha}$
= 15
 $^{\circ}$
. (
$^{\circ}$
. (
 $J$
= 1.38; C
$J$
= 1.38; C
 $_\mu$
= 0.000062).
$_\mu$
= 0.000062).
The spanwise blowing (SWB) from
 ${X_C}$
/
${X_C}$
/
 ${X_{RC}}$
location of 0.025, 0.06 and 0.1 (Fig. 11 (b), (c), (d)) show a significant improvement in the vortical structure when compared with the baseline case (Fig. 11 (a)). Interestingly, the sonic jet injection is energising the primary and secondary vortex and enhancing the coherence and the strength of the vortex system significantly. Additionally, a significant improvement in the suction is observed in the aft portion of the wing near the wing-fuselage junction. The SWB from
${X_{RC}}$
location of 0.025, 0.06 and 0.1 (Fig. 11 (b), (c), (d)) show a significant improvement in the vortical structure when compared with the baseline case (Fig. 11 (a)). Interestingly, the sonic jet injection is energising the primary and secondary vortex and enhancing the coherence and the strength of the vortex system significantly. Additionally, a significant improvement in the suction is observed in the aft portion of the wing near the wing-fuselage junction. The SWB from
 ${X_C}$
/
${X_C}$
/
 ${X_{RC}}$
location of 0.025, seems to be the most effective in strengthening the primary vortex such that the primary vortex breakdown is pushed downstream to
${X_{RC}}$
location of 0.025, seems to be the most effective in strengthening the primary vortex such that the primary vortex breakdown is pushed downstream to
 ${X_C}$
/
${X_C}$
/
 ${X_{RC}}\approx 0.7$
as against
${X_{RC}}\approx 0.7$
as against
 ${X_C}$
/
${X_C}$
/
 ${X_{RC}}\approx 0.5$
in the baseline case. Similarly, the SWB from
${X_{RC}}\approx 0.5$
in the baseline case. Similarly, the SWB from
 ${X_C}$
/
${X_C}$
/
 ${X_{RC}}$
location of 0.025, energises the secondary vortex such that the secondary vortex breakdown is pushed downstream to
${X_{RC}}$
location of 0.025, energises the secondary vortex such that the secondary vortex breakdown is pushed downstream to
 ${X_C}$
/
${X_C}$
/
 ${X_{RC}}\approx 0.55$
as against
${X_{RC}}\approx 0.55$
as against
 ${X_C}$
/
${X_C}$
/
 ${X_{RC}}\approx 0.45$
in the baseline case. This might be due to the entrainment of the control jet fluid into the oncoming vortex which is eventually fed to the vortex core thus enhancing the axial velocity of the vortex core. The SWB from
${X_{RC}}\approx 0.45$
in the baseline case. This might be due to the entrainment of the control jet fluid into the oncoming vortex which is eventually fed to the vortex core thus enhancing the axial velocity of the vortex core. The SWB from
 ${X_C}$
/
${X_C}$
/
 ${X_{RC}}$
location of 0.06 and 0.1, however, is not able to push the vortex breakdown position downstream significantly as compared with the jet injected from
${X_{RC}}$
location of 0.06 and 0.1, however, is not able to push the vortex breakdown position downstream significantly as compared with the jet injected from
 ${X_C}$
/
${X_C}$
/
 ${X_{RC}}$
location of 0.025. A plausible reason for the reduction in the effectiveness of the SWB from
${X_{RC}}$
location of 0.025. A plausible reason for the reduction in the effectiveness of the SWB from
 ${X_C}$
/
${X_C}$
/
 ${X_{RC}}$
location of 0.06 and 0.1 could be a reduction in the entrainment of the control jet fluid due to the increase in the distance between the injection location and the vortex core.
${X_{RC}}$
location of 0.06 and 0.1 could be a reduction in the entrainment of the control jet fluid due to the increase in the distance between the injection location and the vortex core.
In general, the SWB showed a considerable increase in the suction in the upstream part of the wing till
 ${X_C}$
/
${X_C}$
/
 ${X_{RC}}\approx 0.5$
and in the aft portion of the wing near the wing-fuselage junction. SWB enhanced the coherence and the strength of the vortex system as compared to the baseline case.
${X_{RC}}\approx 0.5$
and in the aft portion of the wing near the wing-fuselage junction. SWB enhanced the coherence and the strength of the vortex system as compared to the baseline case.
Along the core or near core blowing (ACB) from
 ${X_C}$
/
${X_C}$
/
 ${X_{RC}}$
= 0.2 and 0.3 location, did not show a significant improvement in the suction in the upstream part of the wing (till
${X_{RC}}$
= 0.2 and 0.3 location, did not show a significant improvement in the suction in the upstream part of the wing (till
 ${X_C}$
/
${X_C}$
/
 ${X_{RC}}$
0.5) as compared with the baseline case. ACB from
${X_{RC}}$
0.5) as compared with the baseline case. ACB from
 ${X_C}$
/
${X_C}$
/
 ${X_{RC}}$
= 0.2 indicated a marginal improvement in the suction in the inboard and the outboard region of the aft portion of the wing as compared with the baseline case (Fig. 11(e)).
${X_{RC}}$
= 0.2 indicated a marginal improvement in the suction in the inboard and the outboard region of the aft portion of the wing as compared with the baseline case (Fig. 11(e)).
In order to get more clarity of the benefits of SWB closest to the apex of the wing, the pressure distribution obtained using the PSP was extracted at several
 ${X_C}$
/
${X_C}$
/
 ${X_{RC}}$
stations for the flow control case of spanwise blowing (SWB) from
${X_{RC}}$
stations for the flow control case of spanwise blowing (SWB) from
 ${P_1}$
and compared with the baseline case as shown in Fig. 12. The control jet seems to be enhancing the suction significantly at all
${P_1}$
and compared with the baseline case as shown in Fig. 12. The control jet seems to be enhancing the suction significantly at all
 ${X_C}$
/
${X_C}$
/
 ${X_{RC}}$
stations. It is also interesting to note that the spanwise location (
${X_{RC}}$
stations. It is also interesting to note that the spanwise location (
 $Z/D$
) where the peak in the
$Z/D$
) where the peak in the
 ${C_P}$
occurred did not change significantly with the application of SWB indicating that the control jet injection does not alter the vortex core path significantly. Further, the pressure distribution indicated that the vortices were energised due to the control jet and seemed to be generating a higher suction from the apex of the wing till the trailing edge of the wing.
${C_P}$
occurred did not change significantly with the application of SWB indicating that the control jet injection does not alter the vortex core path significantly. Further, the pressure distribution indicated that the vortices were energised due to the control jet and seemed to be generating a higher suction from the apex of the wing till the trailing edge of the wing.
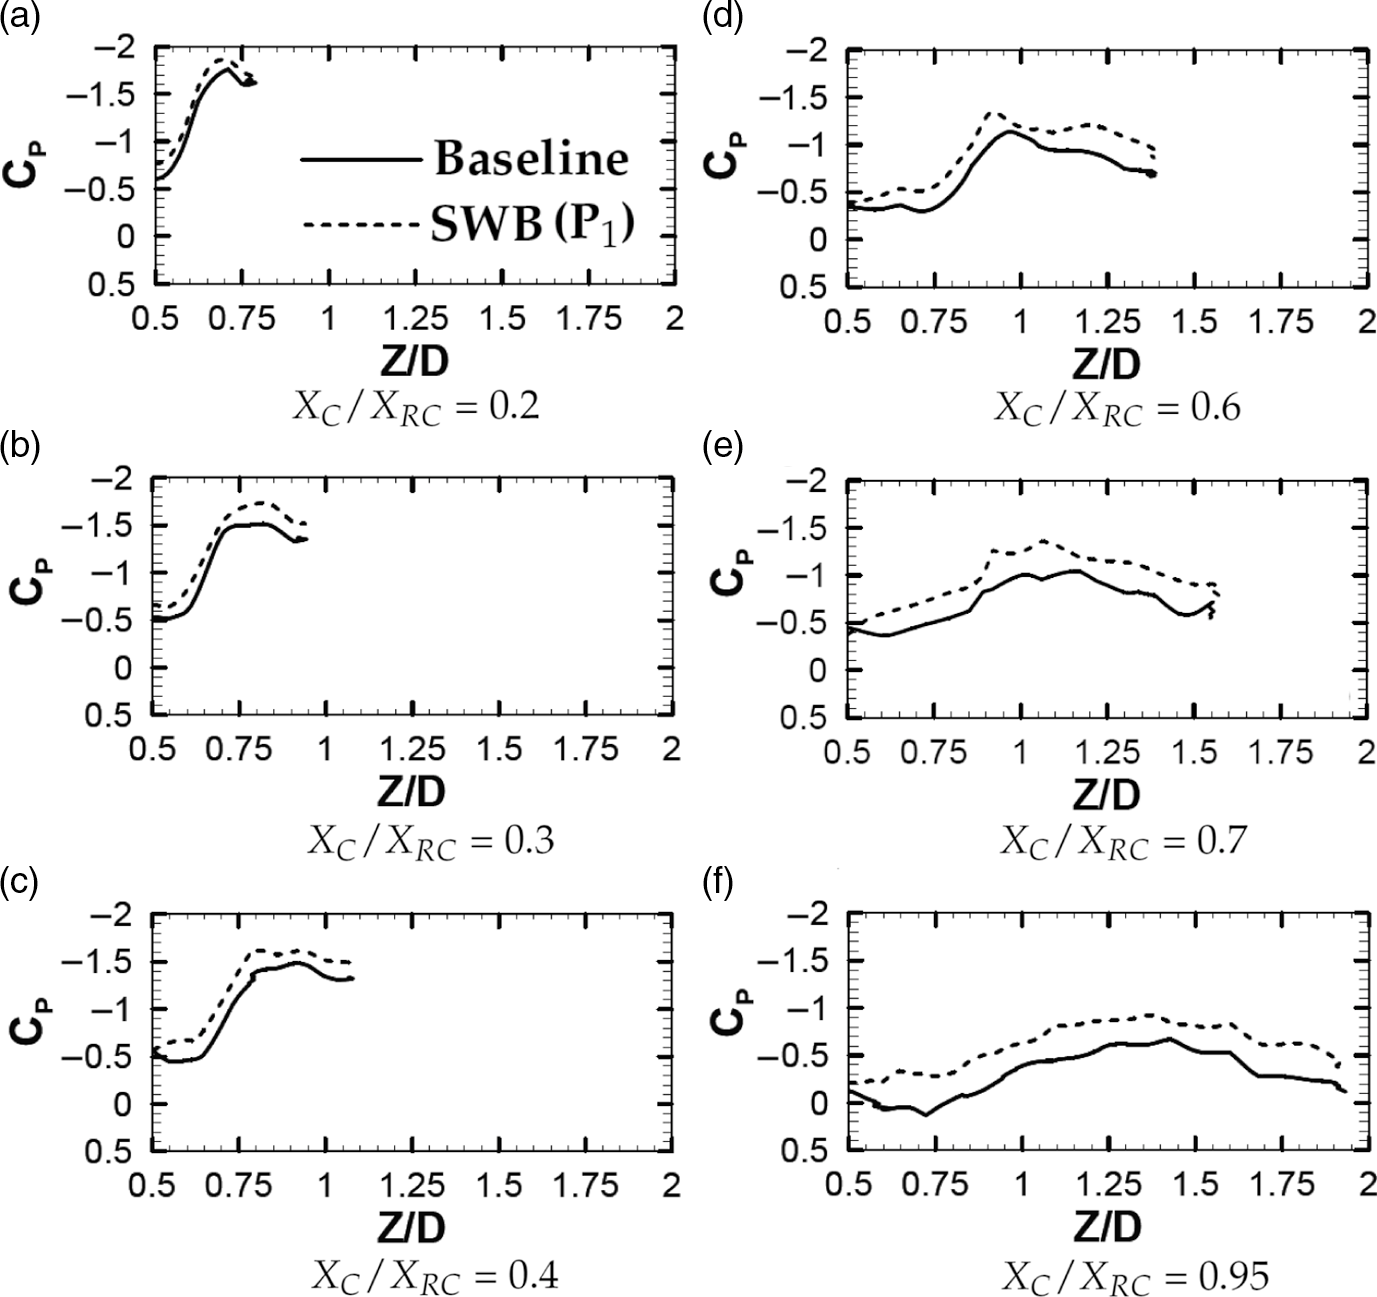
Figure 12. Spanwise variation of
 $C_{P}$
at various
$C_{P}$
at various
 $X_{C}$
/
$X_{C}$
/
 $X_{RC}$
stations showing a comparison of SWB (
$X_{RC}$
stations showing a comparison of SWB (
 $J$
= 1.38; C
$J$
= 1.38; C
 $_\mu$
= 0.0001) from
$_\mu$
= 0.0001) from
 $P_{1}$
location (
$P_{1}$
location (
 $X_{C}$
/
$X_{C}$
/
 $X_{RC}$
= 0.025) with a baseline case at
$X_{RC}$
= 0.025) with a baseline case at
 $M_{\infty}$
= 0.85,
$M_{\infty}$
= 0.85,
 ${\alpha}$
= 15
${\alpha}$
= 15
 $^{\circ}$
.
$^{\circ}$
.
A close inspection of Fig. 11(e) and (f) revealed that ACB at
 ${X_C}$
/
${X_C}$
/
 ${X_{RC}}$
= 0.2 and 0.3 created a higher suction in the upstream part of the starboard wing than that observed on the port wing. The spanwise location of the primary vortex core at
${X_{RC}}$
= 0.2 and 0.3 created a higher suction in the upstream part of the starboard wing than that observed on the port wing. The spanwise location of the primary vortex core at
 ${X_C}$
/
${X_C}$
/
 ${X_{RC}}$
= 0.2 and 0.3 is traced to
${X_{RC}}$
= 0.2 and 0.3 is traced to
 $Z/D \approx $
0.7 and 0.75, respectively, using the spanwise variation of
$Z/D \approx $
0.7 and 0.75, respectively, using the spanwise variation of
 ${C_P}$
plotted in Fig. 12 (a) and (b). It would be of interest to take a note of the fact that the spanwise location (
${C_P}$
plotted in Fig. 12 (a) and (b). It would be of interest to take a note of the fact that the spanwise location (
 $Z/D$
) of
$Z/D$
) of
 ${S_4}$
and
${S_4}$
and
 ${S_5}$
was slightly inboard of the spanwise location of the primary vortex core as compared to the location of
${S_5}$
was slightly inboard of the spanwise location of the primary vortex core as compared to the location of
 ${P_4}$
and
${P_4}$
and
 ${P_5}$
(refer Table 1). Thus, the ACB from the inboard of the spanwise location of the primary vortex core seemed to be more effective in energising the vortices as compared to injecting right underneath or slightly outboard of the primary vortex core as it is done on the port wing.
${P_5}$
(refer Table 1). Thus, the ACB from the inboard of the spanwise location of the primary vortex core seemed to be more effective in energising the vortices as compared to injecting right underneath or slightly outboard of the primary vortex core as it is done on the port wing.
3.2.2 Unsteady pressure measurements
As discussed earlier (refer section 3.1.3), the magnitude of unsteady pressure fluctuations can be a prime indicator for the occurrence of VB and it’s associated unsteady phenomena. The unsteady pressure fluctuations were measured for the control jet injection case and the results are compared with the baseline case. Figure 13 shows the nondimensional pressure spectra of the inboard (
 $Z/D$
= −0.863) and outboard (
$Z/D$
= −0.863) and outboard (
 $Z/D$
= −1.136) kulite transducer i.e.
$Z/D$
= −1.136) kulite transducer i.e.
 ${K_3}$
and
${K_3}$
and
 ${K_4}$
respectively, located at
${K_4}$
respectively, located at
 ${X_C}$
/
${X_C}$
/
 ${X_{RC}}$
= 0.71, for the baseline and the control configuration. Figure 13 (a) and (b) show the spectra obtained at the inboard and the outboard, respectively for the baseline case and the control case when the jet is injected spanwise (SWB)
${X_{RC}}$
= 0.71, for the baseline and the control configuration. Figure 13 (a) and (b) show the spectra obtained at the inboard and the outboard, respectively for the baseline case and the control case when the jet is injected spanwise (SWB)
 ${S_1}$
i.e from
${S_1}$
i.e from
 ${X_C}$
/
${X_C}$
/
 ${X_{RC}}$
= 0.025. The same is shown in Fig. 13 (c) and (d) for the baseline case and control case when jet is injected along the core (ACB) from
${X_{RC}}$
= 0.025. The same is shown in Fig. 13 (c) and (d) for the baseline case and control case when jet is injected along the core (ACB) from
 ${S_5}$
i.e from
${S_5}$
i.e from
 ${X_C}$
/
${X_C}$
/
 ${X_{RC}}$
= 0.3. The nondimensional pressure spectra analyses of the pressure fluctuations, identified three distinct frequencies. Out of these three frequencies, two were dominant frequencies, which appear to be centred around the dimensionless frequencies of
${X_{RC}}$
= 0.3. The nondimensional pressure spectra analyses of the pressure fluctuations, identified three distinct frequencies. Out of these three frequencies, two were dominant frequencies, which appear to be centred around the dimensionless frequencies of
 ${S_t}$
= 0.172 and 0.29. The dominant frequency of
${S_t}$
= 0.172 and 0.29. The dominant frequency of
 ${S_t}$
= 0.172 is associated with the oscillation of the vortex breakdown location and falls in the range which has been previously identified by Menke et al. [Reference Menke, Yang and Gursul47]. The power of the frequency centred around
${S_t}$
= 0.172 is associated with the oscillation of the vortex breakdown location and falls in the range which has been previously identified by Menke et al. [Reference Menke, Yang and Gursul47]. The power of the frequency centred around
 ${S_t}$
= 0.29 was significantly lower compared with the first dominant frequency. The similar trend showing second peak having a very low energy in the spectra were reported by Menke et al. [Reference Menke, Yang and Gursul47], however, this frequency could not be associated with any unsteady phenomena that exist in the flow over delta wings.
${S_t}$
= 0.29 was significantly lower compared with the first dominant frequency. The similar trend showing second peak having a very low energy in the spectra were reported by Menke et al. [Reference Menke, Yang and Gursul47], however, this frequency could not be associated with any unsteady phenomena that exist in the flow over delta wings.

Figure 13. Spectra of nondimensional pressure fluctuations at
 $X_{C}$
/
$X_{C}$
/
 $X_{RC}$
= 0.71 showing the effect of the spanwise blowing (SWB) at
$X_{RC}$
= 0.71 showing the effect of the spanwise blowing (SWB) at
 $X_{C}$
/
$X_{C}$
/
 $X_{RC}$
= 0.025 i.e. at
$X_{RC}$
= 0.025 i.e. at
 $S_{1}$
and along the core blowing (ACB) at
$S_{1}$
and along the core blowing (ACB) at
 $X_{C}$
/
$X_{C}$
/
 $X_{RC}$
= 0.3 i.e. at
$X_{RC}$
= 0.3 i.e. at
 $S_{5}$
location on the AGARD-B configuration at
$S_{5}$
location on the AGARD-B configuration at
 $M_{\infty}$
= 0.85,
$M_{\infty}$
= 0.85,
 ${\alpha}$
= 15
${\alpha}$
= 15
 $^{\circ}$
.
$^{\circ}$
.
A third distinct peak was also evident at approximately
 ${S_t}$
= 3 and is likely associated with the helical mode instability and winding, which was reported by Menke et al. [Reference Menke, Yang and Gursul47]. The helical mode instability, which occurs over the delta wings, is described as a helix of the rotating vortex core filament. The sense of this helix is found to be in the opposite direction to the vortex rotation upstream of breakdown. However, the whole structure also rotates, with the same sense as the vortex core. A detailed description of the spiral mode of breakdown can be found in Lambourne and Bryer [Reference Lambourne and Bryer48].
${S_t}$
= 3 and is likely associated with the helical mode instability and winding, which was reported by Menke et al. [Reference Menke, Yang and Gursul47]. The helical mode instability, which occurs over the delta wings, is described as a helix of the rotating vortex core filament. The sense of this helix is found to be in the opposite direction to the vortex rotation upstream of breakdown. However, the whole structure also rotates, with the same sense as the vortex core. A detailed description of the spiral mode of breakdown can be found in Lambourne and Bryer [Reference Lambourne and Bryer48].
The power spectral analysis showed a significant reduction in the magnitude of unsteady pressure fluctuations with the application of flow control as compared with the baseline case. The peak amplitude corresponding to a dominant frequency (
 ${S_t}$
= 0.172) associated with the oscillation of the vortex breakdown location reduced significantly for the spanwise (SWB) and along the core blowing (ACB) case. This observation is an indication of the downstream movement of the vortex breakdown location. However, the distinct peak at
${S_t}$
= 0.172) associated with the oscillation of the vortex breakdown location reduced significantly for the spanwise (SWB) and along the core blowing (ACB) case. This observation is an indication of the downstream movement of the vortex breakdown location. However, the distinct peak at
 ${S_t}$
= 3 having relatively lower energy content which was corresponding to the helical mode instability and winding, seemed to be affected insignificantly due to the control. ACB from
${S_t}$
= 3 having relatively lower energy content which was corresponding to the helical mode instability and winding, seemed to be affected insignificantly due to the control. ACB from
 ${X_C}$
/
${X_C}$
/
 ${X_{RC}}$
= 0.3, however, showed a slightly broader frequency peak at
${X_{RC}}$
= 0.3, however, showed a slightly broader frequency peak at
 ${S_t}$
= 3 when compared with the baseline case and seemed to moderately alter the helical mode instability.
${S_t}$
= 3 when compared with the baseline case and seemed to moderately alter the helical mode instability.
The overall or cumulative coefficient of fluctuating pressure (
 ${C_{Prms}}$
) integrated over 0 to 40 kHz is tabulated in Table 4 for the baseline case and the flow control case. The
${C_{Prms}}$
) integrated over 0 to 40 kHz is tabulated in Table 4 for the baseline case and the flow control case. The
 ${C_{Prms}}$
value for the control case was compared with the baseline case and a significant reduction in overall coefficient of fluctuating pressure was observed. The reduction in overall unsteady pressure fluctuations at location
${C_{Prms}}$
value for the control case was compared with the baseline case and a significant reduction in overall coefficient of fluctuating pressure was observed. The reduction in overall unsteady pressure fluctuations at location
 ${X_C}$
/
${X_C}$
/
 ${X_{RC}}$
= 0.71 and
${X_{RC}}$
= 0.71 and
 $Z/D = - 0.863$
i.e. inboard location due to SWB from
$Z/D = - 0.863$
i.e. inboard location due to SWB from
 ${X_C}$
/
${X_C}$
/
 ${X_{RC}}$
= 0.025 (i.e
${X_{RC}}$
= 0.025 (i.e
 ${S_1}$
location) and ACB from
${S_1}$
location) and ACB from
 ${X_C}$
/
${X_C}$
/
 ${X_{RC}}$
= 0.3 (i.e
${X_{RC}}$
= 0.3 (i.e
 ${S_5}$
location) was about 8% and 20% respectively. The overall unsteady pressure levels at location
${S_5}$
location) was about 8% and 20% respectively. The overall unsteady pressure levels at location
 ${X_C}$
/
${X_C}$
/
 ${X_{RC}}$
= 0.71 and
${X_{RC}}$
= 0.71 and
 $Z/D = - 1.136$
i.e. outboard location due to SWB from
$Z/D = - 1.136$
i.e. outboard location due to SWB from
 ${X_C}$
/
${X_C}$
/
 ${X_{RC}}$
= 0.025 (i.e
${X_{RC}}$
= 0.025 (i.e
 ${S_1}$
location) increased marginally compared to baseline case however a reduction of 10% was observed due to ACB from
${S_1}$
location) increased marginally compared to baseline case however a reduction of 10% was observed due to ACB from
 ${X_C}$
/
${X_C}$
/
 ${X_{RC}}$
= 0.3 (i.e
${X_{RC}}$
= 0.3 (i.e
 ${S_5}$
location). The overall reduction in the
${S_5}$
location). The overall reduction in the
 ${C_{Prms}}$
measured at
${C_{Prms}}$
measured at
 ${X_C}$
/
${X_C}$
/
 ${X_{RC}}$
= 0.71 was better in case of ACB as compared to the SWB. The reduction in overall coefficient of fluctuating pressure measured at both the locations is higher in case of ACB as compared to SWB. This could be due to the proximity of location of unsteady pressure taps to the location of ACB as compared to the SWB location.
${X_{RC}}$
= 0.71 was better in case of ACB as compared to the SWB. The reduction in overall coefficient of fluctuating pressure measured at both the locations is higher in case of ACB as compared to SWB. This could be due to the proximity of location of unsteady pressure taps to the location of ACB as compared to the SWB location.
Table 4. Experimental results showing effect of pneumatic flow control on overall or cumulative coefficient of unsteady pressure fluctuation (
 $C_{Prms}$
) in the range of 0 to 40 kHz at
$C_{Prms}$
) in the range of 0 to 40 kHz at
 $X_{C}/X_{RC}$
= 0.71
$X_{C}/X_{RC}$
= 0.71

3.2.3 Aerodynamic force and moment measurement
The PSP tests indicated a significant improvement in the suction on the leeward surface of the delta wing by employing a spanwise (SWB) and along the core blowing (ACB). Subsequently, force measurements were carried out on the test model with spanwise blowing (SWB) to capture the overall effect on the aerodynamic coefficients. The test model (baseline configuration) used for the force and moment measurement was suitably modified to accommodate the spanwise blowing (SWB) keeping the sting-balance combination identical. A circular control jet was issued spanwise, through a 0.5mm diameter hole located at
 ${X_C}$
/
${X_C}$
/
 ${X_{RC}}$
= 0.025 i.e. from S
${X_{RC}}$
= 0.025 i.e. from S
 $_1$
and P
$_1$
and P
 $_1$
location. The arrangement required for ‘along the core blowing (ACB)’ could not be accommodated due to the limited space in the force model.
$_1$
location. The arrangement required for ‘along the core blowing (ACB)’ could not be accommodated due to the limited space in the force model.
The control jet was blown spanwise from
 ${X_C}$
/
${X_C}$
/
 ${X_{RC}}$
= 0.025 location in an identical fashion as in case of the PSP tests. The angle-of-attack was varied in the range of −5° to 25° continuously at the rate of 2°/sec. The control jet was blown continuously over the entire angle-of-attack range keeping the jet stagnation pressure constant during the test. The jet stagnation pressure was measured using a GE UNIK® 5,000 transducer of ± 1.72 bar range. The jet momentum coefficient (
${X_{RC}}$
= 0.025 location in an identical fashion as in case of the PSP tests. The angle-of-attack was varied in the range of −5° to 25° continuously at the rate of 2°/sec. The control jet was blown continuously over the entire angle-of-attack range keeping the jet stagnation pressure constant during the test. The jet stagnation pressure was measured using a GE UNIK® 5,000 transducer of ± 1.72 bar range. The jet momentum coefficient (
 $J$
) of 1.38 was maintained for these tests which translated to a coefficient of blowing (C
$J$
) of 1.38 was maintained for these tests which translated to a coefficient of blowing (C
 $_\mu $
) of 0.0002.
$_\mu $
) of 0.0002.
The effect of the spanwise blowing (SWB) on the longitudinal aerodynamic coefficients of the test model at a free-stream Mach number of 0.85 is shown in Fig. 14. The lift force coefficient curve (Fig. 14 (a)) shows that the SWB enhanced the lift force near the critical angle-of-attack while it smoothened the pitching moment curve (Fig. 14 (b)) near the critical angle-of-attack. Further, the coefficient of drag (Fig. 14 (c)) curve was smoothened near the critical angle-of-attack. In general, the SWB shifted the break occurring in baseline case by approximately 2° for all the aerodynamic coefficients.

Figure 14. Effect of spanwise blowing (SWB) on aerodynamic coefficients of AGARD-B configuration at
 $M_{\infty}$
= 0.85.
$M_{\infty}$
= 0.85.
The SWB was further evaluated for the free-stream Mach numbers of 0.8, 0.9 and 0.95, and the similar observations were made; however, detailed results are not presented here for brevity. The changes observed in the aerodynamic coefficients of the test model noted at a typical angle-of-attack post the critical angle-of-attack for a given free-stream Mach number, due to SWB are summarised in Table 5. The negative sign corresponds to a reduction while the positive sign indicate an increase in the aerodynamic coefficients. Overall an enhancement in lift (
 $ {\approx}\ 6{-}9$
%) and lift to drag ratio (
$ {\approx}\ 6{-}9$
%) and lift to drag ratio (
 $ {\approx}\ 4{-}9$
%) was observed depending up on the free-stream Mach number.
$ {\approx}\ 4{-}9$
%) was observed depending up on the free-stream Mach number.
Table 5. Experimental results showing effect of spanwise blowing (SWB) from
 $X_{C}$
/
$X_{C}$
/
 $X_{RC}$
= 0.025 on aerodynamic coefficients of AGARD-B configuration at various free-stream Mach numbers
$X_{RC}$
= 0.025 on aerodynamic coefficients of AGARD-B configuration at various free-stream Mach numbers

3.2.4 Selection of optimum jet momentum coefficient (J)
The local static pressure on the test model where the control jet was injected (i.e. S
 $_1$
and P
$_1$
and P
 $_1$
location) is a function of the free-stream Mach number, angle-of-attack, angle of side slip etc. Hence, the selection of the coefficient of blowing (C
$_1$
location) is a function of the free-stream Mach number, angle-of-attack, angle of side slip etc. Hence, the selection of the coefficient of blowing (C
 $_\mu $
) or momentum coefficient of the jet (
$_\mu $
) or momentum coefficient of the jet (
 $J$
) was an important parameter. In the present experiments, static pressure was measured at the blowing location (P
$J$
) was an important parameter. In the present experiments, static pressure was measured at the blowing location (P
 $_1$
and S
$_1$
and S
 $_1$
) for distinct angles of attack for
$_1$
) for distinct angles of attack for
 ${M_\infty }$
= 0.85. In order to identify the effect of
${M_\infty }$
= 0.85. In order to identify the effect of
 $J$
or C
$J$
or C
 $_\mu $
on the effectiveness of spanwise blowing (SWB), a few experiments were carried out by systematically varying
$_\mu $
on the effectiveness of spanwise blowing (SWB), a few experiments were carried out by systematically varying
 $J$
within the limitation of experimental setup. A comparison of various
$J$
within the limitation of experimental setup. A comparison of various
 $J$
tested and the variation of static pressure at S
$J$
tested and the variation of static pressure at S
 $_1$
location is shown in Fig. 15. It is interesting to note that the
$_1$
location is shown in Fig. 15. It is interesting to note that the
 $J$
= 1.38 condition corresponds to a sonic jet with a free-stream pressure-matched state at the exit,
$J$
= 1.38 condition corresponds to a sonic jet with a free-stream pressure-matched state at the exit,
 $J$
= 0.87 corresponds to a subsonic jet at the exit and
$J$
= 0.87 corresponds to a subsonic jet at the exit and
 $J$
= 2.34 and 3.56 correspond to an under-expanded jet at the exit.
$J$
= 2.34 and 3.56 correspond to an under-expanded jet at the exit.
The effect of
 $J$
on lift force coefficient is shown in Fig. 16. It can be observed that the SWB benefits in delaying the critical angle-of-attack were maximum for
$J$
on lift force coefficient is shown in Fig. 16. It can be observed that the SWB benefits in delaying the critical angle-of-attack were maximum for
 $J$
= 1.38 while SWB with
$J$
= 1.38 while SWB with
 $J$
= 0.87 and 2.34 did not deteriorate the performance significantly. However, the critical angle-of-attack advanced significantly as
$J$
= 0.87 and 2.34 did not deteriorate the performance significantly. However, the critical angle-of-attack advanced significantly as
 $J$
is increased to 3.56, thereby degrading the operational envelope significantly. Although, a jet with a higher momentum coefficient is highly underexpanded at the exit and is capable of adding a higher momentum to the flow, it is stiff and results in a blockage to the oncoming flow. Consequently, a highly underexpanded jet at the exit would probably disrupt the oncoming vortex and would eventually result in a loss in the effectiveness, especially since the blowing was very close to the apex of the wing. On the contrary, it was observed that the sonic jet with a roughly free-stream pressure-matched state at the exit and a lower jet momentum coefficient did not disrupt the growth of leading edge vortices drastically and added the momentum gently to the vortex core in order to postpone the VB.
$J$
is increased to 3.56, thereby degrading the operational envelope significantly. Although, a jet with a higher momentum coefficient is highly underexpanded at the exit and is capable of adding a higher momentum to the flow, it is stiff and results in a blockage to the oncoming flow. Consequently, a highly underexpanded jet at the exit would probably disrupt the oncoming vortex and would eventually result in a loss in the effectiveness, especially since the blowing was very close to the apex of the wing. On the contrary, it was observed that the sonic jet with a roughly free-stream pressure-matched state at the exit and a lower jet momentum coefficient did not disrupt the growth of leading edge vortices drastically and added the momentum gently to the vortex core in order to postpone the VB.

Figure 15. Comparison of variation of coefficient of static pressure (
 $C_{P}$
) at S
$C_{P}$
) at S
 $_1$
location with angle-of-attack and various momentum coefficient (
$_1$
location with angle-of-attack and various momentum coefficient (
 $J$
) tested at
$J$
) tested at
 $M_{\infty}$
= 0.85.
$M_{\infty}$
= 0.85.

Figure 16. Effect of momentum coefficient (
 $J$
) or coefficient of blowing (
$J$
) or coefficient of blowing (
 $C_{\mu}$
) for spanwise blowing (SWB) on lift force coefficients of AGARD-B configuration at
$C_{\mu}$
) for spanwise blowing (SWB) on lift force coefficients of AGARD-B configuration at
 $M_{\infty}$
= 0.85.
$M_{\infty}$
= 0.85.
3.3 Control mechanism
A schematic of a plausible control mechanism to delay the vortex breakdown supported by the experimental observations is shown in Fig. 17. The vortex has a lower pressure at the core which depends on the strength of the vortex.

Figure 17. Schematic of control mechanism for spanwise blowing (SWB) to delay the vortex breakdown (
 $VB$
).
$VB$
).
The vortices are known to create a higher suction and flow could be locally supersonic near the vortex core. When a sonic jet with a pressure-matched state at exit is injected spanwise close to the vortex, the jet fluid is entrained into the vortex core due to the pressure difference and adds momentum to the core. The results reveal that the blowing energises the vortex sufficiently to overcome the adverse pressure gradient posed by a normal shock and pushes the vortex breakdown to a location downstream of the earlier breakdown point. The dashed line shown in Fig. 17 represents the control case.
Interaction of the jet and the vortex depends strongly on the proximity of the nozzle to the core of vortex. The jet fluid is entrained into the core plausibly by direct ingestion into the core or by wrapping around the vortex. For the injection location nearer to the vortex core, the jet is probably ingested into the core of vortex. As the injection location moves away from the vortex core, the jet is probably wrapped or swirled around the core. At the apex of the wing, the vortex core is in close proximity to the injection location. However, the distance of the primary vortex core and the wing-fuselage junction increases as the vortex progresses towards the trailing edge (refer Fig. 17). This would account for the high effectiveness of the jet when issued near the apex of the wing as compared with the jet issued from a downstream location. However, a quantitative diagnostic would be ideal to confirm this observation.
Conclusions
An experimental investigation to understand the shock-induced vortex breakdown on a delta-wing-body configuration at transonic speed and an efficacy of a pneumatic control jet injection and the location of injection to delay the shock-induced vortex breakdown is presented. Experimental data was obtained using measurement of force, steady pressure surface distribution using pressure-sensitive paint, in addition to the unsteady pressure measurement at discrete locations. The investigation of the efficacy of blowing either spanwise or along the vortex core to delay the shock-induced vortex breakdown over delta wings at transonic speeds shows considerable promise for the spanwise blowing flow control approach.
Data from the oil flow visualisations reveal the breakdown of leading-edge vortices and subsequent bulging of the primary vortex, a cross-flow shock and a significant reduction of the axially attached flow at a moderate angle-of-attack. This causes a sudden and significant change in the aerodynamic coefficients at a moderate angle-of-attack.
Measurements of unsteady pressure fluctuations at several discrete locations chosen based on the oil flow visualisation results indicate the presence of distinct frequencies corresponding to oscillation of the vortex breakdown location and helical mode instability and winding.
Limited pressure sensitive paint studies on the leeward surface reveal a coherent and strong vortex system ahead of shock and a collapse of suction peaks in the spanwise pressure distribution behind the shock location indicating a shock-induced vortex breakdown. The spanwise blowing (SWB) near the apex of the delta wing at transonic speed energises the vortical structure, pushes the vortex breakdown location downstream and improves the suction in the aft portion of wing especially near the wing-fuselage junction significantly as compared with the baseline case. A significant reduction in magnitude of unsteady pressure fluctuations of about 8% and 20% is observed with the application of SWB and along the core blowing (ACB) control, respectively.
The force and moment measurements carried out with the presence of blowing indicate that the lift is enhanced significantly near the critical angle-of-attack corresponding to the baseline case. Depending upon the Mach number, this enhancement in lift varied between 6% to 9%, while the corresponding change in lift to drag ratio is between 4% to 9%. The break with aerodynamic coefficients noticed for the baseline case is delayed by about 2°, which can be of significance for the manoeuvering capabilities of the delta-winged aircraft. The probable cause of the improvement can be ascribed to the energy of the vortex structure with spanwise blowing located at the apex of the delta wing. This pushes the vortex breakdown location downstream and improves suction in the aft portion of the wing, especially near the wing-fuselage junction. This is accompanied by a significant reduction of unsteady pressure fluctuations, which can translates to improved aircraft performance. The results show significant benefits in the transonic regime on application of spanwise blowing at the apex of the delta wings.
Acknowledgements
The first author would like to thank Head and Jt. Head, NTAF for their support during this work. The help for the design and fabrication of the test article by Mr. Praveen Jinde and Mr. Tushar Panpate, respectively, is acknowledged with thanks. The first author is grateful to Dr. Sathia Narayanan, Dr. Karthikeyan, Mr. Ashwin and Mr. Ishan Singh for their immense help during PSP tests. The first author also thank Mr. Joshi Kommuri, Dr. Vikramaditya N. S., Dr. K N Murugan, Mr. Bhikshapathi, Mr. Buddhadeb and Mr. N. Gopinath for their help and discussion. The assistance and co-operation rendered by the staff of Drawing office, Model shop, staff of 0.6 m trisonic wind tunnel, and Mr. Baburajan and Mr. Roopesh for assistance in photography is also acknowledged.