


1 Introduction
Owing to its impact on heat transfer, drag and engine performance, laminar–turbulent transition is particularly important in hypersonic boundary layers. In a low-disturbance environment such as flight, this process typically occurs through the growth and breakdown of modal disturbances. For an edge Mach number greater than approximately 4 (over an adiabatic wall), the Mack mode becomes the dominant instability mechanism (Mack Reference Mack1969, Reference Mack1984).
The Mack mode is an inviscid instability that arises when a region of the mean flow becomes supersonic relative to the phase speed of the instability. The result is a layer near the wall that acts as a waveguide where acoustic waves may become trapped (Fedorov Reference Fedorov2011). These waves initially have a small amplitude and behave linearly before ultimately exhibiting nonlinear behaviour at large amplitudes.
Evidence of the nonlinear behaviour of the Mack mode has been observed on many occasions in the past several decades, including in some of the earliest experiments on the topic (Stetson Reference Stetson1988). The first study to take an in-depth look at this nonlinear behaviour was that of Kimmel & Kendall (Reference Kimmel and Kendall1991). They utilized the bicoherence (Kim & Powers Reference Kim and Powers1979) to illustrate the nonlinear self-interaction of Mack-mode waves to form harmonics as well as noting the existence of a carrier waves at a much lower frequency. These experiments were performed in a conventional wind tunnel, and at the time, it was unknown how these features might change in a low-disturbance environment.
The wavelength of the most unstable Mack-mode waves is typically
 $\unicode[STIX]{x1D706}\approx 2\unicode[STIX]{x1D6FF}$
, where
$\unicode[STIX]{x1D706}\approx 2\unicode[STIX]{x1D6FF}$
, where
 $\unicode[STIX]{x1D6FF}$
is the boundary layer thickness. The frequency is therefore proportional to
$\unicode[STIX]{x1D6FF}$
is the boundary layer thickness. The frequency is therefore proportional to
 $u_{e}/\unicode[STIX]{x1D6FF}$
, where
$u_{e}/\unicode[STIX]{x1D6FF}$
, where
 $u_{e}$
is the velocity at the boundary layer edge. For the large
$u_{e}$
is the velocity at the boundary layer edge. For the large
 $u_{e}$
and small
$u_{e}$
and small
 $\unicode[STIX]{x1D6FF}$
typical of hypersonic boundary layers, this leads to dominant fundamental frequencies in the range of
$\unicode[STIX]{x1D6FF}$
typical of hypersonic boundary layers, this leads to dominant fundamental frequencies in the range of
 $f_{0}\sim O(10^{5}{-}10^{6})$
. One of the hallmarks of nonlinear behaviour is sum interactions, which provide energy at frequency components at the sum frequency of two interacting components. For example, one of the most common sum interactions is the generation of harmonics through the self-interaction of
$f_{0}\sim O(10^{5}{-}10^{6})$
. One of the hallmarks of nonlinear behaviour is sum interactions, which provide energy at frequency components at the sum frequency of two interacting components. For example, one of the most common sum interactions is the generation of harmonics through the self-interaction of
 $f_{0}$
to produce
$f_{0}$
to produce
 $2f_{0}$
. Therefore, the frequency response of any measurement system used for investigating this behaviour must be very high. Experiments studying this behaviour are therefore rare.
$2f_{0}$
. Therefore, the frequency response of any measurement system used for investigating this behaviour must be very high. Experiments studying this behaviour are therefore rare.
Past experiments have primarily utilized hot-wire anemometry due to its ability to make off-body measurements with a high frequency response. Following Stetson (Reference Stetson1988), who noted the presence of a
 $2f_{0}$
wave in the spectrum, Kimmel & Kendall (Reference Kimmel and Kendall1991) studied the boundary layer on a Mach 8 cone placed in a conventional wind tunnel. They noted that peaks were observed in the bicoherence in a region corresponding to the generation of a first harmonic. This peak was small, peaking at approximately 0.4 (out of a theoretical maximum of 1) but substantially larger than the noise floor. The rise in bicoherence magnitude also corresponded with the stabilization of the biphase about definite values at the peak location, indicating that the peak corresponded with a great degree of phase coupling between that frequency pair. Additionally, measured amplification rates deviated further from linear theory as the bicoherence magnitude increased. Taken together, this presented a strong case that the high-frequency
$2f_{0}$
wave in the spectrum, Kimmel & Kendall (Reference Kimmel and Kendall1991) studied the boundary layer on a Mach 8 cone placed in a conventional wind tunnel. They noted that peaks were observed in the bicoherence in a region corresponding to the generation of a first harmonic. This peak was small, peaking at approximately 0.4 (out of a theoretical maximum of 1) but substantially larger than the noise floor. The rise in bicoherence magnitude also corresponded with the stabilization of the biphase about definite values at the peak location, indicating that the peak corresponded with a great degree of phase coupling between that frequency pair. Additionally, measured amplification rates deviated further from linear theory as the bicoherence magnitude increased. Taken together, this presented a strong case that the high-frequency
 $2f_{0}$
signal was a harmonic generated by a phase-coupled nonlinear interaction.
$2f_{0}$
signal was a harmonic generated by a phase-coupled nonlinear interaction.
Following up on the study in a conventional tunnel by Kimmel & Kendall (Reference Kimmel and Kendall1991), Chokani (Reference Chokani1999) revisited the problem in a quiet Mach 6 wind tunnel to compare the spectral dynamics with that of the conventional facility. Data were collected in the boundary layer over a cone with two new features designed to further destabilize the Mack mode: a flared afterbody and a cooled surface. These experiments showed behaviour that was largely consistent with the earlier work, including a nonlinear regime dominated by fundamental resonance. The study also noted several new features, including a second harmonic at
 $3f_{0}$
, a low-frequency modulation and interactions corresponding to the ‘spectral broadening’ effect commonly observed just before transition.
$3f_{0}$
, a low-frequency modulation and interactions corresponding to the ‘spectral broadening’ effect commonly observed just before transition.
Chokani (Reference Chokani2005) later expanded on the analysis performed in Chokani (Reference Chokani1999) by including the difference portion of the principal domain of the bicoherence spectrum as well as utilizing a demodulation technique to explore the details of the previously observed carrier wave. They utilized what was described as the cross-bicoherence and reported evidence of a
 $f_{0}{-}f_{0}$
interaction feeding energy back into the mean flow preceding the development of the first harmonic. At later stages, they also observed
$f_{0}{-}f_{0}$
interaction feeding energy back into the mean flow preceding the development of the first harmonic. At later stages, they also observed
 $2f_{0}{-}2f_{0}$
and
$2f_{0}{-}2f_{0}$
and
 $2f_{0}{-}f_{0}$
interactions later in the process just prior to the onset of the spectral filling phenomenon. The demodulation revealed that the low-frequency amplitude modulation that appears in the bispectrum arises in both the
$2f_{0}{-}f_{0}$
interactions later in the process just prior to the onset of the spectral filling phenomenon. The demodulation revealed that the low-frequency amplitude modulation that appears in the bispectrum arises in both the
 $f_{0}$
and
$f_{0}$
and
 $2f_{0}$
components. However, the bispectral analysis was based on the data recorded by Blanchard & Selby (Reference Blanchard and Selby1996), which did not acquire data simultaneously at two points, a necessary condition for the use of the cross-bicoherence. For single-point measurements, only the auto-bicoherence may be calculated. Due to the symmetry of the Fourier transform, the difference interactions obtained from the auto-bicoherence are comprised of redundant information and no distinction can be made between them and the sum interactions of the same three wave triplets. It is therefore unclear whether the results of Chokani (Reference Chokani2005) unambiguously represent true difference interactions.
$2f_{0}$
components. However, the bispectral analysis was based on the data recorded by Blanchard & Selby (Reference Blanchard and Selby1996), which did not acquire data simultaneously at two points, a necessary condition for the use of the cross-bicoherence. For single-point measurements, only the auto-bicoherence may be calculated. Due to the symmetry of the Fourier transform, the difference interactions obtained from the auto-bicoherence are comprised of redundant information and no distinction can be made between them and the sum interactions of the same three wave triplets. It is therefore unclear whether the results of Chokani (Reference Chokani2005) unambiguously represent true difference interactions.
Bountin, Shiplyuk & Maslov (Reference Bountin, Shiplyuk and Maslov2008) later performed experiments on a sharp cone with straight sides in a conventional Mach 5.95 wind tunnel. These experiments introduced artificially generated wavepackets to the boundary layer in order to study interactions at a higher amplitude than would naturally occur. This study made several notable observations. It identified a peak corresponding to a dominant subharmonic resonance of the Mack mode with detuning, possibly involving first-mode waves. This corresponded to one of the mechanisms investigated by Craik (Reference Craik1971) in subsonic boundary layers. It also indicated that the region of highest nonlinear activity was not located exactly at the peak of maximum overall root mean square (r.m.s.) fluctuations, but instead along the upper edge of that peak.
Recent direct numerical simulations (DNS) have further studied this phenomenon. Sivasubramanian & Fasel (Reference Sivasubramanian and Fasel2014) simulated an artificial wavepacket introduced near the tip of a flared cone, the Fourier spectrum of which produces a broadband input. They observed evidence of both fundamental and subharmonic resonance in the nonlinear transition process and noted that the fundamental resonance appeared much stronger. A follow-up study was performed (Sivasubramanian & Fasel Reference Sivasubramanian and Fasel2015) in which controlled input was provided along an azimuthally periodic strip near the leading edge. The resulting breakdown scenario qualitatively matched the experiments performed (Ward et al. Reference Ward, Wheaton, Chou, Berridge, Letterman, Luersen and Schneider2012), and it was conjectured that fundamental resonance was the dominant ‘natural’ breakdown mechanism in a hypersonic quiet tunnel. A second follow-up study was performed by Hader & Fasel (Reference Hader and Fasel2018) in which natural transition was simulated using stochastic forcing in the free stream and allowing the boundary layer to develop without any initial spanwise input. The results again matched the previous DNS and experiments, providing strong evidence of a fundamental breakdown.
The present work is based on the data collected by Hofferth et al. (Reference Hofferth, Humble, Floryan and Saric2013), which used a focusing schlieren system to make high-frequency measurements of the Mack mode over a flared cone in a Mach 6 quiet tunnel. Using the auto-bicoherence due to the single-point nature of the measurements and by varying Reynolds number via total pressure (as opposed to changing streamwise station), the hot-wire results of Chokani (Reference Chokani1999, Reference Chokani2005) were qualitatively reproduced. In the present work, new features of the bispectrum are observed and additional insight is gained about the nonlinear breakdown process of waves associated with the Mack mode. The experimental apparatus and methods are detailed in § 2. A brief discussion of the analysis techniques employed, including the bispectrum, is given in § 3 in order to orient the reader to the analysis of the results presented in § 4, followed by concluding remarks in § 5.
2 Experimental apparatus and method
2.1 Wind tunnel
Experiments were performed in the Mach 6 Quiet Tunnel (M6QT) at Texas A&M University (TAMU). This facility was the result of an effort to design quiet, hypersonic facilities at NASA Langley Research Center spanning several decades and culminating in the 1990s with the M6QT (Chen, Wilkinson & Beckwith Reference Chen, Wilkinson and Beckwith1993; Blanchard, Lachowicz & Wilkinson Reference Blanchard, Lachowicz and Wilkinson1997). The settling chamber and nozzle were then transferred to TAMU in 2005 where they were refurbished (including re-polishing the nozzle) and integrated into the infrastructure at the National Aerothermochemistry Laboratory (NAL). Initial flow quality testing (Hofferth, Bowersox & Saric Reference Hofferth, Bowersox and Saric2010) showed that tunnel performance was consistent with Blanchard et al. (Reference Blanchard, Lachowicz and Wilkinson1997) with free-stream fluctuation levels of
 $p_{t2,rms}^{\prime }/p_{t2}\leqslant 0.05\,\%$
in the quiet core (where
$p_{t2,rms}^{\prime }/p_{t2}\leqslant 0.05\,\%$
in the quiet core (where
 $p_{t2}$
is the test-section Pitot pressure).
$p_{t2}$
is the test-section Pitot pressure).

Figure 1. Schematic of the Langley 93-10 flared cone model. The 43 thermocouples along the flared section are more closely spaced (
 $\unicode[STIX]{x0394}z=6.35~\text{mm}$
) than the 8 on the straight section (
$\unicode[STIX]{x0394}z=6.35~\text{mm}$
) than the 8 on the straight section (
 $\unicode[STIX]{x0394}z=25.4~\text{mm}$
).
$\unicode[STIX]{x0394}z=25.4~\text{mm}$
).
In its present configuration at TAMU, M6QT is a pressure-vacuum blowdown tunnel with approximately 40 s of constant-condition run time. The facility is capable of quiet operation in the range
 $4.6\times 10^{6}~\text{m}^{-1}\leqslant Re^{\prime }\leqslant 11.0\times 10^{6}~\text{m}^{-1}$
, corresponding to a settling chamber pressure of approximately
$4.6\times 10^{6}~\text{m}^{-1}\leqslant Re^{\prime }\leqslant 11.0\times 10^{6}~\text{m}^{-1}$
, corresponding to a settling chamber pressure of approximately
 $400~\text{kPa}\leqslant p_{t1}\leqslant 950~\text{kPa}$
. Prior to each run, the tunnel is convectively preheated to avoid oxygen liquefaction in the test section as well as provide a more stable total temperature while data are collected. The data in the present experiments were collected during a single wind tunnel run by collecting data throughout the course of a slow pressure sweep. The pressure ranged from approximately 70 to 150 psia, corresponding to
$400~\text{kPa}\leqslant p_{t1}\leqslant 950~\text{kPa}$
. Prior to each run, the tunnel is convectively preheated to avoid oxygen liquefaction in the test section as well as provide a more stable total temperature while data are collected. The data in the present experiments were collected during a single wind tunnel run by collecting data throughout the course of a slow pressure sweep. The pressure ranged from approximately 70 to 150 psia, corresponding to
 $7.8\times 10^{6}~\text{m}^{-1}\leqslant \mathit{Re}^{\prime }\leqslant 11.0\times 10^{6}~\text{m}^{-1}$
. The data were segmented into blocks 100 ms in length for analysis. Over an individual block, the rate of
$7.8\times 10^{6}~\text{m}^{-1}\leqslant \mathit{Re}^{\prime }\leqslant 11.0\times 10^{6}~\text{m}^{-1}$
. The data were segmented into blocks 100 ms in length for analysis. Over an individual block, the rate of
 $p_{t1}$
increase ranged from
$p_{t1}$
increase ranged from
 $20.4$
to
$20.4$
to
 $49.5~\text{kPa}~\text{s}^{-1}$
, corresponding to changes in total pressure over single blocks ranging from 0.19 to 0.65 % respectively. Similar analysis of the temperature drift showed a range of 0.005–0.07 % in
$49.5~\text{kPa}~\text{s}^{-1}$
, corresponding to changes in total pressure over single blocks ranging from 0.19 to 0.65 % respectively. Similar analysis of the temperature drift showed a range of 0.005–0.07 % in
 $T_{0}$
over a single block. Therefore,
$T_{0}$
over a single block. Therefore,
 $p_{t1}$
and
$p_{t1}$
and
 $T_{0}$
were treated as constant over each block. Reynolds number was calculated based on the measured reservoir conditions and an estimate of free-stream viscosity based on the formula by Keyes (Reference Keyes1951), which performs better than the common Sutherland formula at the low free-stream temperatures common in low-enthalpy facilities.
$T_{0}$
were treated as constant over each block. Reynolds number was calculated based on the measured reservoir conditions and an estimate of free-stream viscosity based on the formula by Keyes (Reference Keyes1951), which performs better than the common Sutherland formula at the low free-stream temperatures common in low-enthalpy facilities.
2.2 Model
The present experiment was performed on the Langley 93-10 flared cone model previously used by Lachowicz, Chokani & Wilkinson (Reference Lachowicz, Chokani and Wilkinson1996), Doggett, Chokani & Wilkinson (Reference Doggett, Chokani and Wilkinson1997) and Horvath et al. (Reference Horvath, Berry, Hollis, Chang and Singer2002). It is 0.508 m (20 in.) in length. The first 0.254 mm (10 in.) is a right circular cone with semivertex angle
 $5^{\circ }$
. The downstream 0.254 m (10 in.) of the model is flared with a constant radius of 2.36 m (93.071 in.). A schematic of the model is shown in figure 1. Flared cones have shown great utility in the study of the Mack mode due to the destabilizing effect of the adverse pressure gradient.
$5^{\circ }$
. The downstream 0.254 m (10 in.) of the model is flared with a constant radius of 2.36 m (93.071 in.). A schematic of the model is shown in figure 1. Flared cones have shown great utility in the study of the Mack mode due to the destabilizing effect of the adverse pressure gradient.
The walls of the model are constructed of stainless steel and are approximately 1.8 mm in thickness, except at the thermocouple locations, where the thickness is 0.8 mm. The thin walls are heated during the convective tunnel preheat to just above
 $T_{w}/T_{aw}=1$
, where
$T_{w}/T_{aw}=1$
, where
 $T_{aw}$
is the adiabatic wall temperature, to
$T_{aw}$
is the adiabatic wall temperature, to
 $T_{w}/T_{aw}\approx 1.1$
. During the course of the run, the wall temperature ratio approaches
$T_{w}/T_{aw}\approx 1.1$
. During the course of the run, the wall temperature ratio approaches
 $T_{w}/T_{aw}=1.0$
. By the time data collection begins, the temperature has stabilized to approximately
$T_{w}/T_{aw}=1.0$
. By the time data collection begins, the temperature has stabilized to approximately
 $T_{aw}\pm 1~\text{K}$
, corresponding to approximately
$T_{aw}\pm 1~\text{K}$
, corresponding to approximately
 $0.99\leqslant T_{w}/T_{aw}\leqslant 1.01$
while the boundary layer remains laminar. Once the unit Reynolds number (
$0.99\leqslant T_{w}/T_{aw}\leqslant 1.01$
while the boundary layer remains laminar. Once the unit Reynolds number (
 $\mathit{Re}^{\prime }$
) becomes sufficiently high, the boundary layer on the nozzle wall becomes turbulent, leading to both a higher adiabatic wall temperature and a turbulent cone boundary layer. Figure 2 depicts a typical temperature trace at a single station on the model (in this case at
$\mathit{Re}^{\prime }$
) becomes sufficiently high, the boundary layer on the nozzle wall becomes turbulent, leading to both a higher adiabatic wall temperature and a turbulent cone boundary layer. Figure 2 depicts a typical temperature trace at a single station on the model (in this case at
 $z=381~\text{mm}$
, where
$z=381~\text{mm}$
, where
 $z$
is the axial coordinate). Note that around
$z$
is the axial coordinate). Note that around
 $t=46~\text{s}$
into the run, the temperature of the model surface rises rapidly as the free stream becomes noisy. After this time, the wall never achieves an adiabatic condition before the end of the run. Further discussion of this phenomenon is given in § 4.1.
$t=46~\text{s}$
into the run, the temperature of the model surface rises rapidly as the free stream becomes noisy. After this time, the wall never achieves an adiabatic condition before the end of the run. Further discussion of this phenomenon is given in § 4.1.
While the model was mounted in the tunnel at nominally
 $0^{\circ }$
angle of incidence, subsequent investigation of the difference between these data and computations revealed a slight angle to be present. The model was found to have an angle of attack of
$0^{\circ }$
angle of incidence, subsequent investigation of the difference between these data and computations revealed a slight angle to be present. The model was found to have an angle of attack of
 $\unicode[STIX]{x1D6FC}=0.09\pm 0.1^{\circ }$
and a yaw of
$\unicode[STIX]{x1D6FC}=0.09\pm 0.1^{\circ }$
and a yaw of
 $\unicode[STIX]{x1D6FD}=0\pm 0.1^{\circ }$
. See the appendix of Hofferth et al. (Reference Hofferth, Humble, Floryan and Saric2013) for more detail.
$\unicode[STIX]{x1D6FD}=0\pm 0.1^{\circ }$
. See the appendix of Hofferth et al. (Reference Hofferth, Humble, Floryan and Saric2013) for more detail.

Figure 2. Trace of
 $T_{w}$
over time at
$T_{w}$
over time at
 $z=381~\text{mm}$
. Note the dramatic rise in temperature when the flow becomes turbulent.
$z=381~\text{mm}$
. Note the dramatic rise in temperature when the flow becomes turbulent.
2.3 Measurement technique
The present study utilizes a focusing schlieren system to make high-frequency measurements of the Mack-mode waves. Focusing schlieren systems are similar to a traditional schlieren system with several key changes in order to achieve a finite depth of field (Weinstein Reference Weinstein1993; Settles Reference Settles2001; Settles & Hargather Reference Settles and Hargather2017). The system utilizes a Fresnel lens (per Boedeker Reference Boedeker1959) in order to dramatically increase the amount of light being directed through the test volume. In place of a single knife-edge cutoff, the focusing schlieren system utilizes a matched pair of grids: a source grid upbeam of the test volume and a cutoff grid downbeam. The two grids are photographic negatives of one another and function as an array of cutoffs.
The most important specification for this system is the depth of field. At approximately 25 mm (1 in.), this is small enough to isolate the density gradient fluctuations due to the Mack mode from outside sources of noise such as the nozzle wall shear layers or window defects. Additional detailed specifications and sizing for the system used presently (depicted schematically in figure 3) are given in Hofferth et al. (Reference Hofferth, Humble, Floryan and Saric2013).

Figure 3. Schematic of the focusing schlieren system.
Optical access was provided into the test section by a pair of high-quality optical flats. In order to achieve a sufficiently high sampling rates, data were collected using a fibre optic connected to a Thor Labs APD110A avalanche photodetector. The fibre optic was positioned in the schlieren image so that the measurement location corresponded to
 $z=495~\text{mm}$
along the cone’s axis and
$z=495~\text{mm}$
along the cone’s axis and
 $r\approx 0.8\unicode[STIX]{x1D6FF}\approx 1.3~\text{mm}$
above the surface, centred approximately at the location of maximum r.m.s. mass flux fluctuations (Hofferth & Saric Reference Hofferth and Saric2012). The diameter of the fibre optic in the image plane was approximately
$r\approx 0.8\unicode[STIX]{x1D6FF}\approx 1.3~\text{mm}$
above the surface, centred approximately at the location of maximum r.m.s. mass flux fluctuations (Hofferth & Saric Reference Hofferth and Saric2012). The diameter of the fibre optic in the image plane was approximately
 $\unicode[STIX]{x1D6FF}/2$
, leading to spatial averaging. The output of photodetector was passed through a Stanford Research Systems preamplifier. It was bandpass filtered in the range of
$\unicode[STIX]{x1D6FF}/2$
, leading to spatial averaging. The output of photodetector was passed through a Stanford Research Systems preamplifier. It was bandpass filtered in the range of
 $1~\text{kHz}\leqslant f\leqslant 1~\text{MHz}$
and a roll off of
$1~\text{kHz}\leqslant f\leqslant 1~\text{MHz}$
and a roll off of
 $-6~\text{dB}~\text{decade}^{-1}$
. Both the raw and amplified signals were sampled at 2 MHz, allowing frequencies up to 1 MHz to be resolved in the data.
$-6~\text{dB}~\text{decade}^{-1}$
. Both the raw and amplified signals were sampled at 2 MHz, allowing frequencies up to 1 MHz to be resolved in the data.
The spatial averaging has three primary effects on the results. First, and the reason this diameter was selected, is that it allows more light to enter the detector. A smaller optical fibre was found to capture insufficient light for a strong signal using the available light sources. Second, Bountin et al. (Reference Bountin, Shiplyuk and Maslov2008) showed that nonlinear interactivity is more intense above and below the location of maximum r.m.s. fluctuations. The effects of this wall-normal dependence in the nonlinear interactions could therefore not be studied with these measurements. Finally, as
 $\mathit{Re}^{\prime }$
increases throughout a run, the boundary layer thins but the optical fibre remains stationary. The large measurement area therefore allows the regions with large fluctuations to remain within the field of view of the measurement system even as its location slowly changes.
$\mathit{Re}^{\prime }$
increases throughout a run, the boundary layer thins but the optical fibre remains stationary. The large measurement area therefore allows the regions with large fluctuations to remain within the field of view of the measurement system even as its location slowly changes.
The spatial averaging also results in a loss of signal-to-noise ratio (SNR) for waves with a wavelength less than or equal to the width of the fibre. For example, consider a wave propagating across the field of view with
 $\unicode[STIX]{x1D706}=\unicode[STIX]{x1D6FF}/n$
where
$\unicode[STIX]{x1D706}=\unicode[STIX]{x1D6FF}/n$
where
 $n$
is a positive integer. If one integrates the light intensity of this wave in a single line across the diameter of the fibre, the result is zero. Any slight deviation from this wavelength would result in a non-zero integrated light intensity.
$n$
is a positive integer. If one integrates the light intensity of this wave in a single line across the diameter of the fibre, the result is zero. Any slight deviation from this wavelength would result in a non-zero integrated light intensity.
There are several important considerations as a result of this. First, the Mack-mode results in waves that are two-dimensional (2-D) and will have considerable signal available to the optical fibre both above and below the diameter, and any chord chosen parallel to the diameter will have a smaller integration length than the diameter. Therefore, the above-hypothesized wave may have zero signal along the diameter, but along every other chord the signal will be non-zero. Second, any slight deviation from
 $\unicode[STIX]{x1D706}=\unicode[STIX]{x1D6FF}/n$
will result in a non-zero signal even along the diameter. This signal can be quite small if
$\unicode[STIX]{x1D706}=\unicode[STIX]{x1D6FF}/n$
will result in a non-zero signal even along the diameter. This signal can be quite small if
 $\unicode[STIX]{x1D706}\approx \unicode[STIX]{x1D6FF}/n$
, but the 2-D nature of the waves again means that there will be some chord over which the signal is quite strong. However, given that any positive
$\unicode[STIX]{x1D706}\approx \unicode[STIX]{x1D6FF}/n$
, but the 2-D nature of the waves again means that there will be some chord over which the signal is quite strong. However, given that any positive
 $n$
results in some location where this phenomenon occurs, waves with small wavelengths such as these will experience a smaller SNR than waves whose wavelengths are large.
$n$
results in some location where this phenomenon occurs, waves with small wavelengths such as these will experience a smaller SNR than waves whose wavelengths are large.
In the context of the present experiment, the wavelength of the fundamental is
 $\unicode[STIX]{x1D706}_{0}\approx 2\unicode[STIX]{x1D6FF}$
. This means that the harmonic of number
$\unicode[STIX]{x1D706}_{0}\approx 2\unicode[STIX]{x1D6FF}$
. This means that the harmonic of number
 $n$
will have a frequency of
$n$
will have a frequency of
 $(n+1)f_{0}$
and a wavelength of
$(n+1)f_{0}$
and a wavelength of
 $\unicode[STIX]{x1D706}_{n}\approx 2\unicode[STIX]{x1D6FF}/(n+1)$
. The third harmonic (
$\unicode[STIX]{x1D706}_{n}\approx 2\unicode[STIX]{x1D6FF}/(n+1)$
. The third harmonic (
 $n=3$
, corresponding to
$n=3$
, corresponding to
 $4f_{0}$
) has wavelength
$4f_{0}$
) has wavelength
 $\unicode[STIX]{x1D706}_{3}\approx \unicode[STIX]{x1D6FF}/2$
, or approximately the same as the fibre diameter, and the above discussion becomes pertinent. While
$\unicode[STIX]{x1D706}_{3}\approx \unicode[STIX]{x1D6FF}/2$
, or approximately the same as the fibre diameter, and the above discussion becomes pertinent. While
 $4f_{0}$
is greater than the Nyquist frequency for higher
$4f_{0}$
is greater than the Nyquist frequency for higher
 $Re_{z}$
values, it is resolvable at lower
$Re_{z}$
values, it is resolvable at lower
 $Re_{z}$
. Any conclusions drawn about
$Re_{z}$
. Any conclusions drawn about
 $4f_{0}$
must therefore bear this limitation in mind.
$4f_{0}$
must therefore bear this limitation in mind.
3 Analysis techniques
3.1 Heat flux
Surface temperature was recorded at 51 locations along the cone’s axis. The thin wall of the model allows the surface to react relatively quickly to changes in external conditions during the course of the run. Sudden, rapid rises in temperature may therefore be recorded (such as the one seen in figure 2). Wall temperature remains nearly constant through most of the run near the tip and becomes increasingly sensitive to changes in
 $Re^{\prime }$
(increasing with
$Re^{\prime }$
(increasing with
 $t$
) toward the base, where the amplitude of the Mack-mode waves is great enough to cause localized heating. Note that the Mack mode may cause localized heating even in the laminar region due to either its own large amplitudes (Kuehl Reference Kuehl2018) or due to nonlinear wave interactions (Sivasubramanian & Fasel Reference Sivasubramanian and Fasel2015).
$t$
) toward the base, where the amplitude of the Mack-mode waves is great enough to cause localized heating. Note that the Mack mode may cause localized heating even in the laminar region due to either its own large amplitudes (Kuehl Reference Kuehl2018) or due to nonlinear wave interactions (Sivasubramanian & Fasel Reference Sivasubramanian and Fasel2015).
In order to better illustrate the effect of the flow on the surface temperature, the heat flux into the surface is approximated with a simple one-dimensional model. In what follows, the intent is to illustrate the qualitative behaviour rather than quantitative heat flux, so several assumptions are applied with only weak justification.
The rate of temperature change in a solid element of mass
 $m$
and specific heat capacity
$m$
and specific heat capacity
 $c$
is given by
$c$
is given by
 $$\begin{eqnarray}\frac{\text{d}Q}{\text{d}t}=mc\frac{\text{d}T}{\text{d}t}.\end{eqnarray}$$
The thermocouples indicate that the surface temperature is nearly constant over the surface of the model for a given
 $Re^{\prime }$
, so heat conduction laterally through the surface is ignored. Additionally, owing to the nearly stagnant air inside the model compared to the high-speed flow outside, the convective heat transfer rate from the model skin into the interior is much smaller than that at the exterior surface. Therefore, it is assumed that the surface heat flux due to the external flow is the only appreciable source of heat transfer. Therefore, the surface heat flux is modelled as
$Re^{\prime }$
, so heat conduction laterally through the surface is ignored. Additionally, owing to the nearly stagnant air inside the model compared to the high-speed flow outside, the convective heat transfer rate from the model skin into the interior is much smaller than that at the exterior surface. Therefore, it is assumed that the surface heat flux due to the external flow is the only appreciable source of heat transfer. Therefore, the surface heat flux is modelled as
 $$\begin{eqnarray}q_{w}=\frac{1}{A}\frac{\text{d}Q}{\text{d}t}\approx \frac{mc}{A}\frac{\text{d}T}{\text{d}t}=\unicode[STIX]{x1D70C}ch\frac{\text{d}T_{w}(t,z)}{\text{d}t},\end{eqnarray}$$
where
 $A$
is a representative area on the model,
$A$
is a representative area on the model,
 $m$
is the mass of the volume of surface material underneath the area
$m$
is the mass of the volume of surface material underneath the area
 $A$
,
$A$
,
 $c$
is the specific heat capacity of the steel,
$c$
is the specific heat capacity of the steel,
 $h$
is the wall thickness,
$h$
is the wall thickness,
 $Q$
is the heat transferred into the wall and
$Q$
is the heat transferred into the wall and
 $\unicode[STIX]{x1D70C}$
is the density of the steel. The temperature derivative is approximated with fourth-order central differences.
$\unicode[STIX]{x1D70C}$
is the density of the steel. The temperature derivative is approximated with fourth-order central differences.
3.2 Spectra and bispectra
3.2.1 Definition
The power spectrum has found widespread use in myriad science and engineering fields due to its simplicity and utility for examining the basic spectral characteristics of time series. While power spectra are broadly useful, they have a key drawback pertinent to the analysis of nonlinear systems: they carry with them an implicit assumption that a given signal is a linear combination of Fourier modes. When studying nonlinear phenomena such as a flowing fluid, this presents no problem provided the only interest is in identifying and tracking the changes in the frequency components of a signal. However, if one desires to detect and characterize the nonlinear behaviour of a system, the power spectrum is inadequate. This warrants the use of higher-order spectra such as the bispectrum. The following treatment largely follows the work of Collis, White & Hammond (Reference Collis, White and Hammond1998).
For a continuous time-varying signal
 $x(t)$
, the signal’s energy spectrum is defined as
$x(t)$
, the signal’s energy spectrum is defined as
 $$\begin{eqnarray}E_{xx}(f)=X(f)X^{\ast }(f),\end{eqnarray}$$
where
 $X(f)$
is the Fourier transform of
$X(f)$
is the Fourier transform of
 $x(t)$
and
$x(t)$
and
 $^{\ast }$
denotes a complex conjugate. Additionally, the signal power is defined as
$^{\ast }$
denotes a complex conjugate. Additionally, the signal power is defined as
 $$\begin{eqnarray}E[x^{2}(t)]=\int _{-\infty }^{\infty }S_{xx}(f)\,\text{d}f,\end{eqnarray}$$
where
 $E[\cdot ]$
is the expectation operator and
$E[\cdot ]$
is the expectation operator and
 $S_{xx}(f)$
is the power spectrum or power spectral density (PSD). The PSD itself is defined as
$S_{xx}(f)$
is the power spectrum or power spectral density (PSD). The PSD itself is defined as
 $$\begin{eqnarray}S_{xx}(f)=\lim _{T\rightarrow \infty }\frac{1}{T}E[X(f)X^{\ast }(f)]=\lim _{T\rightarrow \infty }\frac{1}{T}E[|X(f)|^{2}],\end{eqnarray}$$
where
 $T$
is the signal length. Note that the argument of the expectation is the energy spectrum. As illustrated by this definition, the PSD lacks phase information in that it only depends on the magnitude of the Fourier transform.
$T$
is the signal length. Note that the argument of the expectation is the energy spectrum. As illustrated by this definition, the PSD lacks phase information in that it only depends on the magnitude of the Fourier transform.
In order to overcome this shortcoming, a higher-order spectrum may be defined by instead dealing with the expected value of the cube of the signal,
 $$\begin{eqnarray}E[x^{3}(t)]=\int _{-\infty }^{\infty }\int _{-\infty }^{\infty }S_{xxx}(f_{1},f_{2})\,\text{d}f_{1}\,\text{d}f_{2}.\end{eqnarray}$$
Here, the quantity
 $S_{xxx}$
is called the bispectrum or bispectral density and is defined as
$S_{xxx}$
is called the bispectrum or bispectral density and is defined as
 $$\begin{eqnarray}S_{xxx}(f_{1},f_{2})=\lim _{T\rightarrow \infty }\frac{1}{T}E[X^{\ast }(f_{1})X^{\ast }(f_{2})X(f_{1}+f_{2})].\end{eqnarray}$$
This also suggests that we can define an energy bispectrum similarly to the energy spectrum as
 $$\begin{eqnarray}E_{xxx}(f_{1},f_{2})=X^{\ast }(f_{1})X^{\ast }(f_{2})X(f_{1}+f_{2}).\end{eqnarray}$$
3.2.2 Interpretation of the bispectrum
The physical interpretation of the bispectrum is considered by noting that the Fourier transform may be represented in exponential form as
 $$\begin{eqnarray}X(f)=A(f)\exp (j\unicode[STIX]{x1D719}).\end{eqnarray}$$
Using this definition with the definition of
 $S_{xxx}$
 $$\begin{eqnarray}E_{xxx}=A_{f_{1}}A_{f_{2}}A_{f_{1}+f_{2}}\exp [j(\unicode[STIX]{x1D719}_{f_{1}+f_{2}}-\unicode[STIX]{x1D719}_{f_{1}}-\unicode[STIX]{x1D719}_{f_{2}})].\end{eqnarray}$$
This indicates that the expected value will be maximized when the phase of its operand is constant for each realization of the time series, i.e. when
 $$\begin{eqnarray}\unicode[STIX]{x1D6FD}=\unicode[STIX]{x1D719}_{f_{1}+f_{2}}-\unicode[STIX]{x1D719}_{f_{1}}-\unicode[STIX]{x1D719}_{f_{2}}=\text{const.}\end{eqnarray}$$
where
 $\unicode[STIX]{x1D6FD}$
is called the biphase.
$\unicode[STIX]{x1D6FD}$
is called the biphase.
Consider, three waves at
 $f_{1}$
,
$f_{1}$
,
 $f_{2}$
and
$f_{2}$
and
 $f_{1}+f_{2}$
measured as part of a time signal. If these waves are spontaneously excited independently of one another, their phases will all be random with respect to one another and
$f_{1}+f_{2}$
measured as part of a time signal. If these waves are spontaneously excited independently of one another, their phases will all be random with respect to one another and
 $\unicode[STIX]{x1D6FD}$
will assume a random value for any single realization of this signal. When averaged over many realizations, the expected value of
$\unicode[STIX]{x1D6FD}$
will assume a random value for any single realization of this signal. When averaged over many realizations, the expected value of
 $E_{xxx}$
will be zero if
$E_{xxx}$
will be zero if
 $\unicode[STIX]{x1D6FD}$
is random. If, on the other hand, the
$\unicode[STIX]{x1D6FD}$
is random. If, on the other hand, the
 $f_{1}+f_{2}$
wave is generated by quadratic phase coupling (QPC) between
$f_{1}+f_{2}$
wave is generated by quadratic phase coupling (QPC) between
 $f_{1}$
and
$f_{1}$
and
 $f_{2}$
, then
$f_{2}$
, then
 $\unicode[STIX]{x1D719}_{f_{1}}$
and
$\unicode[STIX]{x1D719}_{f_{1}}$
and
 $\unicode[STIX]{x1D719}_{f_{2}}$
are still random, but their relationship with
$\unicode[STIX]{x1D719}_{f_{2}}$
are still random, but their relationship with
 $\unicode[STIX]{x1D719}_{f_{1}+f_{2}}$
, is constant, hence
$\unicode[STIX]{x1D719}_{f_{1}+f_{2}}$
, is constant, hence
 $\unicode[STIX]{x1D6FD}$
is constant. Over many realizations, the expected value of
$\unicode[STIX]{x1D6FD}$
is constant. Over many realizations, the expected value of
 $E_{xxx}$
for phase-coupled waves is non-zero. Therefore, the bispectrum indicates the presence of QPC interactions between a group of signal components at
$E_{xxx}$
for phase-coupled waves is non-zero. Therefore, the bispectrum indicates the presence of QPC interactions between a group of signal components at
 $f_{1}$
,
$f_{1}$
,
 $f_{2}$
and
$f_{2}$
and
 $f_{3}=f_{1}+f_{2}$
. One common example of QPC is the production of a harmonic by a wave with frequency
$f_{3}=f_{1}+f_{2}$
. One common example of QPC is the production of a harmonic by a wave with frequency
 $f_{0}$
coupling with itself,
$f_{0}$
coupling with itself,
 $f_{0}+f_{0}\rightarrow 2f_{0}$
. It is worth noting explicitly that the bispectrum indicates only the presence of quadratic nonlinearity and is not effective in detecting other forms (e.g. cubic nonlinear interactions).
$f_{0}+f_{0}\rightarrow 2f_{0}$
. It is worth noting explicitly that the bispectrum indicates only the presence of quadratic nonlinearity and is not effective in detecting other forms (e.g. cubic nonlinear interactions).
3.2.3 Normalization and estimation of the bispectrum
The bispectrum is typically employed in the detection of QPC, and in many instances, the normalization method employed by Kim & Powers (Reference Kim and Powers1979) is used. This method, dubbed the bicoherence spectrum,
 $b$
, is defined as follows:
$b$
, is defined as follows:
 $$\begin{eqnarray}b^{2}(f_{1},f_{2})=\frac{|E_{xxx}(f_{1},f_{2})|^{2}}{E[|X(f_{1})X(f_{2})|^{2}]E[|X(f_{1}+f_{2})|^{2}]}.\end{eqnarray}$$
This measure has the advantage of being bounded by 0 and 1 at each frequency pair, and a larger value indicates a higher degree of QPC between the three waves.
Kim & Powers (Reference Kim and Powers1979) also suggest a method for estimating the bicoherence, which involves breaking the signal into
 $M$
windows of length
$M$
windows of length
 $T=N\unicode[STIX]{x0394}t$
. Then
$T=N\unicode[STIX]{x0394}t$
. Then
 $$\begin{eqnarray}\hat{b}(f_{1},f_{2})=\frac{\left|{\displaystyle \frac{1}{M}}\displaystyle \mathop{\sum }_{i=1}^{M}X_{1}^{(i)}X_{2}^{(i)}X_{1+2}^{\ast (i)}\right|}{\left[{\displaystyle \frac{1}{M}}\displaystyle \mathop{\sum }_{i=1}^{M}|X_{1}^{(i)}X_{2}^{(i)}|^{2}\right]^{1/2}\left[{\displaystyle \frac{1}{M}}\displaystyle \mathop{\sum }_{i=1}^{M}|X_{1+2}^{(i)}|^{2}\right]^{1/2}}.\end{eqnarray}$$
This is functionally and practically similar to the common estimation method for the PSD proposed by Welch (Reference Welch1967), only in this case, applied to a normalized version of
 $E_{xxx}$
.
$E_{xxx}$
.
4 Results
4.1 Nonlinearity and transition
Time series of the embedded thermocouples are plotted in figure 4. Note that
 $Re^{\prime }$
increases with
$Re^{\prime }$
increases with
 $t$
, but
$t$
, but
 $t$
is reported directly in this instance because the surface temperature and the flow conditions were sampled separately and the data did not allow an exact match between a specific value of
$t$
is reported directly in this instance because the surface temperature and the flow conditions were sampled separately and the data did not allow an exact match between a specific value of
 $Re^{\prime }$
and the corresponding
$Re^{\prime }$
and the corresponding
 $t$
.
$t$
.

Figure 4. Traces of estimated heat flux,
 $q_{w}$
, over time at each location along the model. The rise in heat flux upon transition occurs simultaneously at every location on the cone, indicating that the cause was loss of quiet flow.
$q_{w}$
, over time at each location along the model. The rise in heat flux upon transition occurs simultaneously at every location on the cone, indicating that the cause was loss of quiet flow.
The most notable feature in the figure is the abrupt and dramatic rise in
 $q_{w}$
at higher
$q_{w}$
at higher
 $Re^{\prime }$
. This rise corresponds to the onset of turbulence. Importantly, the fact that the transition location is not a function of
$Re^{\prime }$
. This rise corresponds to the onset of turbulence. Importantly, the fact that the transition location is not a function of
 $Re^{\prime }$
and instead the entire cone becomes turbulent all at once indicates that transition in this experiment was likely due to the loss of quiet flow in the test section rather than due to the nonlinear breakdown of the Mack mode. This naturally raises the question of whether the flow ever becomes transitional or turbulent prior to the loss of quiet flow.
$Re^{\prime }$
and instead the entire cone becomes turbulent all at once indicates that transition in this experiment was likely due to the loss of quiet flow in the test section rather than due to the nonlinear breakdown of the Mack mode. This naturally raises the question of whether the flow ever becomes transitional or turbulent prior to the loss of quiet flow.
One additional feature of figure 4 is that there are regions of elevated heat flux in the laminar portion of the plot toward the base of the model. Relatively early in the run, near the base of the model, a region of increased heating develops. As
 $Re^{\prime }$
increases further, this region shifts further upstream and the base region drops back down to nearly zero. Finally, there is a second region of elevated heat flux that forms when
$Re^{\prime }$
increases further, this region shifts further upstream and the base region drops back down to nearly zero. Finally, there is a second region of elevated heat flux that forms when
 $Re^{\prime }$
increases still further, which begins to move upstream as
$Re^{\prime }$
increases still further, which begins to move upstream as
 $Re^{\prime }$
increases until transition occurs due to loss of quiet flow.
$Re^{\prime }$
increases until transition occurs due to loss of quiet flow.
It should be noted that dual peaks in heat transfer have been observed previously, both in experiments (cf. Ward et al. Reference Ward, Wheaton, Chou, Berridge, Letterman, Luersen and Schneider2012) and in DNS studies (Sivasubramanian & Fasel Reference Sivasubramanian and Fasel2015). According to the DNS, the first peak occurs when the primary Mack mode reaches saturation, and the secondary peak occurs when transition begins. Additionally, in each of those studies, the two peaks coexisted on the model at different spatial locations. In contrast, however, the first peak in the present data disappears right around the time when the second peak first appears. It is not clear whether the first peak’s disappearance is a result of the limitations of the one-dimensional approximation technique or is a genuine feature of the flow. However, it is clear that the Mack-mode waves are reaching sufficient amplitude to cause localized heating in an otherwise laminar region of the flow.

Figure 5. PSDs at several values of
 $Re_{z}$
. Note the nearly constant lower limit of each peak. Higher
$Re_{z}$
. Note the nearly constant lower limit of each peak. Higher
 $Re_{z}$
leads to a shift to higher
$Re_{z}$
leads to a shift to higher
 $f$
, followed by spectral filling in the valleys before the eventual breakdown.
$f$
, followed by spectral filling in the valleys before the eventual breakdown.
The power spectral densities (PSD) of the focusing schlieren data are plotted in figure 5 at several values of
 $Re_{z}$
. There are two very prominent peaks and, at higher
$Re_{z}$
. There are two very prominent peaks and, at higher
 $Re_{z}$
, a third small peak begins to form. The peak with the lowest frequency is in the vicinity of
$Re_{z}$
, a third small peak begins to form. The peak with the lowest frequency is in the vicinity of
 $f_{0}=250~\text{kHz}$
and represents the most unstable frequencies of the Mack mode. The two higher peaks are located at approximately
$f_{0}=250~\text{kHz}$
and represents the most unstable frequencies of the Mack mode. The two higher peaks are located at approximately
 $2f_{0}$
and
$2f_{0}$
and
 $3f_{0}$
respectively and appear to be harmonics generated by nonlinearity in the Mack mode as its amplitude increases (this relationship will be further developed in § 4.2). At approximately
$3f_{0}$
respectively and appear to be harmonics generated by nonlinearity in the Mack mode as its amplitude increases (this relationship will be further developed in § 4.2). At approximately
 $Re_{z}=4.8\times 10^{6}$
, the valleys between the peaks begin to fill, rapidly leading to a turbulent spectrum with no visible peaks by
$Re_{z}=4.8\times 10^{6}$
, the valleys between the peaks begin to fill, rapidly leading to a turbulent spectrum with no visible peaks by
 $Re_{z}\geqslant 5.0\times 10^{6}$
. There is no evidence of power in the vicinity of the subharmonic of the Mack mode, which may be attributable to its non-existence, its small amplitude or limitations in detecting oblique waves with the schlieren technique with a finite but sizable focal depth. No conclusions can therefore be drawn about the possibility of subharmonic resonance from these spectra.
$Re_{z}\geqslant 5.0\times 10^{6}$
. There is no evidence of power in the vicinity of the subharmonic of the Mack mode, which may be attributable to its non-existence, its small amplitude or limitations in detecting oblique waves with the schlieren technique with a finite but sizable focal depth. No conclusions can therefore be drawn about the possibility of subharmonic resonance from these spectra.

Figure 6. Spectrograms of the short-time Fourier transform at several values of
 $Re^{\prime }$
. Intermittency due to intermittent loss of quiet flow increases rapidly with
$Re^{\prime }$
. Intermittency due to intermittent loss of quiet flow increases rapidly with
 $Re^{\prime }$
near the breakdown point.
$Re^{\prime }$
near the breakdown point.
Figure 6 depicts several spectrograms of the short-time Fourier transform (STFT) of the focusing schlieren data at several of the values of
 $Re_{z}$
bracketing the transition point. At the lowest value,
$Re_{z}$
bracketing the transition point. At the lowest value,
 $Re_{z}=4.6\times 10^{6}$
, there are clear lines spanning the entire measurement time corresponding to
$Re_{z}=4.6\times 10^{6}$
, there are clear lines spanning the entire measurement time corresponding to
 $f_{0}$
as well as its first harmonic. At
$f_{0}$
as well as its first harmonic. At
 $Re_{z}=4.7\times 10^{6}~\text{m}^{-1}$
, the situation is largely unchanged with only very intermittent bursts of turbulence, signified by the vertical lines of broadband energy interrupting the otherwise unbroken
$Re_{z}=4.7\times 10^{6}~\text{m}^{-1}$
, the situation is largely unchanged with only very intermittent bursts of turbulence, signified by the vertical lines of broadband energy interrupting the otherwise unbroken
 $f_{0}$
and
$f_{0}$
and
 $2f_{0}$
lines;
$2f_{0}$
lines;
 $Re_{z}=4.8\times 10^{6}$
exhibits much more frequent turbulent bursts, and
$Re_{z}=4.8\times 10^{6}$
exhibits much more frequent turbulent bursts, and
 $Re_{z}=4.9\times 10^{6}$
is fully turbulent.
$Re_{z}=4.9\times 10^{6}$
is fully turbulent.
4.2 Phase coupling

Figure 7. Power spectral density as a function of
 $Re_{z}$
. Approximately horizontal stripes representing
$Re_{z}$
. Approximately horizontal stripes representing
 $f_{0}$
(the Mack mode),
$f_{0}$
(the Mack mode),
 $2f_{0}$
and
$2f_{0}$
and
 $3f_{0}$
are visible and appear successively in that order. All three rapidly disappear upon transition to turbulence.
$3f_{0}$
are visible and appear successively in that order. All three rapidly disappear upon transition to turbulence.
The PSD is plotted against the entire measured range of
 $Re_{z}$
in figure 7. The lower bound of each peak remains relatively constant as the peaks broaden into higher frequencies as
$Re_{z}$
in figure 7. The lower bound of each peak remains relatively constant as the peaks broaden into higher frequencies as
 $Re_{z}$
increases. At
$Re_{z}$
increases. At
 $Re_{z}\approx 4.7\times 10^{6}$
, the valleys begin to fill until
$Re_{z}\approx 4.7\times 10^{6}$
, the valleys begin to fill until
 $Re_{z}\approx 4.9\times 10^{6}$
, when the flow becomes turbulent, consistent with the STFT spectrograms of figure 6. A slow shift of
$Re_{z}\approx 4.9\times 10^{6}$
, when the flow becomes turbulent, consistent with the STFT spectrograms of figure 6. A slow shift of
 $f_{0}$
from lower to higher frequencies as
$f_{0}$
from lower to higher frequencies as
 $Re_{z}$
increases (and
$Re_{z}$
increases (and
 $\unicode[STIX]{x1D6FF}$
decreases) is observed in the data. This can be seen more clearly in figure 8, which plots the frequency of the centre of each peak as a function of
$\unicode[STIX]{x1D6FF}$
decreases) is observed in the data. This can be seen more clearly in figure 8, which plots the frequency of the centre of each peak as a function of
 $Re_{z}$
. These values of
$Re_{z}$
. These values of
 $f_{0}$
are used to normalize the results of the bispectral analysis.
$f_{0}$
are used to normalize the results of the bispectral analysis.

Figure 8. Peak frequencies as a function of
 $Re^{\prime }$
.
$Re^{\prime }$
.
Figure 9 depicts the bicoherence,
 $b$
, normalized according to the method of Kim & Powers (Reference Kim and Powers1979). These plots should be read such that a peak at any frequency pair,
$b$
, normalized according to the method of Kim & Powers (Reference Kim and Powers1979). These plots should be read such that a peak at any frequency pair,
 $(f_{1},f_{2})$
, indicates that a QPC interaction exists between modes at
$(f_{1},f_{2})$
, indicates that a QPC interaction exists between modes at
 $f_{1}$
,
$f_{1}$
,
 $f_{2}$
and
$f_{2}$
and
 $f_{1}+f_{2}$
. Generally speaking, it is not possible using the bispectrum alone to distinguish between the sum and difference interactions that may be represented by these three waves. For example, a peak at
$f_{1}+f_{2}$
. Generally speaking, it is not possible using the bispectrum alone to distinguish between the sum and difference interactions that may be represented by these three waves. For example, a peak at
 $(f_{1},f_{2})$
may represent
$(f_{1},f_{2})$
may represent
 $f_{1}+f_{2}\rightarrow (f_{1}+f_{2})$
or
$f_{1}+f_{2}\rightarrow (f_{1}+f_{2})$
or
 $(f_{1}+f_{2})-f_{1}\rightarrow f_{2}$
or
$(f_{1}+f_{2})-f_{1}\rightarrow f_{2}$
or
 $(f_{1}+f_{2})-f_{2}\rightarrow f_{1}$
. In most cases, these interactions can be distinguished in the present study using contextual clues and supporting evidence. The horizontal axes are normalized by
$(f_{1}+f_{2})-f_{2}\rightarrow f_{1}$
. In most cases, these interactions can be distinguished in the present study using contextual clues and supporting evidence. The horizontal axes are normalized by
 $f_{0}$
and represent the frequencies as multiples of the most unstable Mack-mode frequency at that
$f_{0}$
and represent the frequencies as multiples of the most unstable Mack-mode frequency at that
 $Re_{z}$
.
$Re_{z}$
.

Figure 9. Plots of
 $b$
, the bicoherence (Kim & Powers Reference Kim and Powers1979) over the entire principle domain. Line plots above and to the right of each contour provide the corresponding PSDs for reference.
$b$
, the bicoherence (Kim & Powers Reference Kim and Powers1979) over the entire principle domain. Line plots above and to the right of each contour provide the corresponding PSDs for reference.
Referring back to figures 7 and 8, it is clear that the peak at
 $f\approx 2f_{0}$
is well established at
$f\approx 2f_{0}$
is well established at
 $Re_{z}=3.84\times 10^{6}$
. Unsurprisingly, the bispectrum at the same
$Re_{z}=3.84\times 10^{6}$
. Unsurprisingly, the bispectrum at the same
 $Re_{z}$
(figure 9
a) exhibits a peak at
$Re_{z}$
(figure 9
a) exhibits a peak at
 $(1,1)$
. The peak at
$(1,1)$
. The peak at
 $2f_{0}$
has both a smaller amplitude than the one at
$2f_{0}$
has both a smaller amplitude than the one at
 $f_{0}$
and nearly twice the bandwidth (based on the full width at half-maximum, FWHM). It is therefore likely that this interaction represents
$f_{0}$
and nearly twice the bandwidth (based on the full width at half-maximum, FWHM). It is therefore likely that this interaction represents
 $1+1\rightarrow 2$
, indicating self-excitation of the Mack mode at
$1+1\rightarrow 2$
, indicating self-excitation of the Mack mode at
 $f_{0}$
to generate a harmonic at
$f_{0}$
to generate a harmonic at
 $2f_{0}$
. There is also already a peak that exists at
$2f_{0}$
. There is also already a peak that exists at
 $(2,1)$
, which is perhaps more surprising given that no peak at
$(2,1)$
, which is perhaps more surprising given that no peak at
 $3f_{0}$
is yet visible in the PSD. Given the lack of meaningful energy at
$3f_{0}$
is yet visible in the PSD. Given the lack of meaningful energy at
 $3f_{0}$
at this
$3f_{0}$
at this
 $Re_{z}$
, this peak therefore represents
$Re_{z}$
, this peak therefore represents
 $2+1\rightarrow 3$
and is evidence of an early coupling between the Mack mode and its harmonic to generate a second harmonic. These peaks will be discussed further in § 4.2.1.
$2+1\rightarrow 3$
and is evidence of an early coupling between the Mack mode and its harmonic to generate a second harmonic. These peaks will be discussed further in § 4.2.1.
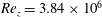
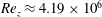
As
 $Re_{z}$
increases, the bispectral peaks all grow larger in extent in the frequency plane until the breakdown process begins (figure 9
e), where they begin to shrink. Their maximum amplitude, however, has some notable behaviour. Figure 10 depicts the maximum amplitude for each integer frequency pair and was produced by taking the maximum value of
$Re_{z}$
increases, the bispectral peaks all grow larger in extent in the frequency plane until the breakdown process begins (figure 9
e), where they begin to shrink. Their maximum amplitude, however, has some notable behaviour. Figure 10 depicts the maximum amplitude for each integer frequency pair and was produced by taking the maximum value of
 $b$
within
$b$
within
 $f/f_{0}=\pm 0.5$
of each coordinate. It indicates that the
$f/f_{0}=\pm 0.5$
of each coordinate. It indicates that the
 $(1,1)$
peak does not change amplitude by a significant amount until
$(1,1)$
peak does not change amplitude by a significant amount until
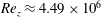 $Re_{z}\approx 4.49\times 10^{6}$
, where it begins to decrease well before the onset of transition. The
$Re_{z}\approx 4.49\times 10^{6}$
, where it begins to decrease well before the onset of transition. The
 $(2,1)$
peak does not reach a saturation point until somewhat later,
$(2,1)$
peak does not reach a saturation point until somewhat later,
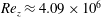 $Re_{z}\approx 4.09\times 10^{6}$
. It then begins to roll off similar to the
$Re_{z}\approx 4.09\times 10^{6}$
. It then begins to roll off similar to the
 $(1,1)$
peak.
$(1,1)$
peak.

Figure 10. Maxima of various frequency interaction pairs as a function of
 $Re_{z}$
.
$Re_{z}$
.
In addition to these harmonic-generating peaks, there are also a pair of peaks located near
 $(1,0)$
and
$(1,0)$
and
 $(2,0)$
that are visible in figure 9. These peaks represent an interaction between the respective frequencies
$(2,0)$
that are visible in figure 9. These peaks represent an interaction between the respective frequencies
 $f_{0}$
and
$f_{0}$
and
 $2f_{0}$
and frequencies near 0 and will be discussed further in § 4.2.2. The amplitude of
$2f_{0}$
and frequencies near 0 and will be discussed further in § 4.2.2. The amplitude of
 $(1,0)$
, as shown in figure 10, remains relatively constant throughout the range of
$(1,0)$
, as shown in figure 10, remains relatively constant throughout the range of
 $Re_{z}$
prior to transition. The
$Re_{z}$
prior to transition. The
 $(2,0)$
peak, however, begins at a lower amplitude and eventually reaches grows to be nearly identical to the
$(2,0)$
peak, however, begins at a lower amplitude and eventually reaches grows to be nearly identical to the
 $(1,0)$
peak at
$(1,0)$
peak at
 $Re_{z}\approx 4.19\times 10^{6}$
.
$Re_{z}\approx 4.19\times 10^{6}$
.
Figure 10 also depicts three peaks that were not clearly visible in figure 9. The
 $(2,2)$
peak has a nearly constant, small amplitude. Note that approximately half-way through the
$(2,2)$
peak has a nearly constant, small amplitude. Note that approximately half-way through the
 $Re_{z}$
sweep,
$Re_{z}$
sweep,
 $4f_{0}$
becomes greater than the Nyquist frequency,
$4f_{0}$
becomes greater than the Nyquist frequency,
 $f_{N}$
, and the centre of the
$f_{N}$
, and the centre of the
 $(2,2)$
region is no longer resolvable. The maximum value of
$(2,2)$
region is no longer resolvable. The maximum value of
 $b$
does not appear to be meaningfully affected by this, indicating that its small value in that region is likely unrelated to any hypothetical interactions at
$b$
does not appear to be meaningfully affected by this, indicating that its small value in that region is likely unrelated to any hypothetical interactions at
 $(2,2)$
and instead represents the noise floor. This conclusion is further supported by the same
$(2,2)$
and instead represents the noise floor. This conclusion is further supported by the same
 $b\approx 0.1$
value prevailing throughout the turbulent portion of the
$b\approx 0.1$
value prevailing throughout the turbulent portion of the
 $Re_{z}$
sweep.
$Re_{z}$
sweep.
There is also a
 $(3,0)$
peak visible, and while it has a very small amplitude, it does increase slightly throughout the course of the run (and slightly above the zero interaction limit provided by the
$(3,0)$
peak visible, and while it has a very small amplitude, it does increase slightly throughout the course of the run (and slightly above the zero interaction limit provided by the
 $(2,2)$
amplitude). It drops off rapidly like the rest of the peaks during the transition process. Finally, there is also evidence of possible weak interaction of low frequencies surrounding
$(2,2)$
amplitude). It drops off rapidly like the rest of the peaks during the transition process. Finally, there is also evidence of possible weak interaction of low frequencies surrounding
 $(0,0)$
.
$(0,0)$
.
Notably, no peaks are present in the region that would suggest a subharmonic resonance such as the one observed by Bountin et al. (Reference Bountin, Shiplyuk and Maslov2008). In that study, the authors suggested that the subharmonic resonance was between pairs of oblique first-mode waves to reinforce the Mack mode. While the present data show no sign of first-mode content in the frequency range relevant to these subharmonic interactions (figure 5), and therefore no corresponding bispectral peak, this should not be taken as evidence that no such wave interaction exists. The depth of field of the focusing schlieren system is approximately 25 mm, so the signal resulting from oblique first-mode waves will undergo substantial integration through that depth and across several wavelengths. The result is that the SNR for these waves is likely quite small, and they may still exist yet be indiscernible to this measurement system.
4.2.1 Harmonic generation
Figure 11. Magnified plots of the bicoherence centred at (1, 1) and depicting interactions between the fundamental,
 $f_{0}$
, and itself.
$f_{0}$
, and itself.
In order to further investigate the peaks representing harmonic generation, it helps to magnify them to help elucidate their features. Figure 11 depicts such a magnified version of the
 $(1,1)$
peak at a series of
$(1,1)$
peak at a series of
 $Re_{z}$
values prior to transition. As the figure illustrates, the peak has a peculiar structure even at smaller
$Re_{z}$
values prior to transition. As the figure illustrates, the peak has a peculiar structure even at smaller
 $Re_{z}$
. At
$Re_{z}$
. At
 $Re_{z}=3.84\times 10^{6}$
(figure 11
a), the main peak is elongated diagonally with a slope of 1, indicating interactions in the family of
$Re_{z}=3.84\times 10^{6}$
(figure 11
a), the main peak is elongated diagonally with a slope of 1, indicating interactions in the family of
 $(1\pm \unicode[STIX]{x1D6E5})+(1\pm \unicode[STIX]{x1D6E5})\rightarrow 2\pm 2\unicode[STIX]{x1D6E5}$
where
$(1\pm \unicode[STIX]{x1D6E5})+(1\pm \unicode[STIX]{x1D6E5})\rightarrow 2\pm 2\unicode[STIX]{x1D6E5}$
where
 $\unicode[STIX]{x1D6E5}$
represents a small frequency deviation (relative to
$\unicode[STIX]{x1D6E5}$
represents a small frequency deviation (relative to
 $f_{0}$
). This peak shape is indicative of the broadband self-interaction of the Mack mode leading to the spectral broadening that commonly occurs when a harmonic is generated. This is reflected by the fact that the FWHM bandwidth of the
$f_{0}$
). This peak shape is indicative of the broadband self-interaction of the Mack mode leading to the spectral broadening that commonly occurs when a harmonic is generated. This is reflected by the fact that the FWHM bandwidth of the
 $2f_{0}$
peak is nearly twice that of the
$2f_{0}$
peak is nearly twice that of the
 $f_{0}$
peak.
$f_{0}$
peak.
The other notable feature is the presence of a secondary peak that is entirely detached from the main peak at
 $(1+\unicode[STIX]{x1D6E5},1-\unicode[STIX]{x1D6E5})$
. The nature of this side peak is less obvious, but appears to be part of the sum interaction whereby energy is generated in the harmonic by
$(1+\unicode[STIX]{x1D6E5},1-\unicode[STIX]{x1D6E5})$
. The nature of this side peak is less obvious, but appears to be part of the sum interaction whereby energy is generated in the harmonic by
 $(1+\unicode[STIX]{x1D6E5})+(1-\unicode[STIX]{x1D6E5})\rightarrow 2$
. One other serious possibility exists as a result of the nature of the pressure sweep in the present experiment. The slow increase in
$(1+\unicode[STIX]{x1D6E5})+(1-\unicode[STIX]{x1D6E5})\rightarrow 2$
. One other serious possibility exists as a result of the nature of the pressure sweep in the present experiment. The slow increase in
 $Re_{z}$
is accompanied by a slow increase in
$Re_{z}$
is accompanied by a slow increase in
 $f_{0}$
. It is possible, therefore, that this peak represents a
$f_{0}$
. It is possible, therefore, that this peak represents a
 $2-(1-\unicode[STIX]{x1D6E5})\rightarrow 1+\unicode[STIX]{x1D6E5}$
difference interaction resulting from the harmonic remaining weakly coupled with the
$2-(1-\unicode[STIX]{x1D6E5})\rightarrow 1+\unicode[STIX]{x1D6E5}$
difference interaction resulting from the harmonic remaining weakly coupled with the
 $f_{0}$
an instant in the past and contributing to the broadening of the original Mack-mode peak. Additional experiments with constant
$f_{0}$
an instant in the past and contributing to the broadening of the original Mack-mode peak. Additional experiments with constant
 $Re_{z}$
and instrumentation capable of calculating the cross-bispectrum are required to determine which of these scenarios is correct.
$Re_{z}$
and instrumentation capable of calculating the cross-bispectrum are required to determine which of these scenarios is correct.

Figure 12. Magnified plots of the bicoherence centred at
 $(2,1)$
and depicting interactions between the fundamental,
$(2,1)$
and depicting interactions between the fundamental,
 $f_{0}$
, and itself.
$f_{0}$
, and itself.

Figure 13. Magnified plots of the bicoherence centred at
 $(1,0)$
and depicting interactions between
$(1,0)$
and depicting interactions between
 $f_{0}$
, its sidebands and low-frequency waves.
$f_{0}$
, its sidebands and low-frequency waves.

Figure 14. Magnified plots of the bicoherence centred at
 $(2,0)$
and depicting interactions between the first harmonic,
$(2,0)$
and depicting interactions between the first harmonic,
 $2f_{0}$
, its sidebands, low-frequency waves and the mean flow.
$2f_{0}$
, its sidebands, low-frequency waves and the mean flow.
It is next useful to examine the generation of the second harmonic,
 $3f_{0}$
. Figure 12 shows a magnified grid of the interactions in the vicinity of
$3f_{0}$
. Figure 12 shows a magnified grid of the interactions in the vicinity of
 $(2,1)$
. This peak has a much lower amplitude at
$(2,1)$
. This peak has a much lower amplitude at
 $3.84\times 10^{6}$
compared to its eventual saturation value (figure 12
a) when compared to the behaviour of its
$3.84\times 10^{6}$
compared to its eventual saturation value (figure 12
a) when compared to the behaviour of its
 $(1,1)$
counterpart, but has reached saturation by
$(1,1)$
counterpart, but has reached saturation by
 $4.19\times 10^{6}$
(figure 12
b). One thing that should be immediately noted is that, while the
$4.19\times 10^{6}$
(figure 12
b). One thing that should be immediately noted is that, while the
 $(2,1)$
peaks are inclined much like the
$(2,1)$
peaks are inclined much like the
 $(1,1)$
peaks, the
$(1,1)$
peaks, the
 $(2,1)$
peaks feature a slope of approximately 0.5. Therefore, the interactions are of the family
$(2,1)$
peaks feature a slope of approximately 0.5. Therefore, the interactions are of the family
 $(2+2\unicode[STIX]{x1D6E5},1+\unicode[STIX]{x1D6E5})$
. It is expected that this is similar to the generation of the first harmonic in that it represents a sum interaction of the form
$(2+2\unicode[STIX]{x1D6E5},1+\unicode[STIX]{x1D6E5})$
. It is expected that this is similar to the generation of the first harmonic in that it represents a sum interaction of the form
 $(2+2\unicode[STIX]{x1D6E5})+(1+\unicode[STIX]{x1D6E5})\rightarrow 3+3\unicode[STIX]{x1D6E5}$
. This was not possible to confirm directly, however, as the third harmonic peaks were not prominent enough to calculate their FWHM bandwidth.
$(2+2\unicode[STIX]{x1D6E5})+(1+\unicode[STIX]{x1D6E5})\rightarrow 3+3\unicode[STIX]{x1D6E5}$
. This was not possible to confirm directly, however, as the third harmonic peaks were not prominent enough to calculate their FWHM bandwidth.
4.2.2 Low-frequency and mean-flow interactions
Figures 13 and 14 depict magnified plots of the
 $(1,0)$
and
$(1,0)$
and
 $(2,0)$
peaks, respectively. Note that the measured signal was AC-coupled and low-pass filtered in order to remove the DC component from the data, so the peaks do not actually touch the abscissa. It is therefore impossible to determine with certainty whether or not the peaks truly represent an interaction with the mean flow based on the present data. However, in low-speed boundary layers, Craik (Reference Craik1971) showed that a strong nonlinear energy transfer occurs between the mean flow and the unstable waves, ultimately leading to the rapid growth of especially oblique pairs resulting in a spanwise periodicity to the flow. Given the 3-D breakdown observed by Sivasubramanian & Fasel (Reference Sivasubramanian and Fasel2015) and the theoretical analysis of Chen, Zhu & Lee (Reference Chen, Zhu and Lee2017), it is likely that a similar mechanism exists with the Mack mode. The peaks in figures 13 and 14 drop off uniformly for all
$(2,0)$
peaks, respectively. Note that the measured signal was AC-coupled and low-pass filtered in order to remove the DC component from the data, so the peaks do not actually touch the abscissa. It is therefore impossible to determine with certainty whether or not the peaks truly represent an interaction with the mean flow based on the present data. However, in low-speed boundary layers, Craik (Reference Craik1971) showed that a strong nonlinear energy transfer occurs between the mean flow and the unstable waves, ultimately leading to the rapid growth of especially oblique pairs resulting in a spanwise periodicity to the flow. Given the 3-D breakdown observed by Sivasubramanian & Fasel (Reference Sivasubramanian and Fasel2015) and the theoretical analysis of Chen, Zhu & Lee (Reference Chen, Zhu and Lee2017), it is likely that a similar mechanism exists with the Mack mode. The peaks in figures 13 and 14 drop off uniformly for all
 $f_{1}$
as
$f_{1}$
as
 $f_{2}$
decreases toward zero in a manner consistent with a peak dampened by signal filtering. The subsequent analysis therefore assumes that these peaks do, in fact, reach the abscissa.
$f_{2}$
decreases toward zero in a manner consistent with a peak dampened by signal filtering. The subsequent analysis therefore assumes that these peaks do, in fact, reach the abscissa.
Early in the
 $Re_{z}$
sweep, the
$Re_{z}$
sweep, the
 $(1,0)$
peak appears only in the region of
$(1,0)$
peak appears only in the region of
 $(1-\unicode[STIX]{x1D6E5},\unicode[STIX]{x1D716})$
, as is shown in figure 13(a). Here,
$(1-\unicode[STIX]{x1D6E5},\unicode[STIX]{x1D716})$
, as is shown in figure 13(a). Here,
 $\unicode[STIX]{x1D716}$
is used similarly to
$\unicode[STIX]{x1D716}$
is used similarly to
 $\unicode[STIX]{x1D6E5}$
for a small frequency but is given a separate designation since
$\unicode[STIX]{x1D6E5}$
for a small frequency but is given a separate designation since
 $\unicode[STIX]{x1D716}$
does not represent a small shift in
$\unicode[STIX]{x1D716}$
does not represent a small shift in
 $f_{0}$
as does
$f_{0}$
as does
 $\unicode[STIX]{x1D6E5}$
. Inspection of figures 5, 13 and 14 indicated that
$\unicode[STIX]{x1D6E5}$
. Inspection of figures 5, 13 and 14 indicated that
 $\unicode[STIX]{x1D716}$
represents approximately
$\unicode[STIX]{x1D716}$
represents approximately
 $0\leqslant \unicode[STIX]{x1D716}\leqslant 50~\text{kHz}$
, which is part of the band over which both first-mode and Görtler waves are expected to be unstable. For
$0\leqslant \unicode[STIX]{x1D716}\leqslant 50~\text{kHz}$
, which is part of the band over which both first-mode and Görtler waves are expected to be unstable. For
 $\unicode[STIX]{x1D716}=0$
, this peak represents an interaction with the mean flow of the class
$\unicode[STIX]{x1D716}=0$
, this peak represents an interaction with the mean flow of the class
 $(1-\unicode[STIX]{x1D6E5},0)$
. Given the works of Craik (Reference Craik1971) and Chen et al. (Reference Chen, Zhu and Lee2017), it is likely this represents the interaction
$(1-\unicode[STIX]{x1D6E5},0)$
. Given the works of Craik (Reference Craik1971) and Chen et al. (Reference Chen, Zhu and Lee2017), it is likely this represents the interaction
 $(1-\unicode[STIX]{x1D6E5})+0\rightarrow (1-\unicode[STIX]{x1D6E5})$
. This interaction represents an energy transfer from the mean flow into the lower sideband of the Mack mode.
$(1-\unicode[STIX]{x1D6E5})+0\rightarrow (1-\unicode[STIX]{x1D6E5})$
. This interaction represents an energy transfer from the mean flow into the lower sideband of the Mack mode.
For
 $\unicode[STIX]{x1D716}\geqslant 0$
, there are several possible interactions that may be represented. The first is
$\unicode[STIX]{x1D716}\geqslant 0$
, there are several possible interactions that may be represented. The first is
 $(1-\unicode[STIX]{x1D6E5})+\unicode[STIX]{x1D716}\rightarrow (1-\unicode[STIX]{x1D6E5}+\unicode[STIX]{x1D716})$
, which indicates an interaction between the lower sideband of the Mack mode with a low-frequency wave to contribute to spectral broadening. This should be evident in the signal in the form of amplitude modulation of the Mack mode. The second possibility is
$(1-\unicode[STIX]{x1D6E5})+\unicode[STIX]{x1D716}\rightarrow (1-\unicode[STIX]{x1D6E5}+\unicode[STIX]{x1D716})$
, which indicates an interaction between the lower sideband of the Mack mode with a low-frequency wave to contribute to spectral broadening. This should be evident in the signal in the form of amplitude modulation of the Mack mode. The second possibility is
 $(1-\unicode[STIX]{x1D6E5}+\unicode[STIX]{x1D716})-(1-\unicode[STIX]{x1D6E5})\rightarrow \unicode[STIX]{x1D716}$
, which is an interaction between different Mack-mode sideband frequencies to create or else reinforce
$(1-\unicode[STIX]{x1D6E5}+\unicode[STIX]{x1D716})-(1-\unicode[STIX]{x1D6E5})\rightarrow \unicode[STIX]{x1D716}$
, which is an interaction between different Mack-mode sideband frequencies to create or else reinforce
 $\unicode[STIX]{x1D716}$
. The final possibility is
$\unicode[STIX]{x1D716}$
. The final possibility is
 $(1-\unicode[STIX]{x1D6E5}+\unicode[STIX]{x1D716})-\unicode[STIX]{x1D716}\rightarrow (1-\unicode[STIX]{x1D6E5})$
, which is an interaction between the sidebands and
$(1-\unicode[STIX]{x1D6E5}+\unicode[STIX]{x1D716})-\unicode[STIX]{x1D716}\rightarrow (1-\unicode[STIX]{x1D6E5})$
, which is an interaction between the sidebands and
 $\unicode[STIX]{x1D716}$
to contribute to spectral broadening. Determining which of these is definitively the case requires the use of the cross-bispectrum in a future experiment.
$\unicode[STIX]{x1D716}$
to contribute to spectral broadening. Determining which of these is definitively the case requires the use of the cross-bispectrum in a future experiment.
The first of these possibilities has the most support in literature, and indicates the interaction of low-speed waves of another family with the primary Mack mode. In particular, if the low frequency represented first-mode waves, which are known to be oblique in supersonic flows (Mack Reference Mack1984), then the mechanism would be expected to be quite similar to the resonant triad described by Craik (Reference Craik1971) where a pair of symmetric oblique wave interact with a two-dimensional Tollmien–Schlichting wave in subsonic flows.
In order to assess this possibility that such a triad interaction may be playing a role in the present experiments, several approximate calculations were performed. Let the dominant frequency of the Mack mode be denoted
 $\unicode[STIX]{x1D714}_{0}=2\unicode[STIX]{x03C0}f_{0}$
as before. The spanwise wavenumber may be calculated by
$\unicode[STIX]{x1D714}_{0}=2\unicode[STIX]{x03C0}f_{0}$
as before. The spanwise wavenumber may be calculated by
 $\unicode[STIX]{x1D6FC}_{0}=\unicode[STIX]{x1D714}_{0}/c_{0}$
, where
$\unicode[STIX]{x1D6FC}_{0}=\unicode[STIX]{x1D714}_{0}/c_{0}$
, where
 $c_{0}$
is the phase velocity of the Mack mode and is assumed here to be that of the slow acoustic wave,
$c_{0}$
is the phase velocity of the Mack mode and is assumed here to be that of the slow acoustic wave,
 $c_{0}/u_{e}=1-1/M_{e}$
. Here, subscript
$c_{0}/u_{e}=1-1/M_{e}$
. Here, subscript
 $e$
denotes quantities at the boundary layer edge.
$e$
denotes quantities at the boundary layer edge.
Craik (Reference Craik1971) shows that interacting oblique waves must have a spanwise wavenumber of
 $\unicode[STIX]{x1D6FC}_{0}/2$
, so the wavenumber of the pair of oblique waves must be
$\unicode[STIX]{x1D6FC}_{0}/2$
, so the wavenumber of the pair of oblique waves must be
 $$\begin{eqnarray}\unicode[STIX]{x1D6FC}_{1}=\frac{\unicode[STIX]{x1D6FC}_{0}}{2}=\frac{\unicode[STIX]{x03C0}f_{0}}{c_{0}}.\end{eqnarray}$$
This may be converted by the use of the wave angle,
 $\unicode[STIX]{x1D713}$
, into the corresponding spanwise wavenumber,
$\unicode[STIX]{x1D713}$
, into the corresponding spanwise wavenumber,
 $\unicode[STIX]{x1D6FD}$
, by
$\unicode[STIX]{x1D6FD}$
, by
 $$\begin{eqnarray}\unicode[STIX]{x1D6FD}_{1}=\unicode[STIX]{x1D6FC}_{1}\tan \unicode[STIX]{x1D713}=\frac{\unicode[STIX]{x03C0}f_{0}}{c_{0}}\tan \unicode[STIX]{x1D713}.\end{eqnarray}$$
This may, in turn, be converted into the circumferential wave number,
 $k_{c}$
(number of peaks per model circumference), by
$k_{c}$
(number of peaks per model circumference), by
 $$\begin{eqnarray}k_{c}=\frac{\unicode[STIX]{x1D6FD}_{1}C}{2\unicode[STIX]{x03C0}}=\unicode[STIX]{x1D6FD}_{1}R=\frac{\unicode[STIX]{x03C0}f_{0}R}{c_{0}}\tan \unicode[STIX]{x1D713},\end{eqnarray}$$
where
 $C$
is the model circumference and
$C$
is the model circumference and
 $R$
is the model radius. Here
$R$
is the model radius. Here
 $k_{c}$
is a commonly cited measure of azimuthal periodicity and may be readily compared with existing experiments and computations.
$k_{c}$
is a commonly cited measure of azimuthal periodicity and may be readily compared with existing experiments and computations.
In hypersonic boundary layers, it is well known that the most unstable first-mode waves are oblique (Mack Reference Mack1984), making them prime candidates for triad interactions with the Mack mode. According to Mack (Reference Mack1984), the wave angle for the most unstable oblique, first-mode waves is typically between 50 and
 $60^{\circ }$
. Accordingly
$60^{\circ }$
. Accordingly
 $\unicode[STIX]{x1D713}=55^{\circ }$
has been selected to model an unstable first-mode wave in the present analysis along with
$\unicode[STIX]{x1D713}=55^{\circ }$
has been selected to model an unstable first-mode wave in the present analysis along with
 $f_{0}=250~\text{kHz}$
as observed in the present experiments.
$f_{0}=250~\text{kHz}$
as observed in the present experiments.
Using these values,
 $k_{c}=95$
. This is consistent with Sivasubramanian & Fasel (Reference Sivasubramanian and Fasel2015), who observed
$k_{c}=95$
. This is consistent with Sivasubramanian & Fasel (Reference Sivasubramanian and Fasel2015), who observed
 $k_{c}=100$
to be the most resonant oblique mode in their DNS, and Ward et al. (Reference Ward, Wheaton, Chou, Berridge, Letterman, Luersen and Schneider2012) observed streaks at
$k_{c}=100$
to be the most resonant oblique mode in their DNS, and Ward et al. (Reference Ward, Wheaton, Chou, Berridge, Letterman, Luersen and Schneider2012) observed streaks at
 $k_{c}=75$
in their experiments. Both of these studies were conducted on a similar geometry at similar conditions to the present experiments. The relatively good agreement between this simple analysis and these two studies provides strong evidence that a resonant triad may be at work in generating the azimuthal periodicity exhibited therein. In order to confirm this experimentally, a cross-bispectrum is required along with data concerning wave speeds and angles.
$k_{c}=75$
in their experiments. Both of these studies were conducted on a similar geometry at similar conditions to the present experiments. The relatively good agreement between this simple analysis and these two studies provides strong evidence that a resonant triad may be at work in generating the azimuthal periodicity exhibited therein. In order to confirm this experimentally, a cross-bispectrum is required along with data concerning wave speeds and angles.
Returning to figure 13, as
 $Re_{z}$
increases, a second peak begins to form (figure 13
b) and continues to grow up until the breakdown point. After
$Re_{z}$
increases, a second peak begins to form (figure 13
b) and continues to grow up until the breakdown point. After
 $Re_{z}=4.39\times 10^{6}$
(figure 13
c), the secondary peak continues to grow while the original peak begins to lose amplitude. This secondary peak is centred around
$Re_{z}=4.39\times 10^{6}$
(figure 13
c), the secondary peak continues to grow while the original peak begins to lose amplitude. This secondary peak is centred around
 $(1+\unicode[STIX]{x1D6E5},\unicode[STIX]{x1D716})$
and has a similar list of possible interactions to the original peak, including
$(1+\unicode[STIX]{x1D6E5},\unicode[STIX]{x1D716})$
and has a similar list of possible interactions to the original peak, including
 $(1+\unicode[STIX]{x1D6E5})+\unicode[STIX]{x1D716}\rightarrow 1+\unicode[STIX]{x1D6E5}+\unicode[STIX]{x1D716}$
, which corresponds to the possible resonant triad. Notably, the two peaks never coalesce until the boundary layer transitions.
$(1+\unicode[STIX]{x1D6E5})+\unicode[STIX]{x1D716}\rightarrow 1+\unicode[STIX]{x1D6E5}+\unicode[STIX]{x1D716}$
, which corresponds to the possible resonant triad. Notably, the two peaks never coalesce until the boundary layer transitions.
The behaviour of the peak at
 $(2,0)$
, depicted in figure 14, is similar to but distinct from that of the
$(2,0)$
, depicted in figure 14, is similar to but distinct from that of the
 $(1,0)$
peaks. Once again, at lower
$(1,0)$
peaks. Once again, at lower
 $Re_{z}$
, the peak forms at
$Re_{z}$
, the peak forms at
 $2-\unicode[STIX]{x1D6E5}$
(figure 14
a) and a second peak forms at
$2-\unicode[STIX]{x1D6E5}$
(figure 14
a) and a second peak forms at
 $2+\unicode[STIX]{x1D6E5}$
at a slightly higher Reynolds number (figure 14
b). These again have similar lists of possible interactions to the
$2+\unicode[STIX]{x1D6E5}$
at a slightly higher Reynolds number (figure 14
b). These again have similar lists of possible interactions to the
 $(1,0)$
peaks, including an interaction with low-frequency oblique waves. Notably, however, at moderate
$(1,0)$
peaks, including an interaction with low-frequency oblique waves. Notably, however, at moderate
 $Re_{z}$
(beginning in figure 14
c), the two peaks merge, well before transition. Unlike the
$Re_{z}$
(beginning in figure 14
c), the two peaks merge, well before transition. Unlike the
 $(1,0)$
peak, where the Mack-mode fundamental interacts with
$(1,0)$
peak, where the Mack-mode fundamental interacts with
 $\unicode[STIX]{x1D716}$
only through its sidebands, the harmonic interacts with
$\unicode[STIX]{x1D716}$
only through its sidebands, the harmonic interacts with
 $\unicode[STIX]{x1D716}$
directly. It is not clear why this is the case.
$\unicode[STIX]{x1D716}$
directly. It is not clear why this is the case.
In both the
 $(1,0)$
and
$(1,0)$
and
 $(2,0)$
cases, the peaks broaden along the abscissa (figures 13
f, 14
f) and eventually diminish completely (not shown) as a result of transition.
$(2,0)$
cases, the peaks broaden along the abscissa (figures 13
f, 14
f) and eventually diminish completely (not shown) as a result of transition.
4.3 Amplitude modulation
The existence of bispectral peaks near
 $(1,\unicode[STIX]{x1D716})$
and
$(1,\unicode[STIX]{x1D716})$
and
 $(2,\unicode[STIX]{x1D716})$
suggests the presence of amplitude modulation in these waves respectively, which has been observed in several previous studies (e.g. Kimmel & Kendall Reference Kimmel and Kendall1991; Chokani Reference Chokani1999, Reference Chokani2005; Hofferth et al.
Reference Hofferth, Humble, Floryan and Saric2013). A number of theories for the origin of this modulation of the Mack mode have been suggested, including interactions with low-frequency waves and sideband interactions. In particular, Hofferth et al. (Reference Hofferth, Humble, Floryan and Saric2013) suggested that intermittent turbulence in the free stream may play a role in the Mack-mode amplitude modulation.
$(2,\unicode[STIX]{x1D716})$
suggests the presence of amplitude modulation in these waves respectively, which has been observed in several previous studies (e.g. Kimmel & Kendall Reference Kimmel and Kendall1991; Chokani Reference Chokani1999, Reference Chokani2005; Hofferth et al.
Reference Hofferth, Humble, Floryan and Saric2013). A number of theories for the origin of this modulation of the Mack mode have been suggested, including interactions with low-frequency waves and sideband interactions. In particular, Hofferth et al. (Reference Hofferth, Humble, Floryan and Saric2013) suggested that intermittent turbulence in the free stream may play a role in the Mack-mode amplitude modulation.

Figure 15. Mack-mode wavepackets calculated by band-pass filtering the schlieren data at
 $\pm 20~\text{kHz}$
surrounding the fundamental as determined by the PSD.
$\pm 20~\text{kHz}$
surrounding the fundamental as determined by the PSD.
To investigate this further, the data at each
 $Re_{z}$
were filtered using a digital, 8-pole, band-pass Butterworth filter with zero phase distortion. The cutoff frequencies were chosen as
$Re_{z}$
were filtered using a digital, 8-pole, band-pass Butterworth filter with zero phase distortion. The cutoff frequencies were chosen as
 $f_{0}\pm 20~\text{kHz}$
. Several time traces of this data are plotted in figure 15. The signals show a clear amplitude modulation with an overall decrease in amplitude during (figure 15
c) and after transition (figure 15
d). A Hilbert transform was then performed on the band-passed signals in order to demodulate them. The envelope curves are plotted in figure 15 as bold lines.
$f_{0}\pm 20~\text{kHz}$
. Several time traces of this data are plotted in figure 15. The signals show a clear amplitude modulation with an overall decrease in amplitude during (figure 15
c) and after transition (figure 15
d). A Hilbert transform was then performed on the band-passed signals in order to demodulate them. The envelope curves are plotted in figure 15 as bold lines.

Figure 16. PSDs of the envelopes of the band-passed signals. Energy is broadband at low frequencies, even prior to the onset of intermittency. A small bump is visible in the peaks at the same
 $Re_{z}$
where intermittency increases.
$Re_{z}$
where intermittency increases.
The power spectra of the envelope signals were then calculated, a sampling of which are plotted in figure 16. The spectra show that the envelope wave is excited broadly from DC out to approximately 40 kHz, where the roll off reaches approximately two decades. The spectrum broadly rises with
 $Re_{z}$
until it reaches a maximum at
$Re_{z}$
until it reaches a maximum at
 $Re_{z}=4.6\times 10^{6}$
, at which point it begins attenuating through the transition process. This is in agreement with the qualitative analysis of figure 15. Also notable is the slight bump that appears in the 0–5 kHz range in the spectra that becomes dramatically larger just before breakdown. The nature of this peak shall be obvious shortly.
$Re_{z}=4.6\times 10^{6}$
, at which point it begins attenuating through the transition process. This is in agreement with the qualitative analysis of figure 15. Also notable is the slight bump that appears in the 0–5 kHz range in the spectra that becomes dramatically larger just before breakdown. The nature of this peak shall be obvious shortly.

Figure 17. Traces of STFT at
 $f=1.5f_{0}$
as a function of
$f=1.5f_{0}$
as a function of
 $Re_{z}$
. Note the turbulent bursts increasing in frequency as
$Re_{z}$
. Note the turbulent bursts increasing in frequency as
 $Re_{z}$
approaches transition.
$Re_{z}$
approaches transition.
Next, it is instructive to compare these spectra to the intermittent free-stream turbulent bursts. The best way to do this is to produce a time signal representing the bursts as a function of time and calculate their spectra. This was done be taking a horizontal trace through the spectrograms in figure 7 at
 $f=1.5f_{0}$
to produce a time series of the PSD at that frequency. Since
$f=1.5f_{0}$
to produce a time series of the PSD at that frequency. Since
 $1.5f_{0}$
is directly between the Mack-mode peak and its harmonic, it remains constant and low level except when there is a turbulent burst. Several of these traces are plotted in figure 17. Note the dramatic increase in intermittency just prior to transition (figure 17
c) and the broadband signal in the turbulent region (figure 17
d).
$1.5f_{0}$
is directly between the Mack-mode peak and its harmonic, it remains constant and low level except when there is a turbulent burst. Several of these traces are plotted in figure 17. Note the dramatic increase in intermittency just prior to transition (figure 17
c) and the broadband signal in the turbulent region (figure 17
d).

Figure 18. Power spectral density plots of intermittent turbulent bursts at
 $f=1.5f_{0}$
as a function of
$f=1.5f_{0}$
as a function of
 $Re_{z}$
.
$Re_{z}$
.
Each of these intermittency signals was then passed through a high-pass filter to make it more suitable for use with a fast Fourier transform. The PSDs were then calculated, several of which are plotted in figure 18. The plot has been truncated at 10 kHz due to the rapid roll off after this point. It is obvious that there are no dominant frequencies associated with the tunnel intermittency except near the
 $Re_{z}=4.8\times 10^{6}$
point. This exactly corresponds with figure 17(c) where the intermittency level dramatically increases, and the intermittent power is contained entirely in the range of 0–2 kHz. This, in turn, matches well with the peak that is present in the PSD of the envelope curve at the same
$Re_{z}=4.8\times 10^{6}$
point. This exactly corresponds with figure 17(c) where the intermittency level dramatically increases, and the intermittent power is contained entirely in the range of 0–2 kHz. This, in turn, matches well with the peak that is present in the PSD of the envelope curve at the same
 $Re_{z}$
in figure 16. Therefore, it appears unlikely that the tunnel intermittency plays a major role in the amplitude modulation of the Mack mode in such experiments except near the point of loss of quiet flow. At this point, it appears only in superposition with existing amplitude modulation.
$Re_{z}$
in figure 16. Therefore, it appears unlikely that the tunnel intermittency plays a major role in the amplitude modulation of the Mack mode in such experiments except near the point of loss of quiet flow. At this point, it appears only in superposition with existing amplitude modulation.
Since tunnel intermittency does not adequately explain the amplitude modulation, the source of this behaviour must be related to the bispectral peaks at
 $(n,\unicode[STIX]{x1D716})$
, where
$(n,\unicode[STIX]{x1D716})$
, where
 $n$
is an integer representing the Mack mode or its harmonics. This agrees with the results of Chokani (Reference Chokani2005), who performed a complex demodulation and reached the same conclusion.
$n$
is an integer representing the Mack mode or its harmonics. This agrees with the results of Chokani (Reference Chokani2005), who performed a complex demodulation and reached the same conclusion.
5 Conclusion
High-bandwidth focusing schlieren data originally collected by Hofferth et al. (Reference Hofferth, Humble, Floryan and Saric2013) in a low-disturbance, hypersonic wind tunnel were reanalysed. Multiple nonlinear interactions of the Mack mode were detected and examined through the use of the bicoherence spectrum. Amplitude modulation was examined through the use of the Hilbert transform and its relationship to tunnel intermittency was discussed. Transition to turbulence occurred only due to the loss of quiet flow.
Evidence of nonlinearity is present even at the lowest
 $Re_{z}$
measured in the study in the form of significant harmonics in the power spectrum and a large corresponding peak in the bispectrum. A second harmonic is also observed in the spectra and bispectra at moderate
$Re_{z}$
measured in the study in the form of significant harmonics in the power spectrum and a large corresponding peak in the bispectrum. A second harmonic is also observed in the spectra and bispectra at moderate
 $Re_{z}$
. The bispectrum indicates that there is considerable quadratic nonlinear interaction in the sidebands, contributing ultimately to the wider FWHM bandwidth of higher harmonics relative to lower harmonics and the fundamental. A secondary peak near
$Re_{z}$
. The bispectrum indicates that there is considerable quadratic nonlinear interaction in the sidebands, contributing ultimately to the wider FWHM bandwidth of higher harmonics relative to lower harmonics and the fundamental. A secondary peak near
 $(1,1)$
also contributes to the spectral broadening of the Mack mode itself. Interactions leading to higher harmonics are also present, though without the presence of a secondary peak.
$(1,1)$
also contributes to the spectral broadening of the Mack mode itself. Interactions leading to higher harmonics are also present, though without the presence of a secondary peak.
There are additional indications of interactions between the Mack mode, low-frequency waves, and potentially the mean flow. Pairs of more stable oblique waves are known to interact with dominant two-dimensional waves in low-speed flows and there exists a strong energy-transfer mechanism between the mean flow and the resonant triad in such cases (Craik Reference Craik1971). A series of simple calculations show that it is plausible that such an interaction is occurring in the boundary layer of the present study, though further experiments are required in order to confirm this.
The low-frequency interactions are visible in the time series representing the Mack mode in the form of a low-frequency amplitude modulation. The envelope wave of this modulated time signal contains a broad range of frequencies that do not appear to coincide with the frequencies dominating tunnel intermittency until just before loss of quiet flow. At that point, the modulation spectrum only responds in a narrow band coinciding with the intermittency spectrum in a manner that suggests the two phenomena are independent.
Future potential studies in this area could aim to address the ambiguity of sum and difference interaction relationships via multi-point measurements and use of the cross-spectrum. Sufficient improvements to the measurement depth of field would permit wave speeds and angles to be determined, and enable substantiation of potential resonant triads similar to those of Craik (Reference Craik1971), including those involving the Mack mode with itself or with first-mode waves. Grouped surface pressure sensors would also allow a more complete characterization of the wave speeds and angles.
Acknowledgements
The authors would like to acknowledge D. Floryan for his role in constructing the schlieren system as described in Hofferth et al. (Reference Hofferth, Humble, Floryan and Saric2013), which laid the groundwork for the present study. Funding was provided by NASA and AFOSR through the National Center for Hypersonic Laminar-Turbulent Transition Research (AFOSR grant FA9550-09-1-0341).


