MOBILE APPS AND THE BORN-DIGITAL REVOLUTION IN ARCHAEOLOGY
As the costs of archaeological fieldwork rise, which result in shorter, more intensive research seasons, archaeologists are leveraging new paperless recording technologies in field and laboratory settings to increase the efficiency and accuracy of data collection and management in their respective contexts. Much of the recent literature on digital data collection in archaeology (including in the pages of this journal) has exposed the wide spectrum of solutions currently available for field and laboratory settings, along with debates on their respective merits. After a brief overview of common data collection platforms, this article focuses on the utility of Esri's ArcGIS Collector mobile app (formerly “Collector for ArcGIS”) as an aid to digital capture of survey data, and it outlines a workflow to leverage this tool for reducing field costs and streamlining the management of field-collected data in the context of a settlement survey in Armenia.
Currently, the range of data collection platforms commonly used on archaeological projects includes bespoke systems incorporating databases such as FAIM, often custom built by programming specialists (e.g., Fee et al. Reference Fee, Pettegrew and Caraher2013); off-the-shelf commercial data management software with field collection apps, such as the popular FileMaker Pro/FileMakerGo package (e.g., Banning and Hitchings Reference Banning and Hitchings2015; Gordon, Averett, Counts, Koo et al. Reference Gordon, Averett, Counts, Koo, Toumazou, Averett, Gordon and Counts2016; Spigelman et al. Reference Spigelman, Roberts, Fehrenbach, Averett, Gordon and Counts2016); user-friendly subscription-based apps such as Wildnote and Fulcrum, which provide customizable archaeology field templates and premade digital cultural resource management (CRM) forms; and finally, DIY “open archaeology” databases built on free, open-source platforms, which are cheaper but require a higher level of in-house development skills (e.g., Cascalheira et al. Reference Cascalheira, Goncalves and Bicho2014; Knodell et al. Reference Knodell, Alcock, Tuttle, Cloke, Erickson-Gini, Feldman, Rollefson, Sinibaldi, Urban and Vella2017; Morgan and Eve Reference Morgan and Eve2012; Vincent et al. Reference Vincent, Kuester and Levy2014). The reception of these field technologies has been generally, if not uniformly, positive. Some practitioners laud these digital advancements as the onset of a new “cyberarchaeology paradigm” (Roosevelt et al. Reference Roosevelt, Cobb, Moss, Olson and Ünlüsoy2015:339), whereas others lament the skill sets and reflexivity lost in the crossover to the digital domain, advocating a return to a “slow archaeology” (Caraher Reference Caraher, Averett, Gordon and Counts2016). These lively discussions represent a necessary vetting of emerging technologies and their impact on archaeological practice from data acquisition to curation, analysis, sharing, and reproducibility (see Wilkinson et al. [Reference Wilkinson, Dumontier, Aalbersberg, Appleton, Axton and Baak2016] for an overview of FAIR Guiding Principles, which are increasingly influencing the discourse on data stewardship and accessibility within digital archaeology). Important to keep in mind, however, is that each platform option represents an individual solution to the highly variable field/lab conditions and technical backgrounds that can characterize archaeological projects. Following this, we concur with Gordon, Averett, and Counts (Reference Gordon, Averett, Counts, Averett, Gordon and Counts2016:25), who maintain that the wide spectrum of technical circumstances across institutions—as well as project budgets, field conditions, and digital skill sets—conspire against the sorts of unifying practices that would constitute a “paradigm” as traditionally defined. For those new to these issues, the open-access volume Mobilizing the Past for a Digital Future, edited by Averett and colleagues (Reference Averett, Gordon and Counts2016), is a comprehensive resource illustrating the range of dispositions and wisdom gained by some of the early adopters of high-tech data collection strategies in archaeology.
To date, the end-user discussions cited above have focused most prominently on strategies for collecting and curating the massive quantities of complex temporal, spatial, and attribute data generated in archaeological excavations (e.g., Jackson et al. Reference Jackson, Motz and Brown2016; Roosevelt et al. Reference Roosevelt, Cobb, Moss, Olson and Ünlüsoy2015; Tripcevich and Wernke Reference Tripcevich and Wernke2010), or analytical procedures in the laboratory (e.g., Sharp and Litschi Reference Sharp and Litschi2014; VanValkenburgh et al. Reference VanValkenburgh, Silva, Repetti-Ludlow, Gardner, Crook and Ballsun-Stanton2018). By contrast, fewer of these recent discussions have centered around digital data collection in settlement survey contexts, despite similar needs for managing high volumes of locational and attribute data, and access demands for rapid data sharing and collaboration on international and multidisciplinary teams (but see Banning and Hitchens [Reference Banning and Hitchings2015], Cascalheira et al. [Reference Cascalheira, Bicho and Goncalves2017], and Spigelman et al. [Reference Spigelman, Roberts, Fehrenbach, Averett, Gordon and Counts2016] for recent exceptions). Several years ago, Tripcevich (Reference Tripcevich2004) offered one of the first published efforts in survey archaeology to “de-black box” the design of a mobile GIS system using Esri's ArcPad 6 software on a Pocket PC and its implementation on a pedestrian survey of the Upper Colca region of the Andes. At the time, Tripcevich was pushing the frontier of mobile GIS on archaeological survey, and he remarked on both the technological limitations and theoretical concerns of this new technology—some of which have been mitigated with recent advances in mobile GIS applications, including Esri's ArcGIS Collector app.
Mobile GIS for Archaeological Survey
In brief, the term “mobile GIS” is used here to refer to collection, editing, analysis, and/or visualization of geospatial data in the field rather than on a desktop computer. As such, it generally involves the use of mobile devices—originally PDAs and expensive Trimble GPS systems, but more recently mobile phones, tablets, or laptops equipped with onboard GPS and GIS software. Extended functionality is possible where wireless communication allows the mobile devices to communicate directly with, and serve as an extension of, a desktop GIS system.
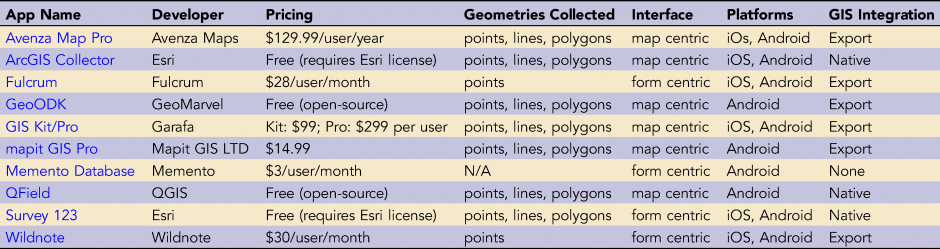
The past decade has seen the rapid expansion of GIS options open to field researchers and data managers as the functionality and processing power of open-source GIS solutions—such as QField, the mobile version of the popular open source QGIS platform, and GeoODK—make them attractive and cost-effective alternatives to expensive ArcGIS licenses,although currently both of these open-source solutions are only available for Android devices. Other commercial, spatially aware data collection systems tend to fall into two general categories: the first includes “form-centric” apps that use customizable digital form fields and reporting outputs. Although the archaeology market is not generally large enough to drive app development, a few apps—such as Fulcrum and Wildnote—created customized features aimed specifically for the CRM industry, which continues to drive the majority of archaeology in the United States. Many of the form-centric apps can integrate with a desktop GIS by syncing to the developer's web map service, but they are generally limited in their geospatial functionality, such as only recording point features.
Another category of data collection apps is “map-centric”—such as Avenza Maps Pro, Mapit GIS Pro, and ArcGIS Collector—and these function as mobile GIS solutions. They are able to collect point, line, and polygon data types, and the “pro” versions of these can export GIS data—often at additional cost—in standard geospatial file formats (KML, shapefiles, etc.) for integration with external geodatabases in ArcGIS or QGIS, or for use in online visualization tools such as Google Earth (see Table 1 for an overview of mobile data collection platforms).
TABLE 1. Sample of Spatially Aware Mobile Apps for GIS Data Collection.
RESEARCH CONTEXT
The mobile GIS data collection method described here was developed in the context of the Kasakh Valley Archaeological Survey (KVAS), an NSF-funded project entailing intensive and extensive settlement survey, aerial mapping, and test excavations in the upper Kasakh River valley of north-central Armenia. The KVAS settlement survey began in 2014 as an initiative of the joint Armenian-American Project for the Archaeology and Geography of Ancient Transcaucasian Societies (Project ArAGATS), which since 1998 has engaged in long-term investigations into the origins, maintenance, and collapse of ancient complex polities in the region (Badalyan et al. Reference Badalyan, Greene, Harutyunyan, Khatchadourian, Lindsay, Marshall and Smith2020; Lindsay and Greene Reference Lindsay and Greene2013; Smith Reference Smith and Potts2012; Smith et al. Reference Smith, Badalyan and Avetisyan2009). Building on the results of ArAGATS's settlement survey of the Tsaghkahovit Plain in 1998 and 2000 (Smith et al. Reference Smith, Badalyan and Avetisyan2009) and subsequent excavations at Bronze and Iron Age fortified sites on the plain (Badalyan et al. Reference Badalyan, Smith, Lindsay, Khatchadourian and Avetisyan2008, Reference Badalyan, Smith, Lindsay, Harutyunyan, Greene, Marshall, Monahan and Hovsepyan2014), our more recent survey was designed to provide a robust comparative data set from the neighboring Kasakh River valley through a holistic, systematic pedestrian survey of occupation phases spanning the Paleolithic through the Soviet era (Figure 1). Among the critical questions driving our survey of the Kasakh Valley are how changes in settlement patterns, material production, and violence correlate with factors such as local and regional environmental shifts, patterns of goods circulation and consumption, and historically documented changes in the Near East and Eurasian Steppe. Preliminary results of the KVAS survey are currently being prepared for publication in other venues. In the following sections, we highlight the development and use of our mobile GIS data collection system in the context of our settlement survey.

FIGURE 1. Map of the research areas surveyed by Project ArAGATS in northern Armenia. The mobile GIS workflow discussed here was used in the 2014–2017 Kasakh Valley Archaeological Survey area in red.
KVAS Survey Data Collection Needs
Embarking on a new survey provided the opportunity to design a data collection system from the ground up, allowing us to reflect on how new digital solutions might help us overcome the challenges encountered during our initial 1998/2000 settlement survey of the Tsaghkahovit Plain. For example, in 2000, sites encountered on transect were recorded in field notebooks with coordinates fixed using handheld GPS devices, a common practice that still holds value in the field today for its iterative approach to site recording. The hybrid paper/digital method worked well at the time for singular architectural features, such as fortresses and settlements, but it was less adept at capturing the redundant, tightly packed clusters of Bronze Age cromlech (stone circle) burials that stretched along the foothills surrounding the Tsaghkahovit Plain. Faced with such high frequencies of burials, project surveyors described representative or highly distinctive tombs within a burial cluster and then estimated the number of burials it contained. In essence, the cluster became the minimum unit of recording a mortuary landscape because it was impossible to record each individual tomb given the constraints of time and technology (Smith et al. Reference Smith, Badalyan and Avetisyan2009:102). Nevertheless, it was clear that there were volumes of untapped spatial data in the mortuary and archaeological landscapes once the technology had advanced enough to capture them efficiently in the field.
In brainstorming which features we wanted in a survey data collection system, we identified a number of parameters we hoped to satisfy (cf. Fee Reference Fee, Averett, Gordon and Counts2016:223). These included
(1) providing built-in backup procedures to protect data integrity,
(2) leveraging the affordability and familiar user interface of mobile devices,
(3) operating on both iOS and Android platforms,
(4) providing an easy and efficient workflow for GIS nonspecialists,
(5) providing in-field access to reference data within our survey area (e.g., legacy sites, high-resolution satellite imagery, historic maps), and
(6) maximizing the equitable information flow between surveyors in the field.
Based on reviews of available mobile GIS solutions in 2014, it seemed that Esri's then-new Collector for ArcGIS app would satisfy many of our survey needs, although its use had not yet been well documented in the archaeological literature (e.g., Sharp and Litschi Reference Sharp and Litschi2014:Table 1), and it still remains underdocumented in the archaeological literature. The Collector app was developed by Esri for industry and crowdsourced (i.e., “participatory” or “citizen science”) data collection in a way that allows project managers to control which data fields in a GIS are visible or editable to users in the field so as to maximize consistency and minimize entry errors, a feature with clear value in archaeological field settings. In addition, unlike site information recorded on paper forms that must be manually entered into a project database, data entered into Collector is transferred instantly to the project GIS and synced across project devices. Collector's real-time sync feature convinced us of its value with the ability to (a) facilitate mid-transect consultation between surveyors, allowing survey leaders to quickly address data collection errors in the field, and (b) avoid burdensome and potentially risky manual syncing of devices to a master database each night. As detailed in the section that follows, in locations where internet is less reliable, project web maps—or portions of maps—can be downloaded to mobile devices to allow offline data collection and then synced when the devices are again internet accessible.
Despite these attractive features, the decision to commit to the ArcGIS platform was not a forgone conclusion. Low-cost alternatives to proprietary, enterprise-scale software packages are particularly important for archaeology projects that are housed in—or that contract with—small businesses, as well as for research projects that collaborate internationally with economically constrained institutions in the Global South and former Soviet republics. This latter issue characterizes Project ArAGATS, and so we gave serious consideration to the ethics and risks of encumbering our local partners in Armenia with the hardware and software commitments necessary to sustain a commercial GIS system that we bring to the field (sensu Sayre Reference Sayre, Averett, Gordon and Counts2016:193–195). Passionate debates in the GIS user community parsing the merits of open-source versus commercial GIS packages pivot on such economic, technical, and ethical considerations. Ultimately, however, the platform options available to any project are winnowed by the project's objectives, budgets, institutional support structure, and technical competencies. Although we appreciate the merits of arguments on both sides of the open-source/proprietary divide, in the end, we opted to develop our survey platform in the Esri ecosystem for three reasons: (1) the integrated features of ArcGIS, ArcGIS Online, and the Collector app met our data collection and management needs in ways that open-source packages cannot (at least not yet); (2) the American project leaders are at universities (Cornell and Purdue) that provide ArcGIS licenses and software and server support, removing a major overhead burden on the project; (3) we found workable (and legal) solutions to maintain continuous access for our in-country collaborators to project GIS resources during the off-season.
BUILDING A MOBILE GIS DATA COLLECTION SYSTEM FOR ARCGIS COLLECTOR
In the remainder of this article, we outline the three stages for building the data collection system for ArcGIS Collector: (1) developing a desktop project map in ArcGIS Pro, (2) customizing the user interface in a cloud-based web map in ArcGIS Online, and (3) entering and editing site data in the Collector app. Our suggestions and workflow are based on our own experiences over the course of several survey seasons. As such, we try to make explicit the particular conditions of our survey project, including the desktop and mobile computing equipment and software used. We emphasize, however, that the workflow is transferable to a range of survey-oriented projects regardless of geographic scale, and it is manageable by archaeologists with basic-to-intermediate experience in the ArcGIS environment.
Setting up a map-centric data collection system built around Collector first requires an ArcGIS Online organizational account, ArcGIS Pro (or ArcGIS for Desktop 10.x) installed on a Windows workstation, and login permissions to ArcGIS Online.Footnote 1 If one publishes their web map to ArcGIS Server (the method we chose), it is necessary to establish a connection to their organization's GIS server with publisher privileges through a server administrator. It is also vital to ensure that the server used is regularly backed up to avoid unexpected data loss. The workflow description that follows also assumes that a field data collection schema (i.e., data dictionary) is already in place based on the survey project objectives. In our case, we outlined a data model for the typology of sites and features we anticipated finding in the Kasakh Valley (fortress, settlement, artifact scatter, etc.), as well as the attribute fields appropriate for each type of site. These decisions adhered closely to the typologies and recording conventions used during ArAGATS's 1998/2000 survey in the neighboring Tsaghkahovit Plain in order to maximize comparability of the survey results (see Smith et al. Reference Smith, Badalyan and Avetisyan2009). Using our KVAS survey model as a case study, we begin by illustrating the process of developing a field-ready project web map. Most of the work of configuring the mobile GIS workflow takes place at this stage, well before the field season, so there is plenty of time to test connections and workflows. Supplemental Figure 1 provides a schematic of the workflow described below.
Step 1. Authoring a Desktop Project Map in ArcGIS Pro 2.5
Prepare the Geodatabase and Feature Classes for Mobile Data Collection
The initial step in creating a field-ready web map is to configure the data collection schema of anticipated site types, attribute fields, and other information within an Enterprise-relational Geodatabase.Footnote 2 If a project is moving from paper survey forms to a digital interface, this may just be a matter of transferring the site entry fields from the paper form to attribute field columns in the GIS. In most archaeological settings, recorded features and sites in the field will conform to any of the three feature geometries in a GIS: points (e.g., burial, artifact, fortress), lines (e.g., walls, canals, roads), and polygons (e.g., site boundaries, reservoirs). Consequently, we created both a feature dataset in our geodatabase for the survey data and individual feature classes within it for each of the categories and geometries of data we wanted to collect.
In order to add and edit data in a mobile GIS environment, there are a few mandatory configurations that must be made to the feature dataset during initial setup, accessible from the Catalog tab in ArcGIS Pro. These include adding GlobalID fields, enabling archiving of the data, and ensuring the data is nonversioned (the default), all of which are configured by right-clicking the feature dataset and accessing the Manage menu. If you wish to attach photos to site records in Collector, you can configure each feature class to accept attachments by selecting Create Attachments in the Manage menu of each feature class.
In order to facilitate comparisons with our 1998/2000 survey, we mirrored—to the extent possible—the site/feature typology from our prior survey, including nine types of point features (artifact scatter, burial cluster, corral, fortress, isolated architecture, isolated burial, settlement, stela, and “other”), four linear features (canal, canal trace, wall trace, and “other”), and two polygon features (reservoir and “other”; see Smith et al. [Reference Smith, Badalyan and Avetisyan2009:102] for a more complete definition and justification of these place types). We also added a separate layer to record individual tombs with a distinct set of attribute fields (e.g., approximate size, condition, associated burial cluster) in order to more efficiently apply geostatistical tools for identifying and interpreting cemetery boundaries and their spatial relationship to nearby fortresses and natural features.
Creating Coded Domains to Maintain Data Entry Consistency
One of the primary efficiencies of a digital data collection system is the ability to create pull-down menus to limit options and standardize field-collected data. This reduces time spent recording a site while simultaneously enforcing data integrity and diminishing the risk of data entry errors. Pull-down menu options visible in the Collector app are created using the coded value attribute domains function in ArcGIS Pro. Domains are defined in the geodatabase, and they can be shared across feature classes. To create a domain in ArcGIS Pro, in the Catalog pane, right-click the project geodatabase, and select Domains to display the domains window (Figure 2). In our case, to create a domain for our site typology, we defined the Domain Name as “Site Type” (along with a brief description). We then defined the Field Type as Text and the Domain Type as Coded Value Domain. In the other pane, we entered the names of each of our predefined point site types. This defines the site options available to select in the Collector site form. We repeated this procedure, creating domains for each attribute field for which pull-down menus are appropriate—essentially all fields not requiring a narrative description can be a coded domain. In our case, these included Approximate Diameter, Burial Type, Field Recorders, and Diagnostic Material (a list of major archaeological periods). Once created, each domain needs to be assigned to the appropriate attribute field that it will populate. Following the above example, we assigned the Site Type domain to the TYPE field in the point data feature class by right-clicking the feature class in the Catalog pane, selecting Design > Fields, and choosing Site Type from the pull-down menu of available domains. Having assigned the domain to the appropriate fields, the only data accepted for the TYPE field are from the predefined list of site types defined by the domain. It is also possible to add a Default Value that will automatically populate a field in the site form. For example, our site form contains a Site Location Method field in which we assigned “GPS” as the default value.

FIGURE 2. In the new project map in ArcGIS Pro 2.5, defining a new “Site Type” domain in the project's geodatabase and linking it to the TYPE field in the “Survey 2014–17 point features” layer.
Creating a Project Map in ArcGIS Pro
Once all domains were established and connected to their corresponding attribute fields, we configured the symbology and feature templates that define the user experience on survey. To symbolize the site types (the attribute most commonly used to collect and visualize data on the survey map), we created a blank project in ArcGIS Pro and added the feature class layers to the map. The steps are (1) modify the symbology so that the features will be represented with different symbols on the map; (2) highlight the feature class to symbolize, and in the Appearance tab select Symbology > Unique Values (Figure 3); (3) in the Symbology pane, click the Field 1 pull-down menu and choose (in our example) Site Type to symbolize. You should see the list of site types that you defined as coded domain options in the previous step. If not, click the Add all values button. You can then customize the symbol for each site type and adjust the size and color schemes to enhance their visibility on a mobile device.

FIGURE 3. After adding all possible values for the Site Type field, customize the symbology for each site type.
Publishing Layers as a Feature Service
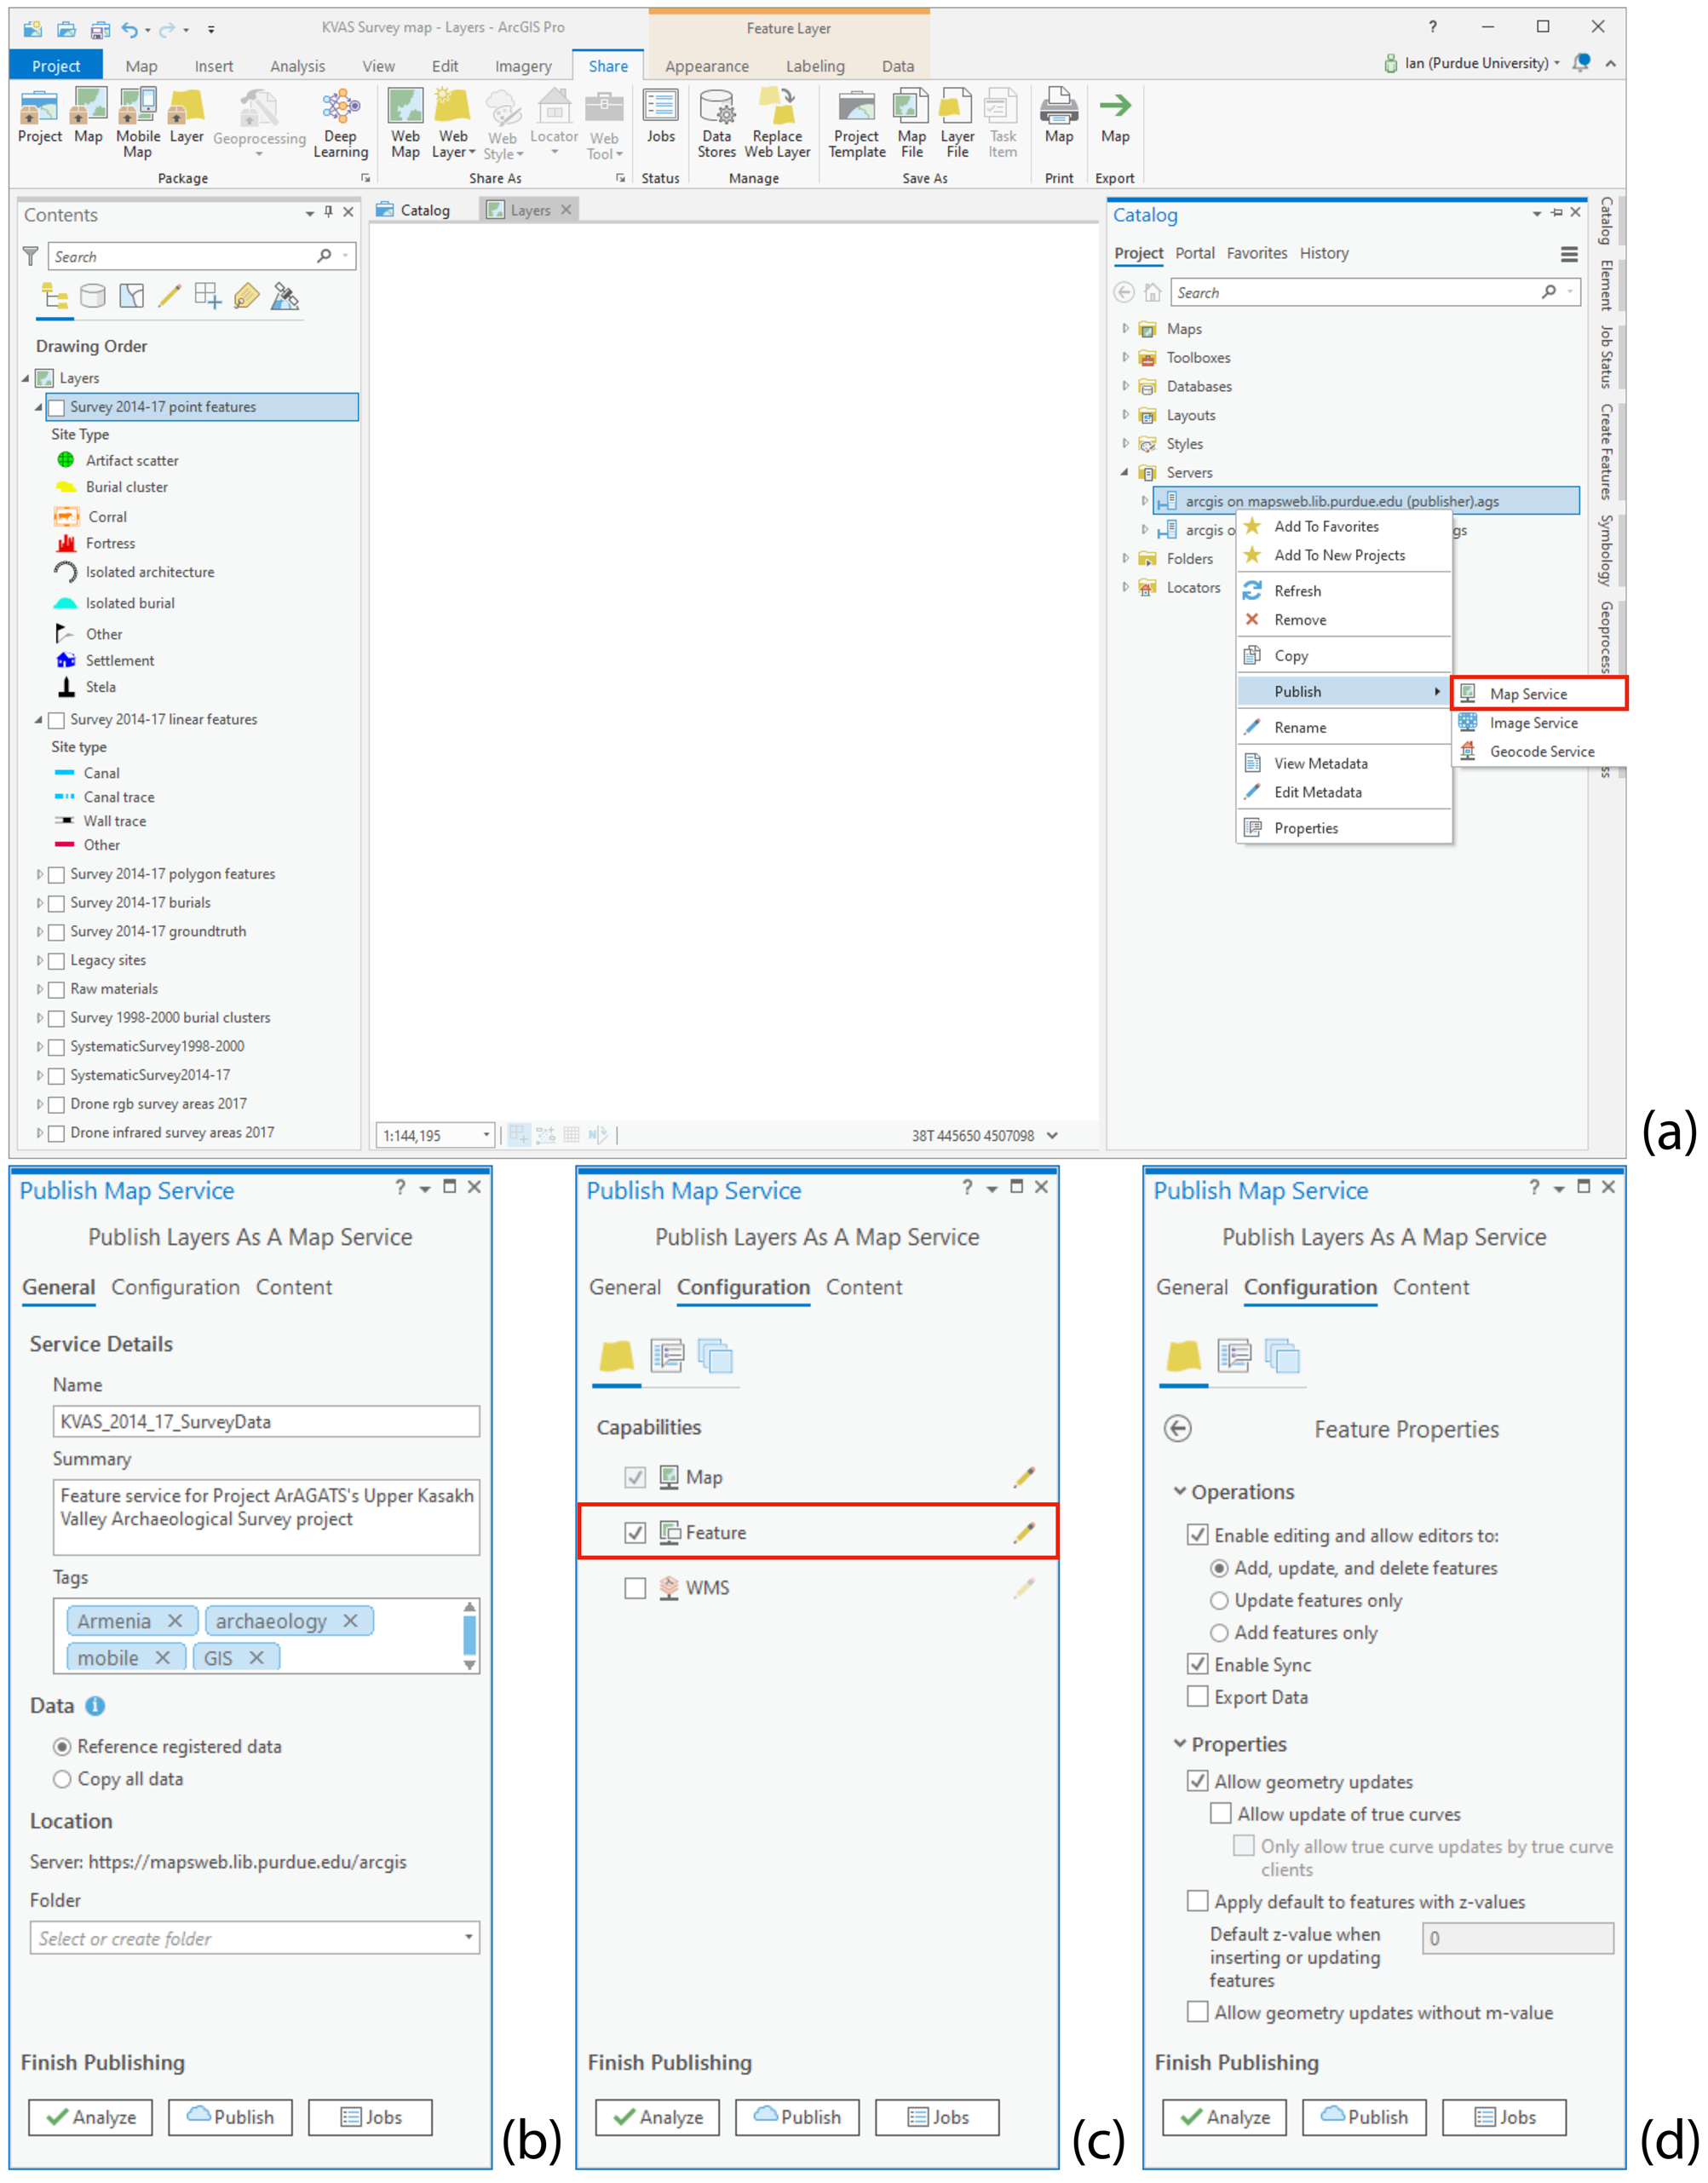
With the thematic aspects of the map in place, the project map is then published as a “feature service” to ArcGIS Server so that end-user clients, such as the Collector app, can add and edit features in the field. Another option is to publish the service directly to ArcGIS Online by selecting Share As > Web Layer, but because Purdue uses ArcGIS Server, we published the feature service to the server as described below. The advantage of publishing to server is that data added or edited via Collector are also visible in ArcGIS Pro, not just the web map in ArcGIS Online. If necessary, in ArcGIS Pro, you can create a connection to your organization's ArcGIS Server by selecting Insert > Connections > New ArcGIS Server and typing in the server URL and login credentials. When you are ready to publish, remove any raster base map layers that may have been added to the project map, because published feature services are only possible with vector datasets. Publishing an “image service” from a raster dataset is a separate procedure that we touch on briefly below. In the Catalog pane, browse to your ArcGIS Server, right-click the server, and select Publish > Map Service (Figure 4a). After opting to publish a new service or overwrite an existing one, type a name for your feature service and select the destination folder on the ArcGIS Server—usually set up by your organization's GIS administrator. Then, enter essential metadata about the feature service in the Summary field and add relevant tags. Whether you publish to ArcGIS Server or directly to AGOL, the software will not publish the service with empty tag and description fields (Figure 4b).

FIGURE 4. Publishing map layers as a feature service: (a) right-click the server and select Publish > Map Service; (b) add required summary and tags in the General pane; (c–d) check Feature and enable editing permissions for the feature service. Be sure Enable Sync is checked to allow data collection in offline mode.
Next, customize the map's editing permissions and other parameters. First, in the Publish Map Service pane under Configuration > Capabilities, check the box next to Feature (by default, only Map is autoselected; Figure 4c). Enabling feature access is vital because it allows Collector users to add and edit site data (as opposed to a view-only interface with the map). You can further configure service properties by clicking the pencil (edit) tool next to Feature. Confirm that the Add, update, and delete features permission is checked. If you anticipate at any time using the feature service in offline mode, check the Enable Sync box to activate this function (Figure 4d).
With the parameters and permissions defined for the feature service, press Analyze to determine if there are any errors or warnings in the dataset that need to be addressed prior to its publication—only issues flagged as “errors” with a red “X” will prevent the publication of the service and must be addressed. If there are no major issues, press Publish, and after a few moments the feature service will appear in your ArcGIS Server folder.
In addition to the feature services for vector data, we separately published raster datasets as image services, including high-resolution Pleiades satellite imagery and georeferenced historic Soviet-era topo maps, which allowed us to load them as background images on the Collector app. The procedure for publishing raster image services is similar to publishing feature layers, with the difference that each raster must be published separately as an individual service. For example, each of our Soviet topo maps was published as separate image services—rather than adding all of the raster layers together on the same map and publishing the map as a single image service (as we did with the vector feature classes). Alternatively, if using a series of historic maps or aerial photos, it is possible to set up a raster mosaic dataset in the project geodatabase and publish it as an image service.
Step 2. Prepare the Web Map in ArcGIS Online (AGOL)
Add the Published Feature Service to a New Web Map and Customize It for Data Collection
After publishing the feature service to your organization's GIS server, it should automatically appear as a hosted feature layer in the Contents window of AGOL. Next, we will add the service to a new web map, define the user permissions, and fine-tune the fields in the data that users can see and interact with in the Collector app. First, click on the title of your feature service to view the list of feature classes included in the service, as well as ownership information, the description and tags created when publishing the service, sharing permissions, and the service's REST URL. From the Contents window, click on the more options “…” menu symbol next to the date, and select Add to new map, which opens the map viewer with the feature service layers on a default topographic base map (Figure 5a). When you look at the names of each layer, the default names are very wordy because they automatically combine the name of the feature service with the name of the feature class (e.g., “KVAS_2014_17_SurveyData - Survey 2014–17 point features”). Give each layer a more manageable name that will take up less room on a mobile device's screen by clicking on the more options (…) menu item beneath each layer and selecting Rename.

FIGURE 5. Project web map viewer in ArcGIS Online: (a) web map with feature service and image service layers; (b) configuring pop-ups to determine how editable layers and menus will appear to end users in ArcGIS Collector. (In our case, the web map is populated with sites from the survey, but a new web map would, of course, be empty.)
Another useful feature in the layer options menu is the ability to set visibility ranges for each layer (sometimes referred to as the Out Beyond and In Beyond ranges) so that layers are set to automatically display on your map at a defined ranges of spatial scales. AGOL can offer suggestions for the optimal maximum and minimum zoom levels for the layer based on size and density of features on your web map, but these can be manually adjusted as well using the sliders. This tool is particularly useful to us for managing the display of high-density features such as individual burials, for which we set the minimum scale (or Out Beyond scale range) to 1:36,000.
Finally, to prevent the loss of important data layers exposed to multiple users and to enable use of the data on the mobile app, select the Settings tab for the web map, and activate the checkboxes next to Prevent this item from being accidentally deleted and Use in ArcGIS Collector. Save the settings. Similarly, go into the settings for each feature layer and make sure Prevent this item from being accidentally deleted is activated there as well. Confirm the editing capabilities for the feature layer, and save the settings.
Configuring Pop-Ups for Field Entries
A useful trait of AGOL web maps is the use of pop-ups to display attribute data associated with individual features, as well as attachments such as site photos or links to external web pages. Pop-ups are more than cosmetic, so it is worth the few minutes it takes to configure the pop-ups for each feature layer. In configuring pop-ups, you are effectively creating your field site forms, because the pop-up configuration determines which attribute fields will appear in the Collector app and in what order. To start, click the more options (…) menu item under a layer and select Configure Pop-up. To change the title that appears at the header of a feature's pop-up, you can use a combination of static text and attribute field values. For example, we wanted the title for each site entry's pop-up to reflect the name of the layer followed by the designated site name, so under Pop-up Title, we entered the static text “Survey 2014–17 point features:” and used the [ + ] button to select the {SITE_NAME} field from our data, resulting in the concatenation “Survey 2014–17 point features: {SITE_NAME}” (Figure 5b).
By default, nearly all of the fields from the layer's attribute table will be displayed and editable within Collector or directly in your web map. Some of the attribute fields (including those autogenerated by ArcGIS, such as ObjectId and GlobalID), however, are not useful for surveyors in the field and can add unnecessary clutter to the user interface. You can limit the fields displayed in the mobile app in order to both simplify the data collection form and confine editing permissions to specific fields, both of which serve to further reduce the risk of data entry errors in the field. Importantly, any interface modifications made to the web map in AGOL described here only affect how end users interact with the data on survey—they do not impact the root data on your geodatabase. Clicking Configure Attributes in the Configure Pop-up window brings up a window listing all of attribute fields associated with the layer, along with checkboxes to select the fields you want to display and edit during survey. Here, you can also edit the Field Alias for each attribute as you want it to appear on the app's data collection form. By selecting each field in turn, you can also customize how many lines of text are displayed for text fields and adjust the date format. Finally, change the order of how editable fields appear using the up and down arrows to create a logical site recording workflow for the end user—paper site forms can serve as a useful model for ordering the fields. When you are finished, click OK to close the Configure Attributes window, and you will return to the Configure Attributes sidebar window.
Confirm that Display: A list of field attributes is selected from the pull-down menu under Pop-up Contents. Notice that under These field attributes will display:, the fields you selected to display and their new order of appearance are reflected. You can make any further adjustments to the order of the fields using the up and down arrows here as well. Again, interface customizations here are cosmetic in that there is no corresponding effect to the root feature service on your server or to your geodatabase—in other words, none of the interface changes made in AGOL is visible when accessing the data in ArcGIS Pro. The only changes you will see in ArcGIS Pro are the added or edited data collected in the field. When you are finished making changes to the pop-ups, click OK to exit the Configure Pop-up screen and save the changes.
As an example, we provide the configured pop-ups for fortress sites on the KVAS survey in a simplified view-only web map that can be accessed in two ways: (1) to view the map in AGOL's map viewer (no login required) on a macOS or Windows machine, follow this link; (2) from a mobile device, the map can be viewed on the free ArcGIS Explorer app by searching for “KVAS survey web map: public demo.” Currently, the public map includes only fortress sites, but more sites will be made visible as our survey results are published.
Creating a Group and Inviting Project Members
At this stage, you can define to whom you would like to expose your map and underlying data. Unless the new map is designed for a crowdsourced data collection project open to the public, it is usually desirable for security purposes to limit access to the spatial and attribute data—particularly editing permissions—to members of your survey team. This is accomplished by creating a Group within AGOL, which serves as a collection of maps, feature and image layers, and other project-related content, to which you invite team members. To create a Group, select the Group tab and press Create Group. Give the group a name and add an optional image (e.g., a project logo). Then, add tags and a brief description, set permissions for who can join the group, and add content. For example, in our project's group, “Project ArAGATS 2015–17,” we elected to only allow group members to edit data layers, and we configured the group settings so that it can only be joined by invitation. Keep in mind that group membership is limited to those with ArcGIS organizational login credentials (i.e., not just an Esri public account).
The new group title and logo (if you added one) will appear in the Group tab, and it is now ready to accept new members as well as data layers and project maps to be shared. To invite new group members, from your Group window, click Invite Users. In the Search Users field, enter the name or Esri login ID of a collaborator you want to invite. Note that potential group members must have their AGOL profile set to be publicly visible in order to be searchable. Select Edit my profile and select [profile name] > My Profile > Who can see your profile? > Everyone (public). By default, the search filter is set to only find people within your own organization (i.e., your agency, university, company, etc.); deselect this filter to find users outside your organization. After locating a team member, click the Invite Users button. Members are then alerted to a pending invitation on their AGOL page.
It is also necessary to add content to the Group that will be shared with team members. There are a couple of ways to do this, but the simplest is from the main Content window. To share a layer with members (e.g., the feature service that surveyors will be contributing to in the field), click the layer to open its properties window, and then click Share to choose the Group you want to expose it to. Repeat this for the project web map, as well as other feature or image services you want to make available to group members. It is important to remember that the project map and the individual feature layers it contains each need to be shared with the group.
Step 3. Using ArcGIS Collector in the Field
Collect and Edit Site Data in the Field with Network Connection
With the data collection map configured and shared with your team, it is ready to receive data from the Collector app. As with any digital data collection system, it is important to test the workflow before departing for the field to iron out functionality, connection, and access issues. Open Collector on an iOS or Android device and sign in using an AGOL or ArcGIS Enterprise credential. The new web map should be visible in the Collector app's home screen. Assuming no sites have yet been added to the map, tapping the map will open an empty map of your project area. To add a new site at your location, tap the Collect New (![]() ) button. This brings up a panel displaying the list of all the possible feature types—points, lines, and polygons—that you defined and symbolized in ArcGIS Pro (Figure 6a). After selecting the site type from the menu, you will see the data-driven form that mirrors the pop-up configuration you defined in AGOL, including the list of attributes you selected to display and the order in which they should appear (Figure 6b). Complete the site form by selecting each attribute and editing the value with the appropriate site information. Note that any fields you defined using domains in ArcGIS Pro (e.g., “Surface material” and “Field recorder”) will display in Collector as pull-down menus (Figure 6c). If you configured your map to accept file attachments, tap the camera icon to take photos with the device's camera (or attach an existing photo on the device). Because the GPS position can drift slightly in the time it takes to complete the site form, tap the Use My Location (
) button. This brings up a panel displaying the list of all the possible feature types—points, lines, and polygons—that you defined and symbolized in ArcGIS Pro (Figure 6a). After selecting the site type from the menu, you will see the data-driven form that mirrors the pop-up configuration you defined in AGOL, including the list of attributes you selected to display and the order in which they should appear (Figure 6b). Complete the site form by selecting each attribute and editing the value with the appropriate site information. Note that any fields you defined using domains in ArcGIS Pro (e.g., “Surface material” and “Field recorder”) will display in Collector as pull-down menus (Figure 6c). If you configured your map to accept file attachments, tap the camera icon to take photos with the device's camera (or attach an existing photo on the device). Because the GPS position can drift slightly in the time it takes to complete the site form, tap the Use My Location (![]() ) button to update your position, and hit Submit.Footnote 3 As sites are recorded, the data are uploaded in real time to the project geodatabase on your organization's ArcGIS server, and the new sites immediately populate each surveyor's Collector map (Figure 6d).
) button to update your position, and hit Submit.Footnote 3 As sites are recorded, the data are uploaded in real time to the project geodatabase on your organization's ArcGIS server, and the new sites immediately populate each surveyor's Collector map (Figure 6d).

FIGURE 6. iPad Mini data entry screens in ArcGIS Collector app, after hitting the Collect New (![]() ) button: (a) selecting a site type (e.g., Artifact scatter); (b) blank artifact scatter site form fields; (c) Surface Mat. 1 field entry with predefined period options created with coded domains; (d) completed site record form.
) button: (a) selecting a site type (e.g., Artifact scatter); (b) blank artifact scatter site form fields; (c) Surface Mat. 1 field entry with predefined period options created with coded domains; (d) completed site record form.
Linear or polygon features, such as canals, wall traces, and lithic scatter boundaries, are recorded the same way as point features, but the shapes of these features can be captured using Start Streaming in the options (…) menu, automatically collecting GPS points at a user-defined rate (e.g., every 5 m) as you walk along a feature. You also have the option of drawing the feature manually on the map. For lengthy linear features that are impractical to capture in their entirety (such as canals), we walked a sample length of the feature (e.g., 50 m or so) in the field to fix its location and then traced it manually in the lab in AGOL.
As you begin to accumulate features on the data collection map, you can edit a site's record by selecting it on the map, tapping the options (…) menu, and selecting Edit. In addition to modifying text in the attribute fields, you can also alter the GPS position of the site by either manually touching the device screen or fixing a new position with the Use My Location (![]() ) button.
) button.
Using Collector in Offline Mode
By default, Collector interacts with the project web map in online mode. Even in project areas where cellular connections are reliable, however, there will inevitably be “dead zones” in the survey area due to extreme topography or gaps in infrastructure. Fortunately, like most mobile GIS apps, Collector makes it possible to collect in offline mode by downloading the project web map, or portions of it, to your mobile device. If your feature service was published based on nonversioned data, and with query, sync, create, and other capabilities enabled—the conditions necessary to work in offline mode (see Figure 3d)—you can select portions of the project web map to be accessible offline using the “Map Areas” function in AGOL. In the Settings tab of the project web map, click the Offline tab and activate the Enable Offline Mode button (Figure 7a). Then, under the Map Areas heading, click on the Manage Areas button to draw a polygon around a section of the map that will be pushed to the Collector app (Figure 7b–c). Once a survey section is drawn, you can customize the map scale and specify how often the map area is synced and refreshed (e.g., every evening at 7:00 p.m.). Recording sites in offline mode involves the same steps as working online, but hitting Submit stores the new data locally in the device until the scheduled sync with the project web map.

FIGURE 7. Steps for configuring offline mode in AGOL: (a) activating Enable offline mode in the web map settings; (b) Manage Map Areas window in AGOL where sections of the web map for offline use can be stored and new areas created; (c) defining a new map area that will be pushed to the Collector app and used in offline mode synced on the prescribed schedule.
Recording Similar Sites with Copy/Paste Function
Surveying archaeological landscapes with high densities of the same type of sites can result in lots of time spent filling out redundant form fields at each site. This is particularly true in paper-based recording systems, where the resolution of data that can be reasonably recorded are sacrificed in the name of time management. As noted earlier, faced with high frequencies of tombs lining the foothills of the Tsaghkahovit Plain during our 2000 survey, field recorders using a notebook and pencil were limited by time and technology to estimating tomb counts within a burial cluster, sacrificing spatial and attribute data for individual tombs. In our more recent survey of the Kasakh Valley, the copy/paste function in the Collector app permitted us to record basic size, condition, and construction attributes from individual tombs rapidly, even within often-expansive tomb fields. Creating a new site record based on information from a similar, previously recorded site is simply a matter of tapping the previously recorded site on the map to bring up its record and tapping the Copy (![]() ) button at the bottom of the screen (or in the Options (…) menu). A new site form will open on your current GPS position with the attribute fields copied from the older site, which can then be updated as needed (e.g., with a new site number or current date) and submitted. In addition to streamlining the recording process, the ability to record individual burials made visible across devices had two major advantages: (1) it prevented the accidental re-recording of tombs as the team worked together to record a large cemetery, and (2) it allowed us to quickly generate analyses of burial densities and their spatial relationships to fortifications and other features in the natural and archaeological landscape.
) button at the bottom of the screen (or in the Options (…) menu). A new site form will open on your current GPS position with the attribute fields copied from the older site, which can then be updated as needed (e.g., with a new site number or current date) and submitted. In addition to streamlining the recording process, the ability to record individual burials made visible across devices had two major advantages: (1) it prevented the accidental re-recording of tombs as the team worked together to record a large cemetery, and (2) it allowed us to quickly generate analyses of burial densities and their spatial relationships to fortifications and other features in the natural and archaeological landscape.
Details of using and analyzing survey data acquired with Collector are outside the scope of this article, but generally, once collected, the data can be used for spatial analysis and visualization as with any other GIS data. The two primary methods of accessing data are directly through ArcGIS Pro (if you published the feature service to Server) or via your AGOL web map. AGOL continues to add analytical functions to its map viewer interface, such as hot spot analysis and viewshed analysis, but because these functions consume AGOL credits, it is a good idea to check with your license administrator about their availability within your organization. In addition, Esri is regularly expanding its Web GIS platforms (including AGOL) via user-friendly development tools to create web apps, stand-alone apps, and story maps as means for sharing data with the public, most of which do not require scripting or programming skills.
Concluding Thoughts on the Collector App
Although the Collector app has been on the market for several years, it has not received much attention in the growing archaeological literature on mobile data collection technologies. The aim of this article has been to discuss Collector within the expanding field of mobile apps available to archaeology survey projects, while providing some basic instructions for building and deploying a mobile GIS data collection system. Details for the workflow drew on Project ArAGATS's recent multiyear settlement survey in Armenia, but they are adaptable to the research questions and field conditions of individual projects. Below, we offer some final thoughts on the pros and cons of the app.
We are fortunate that, even in the rural, mountainous portion of Armenia, network connectivity is available in almost all of our project area, and outfitting the project iPads with SIM cards and unlimited data plans for the season is very affordable. As a result, we were able to collect survey data in online mode nearly continuously. On the occasions when our survey area fell in a network shadow or dead zone, we were able to download the web map to each device and sync the data when we returned to an area with internet service. This makes the Map Areas function in AGOL a vital option for surveying outside a network, although some form of offline mode is a fairly standard feature in most mobile GIS apps on the market.
In our experience, what sets the Collector app apart from similar apps is its native integration with the project GIS through its published feature service. This helps address a long-standing issue of technological parity first raised by Tripcevich (Reference Tripcevich2004), in which a survey team may have access to a single mobile GIS device—such as a Trimble GeoXT—usually operated by the crew chief. Currently, however, for the cost of a single GeoXT, a project can acquire several GPS-enabled tablets, which, when accessing a published feature service synced across devices, opens the door for more equitable, real-time access to site data within a survey team. This, in turn, allows for meaningful consultations with project personnel on transect, at base camp, or virtually anywhere with an internet-connected device or workstation. Additionally, the spatial accuracy sacrificed with iPads can be improved with affordable third-party, Bluetooth-connected GPS receivers, such as the Garmin GLO, although these can be an additional drain on device batteries. Because we did not rely on these external receivers, tablet battery life was not generally a problem as long as common-sense steps were taken to minimize use of other apps. It is nevertheless advisable to have external device chargers available in the field as a precaution because exposure to temperature extremes on survey can also impact battery life.
Another aspect of the Collector app that we relied heavily on is the copy/paste function, which reduced data entry redundancies, mitigating both human error and the time needed to record sites. In particular, this function enabled us to more thoroughly document the spatial arrangement and surface attributes of individual tombs to generate cluster analysis and other spatial statistics in the lab.
Occasionally, there was a need to edit the root feature layers in the geodatabase. This required turning off the feature service on the ArcGIS server while making required adjustments and then republishing the feature service. As long as internet is available at the base camp, these tasks were accomplished with little disruption either on a Windows GIS workstation connected to the geodatabase or on a macOS machine using Microsoft Remote Desktop and a VPN to access our GIS workstation at Purdue.
Despite the benefits of the Collector workflow, the platform lacked some GIS functions, which forced us to develop workarounds. Perhaps the most limiting aspect is that Collector can only accept spatial data in latitude and longitude, whereas our project's relational database references the spatial position of sites in UTM coordinates. When programming a sync protocol to transfer data from our GIS hosted at Purdue University to the main Project ArAGATS MySQL database hosted at Cornell University, we therefore needed to create a script to automate the conversion between the two coordinate systems.
Overall, we found the map-centric interface of Collector to be user-friendly and manageable in the field. Perhaps unsurprisingly, the option to build a workflow around the Collector app was influenced by our access to the GIS and Esri server infrastructure available at a large research university. However, an organization of any size with an ArcGIS license can set up a mobile data collection system relatively easily using the steps above as a framework. Once in place, the mobile GIS can be replicated to serve multiple projects in the organization. Although our project benefitted from Collector's map-centric interface, the workflow can also be adapted to a more form-centric data collection through integration with Esri's Survey123 app. On the other hand, a Collector-based system may be less suitable for work with federal or local government agencies that require the output of highly standardized forms or that have unique security or data collection protocols.
We acknowledge that the decision to work within the proprietary Esri ecosystem can create barriers to international research partners, and we continue to find ways to mitigate this issue moving forward. For example, one serviceable—if imperfect—workaround has been to have our university recognize our project's GIS specialist in Armenia as a “volunteer collaborator,” facilitating access to Purdue's Esri site license. This does not completely eradicate the colonial undertones of unequal technological access, but it does help us avoid some practical problems associated with cross-platform data collaboration. Looking to the future, recent developments in the open-source QGIS3 platform allow users to import ArcGIS feature services to run spatial analysis tools within QGIS, although it is not yet possible to add and edit data on the feature service without Esri authentication. Nevertheless, this illustrates the shrinking gap between open-source and proprietary GIS platforms in terms of functionality that will continue to broaden access to geospatial technologies in the future. Our hope is that similar discussions will continue around born-digital solutions particular to settlement survey contexts.
Acknowledgments
The fieldwork described here was funded under NSF grant #BCS-1561237, with additional support from Purdue University, Cornell University, Stanford University, NYU’s Institute for the Study of the Ancient World, and the Institute of Archaeology and Ethnography (Academy of Sciences, Republic of Armenia). The senior author wishes to thank the Armenian and American members of Project ArAGATS who participated in the KVAS survey over the past several years: Karen Azatyan, Salpi Boccieriyan, Gabrielle Borenstein, Amy Cromartie, Bryan Fagan, Dr. Elizabeth Fagan, Dr. Alan Greene (survey codirector), Elizabeth Hardy, Arshaluys Mkrtchyan, Chris Stevenson, and Shujing Wang, in addition to fellow ArAGATS co-directors Adam T. Smith and Ruben Badalyan. Comments and suggestions from Alan Greene and three anonymous reviewers helped improve the framing of this article. Finally, conversations with practitioners on the Archaeology Field Techs Facebook group moderated by Chris Webster were helpful in capturing the range of mobile apps currently in use. No permits were needed for the survey work reported here.
Data Availability Statement
No original data were presented in this article.
Supplemental Materials
For supplemental material accompanying this article, visit https://doi.org/10.1017/aap.2020.26
Supplemental Figure 1. Workflow schematic for the development and deployment of a mobile GIS data collection map for use in ArcGIS Collector. The sequence of steps is similar for both ArcGIS Pro or ArcMap 10.x, although the interface differs between the two software packages, particularly in how coded domains are defined.