


1. Introduction
Separation, trapping and alignment of particles as well as cells in Newtonian and non-Newtonian fluids during chemical and biological processes have recently attracted increasing attention among researchers (Haddadi & Di Carlo Reference Haddadi and Di Carlo2017; Li et al. Reference Li, Abbas, Morris, Climent and Magnaudet2020; Morris Reference Morris2020; Nie & Lin Reference Nie and Lin2020; Raihan et al. Reference Raihan, Li, Kummetz, Song, Yu and Xuan2020; Lin, Chen & Gao Reference Lin, Chen and Gao2021). Randomly distributed particles in Newtonian or non-Newtonian fluids were found to migrate toward the specified equilibrium position without the help of extra forces (e.g. electric, magnetic or optical fields or sheath flow). Recently, the existence of self-organizing equally spaced particle trains at the equilibrium position in a channel flow was discovered (Kahkeshani, Haddadi & Di Carlo Reference Kahkeshani, Haddadi and Di Carlo2016; Morris Reference Morris2016). Particles can form approximately circular limit cycles (Majji & Morris Reference Majji and Morris2018), spiral and ribbon structures (Majji, Banerjee & Morris Reference Majji, Banerjee and Morris2018) in the Taylor–Couette flow of a Newtonian fluid. Furthermore, the particle chains in which particles were in contact with each other were observed in the flow of a Newtonian fluid at the junction of a T-channel (Vigolo, Raadl & Stone Reference Vigolo, Raadl and Stone2014; Sojwal & Morris Reference Sojwal and Morris2021) and the simple shear flow of viscoelastic fluids (Loon et al. Reference Loon, Fransaer, Clasen and Vermant2013). Specific particle structures are essential for achieving the desired cellular architectures and arrangements in applications, such as flow cytometry and tissue engineering (D'Avino, del Greco & Maffettone Reference D'Avino, del Greco and Maffettone2017; Del Giudice et al. Reference Del Giudice, D'Avino, Greco, Maffettone and Shen2018). Therefore, studying the influence of a non-Newtonian fluid on the particle migration and particle structure is important in clinical, industrial and research applications.
The mechanisms of the particle migration and particle train self-organization in a channel flow are gradually becoming clear. In a Newtonian fluid, the particle equilibrium positions are close to the wall, whereas the number of equilibrium positions depends on the Reynolds number, channel cross-sectional shape and particle confinement (Shao, Yu & Sun Reference Shao, Yu and Sun2008; Miura, Itano & Sugihara-Seki Reference Miura, Itano and Sugihara-Seki2014; Hood, Lee & Roper Reference Hood, Lee and Roper2015; Liu et al. Reference Liu, Hu, Jiang and Sun2015; Nakayama et al. Reference Nakayama, Yamashita, Yabu, Itano and Sugihara-Seki2019). In addition, Kahkeshani et al. (Reference Kahkeshani, Haddadi and Di Carlo2016) and Hur, Tse & Di Carlo (Reference Hur, Tse and Di Carlo2010) found that single-line and staggered particle trains coexisted after particles migrated to the equilibrium position. Some studies showed that the single-line particle trains were conditionally stable within a limited number of particles, the leading particle would leave the train at the downstream position (Gupta et al. Reference Gupta, Magaud, Lafforgue and Abbas2018; Hu, Lin & Ku Reference Hu, Lin and Ku2019). Hu et al. (Reference Hu, Lin, Guo and Ku2021) generalized four types of stability conditions for self-organizing staggered particle trains. In viscoelastic fluids, the particles gathered along the centreline of square and circular channels, and migrated toward the walls because of the shear-thinning effect (Seo, Kang & Lee Reference Seo, Kang and Lee2014; Li, Mckinley & Ardekani Reference Li, Mckinley and Ardekani2015; Liu et al. Reference Liu, Guo, Tian, Yang, Yan, Ding, Wei, Hu, Nie and Sun2017). Yu et al. (Reference Yu, Wang, Lin and Hu2019) reported the wall midline, diagonal, corner and channel centreline particle equilibrium positions in a viscoelastic fluid with an enhanced elastic effect. Lim et al. (Reference Lim, Ober, Edd, Desai, Neal, Bong, Doyle, Mckinley and Toner2014) used a shear-thinning viscoelastic fluid (hyaluronic acid, HA) to promote the migration of bioparticles toward the channel centreline at Reynolds numbers of up to 10 000. Del Giudice et al. (Reference Del Giudice, D'Avino, Greco, Maffettone and Shen2018) focused a single-line particle train at the square channel centreline using a weak shear-thinning effect, and concluded that the shear-thinning effect in viscoelastic fluids was responsible for the formation of particle trains. Liu et al. (Reference Liu, Xu, Xiu, Xiang and Ni2020b) produced single-line particle trains with controllable spacing along the channel centreline in a viscoelastic fluid by adopting a complex channel structure.
The exact formation mechanisms of particle chains in viscoelastic fluids are still controversial because most previous studies only focused on simple shear flow. Michele, Pätzold & Donis (Reference Michele, Pätzold and Donis1977) first reported monodisperse particle chains near the walls; they found that the particles would stop rotating when the particle chain was formed. Subsequently, several researchers postulated different hypotheses about the mechanisms of particle chain formation. Feng, Huang & Joseph (Reference Feng, Huang and Joseph1996) pointed out that the normal stress difference caused by elasticity changed the pressure distribution near the particles, yielding particle chain formation. Lyon et al. (Reference Lyon, Mead, Elliott and Leal2001) observed the formation of long chain structures under a high shear rate in a Boger fluid. They hypothesized that the normal stress difference was the main reason behind the chain formation. However, Scirocco, Jan & Jan (Reference Scirocco, Jan and Jan2004) reported that suspensions in a highly elastic Boger fluid did not exhibit any alignment, even when the Weissenberg number was as high as 260. Won & Kim (Reference Won and Kim2004) pointed out that no chains formed during shear flow of a viscoelastic fluid, while they were found in a shear-thinning viscoelastic fluid. They proposed that the shear-thinning effect was the main factor affecting the formation of particle chains, and the elastic effect caused the particle lateral migration. Hwang & Hulsen (Reference Hwang and Hulsen2011) found that the chain structure in a shear-thinning viscoelastic fluid depended on the Weissenberg number. Pasquino et al. (Reference Pasquino, D'Avino, Maffettone, Greco and Grizzuti2014) inferred that fluid elasticity was a necessary condition, but the shear-thinning effect allowed particle chain formation. Loon et al. (Reference Loon, Fransaer, Clasen and Vermant2013) reported weak chain structures in a pure shear-thinning fluid and inferred that shear thinning was a necessary condition, whereas fluid elasticity played only an ancillary role in chain formation.
The aforementioned studies only focused on monodisperse suspensions, whereas there have only been a few studies on polydisperse suspensions. Gao et al. (Reference Gao, Magaud, Lafforgue, Colin and Baldas2019) found that the majority of single-line particle trains in a square channel started with a large particle and ended with a small one in a bidisperse suspension in a Newtonian fluid. Pednekar, Chun & Morris (Reference Pednekar, Chun and Morris2018) studied the rheological properties of suspensions in Newtonian fluids at large concentrations and found that dense particle suspensions exhibited the properties of non-Newtonian fluids, and bidisperse and polydisperse suspensions had lower viscosities and a weaker normal stress response compared with monodisperse suspensions. Giesukus et al. (Reference Giesekus1978) showed that particles in a shear flow of a bidisperse suspension in a viscoelastic fluid would form separate particle chains of either large or small particles. Lyon et al. (Reference Lyon, Mead, Elliott and Leal2001) found that the chains possessing large particles were first formed in a shear flow. As the shear time increased, some small particles joined the existing particle chains. Oliveira, Otter & Briels (Reference Oliveira, Otter and Briels2013) found that bidisperse suspensions formed the particle chains during shear flow when the shear rate was greater than a critical value. Liu et al. (Reference Liu, Guo, Tian, Yang, Yan, Ding, Wei, Hu, Nie and Sun2017) used a viscoelastic microfluidic system to separate nanoscale exosomes from the microcell culture media in a size-dependent manner. By studying the formation of particle chains during channel flows of non-Newtonian fluids, Del Giudice et al. (Reference Del Giudice, D'Avino, Greco, Maffettone and Shen2018) and D'Avino & Maffettone (Reference D'Avino and Maffettone2020) found that the monodisperse suspensions in HA solution would form short particle chains at high particle concentrations. D'Avino, Hulsen & Maffettone (Reference D'Avino, Hulsen and Maffettone2013) found that two identical particles approached each other in a circular channel flow of a viscoelastic fluid with moderate elasticity and small initial interparticle spacing, and the approach dynamics disappeared at high elasticity numbers.
The aforementioned studies indicate that the mechanisms of particle chain formation are still unclear and whether the effects of elasticity or shear thinning play the dominant role is still controversial. In addition, studies on the polydisperse particle migration and formation of self-organizing particle chains in a channel flow of non-Newtonian fluids, which have a wide range of engineering applications, are very rare. Therefore, the effects of rheological properties, elastic number, particle diameter and Reynolds number on the particle lateral migration and formation of particle chains are explored both experimentally and numerically. The findings will help us to understand how fluid rheology influences the lateral migration of polydisperse particles and the formation of self-organizing particle chains in non-Newtonian fluids.
The outline of this paper is as follows. The experimental and numerical methods adopted are described in § 2, with the collision model and selected validation results reported in Appendix A. In § 3, the main results and discussions are presented. We study the mechanisms of monodisperse and polydisperse particle migration and particle chain self-organization in a square channel flow of non-Newtonian fluids. For examples of typical experimental and numerical movies, supplementary movies are available at https://doi.org/10.1017/jfm.2022.38. A summary of the findings and conclusions is given in § 4.
2. Experiments and simulations
2.1. Experimental details
2.1.1. Experimental methods
In this study, a straight square channel with a height and length of 125 μm and 7 cm, respectively, is used. The channel is fabricated with polydimethylsiloxanes (PDMS) via the standard soft lithography method, and a replica mould is constructed on a silicon wafer with negative photoresists. The PDMS solution, comprising a base and curing agents mixed at a ratio of 10:1, is poured into the mould. The mould is degassed in a vacuum chamber for one hour, and then transferred to an oven at 80 °C for 30 min to solidify the PDMS. After cooling, the PDMS channel is peeled, and an inlet and outlet are carefully punched. Finally, the channel is fixed to a sliding glass and heated at 120 °C for 1 h to ensure the bonding strength of the channel.
In order to observe the lateral migration of particles in the channel, an inverted microscope (Nikon, elipse Ti) with a ×4 objective lens is used in bright field. A prepared particle suspension is loaded into a syringe and connects it with the channel using a plastic tube. The injection flow rate is adjusted using a syringe pump (Harvard Pump 11 Elite), and the particle distribution in the channel is recorded using a high-speed camera (Memrecam HX-6, NAC Image Technology). The controlled flow rate of the fluid in the channel is 1–300 μl min−1.
2.1.2. Suspension properties
The experimental solutions used include:
(i) Newtonian fluid: deionized water (DW). Glycerin (Sigma-Aldrich, USA) and deionized water are thoroughly mixed at a ratio of 77:23 to ensure the density of fluid is equal to that of the particles (density ρ = 1.05 g cm−3), the 0.1w/v% Tween 20 (Sigma-Aldrich, USA) is added to prevent particle aggregation or channel blockage.
(ii) Non-Newtonian fluids: polyvinylpyrrolidone solution (PVP, pure elastic fluid, molecular weight (Mw) = 360 kDa, Sigma-Aldrich, USA); polyethylene oxide solution (PEO, shear-thinning viscoelastic fluid, Mw = 4000 kDa, Sigma-Aldrich, USA); hyaluronic acid solution (HA, shear-thinning viscoelastic fluid, Mw = 900 kDa, Sigma-Aldrich, USA); Xanthan gum solution (XT, pseudoplastic strong shear-thinning fluid, Macklin, China). For the non-Newtonian fluids, the polymer powder is dissolved in the above Newtonian fluid by stirring for 24 h using a magnetic stirrer to fully dissolve the polymer powder.
The rheological properties of fluids with different concentrations (C) are measured using an MCR rheometer (Anton Paar MCR302, torque range: 0.5–200 mN m, temperature 20 °C). The rheological properties of the aforementioned fluids are shown in figure 1 and table 1. The inertial and elastic effects can be characterized by the Reynolds number (Re = 2ρQ/(μ 0(W + H))) and Weissenberg number (Wi = λγc = 2λQ/(HW 2)), respectively. Here, Q is the flow rate; μ 0 is the viscosity; where W and H is the width and height of the square channel cross section, respectively. λ is the fluid relaxation time, which is evaluated from the measurements of the storage modulus G′ and loss modulus G″, as shown in figure 1(b–d). The elasticity number, El, is the ratio of the inertial and elastic effects, i.e. El = Wi/Re = λ  $\mu$(W + H)/ρW 2H. The experimental rheological data (indicated by discrete symbols in figure 1a) are well fitted with the Bird--Carreau model (Bird & Carreau Reference Bird and Carreau1968; Lim et al. Reference Lim, Ober, Edd, Desai, Neal, Bong, Doyle, Mckinley and Toner2014), which are depicted in figure 1(a) by the solid and dotted lines
 \begin{equation}\eta (\dot{\gamma }) = {\eta _\infty } + ({\eta _0} - {\eta _\infty }){[1 + {(\dot{\gamma }/{\dot{\gamma }^\ast })^2}]^{(n - 1)/2}},\end{equation}
where  ${\eta _\infty }$ is the infinite-shear-rate viscosity;
  ${\eta _0}$ is the zero-shear-rate viscosity;
  ${\dot{\gamma }^\ast }$ is a characteristic shear rate; n is the power-law exponent, which is shown in table 1.

Figure 1. Fluid rheological properties: (a) shear viscosity for different solutions (experimental rheological data are fitted with the Bird--Carreau model shown by the solid and dotted lines); (b) changes in storage modulus G′ and loss modulus G″ in the PVP solution; (c) changes in storage modulus G′ and loss modulus G″ in the PEO solution; and (d) changes in storage modulus G′ and loss modulus G″ in the HA solution.
Table 1. Fluid concentration and parameter range (experimental flow rate Q = 1–300 μl min−1).

Monodisperse spherical particles with a diameter of D = 24.61 ± 0.22 μm (4225A, Thermo Scientific, USA) and polydisperse spherical particles (7525A_FRE, Thermo Scientific, USA) are diluted in the experimental solutions at a particle concentration of 0.35%. To measure the particle diameter, the polydisperse particles are dissolved in the Newtonian fluid. Then, the free software Image J is used to analyse the experimental images of the particle migration in a Newtonian fluid, and the results of particle position and diameter distribution are obtained. Image J is also used to obtain the particle position in non-Newtonian fluids. Figure 2 shows that the particle diameters varied between 16 and 38 μm. Thus, the blockage ratio of the monodisperse particle is 0.20, which is in the range of 0.13–0.3 for the polydisperse suspension.

Figure 2. Particle diameter distribution of polydisperse suspension (typical distribution of polydisperse particles in a microchannel is shown in experimental inset, channel height is 125 μm).
For a particle migrating in the channel, the inertial force can be evaluated as follows:
 \begin{equation}{\boldsymbol{F}_{iL}} = {\boldsymbol{F}_{iL\;w}} + {\boldsymbol{F}_{iL\;s}} \sim \rho {D^4}{\dot{\gamma }^2},\end{equation}
where  $\boldsymbol{F}_{iL_{w}}$ and
  $\boldsymbol{F}_{iL_{s}}$ are the wall-induced lift and shear-gradient-induced lift, respectively; ρ is the fluid density;
  $\dot{\gamma }$ is the fluid shear rate.
In a non-Newtonian fluid, a non-uniform normal stress difference will produce the elasticity-driven lift, FeL. The first normal stress difference, N 1, is much larger than the second normal stress difference, N 2. Therefore, FeL is proportional to the variation of N 1 over the particle diameter, and acts along the direction of low-shear-rate region
 \begin{equation}{\boldsymbol{F}_{eL}} \sim {D^3}\boldsymbol{\nabla }({N_1}{\dot{\gamma }^2}).\end{equation}
2.2. Simulation details
2.2.1. Direct forcing/fictitious domain method
Migration of neutrally buoyant spherical particles in a square channel flow of an Oldroyd-B/Giesekus viscoelastic fluid is simulated in this study to reproduce qualitatively selected experimental observations and analyse the mechanisms of particle migration and particle chain self-organization. The direct forcing/fictitious domain (DF/FD) method is a direct numerical simulation method, which is an improved version of the earlier distributed Lagrange multiplier/fictitious domain code. For particles in both Newtonian and non-Newtonian fluids (Oldroyd-B/Giesekus viscoelastic fluids), the present method was described in detail and successfully verified in our previous publications (Yu & Shao Reference Yu and Shao2007; Wang, Yu & Lin Reference Wang, Yu and Lin2018; Yu et al. Reference Yu, Wang, Lin and Hu2019; Liu et al. Reference Liu, Lin, Ku and Yu2020a); the detail of the method can be seen in Yu & Shao (Reference Yu and Shao2007) and Yu et al. (Reference Yu, Wang, Lin and Hu2019). Here, we only briefly describe the DF/FD algorithm in the following:
Momentum equations
 \begin{gather}\frac{{\partial \boldsymbol{u}}}{{\partial t}} + \boldsymbol{u}\boldsymbol{\cdot }\boldsymbol{\nabla u} = \frac{{{\mu _r}{\nabla ^2}\boldsymbol{u}}}{{Re}} - \boldsymbol{\nabla }p + \frac{{(1 - {\mu _r})\boldsymbol{\nabla }\boldsymbol{\cdot }\boldsymbol{B}}}{{ReWi}}{\lambda _p}\quad \textrm{in}\ {\varOmega ,}\end{gather}
 \begin{gather}\boldsymbol{u} = \boldsymbol{U} + {\boldsymbol{\omega }_p} \times \boldsymbol{r}\quad \textrm{in}\;P(t),\end{gather}
 \begin{gather}({\rho _r} - 1)V^{\ast}_{p}\frac{{\textrm{d}{\boldsymbol{U}}}}{{\textrm{d}t}} ={-} \int_P {{\lambda _p}\,\textrm{d}\kern0.7pt \boldsymbol{x},}\end{gather}
 \begin{gather}({\rho _r} - 1){\boldsymbol{J}^\ast }\frac{{\textrm{d}({\boldsymbol{\omega }_p})}}{{\textrm{d}t}} ={-} \int_P {\boldsymbol{r} \times {\lambda _p}\,\textrm{d}\kern0.7pt \boldsymbol{x}} .\end{gather}
Continuity equation
 \begin{equation}\boldsymbol{\nabla }\boldsymbol{\cdot }\boldsymbol{u} = 0\quad \textrm{in}\ {\varOmega }. \end{equation}
For the viscoelastic fluid, the Giesekus constitutive equation is used
 \begin{equation}\frac{{\partial \boldsymbol{B}}}{{\partial t}} + \boldsymbol{u}\boldsymbol{\cdot }\boldsymbol{\nabla B} - \boldsymbol{B}\boldsymbol{\cdot }\boldsymbol{\nabla u} - {(\boldsymbol{\nabla u})^\textrm{T}}\boldsymbol{\cdot }\boldsymbol{B}+\frac{{1 - n}}{{Wi}}{(\boldsymbol{B} - \boldsymbol{I})^2} + \frac{{\boldsymbol{B} - \boldsymbol{I}}}{{Wi}} = 0\quad \textrm{in}\ {\varOmega ,}\end{equation}
where u and p are the fluid velocity and pressure, respectively; λp is the Lagrange multiplier (pseudo body force);  $\mu_{r}$ is the ratio of the solvent viscosity (
 $\mu_{s}$) to the total zero-shear-rate viscosity of the fluid (μ 0);
  $\varOmega$ is the entire domain including the interior and exterior of the solid particle; U and ωp are the particle translational velocity and angular velocity; r is the position vector with respect to the mass centre of the particle; ρr is the particle--fluid density ratio, ρr = ρs/ρ (ρs is the particle density), here ρr = 1;
  $V_p^\ast{=} {V_p}/{H^3}$ is the dimensionless particle volume, Vp is the particle volume;
  ${\boldsymbol{J}^\ast } = \boldsymbol{J}/{\rho _s}{H^5}$ is the dimensionless moment of inertia; B is the configuration tensor, which is related to the polymer stress tensor τ = ηp(B − I)/λ; n is the mobility parameter to quantify the shear-thinning effect (where n = 1 gives the Oldroyd-B constitutive equation with consistent viscosity).
When a spherical particle approaches another particle or a wall, a collision model is introduced in the adopted numerical method. The model is described in detail in Appendix A, and the corresponding validation is shown in figure 24.
2.2.2. Simulation set-up
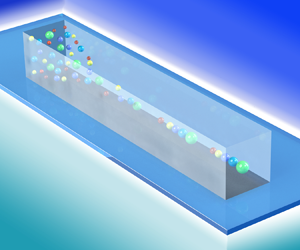
The lateral migration of the neutrally buoyant spherical particles with different diameters in a straight square channel flow of an Oldroyd-B/Giesekus viscoelastic fluid is schematically shown in figure 3. A Cartesian reference frame is considered with the origin at the channel centreline. The periodic boundary condition along the x direction is introduced with a constant pressure gradient to sustain the channel flow, and a no-slip boundary condition is applied on the channel walls. The length and the time are scaled as the channel height H and the characteristic velocity U 0 at the channel centreline, respectively. The channel length (periodic), height and width are denoted as L, H and H, respectively. The computational domain spans [−L/2, L/2] × [−H/2, H/2] × [−H/2, H/2], corresponding to dimensionless values of 4 × 1 × 1, and the mesh number is 512 × 128 × 128 along the x, y and z directions, respectively. The mesh size is h = H/128, the time step size is 5 × 10⁻⁴. The Reynolds number in the numerical method is Re = U 0ρH/μ 0, where U 0 is the maximum velocity of the fluid at the channel centre. To study the mechanisms of the lateral migration and particle chain self-organization, particles are initially released at an off-centre location (din = (y/H, z/H) = (−0.1, −0.1)). The initial spacing between two neighbouring particle surfaces is fixed as ds 0 = 0.1. The diameter of the large particle is fixed using the blockage ratio k = D/H = 0.3, and the blockage ratios of other particles are changed from 0.1 to 0.3. The ratio of diameters of the largest and smallest particles is defined as ε = Dbig/Dsmall. In order to describe the particle migration process clearly, the particles are numbered as P1, P2, P3, P4 and P5 from right to left, their corresponding diameters are D 1, D 2, D 3, D 4 and D 5, and the subscripts 1, 2, 3, 4 and 5 are used to denote the serial number of the particles, respectively.

Figure 3. Schematic of polydisperse particle migration in three-dimensional square channel flow of Oldroyd-B/Giesekus viscoelastic fluid. Polydisperse particles are initially placed with equal initial spacing (ds 0) at an off-centre location (din = (y/H, z/H) = (−0.1, −0.1)). Particles will migrate toward the channel centreline and form a particle chain at a downstream position.
3. Results and discussion
3.1. Formation of particle chain
Figure 4(a,c) shows that, in the viscoelastic PVP solution (C = 5%) with Re = 0.24 and Wi = 4.5 (Q = 120 μl min−1), the final equilibrium position of laterally migrating particles in the polydisperse suspension is at the channel centreline. This is consistent with the observations of monodisperse particle migration reported in previous experimental and numerical studies (Li et al. Reference Li, Mckinley and Ardekani2015; Del Giudice et al. Reference Del Giudice, D'Avino, Greco, Maffettone and Shen2018; Yu et al. Reference Yu, Wang, Lin and Hu2019). Images are acquired at 30 000 images per second. The particles at the equilibrium position can form long straight particle chains, in which the particles are in contact with each other. The large and small particles are located at the front and the end of the chain, respectively. The simulated two (D 1 = 0.28, D 2 = 0.21, Re = 0.24, Wi = 4.5) and five particles (D 1 = 0.30, D 2 = 0.25, D 3 = 0.24, D 4 = 0.22, D 5 = 0.20, Re = 1.0, Wi = 2.0) self-organize the chain in a square channel flow of an Oldroyd-B fluid, as shown in figure 4(b,d), respectively. The small particles in figure 4(b,d) will catch up with the large ones and form long straight particle chains, regardless of the number of particles. The experimentally observed particle chains are qualitatively reproduced by the adopted numerical method. In order to control the influence of the initial interparticle spacing on the particle chain formation process, in the numerical simulations two particles (D 1 = 0.28, D 2 = 0.21, Re = 0.24, Wi = 4.5) are initially placed at the channel centreline with ds 0 = 0.15. A quantitative comparison is shown in figure 4(a,e). The simulated changes in the interparticle spacing with time agree well with the experimental results (figure 4a).

Figure 4. (a) Experimental results for two particles (channel height is 125 μm); (b) numerical results for two particles in the XOZ plane (i.e. at y = 0), two particles are initially released at channel centreline with ds 0 = 0.15; (c) experimental results for six particles (channel height is 125 μm); (d) numerical results for five particles in the XOZ plane (i.e. at y = 0), particles are initially released at an off-centre location (din = (y/H, z/H) = (−0.1, −0.1)); and (e) comparison of experimental and numerical interparticle spacing for two particles (values of t in experiments are sampling times of the high-speed camera, and in simulations are the calculated dimensionless time).
3.2. Effect of diameter ratio
In order to describe the range of particle migration, a dimensionless migration factor (Δy/D) is defined as Δy/D = ( $y_{{p}_{max}}$ −
  $y_{{p}_{min}}$)/D, where
  $y_{{p}_{max}}$ and
  $y_{{p}_{min}}$ are the maximum and minimum positions of the particles, respectively. The dimensionless alignment factor (Af) is adopted to quantify the formation of particle chains as
  ${A_f} = \sum\nolimits_{L = 1}^{{L_{max}}} {{N_L}{L^2}} /\sum\nolimits_{L = 1}^{{L_{max}}} {{N_L}L}$, where NL is the number of particle chains that contain L particles (Pasquino et al. Reference Pasquino, D'Avino, Maffettone, Greco and Grizzuti2014). All the particles are separated if Af = 1, thus Af is always ≥1.
In the PVP solution (C = 5%) with Wi = 1.5 (Q = 40 μl min−1), the distributions of monodisperse and polydisperse particles in square channel flow are shown in figure 5(a,b). All the particles migrate toward the channel centreline. However, from the distributions of polydisperse particles at different flow rates shown in figure 5(c), it can be seen that not all the particles can migrate toward the centreline when Wi = 0.038 (Q = 1 μl min−1). Figure 5(d) shows that the migration factor (Δy/D) in the polydisperse suspension is larger than that in the monodisperse suspension at a low flow rate. As the flow rate increases, the value of Wi is also increased, the migration factors for both the polydisperse and monodisperse suspensions decrease rapidly and particles tend to congregate on the channel centreline with the same migration factor. In the monodisperse suspension, only short particle pairs are formed and the alignment factor is not changed significantly with the increase in Wi and Q. Conversely, polydisperse particles can form long chains, even in this diluted suspension when the Weissenberg number is larger than 0.1875 (Q = 5 μl min−1). The alignment factor increases rapidly with the flow rate, then decreases slightly and eventually tends to a stable value. The alignment factor in the polydisperse suspension is larger than that in the monodisperse suspension, which means the polydisperse suspension particles are more likely to self-organize into long particle chains at the channel centreline than those in the monodisperse suspension.

Figure 5. Particle migration and self-organizing particle chains: (a) typical image of monodisperse suspension; (b) typical image of polydisperse suspension; (c) distributions of polydisperse suspension for different Weissenberg numbers; and (d) migration and alignment factors for different Weissenberg numbers.
The numerical results of velocities and interparticle spacings for particles with the same diameter (ε = 1.0, D = 0.3, Re = 1.0, Wi = 1.0, and ds 0 = 0.1) in the Oldroyd-B fluid are presented in figure 6(a). The interparticle spacing (ds) is calculated between the nearest surface points as  ${d_s} = {x_D}_{_1} - {x_D}_{_2} - ({D_1} + {D_2})/2$. In the Oldroyd-B viscoelastic fluid, the normal stress will push particles to the centre of the channel, where the shear rate is zero. Therefore, the process of five particle cross-stream migration occurs first, and once they have reach the stable equilibrium position (channel centreline), a particle train with a nearly equal interparticle spacing is formed in the second stage. The velocity of each particle reaches the same value when migrating at the equilibrium position. Figure 6(b) shows the final flow field and the three-dimensional particle structure in the XOZ plane (i.e. at y = 0). There are two independent vortices formed between two neighbouring particles after the train is formed at the equilibrium position.

Figure 6. Evolution of particle velocity and spacing for particles with equal diameter (ε = 1.0, D = 0.3, Re = 1.0, Wi = 1.0 and ds 0 = 0.1): (a) the upper figure shows the velocity evolution, the lower figure shows the spacing evolution; and (b) final three-dimensional particle structure in the XOZ plane (i.e. at y = 0).
To study the influence of the initial interparticle spacing (ds 0), two equal particles with different ds 0 are initially placed at the channel centreline (ε = 1.0, D = 0.3, Re = 1.0, Wi = 1.0 and din = (0, 0)). The evolutions of the interparticle spacing ds for different ds 0 are compared in figure 7. The lagging particle will slowly approach the leading one when the initial particle distance is small (i.e. ds 0 = 0.025–0.2), while the spacing between the two particles with a large initial distance (i.e. ds 0 = 0.25–0.75) does not change obviously. Therefore, the self-organization of the long straight particle chain in figure 5(a) is not obvious, and only some short particle pairs are formed (the value of ds is 0) in the monodisperse suspension when the initial interparticle spacing is small.

Figure 7. Evolution of two particle surface spacing with different initial distances (D = 0.3, Re = 1.0, Wi = 1.0 and din = (y/H, z/H) = (0, 0)).
To examine the effect of diameter ratio (ε) on the particle migration behaviour at the second stage, two particles with different diameter ratios are initially placed at the channel centreline with the same initial interparticle spacing (ds 0 = 0.3). The results in figure 8 clearly show that the interparticle spacing between the two particles with the same diameter is not changed. When the diameter of the leading particle is larger than that of the lagging one (i.e. ε > 1.0), the small particle catches up to the larger one and forms a short particle chain (ds = 0). Furthermore, the smaller the lagging particle, the faster is the particle chain formed. Conversely, no particle chain is formed when the diameter of the leading particle is smaller than that of the lagging one (i.e. ε < 1.0).

Figure 8. Evolution of spacing of two particles with different diameter ratios (Re = 1.0, Wi = 1.0, ds 0 = 0.3 and din = (y/H, z/H) = (0, 0)).
In the Oldroyd-B viscoelastic fluid when Re = 1.0, Wi = 1.0, the migration process of five particles with different diameters (ε = 1.15, D 1 = 0.30, D 2 = 0.29, D 3 = 0.28, D 4 = 0.27 and D 5 = 0.26) is analysed in figure 9. Yu et al. (Reference Yu, Wang, Lin and Hu2019) found that a particle first migrated toward the cross-section diagonal line, and then moved to the channel centreline along that diagonal line. Additionally, the results shown in figure 9(a) demonstrate that all particles with different diameters migrate diagonally toward the channel centreline, which is consistent with Yu et al. (Reference Yu, Wang, Lin and Hu2019). Figure 9(b) shows that the particles will reach the equilibrium position at a downstream position at approximately 100 times the channel height. As shown in (2.3) and (2.4), the inertial force and elasticity-driven lift are proportional to the particle diameter, thus larger particles will migrate toward the equilibrium position faster than small particles. While figure 9(b) further shows that the velocity of each particle (along the flow direction) at the equilibrium position is different, the small particle has a larger velocity than the larger ones. The evolutions of interparticle spacing along the flow direction shown in figure 9(c,d) clearly demonstrate that the self-organized particle train with nearly equal spacing has disappeared. After all the particles migrate to the equilibrium position at the channel centreline, the smaller particles (in figure 9b) will move faster than the larger ones and catch up with them. Then, the long straight particle chain is formed (the value of d s in figure 9c is 0). The particles in the chain are in contact with each other, and the largest and smallest particles are at the front and the end of the chain (figure 9d), respectively. Figure 9(d) shows the final flow field and the three-dimensional particle structure on the XOZ plane (i.e. at y = 0). It can be seen that the vortices between particles disappear after particle chain formation. In addition, all the particles in the chain migrate along the flow direction with the same velocity as a single system. This process is also shown in supplementary movie 1.

Figure 9. Migration of particles with Wi = 1.0, Re = 1.0, and ε = 1.15 (five particles with diameters D 1 = 0.30, D 2 = 0.29, D 3 = 0.28, D 4 = 0.27 and D 5 = 0.26 are initially ordered from smallest to largest along the flow direction): (a) trajectories of particles with different diameters in channel cross-section; (b) evolution of particle trajectories in the XOZ plane and particle velocity along the flow direction; (c) evolution of interparticle spacing; and (d) final three-dimensional particle structure in the XOZ plane (i.e. at y = 0) (see supplementary movie 1).
The effect of diameter ratio (ε) on the formation of the particle chain is analysed in figures 9 and 10. The insets in figure 10 show the typical particle distribution along the flow direction. The final particle structures and flow fields are compared in figure 11(a,b). When the diameter of the smallest particle is reduced to D = 0.2, as shown in figure 10(a), a long straight particle chain is also formed at the channel centreline. Then, the formed particle chain bends slightly and remains stable at a further downstream position. For further increase of the diameter ratio, as shown in figure 10(b), the long particle chain formation at the channel centreline is less obvious, the length of the stable particle chain is reduced and the interparticle spacing is changed significantly.

Figure 10. Migration of particles with different diameter ratios (ε). Five particles are initially ordered from smallest to largest along the flow direction: (a) ε = 1.5, D 1 = 0.30, D 2 = 0.25, D 3 = 0.24, D 4 = 0.22 and D 5 = 0.20 (please note that the interparticle spacing is defined between the nearest surfaces, e.g. for the fourth and fifth particles, ds = xD 4 − xD 5 − (D 4 + D 5)/2, thus the particle spacing will be negative when particle chain is bent); and (b) ε = 3, D 1 = 0.30, D 2 = 0.25, D 3 = 0.20, D 4 = 0.15 and D 5 = 0.10. The insets are the typical particle structures in the XOZ plane (i.e. at y = 0).

Figure 11. Final three-dimensional particle structure and flow field in the XOZ plane (i.e. at y = 0) when ε = 1.5 (a); ε = 3.0 (b); and (c) evolution of particle trajectories in XOZ plane (solid line) and XOY plane (dotted line).
Because the inertial force and the elasticity-driven lift are proportional to the particle diameter, small particles migrate toward the channel centreline more slowly than the bigger ones, which can clearly be seen in figure 11(c). Thus, the small particles required a longer migration time and travel distance to reach the channel centreline. In addition, the small particles are affected by the vortices of the formed particle chain, which will keep them away from the channel centreline. This is more obvious for the larger diameter ratio (figure 11b). Thus, the self-organization of long particle chains is less obvious for the particles with a large diameter ratio.
When the particles migrate to the channel centreline, as shown in figure 9(b), the velocity of the small particles is greater than that of the large particles. According to the Faxen law, a finite sized particle in a parabolic Stokes flow exhibits only a streamwise translational slip velocity with respect to the local unperturbed flow, u∞ (Abbas et al. Reference Abbas, Magaud, Gao and Geoffroy2014). Faxén (Reference Faxén1922) first derived the expressions for the drag force, Fd, exerted by the fluid on a rigid particle of radius a as  ${\boldsymbol{F}_d} = 6{\rm \pi}{\mu _s}a[{\boldsymbol{u}_\infty } - {\boldsymbol{U}_s}] + {\rm \pi}{\mu _s}{a^3}{\nabla ^2}{\boldsymbol{u}_\infty }$, where Us is the streamwise translational slip velocity of the particle. Thus, after the particles migrate to the channel centreline, their velocity can be evaluated as
  ${\boldsymbol{u}_\infty } - {\boldsymbol{U}_s} \sim ( - {a^2}{\nabla ^2}{\boldsymbol{u}_\infty }/6)$, which is inversely proportional to the particle size. Thus, small particles will move faster than larger particles, and will catch up with them to form the particle chain. In order to compare quantitatively the effect of particle diameter ratio, the maximum particle velocities after migrating to the equilibrium position for different ε are compared in figure 12. When the particle diameters are equal (ε = 1.0), the particle velocity is not changed obviously. However, as the particle diameter ratio increases, the trend changes more obviously, i.e. the smaller the particle diameter, the greater the velocity when the particle migrates to the equilibrium position.

Figure 12. Maximum velocity for five particles (up) at the equilibrium position. Particle diameter is increased from top to bottom as indicated by red arrow: ε = 1.0 (D 1 = D 2 = D 3 = D 4 = D 5 = 0.3), ε = 1.07 (D 1 = 0.30, D 2 = 0.295, D 3 = 0.29, D 4 = 0.285, D 5 = 0.28), ε = 1.15 (D 1 = 0.30, D 2 = 0.29, D 3 = 0.28, D 4 = 0.27, D 5 = 0.26), ε = 1.25 (D 1 = 0.30, D 2 = 0.285, D 3 = 0.27, D 4 = 0.255, D 5 = 0.24), ε = 1.36 (D 1 = 0.30, D 2 = 0.28, D 3 = 0.26, D 4 = 0.24, D 5 = 0.22), ε = 1.50 (D 1 = 0.30, D 2 = 0.25, D 3 = 0.24, D 4 = 0.22, D 5 = 0.20), ε = 2.0 (D 1 = 0.30, D 2 = 0.25, D 3 = 0.20, D 4 = 0.175, D 5 = 0.15), ε = 3.0 (D 1 = 0.30, D 2 = 0.25, D 3 = 0.20, D 4 = 0.15, D 5 = 0.10).
The travel distance (xchain) and migration time ( ${t^{\prime}_{chain}}$) are particularly important for microfluidic applications to ensure particle separation and sorting. The effect of diameter ratio on the travel distance and migration time required to form the particle chain is shown in figure 13. Additionally, the values for two particles to form a chain (shown in figure 8) are compared here. The travel distance and migration time for the migrating particle pair decrease monotonically with increasing diameter ratio. When five particles migrate to the channel centreline, the particle chain is formed sequentially, for which the four travel distances and migration time are compared in figure 13. The leading and second particles need the smallest travel distance and migration time to form a particle chain (Chain1-2), and then the remaining particles sequentially join. The four plots in figure 13 show that the travel distance and migration time required to form the particle chain decrease first with increasing diameter ratio. This is consistent with the former conclusions that the smaller particles move faster than the larger ones and catch up with them to form the chain. The opposite is also true, i.e. no particle chain is formed for the particles with the same diameter. However, when the particle diameter ratio is further reduced, the travel distance and migration time to form the particle chain increase slowly. When the diameter of the lagging particle is reduced to 0.1, the fourth and fifth particles never join the particle chain, as shown in figures 10(b) and 11. When small particles migrate to the channel centreline, they will move away from the equilibrium position at a large velocity (see in figure 12) under the influence of the vortices shed by the other particles, the length of the formed particle chain is reduced and the self-organization of the particle chain is less obvious for the particles with a large diameter ratio.

Figure 13. Travel distance and migration time required to form the particle chain for different diameter ratios.
3.3. Effect of rheological properties
The effect of shear-thinning properties on the particle migration and formation of particle chains in polydisperse suspensions are further analysed in this section. As shown in table 1, the power-law exponents of PVP (C = 5%), HA (C = 0.1%), PEO (C = 1.0%) and XT (C = 0.2%) solutions are 1, 0.89, 0.65 and 0.4, respectively. Those values mean that the shear-thinning effect in the XT solution is the strongest, while it is negligible in the PVP solution. The distributions of the polydisperse particles in the four non-Newtonian fluids at the same flow rate are compared in figure 14 (Q = 40 μl min−1), figure 15 (Q = 300 μl min−1) and figure 16. The process of self-organization of particle chains can be seen in supplementary movies 2–7.

Figure 14. Migration and formation of particle chains in four non-Newtonian fluids with the same flow rate (Q = 40 μl min−1): (a–d) typical images of particles in PVP, HA, PEO and XT solutions, respectively (see supplementary movies 2, 3, 4).

Figure 15. Migration and formation of particle chains in four non-Newtonian fluids with the same flow rate (Q = 300 μl min−1): (a–d) typical images of particles in PVP, HA, PEO and XT solutions, respectively (see supplementary movies 5, 6, 7).

Figure 16. Particle distributions in four non-Newtonian fluids: (a) PVP, HA, PEO and XT solutions with Q = 40 μl min−1; and (b) PVP, HA, PEO and XT solutions with Q = 300 μl min−1 (horizontal lines in this figure are the numerical results in the Giesekus viscoelastic fluid (Re = 1.0 and Wi = 1.0), EXP and Sim are abbreviation for experiments and simulations.
In the XT solution, the particles in figures 14(d) and 16(a) congregate near the channel centreline and walls, and only short particle chains are formed near the walls when Q = 40 μl min−1. With increasing flow rate (Q = 300 μl min−1), as shown in figures 15(d) and 16(b), the number of particles near the walls is greatly reduced, and the distribution of particles near the channel centreline becomes wider. However, no particle chain is formed, indicating that such particle chains do not exist in strong shear-thinning solutions with negligible elasticity. In the shear-thinning viscoelastic PEO solution, figures 14(c) and 16(a) show that all the particles migrate to the channel centreline and form the long particle chain when Q = 40 μl min−1. As the flow rate increases to Q = 300 μl min−1, figures 15(c) and 16(b) show that the formed long straight particle chains at the centreline have disappeared, many short particle pairs and short curved particle chains have formed in a wide range of channel cross-section by the effect of shear thinning. In HA and PVP solutions, as shown in figures 14(a,b), 15(a,b) and 16, the particles remain at the channel centreline and long particle chains still exist within the present experimental flow rate.
As shown in figure 16(b), the positions of particles (ε = 1.5, 2.0 and 3.0) are numerically simulated in a Giesekus viscoelastic fluid for a travel distance of 200. The strong nonlinear characteristics of the constitutive equation of the viscoelastic fluid and the large values of the Weissenberg number often make the problem computationally challenging (Del Giudice et al. Reference Del Giudice, D'Avino, Greco, Maffettone and Shen2018; Yu et al. Reference Yu, Wang, Lin and Hu2019). Due to this drawback of our algorithm, it is incapable of dealing with relatively high Weissenberg numbers and has difficulty in exactly modelling the rheological properties of complex fluids used in the present experiments. Nevertheless, we have managed to reproduce qualitatively some experimental results for Re = 1 and Wi = 1, and power-law exponents n = 1.0, 0.8, 0.6, 0.4. The experimental particle distribution in four different non-Newtonian fluids is compared with the numerical results in figure 16(b). The particles aggregation decreases as the diameter ratio increases, and on decreasing the power-law exponent value, i.e. the particles aggregate in the wider area of the channel cross-section under the stronger shear-thinning effect and higher diameter ratios. This is essentially consistent with the experimental results (figures 5a,b, 14 and 15).
In the present experiments, the highest fluid Reynolds numbers are 0.6, 0.84, 0.084 and 0.04 in PVP, HA, PEO and XT solutions, respectively. The elasticity numbers (table 1) are 2682, 195 and 19 for the PEO (C = 1.0%), HA (C = 0.1%) and PVP (C = 5%) solutions, respectively. Thus, the inertial effect is relatively small, and the particle migration is dominated by the elasticity effect. The particle chain in the PEO solution is the first to break (figure 15c), even though the elasticity number is the highest. The migration and alignment factors of the PEO solution (figure 17a) decrease first, but then slowly increase because of the increasing effect of shear thinning at higher flow rates, and more short curved particle chains are formed in a wider channel cross-sectional area (figure 15c).

Figure 17. Changes in migration and alignment factors with Reynolds number: (a) XT and PEO solutions; and (b) PVP and HA solutions.
Figure 17(b) shows that in the HA and PVP solutions, the migration factor first decreases rapidly and then remains unchanged, whereas the alignment factor first increases and then slowly decreases to a stable value. The alignment factor in the PVP solution is the highest, even though the elasticity number is the smallest, indicating that the formation of long straight particle chains at the channel centreline is the most obvious in the viscoelastic fluid with a negligible shear-thinning effect.
The shear-thinning property of the Giesekus fluid is quantified in its constitutive equation by the mobility parameter n ((2.9)), and it becomes stronger with decreasing n. The influence of n on the behaviour of self-organizing particle chains is shown in figure 18 for Re = 1.0, Wi = 1.0 and x/H = 300, respectively. It can be seen in figure 18(a,b) that a short curved particle chain can form near the channel centreline in the Gieselus viscoelastic fluid with n = 0.8, which as different from the long particle chains formed at the channel centreline of the Oldroyd-B fluid (figure 10a). In addition, the formation of short particle chains is less obvious at larger diameter ratios, the small particles keep away from the channel centreline (figure 18b).
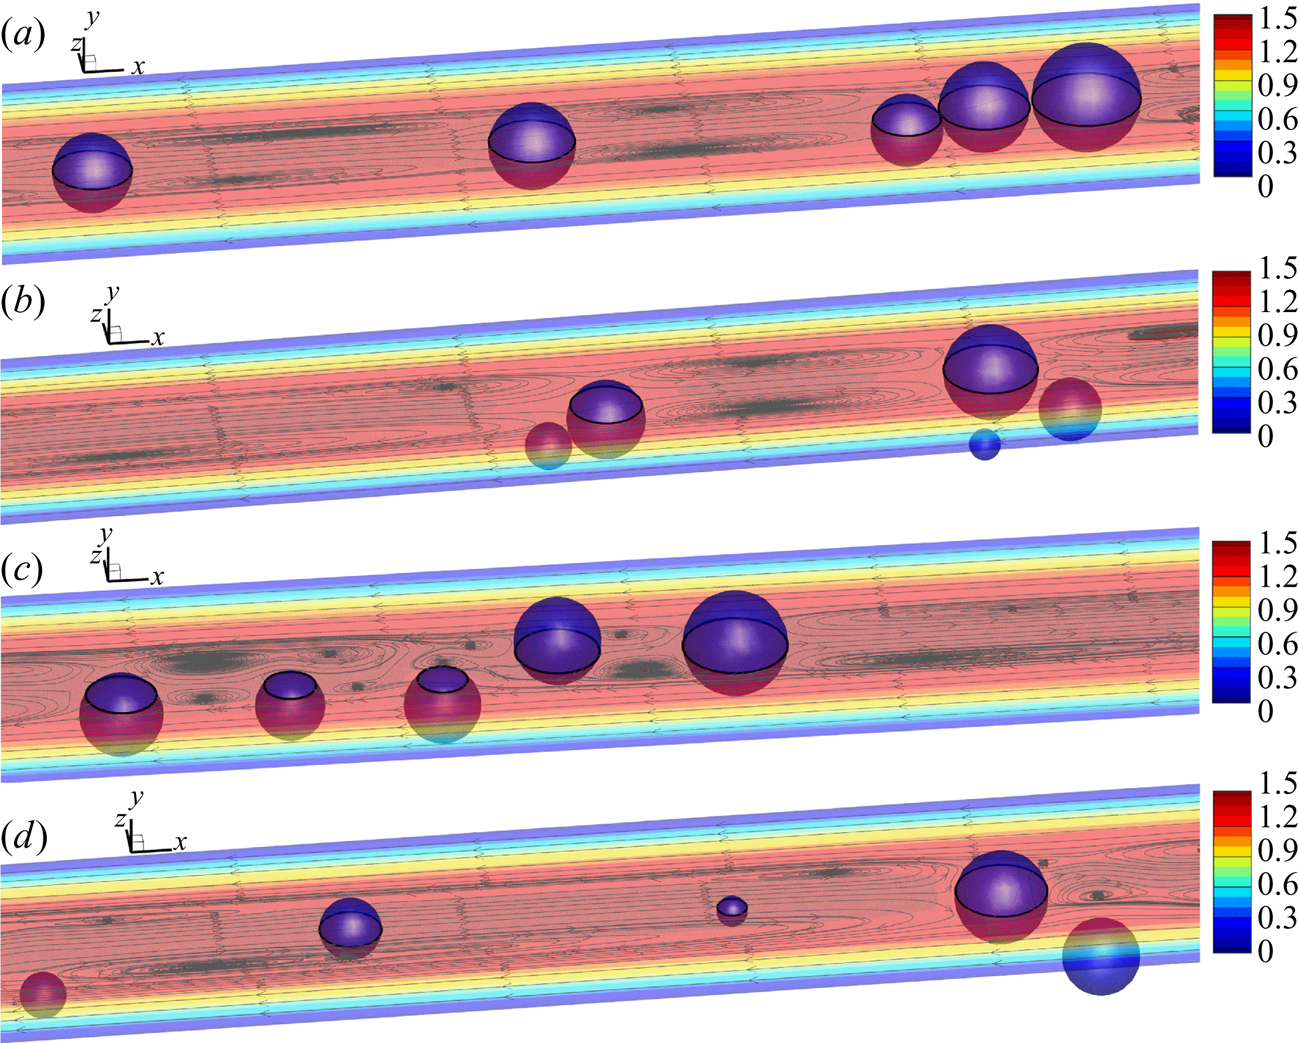
Figure 18. Typical images of particle distributions and fluid velocity in the XOZ plane (i.e. at y = 0) in Giesekus fluid with Re = 1.0, Wi = 1.0, and x/H = 300: (a) n =0.8, ε = 1.5, D 1 = 0.30, D 2 = 0.25, D 3 = 0.24, D 4 = 0.22 and D 5 = 0.20; (b) n = 0.8, ε = 3, D 1 = 0.30, D 2 = 0.25, D 3 = 0.20, D 4 = 0.15 and D 5 = 0.10; (c) n = 0.4, ε = 1.5, D 1 = 0.30, D 2 = 0.25, D 3 = 0.24, D 4 = 0.22 and D 5 = 0.20; and (d) n = 0.4, ε = 3, D 1 = 0.30, D 2 = 0.25, D 3 = 0.20, D 4 = 0.15 and D 5 = 0.10. The particles are initially ordered from smallest to largest along the flow direction with din = (y/H, z/H) = (−0.1, −0.1).
When n is decreased further to 0.4 (figure 18c,d), only the largest particle (D = 0.3) migrates to the equilibrium position. Other particles stay away from the channel centreline and the particle distribution becomes wider in the flow field. This is consistent with the present experiments that show wider particle distributions when the shear-thinning effect is enhanced (figures 16 and 17). In addition, the self-organization of particle chains is no longer obvious, and the vortex structures between particles become more complicated. The main reason for this phenomenon is that the parabolic velocity profile of the channel flow is flatter with the higher shear-thinning effect, and the equilibrium positions of the particles are also distributed in a wider part of the channel cross-section (Yu et al. Reference Yu, Wang, Lin and Hu2019; Hu et al. Reference Hu, Lin, Chen and Ku2020). Thus, the small particles seldom migrate to the channel centreline by the shear-thinning effect and the vortex structures.
The numerical results further confirm that the formation of long particle chains on the channel centreline is mainly promoted by the fluid elasticity. The shear-thinning effect disperses the particles and prohibits the formation of long straight particle chains at the channel centreline.
3.4. Effect of elasticity number
The formation of particle chains in the PEO and XT solutions is not obvious, especially at high shear rates. As shown in table 1, the values of Wi and El can be increased by improving the fluid concentration, thus, only the migration of polydisperse suspensions for different concentrations in the PVP (C = 5%, 8%) and HA (C = 0.1%, 1.0%) solutions are compared herein to further explore the effect of fluid elasticity on the particle lateral migration and formation of particle chains.
By comparing figure 19(a,b,e) with figures 14(a) and 15(a), the polydisperse particles in the PVP solutions with different fluid concentrations migrate toward the equilibrium position. As shown in figure 19(e), the particles in the PVP solution with the higher fluid concentration migrate to the channel centreline faster at a low flow rate, and the two plots of the migration factor converge to the same value. The alignment factor in figure 19(e) is decreased with increasing fluid concentration, but the two plots have a similar trend. By contrast, as shown in figures 19(c,d, f), 14(b) and 15(b), the particles also migrate to the channel centreline faster under the higher concentration of the HA solution at a low flow rate, but the particle distribution at the higher fluid concentration become slightly wider with the increase in the flow rate. Figure 19(c,d, f) shows that the appearance of a long straight particle chain is no longer obvious under the higher concentration of the HA solution, and the particles remain separated at the low flow rate. When the flow rate is increased, the alignment factor increases slowly when the migration factor increases, and the short particle pairs are formed within a wider channel cross-sectional area, which is consistent with the phenomenon observed in the PEO solution. Considering jointly the results in figure 1 and table 1, it can be seen that the shear-thinning effect in the HA solution increases rapidly with the increase in the fluid concentration, the particles will migrate away from the channel centreline and long particle chains are less obvious due to the shear-thinning effect.

Figure 19. Particle migration and formation of particle chains in PVP and HA solutions: (a) PVP, C = 8%, El = 106, Q = 40 μl min−1; (b) PVP, C = 8%, El = 106, Q = 300 μl min−1; (c) HA, C = 1.0%, El = 5413, Q = 40 μl min−1; (d) HA, C = 1.0%, El = 5413, Q = 300 μl min−1; (e) changes in migration and alignment factors in PVP solution with C = 5% and C = 8%; and ( f) changes in migration and alignment factors in HA solution with C = 0.1% and C = 1.0%. Changes in migration and alignment factors with Reynolds number.
The effect of elastic number (El = Wi/Re, with Re = 1) on the formation of particle chains in the Oldroyd-B viscoelastic fluid is studied for ε = 1.5. When El = 0 (Newtonian fluid), as shown in figure 20(b), the particles with different diameters migrate to the vicinity of the wall. No particle chains are formed, which is consistent with the experimental results shown in the inset in figure 2. Because the particle diameters are different, small particles will be affected by two different vortices produced by the neighbouring two particles, causing them first to move closer to and then further away from the other particles in an oscillatory fashion along the flow direction. When the particle diameters are equal, there is no fluctuation in the spacing between particles in the viscoelastic (figure 6b) or Newtonian fluid (Hu et al. Reference Hu, Lin and Ku2019). When El is increased to 0.01, particles in the Oldroyd-B fluid begin to migrate toward the channel centreline; however, as shown in figure 20(a), they do not reach a stable stage on the channel centreline because of the weak elastic effect. Thus, the large particles are subjected to a stronger elastic force and move faster toward the channel centreline than the other particles. The vortex pattens between particles are complex and the particle distribution is irregular, the small particles are affected by the vortices shed by the larger ones and particle chains cannot form. Increasing El further to 1.0 and 2.0 (figures 10a and 20c), all the particles in the Oldroyd-B fluid migrate to the equilibrium position at the channel centreline and form a long particle chain.

Figure 20. Effect of elasticity number on particle migration in the Oldroyd-B fluid with ε = 1.5. The five particles with diameters D 1 = 0.30, D 2 = 0.25, D 3 = 0.24, D 4 = 0.22 and D 5 = 0.20 are initially ordered from smallest to largest along the flow direction with din = (y/H, z/H) = (−0.1, −0.1): (a) particle distribution in the XOZ plane (i.e. at y = 0) when El = 0.01, and x/H = 300; (b) evolution of interparticle spacing with El = 0; and (c) evolution of interparticle spacing with El = 2.0.
The effect of elastic number (El = Wi/Re, with Re = 1) on the travel distance (xchain) and migration time ( ${t^{\prime}_{chain}}$) required to form the particle chain (figures 10a and 20a,c) are compared in figure 21. After the five particles migrate to the channel centreline, the leading and second particles form the chain (Chain1-2) first, and then the remaining particles join them one by one. The travel distance and migration time required to form the long particle chain decrease monotonically with increasing elastic number. In addition, as shown in figures 10(a) and 20(a,c), the travel distance required to maintain a stable particle chain along the flow direction is increased at higher El values. In other words, the particles forming a stable particle chain become faster at higher El values. Thus, the present numerical results are consistent with the experimental observations that the particle migration to the channel centreline and formation of long straight particle chains are mainly promoted by fluid elasticity.

Figure 21. Travel distance (xchain) and migration time ( ${t^{\prime}_{chain}}$) to form the particle chain at different elastic numbers (El = Wi/Re, with Re = 1).
As mentioned previously, an ability to conduct simulations with relatively large Weissenberg numbers, such as those used in the present experiments, is a limitation of the numerical method. Thus, only Weissenberg numbers of up to 2.0 are considered in the simulations. A decrease in the alignment factor at large Weissenberg numbers is not found in the present numerical results.
3.5. Effect of Reynolds number
Because the microfluidic chip cannot operate at excessive experimental pressures and flow rates, and the limitation of our high-speed camera in capturing particle distributions at large flow rates related to the maximum frames per second taken, the observed experimental fluid inertial effects reported in table 1 are always negligible. Thus, only the numerical results are used to analyse the effect of Reynolds number on particle migration and self-organization of particle chains in Oldroyd-B fluid.
As shown in figures 10(a) and 22, the variation of the interparticle spacing between two neighbouring particles along the flow direction is increased as the Reynolds number increases. When the Reynolds number increases to 50, the self-organization of long straight particle chain at the channel centreline is no longer obvious. As the travel distance increases, the small particles eventually catch up with the leading ones and form a curved particle chain. The final formed particle chain is shown in figure 10(a) and the insets in figure 22, which show essentially the same structural characteristics. Thus, the inertial effect has a weaker influence on the formation of the particle chain than the shear-thinning effect, which is consistent with the experimental results (figures 14, 15 and 17).

Figure 22. Effect of Reynolds number on self-organizing particle chains in the Oldroyd-B fluid with Wi = 1.0, and ε = 1.5, five particles with diameters D 1 = 0.30, D 2 = 0.25, D 3 = 0.24, D 4 = 0.22 and D 5 = 0.20 are initially ordered from smallest to largest along the flow direction with din = (y/H, z/H) = (−0.1, −0.1): (a) evolution of interparticle spacing at Re = 10; and (b) evolution of interparticle spacing at Re = 50. The insets are the typical particle distribution and the fluid velocity in the XOZ plane (i.e. at y = 0).
The effect of Reynolds number (here for Wi = 1) on the travel distance (xchain) and migration time ( ${t^{\prime}_{chain}}$) required to form the particle chain (figures 10a and 22) are compared in figure 23. The travel distance and migration time required to form the long particle chain increase with increasing Reynolds number. The effects of fluid inertia on the travel distance and migration time will be more obvious for the formation of particle chains with small particles, i.e. the values of xchain and
  ${t^{\prime}_{chain}}$ required to form the Chain3-4 and Chain4-5 increase markedly (figure 23). The elasticity-induced particle migration toward the channel centreline depends very strongly on the Weissenberg number, whereas the Reynolds number plays a negative role (Yu et al. Reference Yu, Wang, Lin and Hu2019). Thus, with a stronger inertial effect, the small particles need to cover a longer distance to reach the channel centreline and a longer travel distance is required to form the particle chain.

Figure 23. Effect of Reynolds number (Wi = 1) on travel distance (xchain) and migration time ( ${t^{\prime}_{chain}}$) required to form the particle chain.
4. Summary
In this work, the migration of polydisperse and monodisperse particles and formation of self-organizing particle chains in the square channel flow of non-Newtonian fluids are studied experimentally. The DF/FD method is adopted to elaborate qualitatively on the experimental results and analyse the mechanisms of particle chain self-organization in Oldroyd-B/Giesekus viscoelastic fluids. The following main conclusions are obtained.
In a Newtonian fluid, the polydisperse particles migrate toward the equilibrium position near the walls. In a fluid with strong shear-thinning effect, particles are distributed near the channel centreline and walls and the migration factors remain constant. In shear-thinning viscoelastic fluids, the migration factor of the polydisperse suspension first decreases and then increases slowly with an increase of the flow rate. Only the particles in a viscoelastic fluid with negligible shear-thinning effect remain on the channel centreline as the flow rate increases. The migration velocity in polydisperse suspensions is slower than that in the monodisperse suspension at low flow rates. The velocities of monodisperse particles reach the same value when migrating to the equilibrium position. For the polydisperse particles at the equilibrium position, the velocity of the small particle is greater than that of the large ones, and the smaller the particle diameter, the greater the velocity when the particle migrates to the equilibrium position.
In a viscoelastic fluid, long straight particle chains are self-organized on the channel centreline in polydisperse suspensions, with an alignment factor that is increased rapidly, and then decreased to a stable value as the flow rate increases. Small particles at the equilibrium position move faster than the larger ones and then catch up with them to form a particle chain, in which the large and small particles are located at the front and the end of the chain, respectively. On the other hand, in the monodisperse suspensions, only some short particle pairs are formed at the channel centreline when the initial interparticle spacing is small. With increasing diameter ratio, the self-organization of long particle chains is less obvious, and the length of stable particle chains is reduced. The travel distance and migration time required to form the particle chain decreases first, and then slowly increases. There is also no particle chain formed at the equilibrium position in the Newtonian fluid. Overall, the formation of long particle chains at the channel centreline depends strongly on the fluid elasticity number and weakly on the Reynolds number, while the shear-thinning effect disperses particles and prevents the formation of long straight particle chains at the channel centreline.
Supplementary movies
Supplementary movies are available at https://doi.org/10.1017/jfm.2022.38.
Funding
This work was supported by the Major Program of the National Natural Science Foundation of China with Grant No. 12132015, the Joint Funds of the National Natural Science Foundation of China with Grant No. U2006221, the Natural Science Foundation of Zhejiang Province with Grant No. LQ22A020008, the Key R&D Program of Zhejiang Province with Grant No. 2020C03081 and Top-notch Talent Support Program of Zhejiang Province with Grant No. 2019R51002.
Declaration of interests
The authors report no conflict of interest.
Appendix A. Collision model
A.1. Lubrication force correction
When a spherical particle approaches another particle or a wall, the fluid film between the two surfaces can be very thin. There will be a large hydrodynamic resistance, which cannot be resolved for numerically by adopting a typical grid used in the current numerical method. Thus, a lubrication force correction model is introduced when the distance between the two surfaces is smaller than approximately the mesh size. The lubrication force has the following form (Xia et al. Reference Xia, Xiong, Yu and Zhu2020; Yu et al. Reference Yu, Xia, Guo and Lin2021):
 \begin{equation}\boldsymbol{F}_{ij}^l ={-} 6{\rm \pi}\mu a{\boldsymbol{u}_{n,ij}}[\psi (\chi ) - \psi ({\chi _{al}})],\end{equation}
where  ${\boldsymbol{u}_{n,ij}}$ is the normal relative velocity between the ith and jth objects (wall or particle);
  $\psi (\chi )$ is a function of the normalized gap distance,
  $\chi \textrm{ = }{\zeta _n}/a$ with
  ${\zeta _n}$ being the distance between two surface, a is the particle radius;
  ${\chi _{al}}\textrm{ = }\varDelta x/a$ is the threshold distance below which the lubrication force correction is valid,
  $\varDelta x$ is the mesh size.
The function  $\psi$ for the particle--particle interactions is
 \begin{align}\psi &= \dfrac{1}{{{{(1 - \kappa )}^2}\varepsilon }} - \dfrac{{1 - 7\kappa + {\kappa ^2}}}{{5{{(1 - \kappa )}^3}}}\,\textrm{ln}\,\varepsilon + K(\kappa )\nonumber\\ & \quad - \dfrac{{1 - 18\kappa - 29{\kappa ^2} - 18{\kappa ^3} + {\kappa ^4}}}{{21{{(1 - \kappa )}^4}}}\varepsilon \,\textrm{ln}\,\varepsilon + \varepsilon L(\kappa ) + O({\varepsilon ^2}\,\textrm{ln}\,\varepsilon ), \end{align}
where the radius of another particle is −a/κ, so that κ ≤ 0, for the case of a particle moving towards a wall plane, κ = 0; the value of K 1(κ) and L 1(κ) appearing in (A2) for various κ can be seen in Jeffrey (Reference Jeffrey1982).
The function  $\psi$ for the particle--wall interactions is simply assumed as κ = 0 in (A2).
The adopted numerical method with the lubrication force correction is validated by comparing the numerically simulated bounce trajectory of a particle colliding perpendicularly with a wall with experimental data (Gondret, Lance & Petit Reference Gondret, Lance and Petit2002). The detailed physical and numerical parameters are listed in table 2. In order to achieve the targeted particle velocity (uin) before collision, the particle velocity is prescribed as uy = uin(e−20t − 1) at ζn ≥ D/2 during a short initial time period (here, ζn is the distance from the bottom of the particle surface to the wall), and then the particle is released freely. The particle trajectories for Stc = 27 and Stc = 152 with and without the lubrication force correction are compared with the experimental data of Gondret et al. (Reference Gondret, Lance and Petit2002) in figure 24. We can see in figure 24 that the results obtained with the lubrication force correction are in good agreement with the experimental data, while the simulations without the lubrication force correction overestimate the rebound trajectories, particularly for Stc = 27. Thus, the lubrication force correction can be considered as producing correct results.
Table 2. Physical and numerical parameters for a particle impacting normally on a wall. uin is the impact velocity and  ${u_c} = \sqrt {4D/3({\rho _r} - 1)g}$ is the characteristic velocity.


Figure 24. Comparison of the numerical trajectories and experimental data (Gondret et al. Reference Gondret, Lance and Petit2002) of a particle colliding with a wall, the horizontal axis is dimensionless time normalized by  ${t_{ref}} = \sqrt {D/g}$, and tc is the start time of collision: (a) Stc = 27 and (b) Stc = 152.


