Seeds as populations
Seed biology is based on populations. Eric H. Roberts was a key proponent of this concept, beginning with his seminal demonstration that rice seeds emerged from dormancy over time during after-ripening in a sigmoid pattern that is well described by a cumulative normal frequency distribution (Roberts, Reference Roberts1961). He applied probit analysis to these data, which had been developed for statistical analysis of insect mortality in response to toxins (e.g. nicotine) (Bliss, Reference Bliss1934). As individual insects varied in their sensitivity to toxins, often over a logarithmic concentration range, plotting per cent mortality versus a linear scale of toxin concentration resulted in a right-skewed S-shaped curve. As Bliss noted, ‘variability among individuals of a population in their susceptibility is considered to be responsible for the S-shaped character of the curve’. Bliss showed that if the percentage data were plotted instead on a scale of standard deviation units (assuming a normal distribution of toxin sensitivity among insects in the population) versus log of toxin concentration, the data were converted to linear relationships. This allowed simple calculation of the mean and standard deviation of the population sensitivity, which accurately described the inherent susceptibility of different fractions of the insect population to a given toxin concentration. This origin of probit analysis also includes the concept of quantal or ‘on/off’ responses (which would now be termed ‘digital’), as an insect either died or survived at a given concentration. Roberts adapted this approach to describe seed germination, which is also a quantal parameter, as a seed at a given time has either completed germination (radicle emergence) or it has not. In general, when the percentages of a population responding are the relevant data, the probit approach is likely to be appropriate for statistical analysis.
Richard Ellis and Eric Roberts subsequently employed this concept to great advantage in developing their seed viability equation that described the response of seed longevity to the temperature and seed moisture content during storage (Ellis and Roberts, Reference Ellis and Roberts1980, Reference Ellis and Roberts1981). As for germination, seed death (or inability to produce a normal seedling) is a quantal parameter that is generally normally distributed over time in a seed population. Probit analysis concepts were used explicitly in the viability equation, with its primary output parameter being the standard deviation of seed deaths over time. Species vary in their inherent potential longevity and in their sensitivity to temperature and moisture, but once the sensitivity parameters had been determined empirically for a given species, the viability equation could be used to estimate the time required for the percentage viability to fall below a given level in a specified storage environment. The Ellis–Roberts seed viability equation has been widely used for designing seed storage facilities and predicting their suitability for extending seed longevity (Ellis, Reference Ellis1988).
Population-based threshold models
In the examples above, the after-ripening or storage periods are considered as dosages of time, and seeds either lose dormancy or die (respectively) after accumulating a specific cumulative dosage that varies among seeds in the population. This is described as ‘threshold’ behaviour, in which a factor must exceed a threshold dose to elicit a response. This concept is widely used in biology in relation to thermal time or ‘heat units’, in which a process is extremely slow or does not occur below a minimum (or base) threshold temperature (Bierhuizen and Wagenvoort, Reference Bierhuizen and Wagenvoort1974; Garcia-Huidobro et al., Reference Garcia-Huidobro, Monteith and Squire1982; Covell et al., Reference Covell1986). In addition, the rate at which the process occurs (e.g. the inverse of the time to germination after imbibition) increases as the temperature increases above the base temperature (T b). This increase in rate (reduction in time to germination, t g) is proportional to the amount by which the temperature (T) exceeds T b, such that their product is a constant (the thermal time constant, θ T) (Eqn 1):
 $${\theta _{\rm T}\left( g \right){\rm} = {\rm} \left( {T - T_b} \right)t_g}. $$
Note that θ T is shown as θ T (g), or the thermal time constant for a specific germination fraction (g) in the population. This is because all seeds do not germinate simultaneously, and as seeds often (but not always) have a common T b, their thermal time thresholds for germination must vary. In addition, the lower and upper temperature limits for germination can shift due to after-ripening or stratification until they reach the final base, optimum and maximum temperatures characteristic of the species, and are a significant aspect of seed dormancy regulation (Batlla and Benech-Arnold, Reference Batlla and Benech-Arnold2015; Batlla and Agostinelli, Reference Batlla and Agostinelli2017).
A further advance was the insight of Gummerson that seed responses to water potential (Ψ) might be described by a model in which the thresholds at which germination was prevented by reduced Ψ varied among seeds in the population (Gummerson, Reference Gummerson1986). He proposed the term ‘hydrotime’ for this response, and its combination with temperature as ‘hydrothermal’ time. This equation (Eqn 2) has become a fundamental relationship for understanding seed germination behaviour in response to T and Ψ, the two most significant factors influencing germination timing (Bradford, Reference Bradford, Kigel and Galili1995; Bewley et al., Reference Bewley2013):
 $$\theta _{{\rm HT}} = \left( {{\it \Psi} - {\it \Psi} _{\rm b}\left( g \right)} \right)\left( {T - T_{\rm b}} \right)t_g.$$
This equation shows that the hydrothermal time constant (θ HT) is a constant for all seeds in the population across combinations of Ψ and T. The apparent variation in the thermal time constant in Eqn 1 is actually attributed to variation among seeds in their base water potentials [Ψ b(g)], i.e. in the Ψ that just prevents completion of germination for a specific fraction of the population, as was explicitly demonstrated (Alvarado and Bradford, Reference Alvarado and Bradford2002). Considerable work has subsequently shown that the hydrotime and hydrothermal time models can describe a wide range of seed behaviours in response to T and Ψ, including many aspects of dormancy (Dahal and Bradford, Reference Dahal and Bradford1994; Rowse and Finch-Savage, Reference Rowse and Finch-Savage2003; Alvarado and Bradford, Reference Alvarado and Bradford2005; Bair et al., Reference Bair, Meyer and Allen2006; Finch-Savage and Leubner-Metzger, Reference Finch-Savage and Leubner-Metzger2006; Allen et al., Reference Allen, Bradford and Nonogaki2007; Hawkins et al., Reference Hawkins, Allen and Meyer2017) and more recently of fungal pathogenesis on seeds (Finch et al., Reference Finch, Allen and Meyer2013; Barth et al., Reference Barth2015).
Additional research has demonstrated that the basic form of Eqn 2 (with or without the temperature component) also applies to seed germination responses to abscisic acid (ABA), gibberellin (GA) and ethylene (Ni and Bradford, Reference Ni and Bradford1992, Reference Ni and Bradford1993; Bradford and Somasco, Reference Bradford and Somasco1994), development (Still and Bradford, Reference Still and Bradford1998), priming (Bradford and Haigh, Reference Bradford and Haigh1994), oxygen (Bradford et al., Reference Bradford, Côme and Corbineau2007, Reference Bradford2008), ageing (Bradford et al., Reference Bradford, Tarquis and Duran1993), light (Bradford, Reference Bradford2005) and even to seed respiration rates (Bello and Bradford, Reference Bello and Bradford2016). Thus, a general population-based threshold (PBT) model can be described by:
 $$\theta _X = \left( {X - X_{\rm b}\left( i \right)} \right)t_i,$$
where θ X refers to the time constant for responses to factor X; X is the dosage level of factor X; X b(i) is the sensitivity threshold distribution of the population for a given phenotype or response; and t i is the time at which fraction i of the population exhibits the phenotype or response due to factor level X. The response of GA-deficient (gib-1 mutant) tomato seeds to increasing concentrations of GA4+7 illustrates the general relationship of this function across concentrations (or dosages) (Fig. 1; based on data from Ni and Bradford, Reference Ni and Bradford1993). In the absence of GA, no seeds germinate. As the concentration of GA is increased, specific fractions of the seed population are induced to germinate (Fig. 1A), based upon the distribution of GA thresholds (GA b values) among seeds in the population (Fig. 1B). The different coloured regions indicate the additional seeds in the sensitivity distribution that are recruited to germinate as the concentration increases. Note that at lower concentrations, the curves tend to plateau or increase very slowly even as the time increases up to 30 days of imbibition. This is direct evidence that there is a distribution of minimum GA thresholds among the seeds in the population, rather than that all seeds will respond eventually to low concentrations if given sufficient time. In addition, the inverse relationship between concentration above the threshold and the time to completion of germination is evident; seeds having thresholds that required 20 days to germinate at a given concentration did so in less than 5 days when the concentration was increased 10-fold (Fig. 1A). For any fraction of the seed population, both whether and when it completed germination were determined by its inherent threshold sensitivity in relation to the GA concentration present. The overall sensitivity distribution did not change for the duration of the experiment, indicating that a range of GA sensitivities spanning five orders of magnitude was present initially in the seed population. Similarly, a sensitivity range of three orders of magnitude was found for the inhibition of germination by ABA (Ni and Bradford, Reference Ni and Bradford1992).
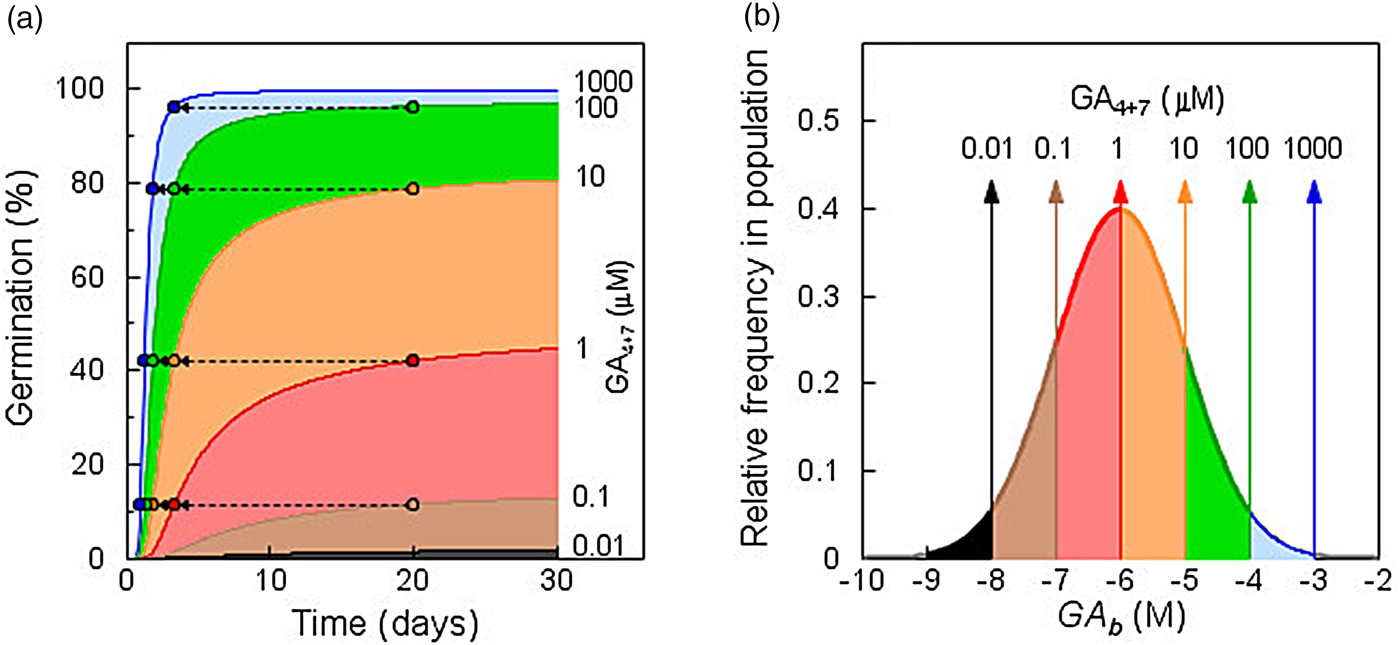
Fig. 1. Population-based threshold sensitivity distributions of seed germination in response to gibberellin (GA). (a) Germination time courses of GA-deficient tomato mutant (gib-1) seeds incubated in different concentrations of GA4+7. Differently shaded areas indicate additional seeds germinating at each increment in GA concentration. Arrows show the reductions in time to completion of germination for the fractions completing germination after 20 days as GA concentration is increased. (b) Sensitivity distribution of germination of gib-1 seeds to GA concentration. The shaded regions indicate the fractions of the population that are recruited to germinate as the concentration increases logarithmically. Note that the distribution spans over five orders of magnitude in GA concentration. Based on data in Ni and Bradford (Reference Ni and Bradford1993) using values for Eqn 3 of θ GA = 100 log [M] h, GAb(50) = –6 log [M], and σ GA = 1 log [M].
Implications and instances of population-based threshold behaviour
Once harvested at maturity or shed from the mother plant, an individual seed is an autonomous biological entity that must independently time its transition to germination and seedling growth to coincide with environmental opportunities for survival. At the same time, the agricultural and ecological roles of seeds are associated with the behaviours of seed populations. The percentages of seeds in a population that are in a particular state (e.g. dormant, germinated, dead) and the timing and uniformity of their transitions to germination and seedling growth have significant consequences for crop yields and plant ecological demographics (Burghardt et al., Reference Burghardt2015; Finch-Savage and Bassel, Reference Finch-Savage and Bassel2016; Gremer et al., Reference Gremer, Kimball and Venable2016; Huang et al., Reference Huang2016; Mitchell et al., Reference Mitchell, Johnston and Bassel2017). This duality of individual diversity underlying consistent population-wide behaviour patterns is described quantitatively using PBT models (Bradford, Reference Bradford, Kigel and Galili1995; Donohue et al., Reference Donohue2015).
However, seed germination is not the only example of plant behaviour that conforms to the expectations of the PBT model. Many hormone-regulated events in plant life exhibit similar characteristics in which both the concentration of a regulator and cell or tissue sensitivity to that regulator combine to determine the biochemical or developmental outcome (Bradford and Trewavas, Reference Bradford and Trewavas1994). The PBT model is well adapted to describe these situations, as it is driven by the difference between the prevailing regulator dosage and the sensitivity of the responding individuals to that regulator (Eqn 3). In addition, the model utilizes variation in the threshold sensitivities of the responding individuals as a fundamental feature of the regulatory mechanism. The position and shape of the sensitivity distribution in relation to the regulator dosage determine the response pattern of the population to the regulator. The incorporation of developmental time into the model describes the kinetics of these patterns. This is intuitively evident when temperature is the regulator, as the speeding or slowing of metabolism, growth and development in response to temperature is widely appreciated and utilized in thermal time or degree-day models for poikilothermic organisms (Eqn 1) (Trudgill et al., Reference Trudgill2005). Developmental time scales can be viewed as either expanding or contracting relative to clock time as the temperature decreases or increases, and it is possible to normalize this time variation across temperatures on a common thermal time scale.
It is less widely appreciated, but nonetheless analogous, that biological time can be considered to be stretched or compressed at low or high regulator dosages, respectively (Eqn 3). This has been termed ‘biotime’ (Bradford and Trewavas, Reference Bradford and Trewavas1994), and the rates of progress towards a developmental transition (e.g. germination) can be normalized on the appropriate scale (e.g. ‘hydrotime’, ‘hydrothermal time’, ‘GA-time’, ‘ABA-time’, ‘priming-time’, ‘ageing-time’, etc.) (Bradford, Reference Bradford1990; Bradford et al., Reference Bradford, Tarquis and Duran1993; Ni and Bradford, Reference Ni and Bradford1993; Bradford and Haigh, Reference Bradford and Haigh1994; Dahal and Bradford, Reference Dahal and Bradford1994; Alvarado and Bradford, Reference Alvarado and Bradford2002). Hormonal regulators often appear to synchronize cellular or developmental events in time (Trewavas, Reference Trewavas, Witzany and Baluska2012). This is a consequence of the reduction in time to response as the regulator dosage increases above the sensitivity thresholds of individuals in the responding population (arrows in Fig. 1a). This automatically results in a reduction in variation (in clock time) among individuals, or synchronization, as dosages increase. Such results indicate that time itself is flexible in biological systems in a systematic way that can be described by PBT models as biotime (Bradford and Trewavas, Reference Bradford and Trewavas1994).
Gilroy and Trewavas (Reference Gilroy and Trewavas2001) documented a number of cases in plant signalling and transduction in which population variation and PBT-like responses were evident, and more are described in Trewavas (Reference Trewavas2014) across biological scales from ions and molecules to whole plants and ecology. For example, the well-known response of cereal grain aleurone cells to GA by synthesis and secretion of α-amylase was examined in individual isolated aleurone protoplasts (Hillmer et al., Reference Hillmer, Gilroy and Jones1993). As the concentration of GA applied increased, the proportion of protoplasts secreting α-amylase increased in parallel. The authors noted, ‘The effect of GA3 treatment is to increase the proportion of protoplasts in the population that secrete α-amylase rather than gradually increasing secretion from all responding protoplasts.’ Thus, individual cells (protoplasts) exhibit a quantal or digital (on/off) behaviour (or maximum response over a small dosage range above the threshold) similar to the germinated/not germinated phenotypes of seeds (Bradford and Trewavas, Reference Bradford and Trewavas1994). As the GA concentration increases, more cells are recruited to secrete α-amylase and the output of the enzyme increases automatically without each cell being required to respond quantitatively to the entire range of GA concentrations, which spanned five orders of magnitude (Gilroy and Trewavas, Reference Gilroy and Trewavas2001).
A similar situation has been described for the induction of lateral or branch root formation by auxin, which stimulated root formation 50-fold over a 100-fold concentration range (Blakely et al., Reference Blakely1972). As an individual cell must be induced to divide and initiate formation of a lateral root (Orman-Ligeza et al., Reference Orman-Ligeza2013), increasing numbers of lateral roots with increasing auxin concentration must be a recruitment phenomenon, as cells that failed to respond at lower concentrations responded at higher concentrations. In addition, at a saturating dose of auxin, the number of roots formed increased linearly over time of exposure to the hormone, i.e. some cells responded more quickly than others to the same dosage. Thus, both the threshold sensitivity distribution and the kinetic response of the PBT model are present. Much is known about auxin perception and signal transduction, including the role of IAA/Aux proteins whose degradation is associated with signalling (Salehin et al., Reference Salehin, Bagchi and Estelle2015). The rate of IAA/Aux protein turnover determines both the number of roots initiated and their rate of formation in response to IAA (Guseman et al., Reference Guseman2015). As these authors noted, ‘By engineering Aux/IAA variants with reduced auxin sensitivity, we discovered that timing of organ initiation was plastic and could be tuned.’ This demonstrates a potential mechanistic connection underlying the relationship between sensitivity and response rate embodied in the PBT model.
Another example in plant biology in which cell populations are clearly involved is in the responses of stomata to hormones or environmental conditions (e.g. ABA, light, CO2, humidity). Laisk et al. (Reference Laisk, Oja and Kull1980) showed that the range of variation in individual stomatal pore apertures in both a dicotyledonous plant (Vicia faba) and a cereal (Hordum vulgare) could be described by a normal distribution. Conditions that promoted stomatal opening shifted this distribution to larger pore sizes, while conditions causing closure shifted it to smaller pore sizes. The authors noted that ‘the conclusion may be drawn that in the process of stomatal opening or closure deduced from a series of steady states the shape of the distribution of stomatal apertures remains almost unchanged, sliding right and left along the x-axis [pore size]’ (Fig. 2). This suggests that there is a threshold distribution among individual stomata for factors affecting their pore sizes, with factor dosages shifting the numbers of stomata with a given pore size. As there is a minimum pore size at closure and a maximum pore size that can be attained, a sigmoid distribution of stomatal conductance (related to the total aggregate of pore sizes) occurs across factor levels (Laisk, Reference Laisk1983; Laisk et al., Reference Laisk, Oja and Kull1980).

Fig. 2. Distributions of stomatal pore apertures in response to different factors affecting stomatal opening [light, high relative humidity (RH), low CO2 concentration] or closure (ABA, low RH, high CO2). Apertures range from 0 at full stomatal closure to a maximum value dependent upon the type of stomata of the species. The distributions are drawn into the regions below 0 and above maximum opening even though all stomata in those regions will be either fully closed or maximally open, so that the actual numbers of stomata at 0 or at maximum pore size will increase dramatically at these limits. The percentages of stomata under the curves that are closed (left), partially open (centre) or maximally open (right) are indicated. These extended distributions illustrate that when stomata are closed and an opening stimulus is applied, individual stomata vary in their response thresholds and open more slowly or only at higher stimulus levels. Similarly, when the majority of stomata are open and signals for closing occur, some will respond more quickly or fully than others do. The distribution of pore sizes slides left or right between the two limits, but maintains its shape. The distribution (defined by its mean and standard deviation) can differ among regulatory factors. Adapted from Laisk et al. (Reference Laisk, Oja and Kull1980).
The behaviours of stomata are notably asynchronous or ‘patchy’ over time, with shifting groups of stomata opening or closing in response to internal or external factors (Downton et al., Reference Downton, Loveys and Grant1988; Terashima et al., Reference Terashima1988). Downton et al. (Reference Downton, Loveys and Grant1988) observed that ‘during water stress some groups of stomata close while others remain open. The net effect of this response, in contrast to a uniform reduction in stomatal aperture, is a reduction in functional leaf area with proportional decreases in A [assimilation] and stomatal conductance.’ Terashima et al. (Reference Terashima1988) observed similar variation with respect to stomatal responses to ABA, and among different possible explanations, concluded that ‘It seems more probable that individual stomata vary intrinsically in their reaction to ABA.’ This variation has been described as emergent collective behaviour (Mott and Buckley, Reference Mott and Buckley2000) and analysed by various models (Buckley, Reference Buckley2017; Mott and Peak, Reference Mott and Peak2007). However, these models have not incorporated the population-based approaches suggested by Laisk (Reference Laisk1983) along with the possibility that there could be distinct sensitivity response distributions for different regulatory factors. These sensitivity distributions can also shift depending upon growth conditions, plant maturity, nutrition and other factors (Radin, Reference Radin1992). If individual stomata vary in their sensitivity to multiple independent factors according to definable distributions, this would provide a wide range of possible responses by stomatal populations to varying environmental conditions (Fig. 2). Building these threshold distributions for sensitivity to different regulatory factors into stomata would enable automatic adjustment of leaf conductance by recruitment of additional stomata as needed for either opening or closing to achieve functional goals, whether to maximize photosynthesis, minimize water loss or operate optimally for the prevailing conditions. Identifying and quantifying the underlying response distributions to the major stomatal regulatory factors could turn apparently random or noisy behaviour into quantifiable overlapping population-based responses.
The importance of individuality
The wide range of sensitivities of individual seeds to water potential or hormones with respect to germination (Fig. 1) begs the question of whether this variation can be detected at the cellular, biochemical or molecular level. The aleurone protoplast example above illustrates this individuality of cellular response, and Gilroy and Trewavas (Reference Gilroy and Trewavas2001) discussed the ‘importance of individuality’ in signalling systems. This was demonstrated for seeds by single-seed assays of enzyme activity associated with germination (Still and Bradford, Reference Still and Bradford1997). Endo-β-mannanase is a key enzyme for degrading galactomannan polymers stored as carbohydrate reserves in the cell walls of some seeds, including tomato and lettuce (Halmer et al., Reference Halmer, Bewley and Thorpe1978; Groot et al., Reference Groot1988). Following imbibition, the mannanase activity of individual tomato seeds varied more than three orders of magnitude (Still et al., Reference Still, Dahal and Bradford1997). This variation was associated with the rate of progress of seeds towards completing germination. The distribution of enzyme activity increased to higher values as seeds successively increased expression associated first with weakening of the enclosing endosperm barrier to radicle penetration and subsequently with the mobilization of galactomannan reserves (Nonogaki and Morohashi, Reference Nonogaki and Morohashi1999; Nonogaki et al., Reference Nonogaki, Gee and Bradford2000). In partially dormant seed lots, mannanase activity increased only in seeds that would complete germination. This work clearly illustrated the problem of using pooled assays of multiple individuals: ‘Because of the logarithmic range in mannanase activity, only three seeds of 45 with exceptionally high activity accounted for 93% of the total observed at this sampling point and shifted the mean 80-fold higher than the median’ (Still and Bradford, Reference Still and Bradford1997). Use of tissue printing to sample gene expression of individual seeds further supported the inherent variation in seed populations (Wu et al., Reference Wu2001; Wu and Bradford, Reference Wu and Bradford2003; Pluskota et al., Reference Pluskota, Bradford, Nonogaki and Kermode2011).
Single-seed assays of oxygen consumption extended this variation to the metabolic level (Bello and Bradford, Reference Bello and Bradford2016). Respiration rates of individual seeds varied widely and were highly correlated with their germination timing in relation to temperature, water potential, ABA, GA, respiratory inhibitors, priming and ageing. As for germination, the PBT model described the population distributions of respiration rates among seeds in their sensitivities to diverse factors extremely well (Fig. 3). Lack of synchrony among the individuals of a population due to their differing response thresholds results in wide variation in their gene expression/biochemical states for a given signal dosage and can result in values for pooled samples not reflecting the actual biological status of the population as a whole. As individual seeds vary intrinsically in their metabolic rates and responses to regulatory factors, this variation represents an inherent feature of seed population behaviour, not simply experimental error or ‘noise’. Rather, it is associated with different temporal trajectories on which individual seeds are progressing. At a given time, seeds are at different points in their progress from imbibition to completion of germination. While this results in wide variation among individuals and misleading pooled or average values at a given time, it is understandable when viewed from the perspective of the underlying population distribution. In addition, subpopulations with distinct behaviours can also be identified when sufficiently dense datasets are available (Fig. 3f).
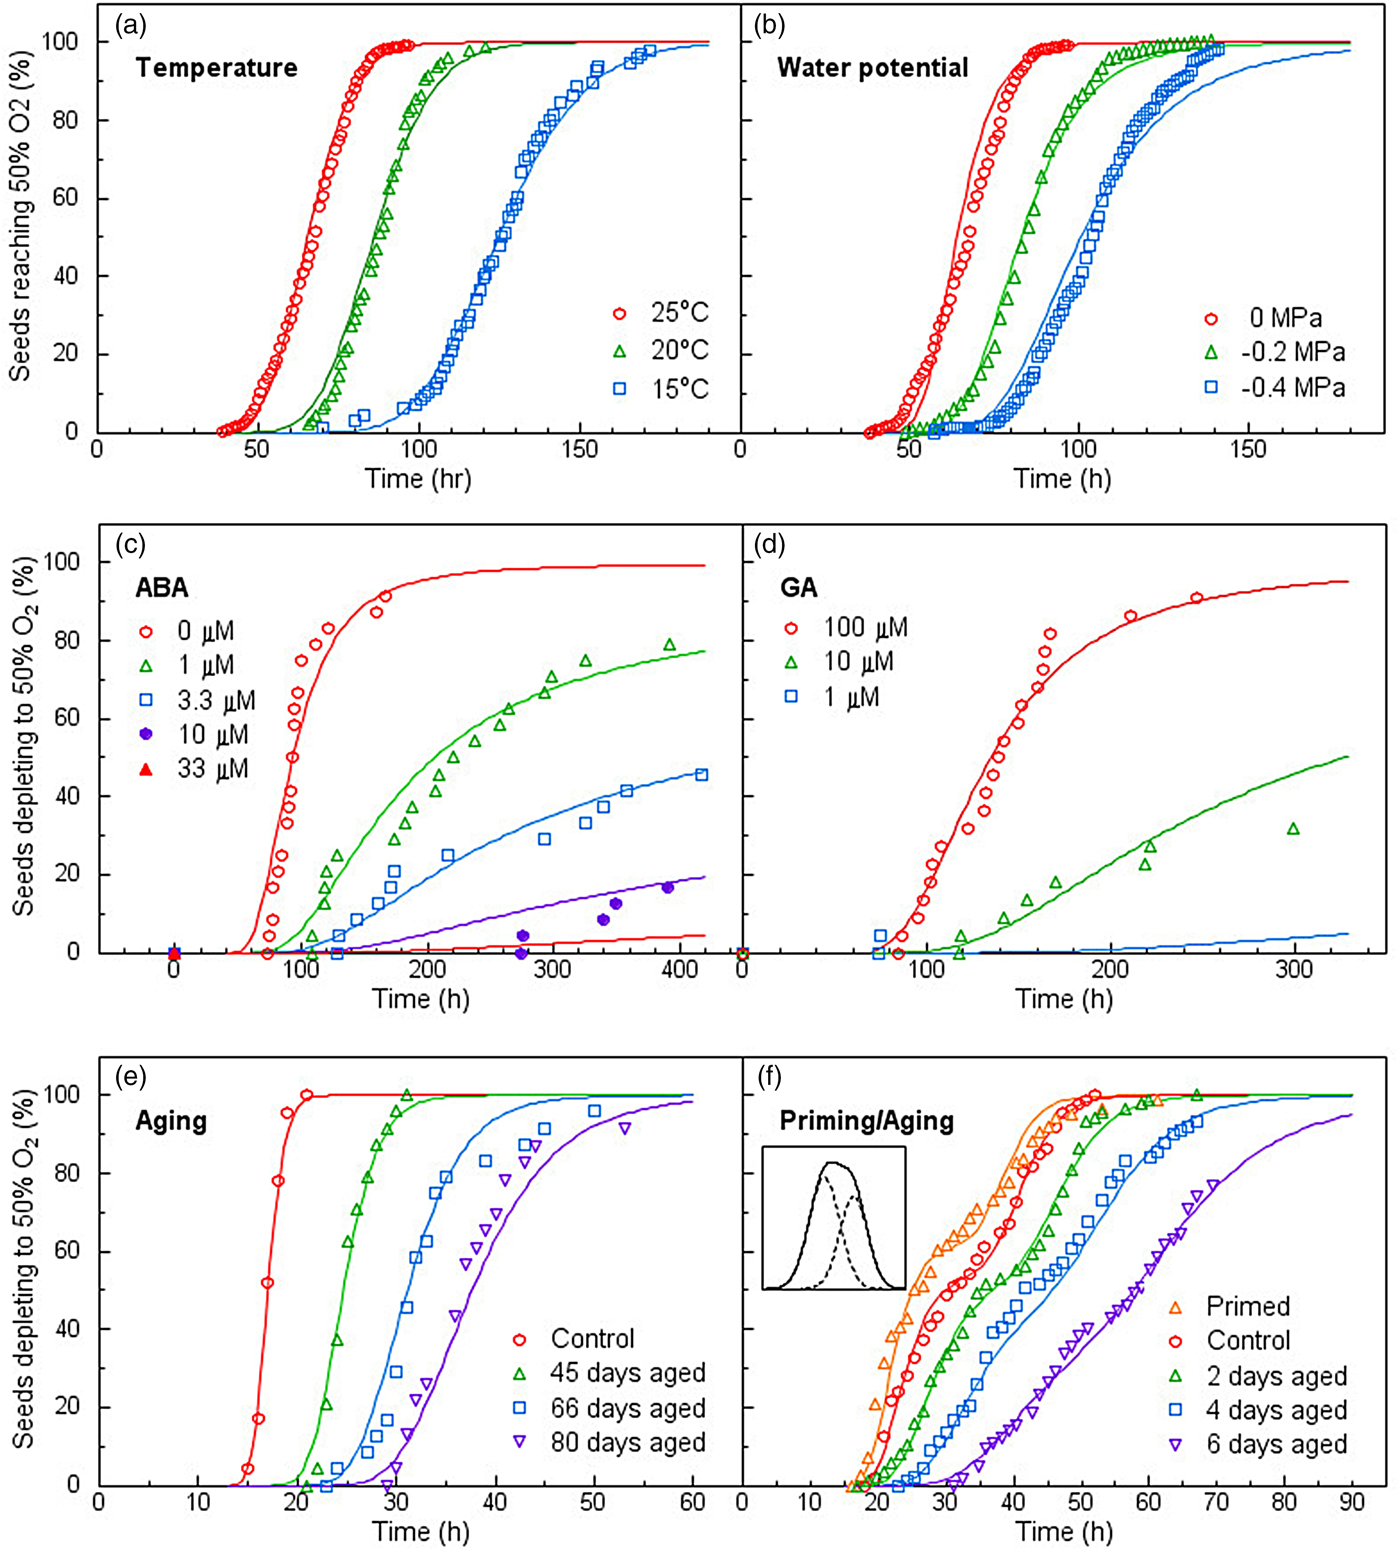
Fig. 3. Population oxygen depletion time courses of seeds in response to different factors affecting germination. In each case, germination rates were linearly correlated with oxygen consumption rates. Symbols represent the times when individual seeds depleted half of the oxygen available. Adapted from Bello and Bradford, Reference Bello and Bradford2016.
Seeds can be treated as individuals, but clearly each seed consists of many tissues and the tissues consist of cells. Can the concept of individuality be extended to tissues and cells? As shown by in situ hybridization and antibody techniques, different parts of seeds can have different gene and protein expression patterns associated with germination. A simple example is the expression of different mannanase gene family members exclusively in the micropylar and lateral endosperm of tomato seeds (Nonogaki et al., Reference Nonogaki, Gee and Bradford2000). More precise methods such as laser micro-dissection and transcript identification demonstrated the uniqueness of gene expression patterns in different tissues and at different times during development of Arabidopsis embryos (Le et al., Reference Le2010). It is now possible to obtain complete transcriptomes from essentially all of the individual cells in a tissue or organism (Cao et al., Reference Cao2017; Karaiskos et al., Reference Karaiskos2017). These studies demonstrate the individuality of cells (or groups of cells) with respect to their gene expression patterns. In assessing the impact of this insight with respect to Drosophila embryos, Stadler and Eisen (Reference Stadler and Eisen2017) noted ‘One area where new insights are needed is noise. Prior to the advent of single-cell sequencing there was a general sense that regulatory networks in development are precise and robust. But it is now clear that this opinion was a by-product of looking at the average behavior of thousands of cells. When viewed at single-cell resolution, expression data is remarkably variable (noisy). Some of this can be chalked up to technical issues, but it is also clear that gene expression at the single-cell level, even in tightly controlled embryos, is intrinsically noisy (Garcia et al., Reference Garcia Hernan2013). What this means for gene regulation and development is unclear, but it is something the field needs to grapple with.’
One aspect of grappling with this was recently demonstrated by Topham et al. (Reference Topham2017). The responsivity of expression of specific genes to GA and ABA in the mature imbibed Arabidopsis embryo was localized to relatively few cells in specific and distinct regions of the radicle tissue. As GA and ABA promote or inhibit germination, respectively, and also affect the biosynthesis and action of each other, the interactions of sensitivity and response in these cellular centers determine the developmental fate of the seed, i.e. whether it progresses towards germination or not. Those centres, in turn, are being influenced by other inputs, such as temperature, light, nutrients, and other factors that collectively determine whether a seed germinates now or later. Each of those inputs may have specific sensing centres that are also operating in a threshold sensitivity manner. Thus, we can envision multiple layers of controls that are engaged through distinct sensing pathways to influence the balance of GA and ABA and completion of germination. An initial example of this illustrated the interaction of ABA and water potential in regulating germination. Simply summing the outputs of PBT models separately determined for ABA and water potential accurately described the resulting germination behaviour across a dosage matrix of both factors (Ni and Bradford, Reference Ni and Bradford1992). We can anticipate that by separately determining the response patterns of cells to multiple signalling inputs, complexity may be reduced by accounting for predictable variation by subpopulations operating under relatively simple population-based principles (e.g. Eqn 3).
In investigations of microbial and animal cells, variation in signalling, transcriptional or translational responses are consistently termed ‘noise’ and are considered to be an inevitable consequence of the stochastic nature of chemical reactions (Raser and O'Shea, Reference Raser and O'Shea2005; Eldar and Elowitz, Reference Eldar and Elowitz2010; Chalancon et al., Reference Chalancon2012). However, it is also possible that these cells are exhibiting PBT-type behaviour. This was proposed and modelled by Rodbard (Reference Rodbard1973), who asked whether insulin-secreting β-cells in the pancreas all responded to blood glucose concentration quantitatively in concert or whether different cells with different sensitivities might individually have a quantal (digital) response and be recruited sequentially to secrete insulin as the glucose concentration increased. This recruitment of additional cells having varying sensitivity to secrete more insulin automatically responds to the glucose concentration without requiring each cell to finely monitor and adjust its insulin output. Pancreatic β-cells are heterogeneous in their responses to glucose (Salomon and Meda, Reference Salomon and Meda1986; Van Schravendijk et al., Reference Van Schravendijk, Kiekens and Pipeleers1992), but it appears that the situation may be more complex, as while different clusters of cells (islets) do vary in their characteristics, the cells within a cluster respond in concert with similar glucose sensitivity (Valdeolmillos et al., Reference Valdeolmillos, Gomis and Sánchez-Andrés1996). However, the magnitude of the response (frequency of electrical oscillations associated with insulin release) to a given glucose concentration varied among different islets. As blood glucose concentration varies over a relatively small range compared with the logarithmic range of plant hormone responses, it may make more sense for cells to have similar threshold sensitivities but a range of response kinetics once the response threshold is exceeded. This could be modelled as:
 $$\theta _X\left( i \right) = \left( {X - X_{\rm b}} \right)t_i,$$
where it is the time constant (frequency of insulin release) that is the population variable with a relatively fixed response threshold (X b) for the signalling factor (e.g. glucose in this case). This is directly analogous to the thermal time model (Eqn 1) in the case where the base temperature is similar in the population but the speed of response varies. Single-cell transcriptomic and antigenic studies recently demonstrated that there is heterogeneity among β-cells for both gene expression and protein complements, with at least four subpopulations being identified (Avrahami et al., Reference Avrahami2017). Insulin transcript levels varied more than 100-fold among individual human β-cells. The authors concluded that ‘while we cannot see into the future and predict what we will find when we study the molecular heterogeneity of the human endocrine pancreas in ever increasing detail, one thing is certain: we are entering an exciting new phase of discovery in islet biology’. With the experience gained from seed biology, we can suggest that islet biologists refer to the prescient paper by Rodbard (Reference Rodbard1973) and consider analysing the behaviour of β-cells as populations exhibiting PBT-type behaviour rather than as simply being stochastically noisy.
Research on microbial and animal cells has also demonstrated that ‘the mean of a population is often a poor descriptor of any individual cell, particularly when cells exist in two or more distinct groups with different properties’ (Sparta et al., Reference Sparta2015). Nonetheless, analyses of such populations tend to focus on extracting a ‘separable static response’ signal from the ‘noise’ resulting from cellular variability (Selimkhanov et al., Reference Selimkhanov2014). In fact, the population behaviour shown for extracellular signal-regulated kinase (ERK) activity in response to epidermal growth factor (EGF) in human mammary epithelial cells conforms well to the expectations of the PBT model, as increasing dosages of EGF result in recruitment of more responding cells and more rapid responses in those cells that do respond (Selimkhanov et al., Reference Selimkhanov2014; Sparta et al., Reference Sparta2015; Gillies et al., Reference Gillies2017). As was demonstrated by the single-seed assays and pancreatic β-cell studies discussed above, it is likely that efforts to extract the mean behaviour of cells from this variation will obscure rather than reveal the relevant patterns. As was discussed by Trewavas (Reference Trewavas, Witzany and Baluska2012), biological and hormonal signalling often synchronizes cell behaviour. One interpretation of this is that it reduces noise, but it is also a direct consequence of the PBT model, as at higher concentrations of an effector, the majority of cells are recruited to respond and their time to response is simultaneously reduced (Fig. 1). This has the automatic consequence of synchronizing cell behaviour. However, most of the time biology does not operate at saturating dosages of effectors, and the resulting low level of synchrony does not mean that all is noise or that extracting the mean, rather than the population sensitivity distribution, will identify the ‘true’ signal.
Identifying signals and responding to them has a long evolutionary history in biology. Individual bacteria have the ability to sense and swim up or down concentration gradients of specific chemicals (Blair, Reference Blair1995). It has long been known that individual bacteria vary in their sensitivity in essentially a normal distribution and that they can change their sensitivity thresholds as needed when moving in a chemical gradient (Mesibov et al., Reference Mesibov, Ordal and Adler1973). It has been argued that the diversity and interactions of multiple such sensory systems could constitute a ‘bacterial intelligence’ (Hellingwerf, Reference Hellingwerf2005), and such systems enable population-level behaviour such as quorum sensing even in single-celled microbes (Bandara et al., Reference Bandara2012). Mammalian cellular signalling systems contain conserved components of these earlier ones (Sparta et al., Reference Sparta2015). Thus, higher organisms had a wealth of sensing and threshold mechanisms to adapt to their uses during evolution. Consider the mouse olfactory system, in which ‘there are ~1500 odorant receptor genes comprising the largest multigene family in the mouse genome’ (Serizawa et al., Reference Serizawa, Miyamichi and Sakano2004). Each olfactory sensory neuron expresses only one of these genes, making it receptive to only a single odorant stimulus. The population of such neurons, each specialized for high sensitivity to a unique chemical signal, constitutes the olfactory spectrum that can be sensed by the mouse. In addition, neuronal systems are also characterized by the ‘all-or-none’ behaviour once a threshold stimulus has been exceeded (Dehaene et al., Reference Dehaene, Lau and Kouider2017). Biology clearly has the potential to create sensitivity distributions of diverse types at the cellular level. Biology seldom abandons a useful functional mechanism, preferring to adapt and build on a working model rather than invent a new one. Thus, we can expect that sensitivity distributions among cells will be widely utilized in biology, should we choose to look for them.
As final comments on individuality, we can ask whether cells are the lowest level of organization to which population-based regulation might apply. This is evidently not the case, as in some examples cited above, it is not actually whole cells but reporters of individual enzymes/pathways that are being observed (Selimkhanov et al., Reference Selimkhanov2014; Sparta et al., Reference Sparta2015). In fact, transcription itself is a quantal or digital process, as for a given gene at a given time, it either is or is not being transcribed. The digital nature of gene regulation has been demonstrated in the case of the epigenetic regulation of the flowering suppressor FLC in response to cold temperature (vernalization) (Angel et al., Reference Angel2011, Reference Angel2015). The FLC alleles on different chromosomes in the same cell are even switched off independently in response to cold exposure. If a gene is not epigenetically switched off and is potentially available for expression, then the rate of expression (number of transcripts per unit time) is based on the frequency of initiation of RNA polymerase complexes. Sensitivity of a promoter region with respect to transcription is based on the presence of the appropriate binding motifs in concert with the binding capacities of specific transcription factor (TF) complexes for those motifs. We can therefore think of all promoters in the genome as one population and all available TFs as another. Each of these will be partitioned into subpopulations based on the specific motifs present in the promoters and the abilities of TFs to recognize and bind to those motifs. In the nucleus, the populations of available promoter motifs and corresponding TFs constitute sensitivity distributions and effector dosages that may follow PBT logic. That is, when the sensitivity is high (i.e. a particular motif has a high affinity for a particular TF), the TF will occupy the promoter more frequently and enable more polymerases to transcribe the adjacent gene. This automatically results in the quantitative or kinetic component of the PBT model. The same effect can be achieved by increasing the concentration of TFs, or be countered by DNA methylation or repressive epigenetic marks on the chromosome. When we consider that TF complexes themselves are composed of multiple proteins, each of which may bind to multiple partners with different affinities and be responsive to different upstream signals, the potential complexity that can be created based on population threshold distributions is evident. Despite this complexity, the PBT approach provides a path to understand and quantify the subpopulation behaviour and thereby account for some of the variance that is currently attributed to noise.
Pushing even further, we can speculate whether a similar approach could be applied to enzymology as well. The interaction of an enzyme and its substrate(s) to produce a product is also a quantal event, in that a given interaction proceeds to a given product, in one direction or the other. Even though it is well known that the activity of an enzyme can be altered by allosteric effectors, phosphorylation and other chemical modifications, we seldom consider a cell's complement of a particular enzyme as a population of molecules that vary with respect to affinity for a substrate. That is, a population of enzyme molecules may exhibit a sensitivity distribution with respect to their substrate(s). In analogy to the pancreatic islet cells, a population of enzyme proteins having different affinities for a substrate might be recruited (activated) or silenced (inactivated) by small shifts in substrate or effector concentrations in order to regulate metabolic pathways. Enzyme activities often are measured and compared according to Michaelis–Menton kinetics, which are determined from initial reaction rates across a range of substrate concentrations (dosages). In our mind's eye, we envision all of the enzyme molecules in the test tube being identical and in the same activation state and changes in substrate concentrations to increase or decrease reaction rates by mass action. In vivo, conditions are unlikely to be this simple. A recruitment mechanism based on shifting subpopulations of individual enzyme molecules into or out of activated states constitutes an automatic mechanism for adjusting enzyme kinetics and capacity to current needs. This would be a biochemical analogy to shifting populations of stomata from open to closed to adjust leaf water or carbon balances (Fig. 2).
A population-centric vision of biology
By their very nature, seeds have forced biologists to consider them as populations of individuals. Whether it was Darwin pondering the enormous numbers of seeds that perish compared with the few individuals who survive, or a farmer waiting to see whether the crop seeds she planted will emerge uniformly from the ground, we view seeds simultaneously as individuals and as populations. As Eric Roberts (Reference Roberts1973) noted, ‘It has been suggested that seeds are unpredictable things and consequently it would be a waste of time to try to perceive laws of behavior among such erratic individuals. … But other disciplines have shown us quite clearly that, although the behavior of any individual in a population may be quite unpredictable, the behavior of populations of individuals can often be defined very accurately.’ The intent of this paper has been to bring this insight to the forefront and argue that PBT models based on it may be useful not only for seeds, but also for understanding the inner workings of biology itself, from biochemistry to ecology (Fig. 4). While no doubt there is noise and stochasticity in biology, there is also an underlying consistency in pattern and population behaviour that operates within and across levels of biological complexity. The key is to train our eyes and minds to see the underlying population patterns and to interpret the apparent complexity in light of them. If we are to understand biological systems, our concepts and models must be as complex as the reality they seek to describe. The tools are available to study biology at the individual level, whether of organisms, cells, or molecules. Rather than trying to wrestle means and norms from the rambunctious variation that is biology, we should embrace the importance of individuality and adopt new ways to interpret what these complex systems are telling us.

Fig. 4. Organizational hierarchies of biological systems that may function as populations with sensitivity threshold variations that underlie apparent complexity at adjacent organizational levels.
Acknowledgements
The J. Derek Bewley Career Lecture is an invited lecture sponsored by the International Society for Seed Science (ISSS) and named in recognition of his illustrious career and manifold contributions to seed science. This lecture invites a newly or nearly retired seed scientist to provide a retrospective presentation on the field and her/his career with a view to lessons learned and implications for the future. The author was honoured to present this lecture at the 12th Triennial ISSS Conference held in Monterey, California, on 10–14 September 2017, which had the overall theme of ‘Seeds as Systems’. He is pleased to dedicate this paper based on that lecture to his friend and mentor, Derek Bewley. The author thanks Pedro Bello for multiple contributions, including preparation of Figure 1.
Financial support
This paper is supported in part by the United States Department of Agriculture–National Institute for Food and Agriculture Regional Research Project W3168.