


Introduction
Seed germination is a pivotal stage in the life cycle of plants (Walck et al., Reference Walck, Hidayati, Dixon, Thompson and Poschlod2011; Baskin and Baskin, Reference Baskin and Baskin2014). Temperature is a critical environmental factor regulating seed dormancy break, germination and subsequent seedling establishment (Bradford, Reference Bradford2002; Baskin and Baskin, Reference Baskin and Baskin2014). Three ‘cardinal temperatures’, the minimum, optimum and maximum temperatures, are used to characterize seed germination responses to temperature. The minimum (or base, T b) and maximum (or ceiling, T c) temperatures are below and above those at which germination will occur, respectively, while germination is most rapid at the optimum temperature (T o) (Alvarado and Bradford, Reference Alvarado and Bradford2002; Bradford, Reference Bradford2002; Bewley et al., Reference Bewley, Bradford, Hilhorst and Nonogaki2013; Dürr et al., Reference Dürr, Dickie, Yang and Pritchard2015). Thus, the knowledge of seed germination responses to temperature is required not only for understanding the ecological adaptation of species but also for formulating effective strategies for restoration (Fenner et al., Reference Fenner, Fenner and Thompson2005; Baskin and Baskin, Reference Baskin and Baskin2014).
Many studies have found that the germination rate (GRg, the reciprocal of time to a given germination fraction, 1/t g) is linearly related to temperature (Gummerson, Reference Gummerson1986; Bradford, Reference Bradford2002; Hardegree, Reference Hardegree2006; Hu et al., Reference Hu, Fan, Baskin, Baskin and Wang2015; Felipe Daibes and Cardoso, Reference Felipe Daibes and Cardoso2018; Carhuancho León et al., Reference Carhuancho León, Aguado Cortijo, Morato Izquierdo and Castellanos Moncho2020; Zhang et al., Reference Zhang, Luo, Chen, Baskin, Baskin, Wang and Hu2020). Thus, the thermal time model has been developed to evaluate the effect of temperature on progress towards germination (Covell et al., Reference Covell, Ellis, Roberts and Summerfield1986; Ellis et al., Reference Ellis, Covell, Roberts and Summerfield1986; Gummerson, Reference Gummerson1986; Allen et al., Reference Allen, Meyer and Khan2000; Bradford, Reference Bradford2002). In this model, several parameters were fitted and used to quantify temperature requirements for seed germination, such as the cardinal temperatures (T b, T o and T c) and thermal time (θT, the thermal time required to reach the germination requirement of individual seeds in the population) (Bradford, Reference Bradford2002; Hu et al., Reference Hu, Fan, Baskin, Baskin and Wang2015; Saberali and Shirmohamadi-Aliakbarkhani, Reference Saberali and Shirmohamadi-Aliakbarkhani2020; Zhang et al., Reference Zhang, Luo, Chen, Baskin, Baskin, Wang and Hu2020). Although thermal time models are empirical, rather than mechanistic, they provide biologically meaningful parameters. The intrinsic germination rate, reaction to temperature and uniformity of germination correspond to θT(g), T b and σθT, respectively, at suboptimal temperatures (Bradford, Reference Bradford2002).
Generally, implicit in thermal time models are the assumptions that the minimum temperature, T b, is constant for all fractions of the seed population and that thermal time, θT(g), follows a log-normal distribution with a mean [ln(θT(50))] and standard deviation [σln(θT)] at suboptimal temperatures (Covell et al., Reference Covell, Ellis, Roberts and Summerfield1986; Cheng and Bradford, Reference Cheng and Bradford1999; Hu et al., Reference Hu, Zhou, Li, Wu and Wang2013, Reference Hu, Fan, Baskin, Baskin and Wang2015; Rong et al., Reference Rong, Li and Johnson2015; Daibes and Cardoso, Reference Daibes and Cardoso2018; Ostadian Bidgoly et al., Reference Ostadian Bidgoly, Balouchi, Soltani and Moradi2018; Zhang et al., Reference Zhang, Luo, Chen, Baskin, Baskin, Wang and Hu2020). The log-normal (or normal) distribution was originally selected for thermal time modelling on the basis of its adequate fit to data from original studies and its mathematical convenience, rather than for any theoretical reasons (Mesgaran et al., Reference Mesgaran, Mashhadi, Alizadeh, Hunt, Young, Cousens and Andersson2013). However, θT(g) is defined explicitly as an extreme value, at or below which no germination occurs. Thus, thermal time may be expected to follow skewed frequency patterns, and some generalized extreme-value models, such as the Gumbel and Weibull distributions, may be satisfied in describing the pattern of θT(g) variation (Bradford, Reference Bradford2002; Watt et al., Reference Watt, Xu and Bloomberg2010). Sakanoue (Reference Sakanoue2010) showed that the exponential distribution with a lag phase provided concise and practical estimates of germination rates in the determination of the base temperature and thermal time required for seed germination of nine herb species. Rosbakh et al. (Reference Rosbakh, Poschlod and Anten2015) reported that the Weibull distribution provided a consistently close fit to the data when used in thermal time models to calculate the cardinal temperatures of 49 species. In addition, Peng et al. (Reference Peng, Wang, Jiang, Chang and Chu2018) combined the logistic function and a thermal time model to estimate the base temperature and the thermal time for germination of two desert species in the Junggar Basin of China. Moreover, using the inverse normal distribution function (Cave et al., Reference Cave, Birch, Hammer, Erwin and Johnston2011) in thermal time models also has led to more accurate and non-biased estimates of cardinal temperatures and thermal time for seed germination.
Although many distribution functions have been used in thermal time models to describe the thermal requirements for seed germination (Covell et al., Reference Covell, Ellis, Roberts and Summerfield1986; Sakanoue, Reference Sakanoue2010; Cave et al., Reference Cave, Birch, Hammer, Erwin and Johnston2011; Hu et al., Reference Hu, Fan, Baskin, Baskin and Wang2015; Rosbakh et al., Reference Rosbakh, Poschlod and Anten2015; Peng et al., Reference Peng, Wang, Jiang, Chang and Chu2018; Zhang et al., Reference Zhang, Luo, Chen, Baskin, Baskin, Wang and Hu2020), a conclusion regarding the most suitable distribution function for fitting germination data in thermal time models based on a comparison of multiple distributions has not yet been reached, which may lead to biased parameter estimates. However, with the exception of a study on hydrothermal time models (Mesgaran et al., Reference Mesgaran, Mashhadi, Alizadeh, Hunt, Young, Cousens and Andersson2013) in which the log-logistic distribution consistently provided the best explanation of Ψb(g) variation among eight distributions for three weed species, little is known about which kind of the distribution is most suitable when used in thermal time models, especially at suboptimal temperatures. In addition, it is also not clear whether the best distribution function differs among species, since the inconsistencies among previous studies may have been due to differences among species. Therefore, a systematic evaluation of the best distribution function to use in thermal time models is needed for estimating temperature or thermal time requirements for seed germination and predicting seed germination dynamics.
In our study, five distribution functions, including log-normal, Gumbel, logistic, Weibull and log-logistic, were explored to describe the variation in θT(g) at suboptimal temperatures for 15 common species, and the following questions were addressed: (1) Does distribution function selection lead to a biased estimation for parameters of the thermal time model? (2) If it is, which function provides the best estimation? (3) Does the best distribution function differ among species?
Materials and methods
Seed collection
Seeds of Elymus dahuricus, Elymus nutans, Elymus sibiricus, Ephedra intermedia, Festuca sinensis, Hedysarum multijugum, Lepidium apetalum, Lolium multiflorum, Lolium perenne, Medicago sativa, Onobrychis viciifolia, Poa crymophila, Sorghum bicolor, Trifolium pratense and Trifolium repens were used in this study, and they were provided by the Official Herbage and Turfgrass Seed Testing Centre, Lanzhou, Ministry of Agriculture and Rural Affairs, China. Seeds were stored dry in paper bags at 4°C until used in experiments in March 2017. On the one hand, these species are common herbages and weeds in China, and thus the conclusion based on these species is universal. On the other hand, species with a germination percentage of more than 80% were selected and used in the present study, which is helpful to estimate the thermal time model correctly and effectively and get a more accurate conclusion.
The initial seed germination percentage and the thousand-seed weight (TSW) of all tested species and water-impermeable seeds of H. multijugum, M. sativa, O. viciifolia, T. pratense and T. repens were determined before the experiments commenced (supplementary Table A1). The seed germination percentage and the TSW were determined according to the International Seed Testing Rules (the seed germination percentages of E. dahuricus, E. nutans, E. sibiricus, F. sinensis, H. multijugum, L. apetalum and P. crymophila were based on those for corresponding genera, while the seeds of E. intermedia were examined at 20°C according to the habitat conditions of the species, as this genus is not included in the International Seed Testing Rules) (ISTA, 2014). The percentage of water-impermeable seeds was determined by incubating seeds at 20°C for 14 d, after which the number of seeds remaining water-impermeable was determined (Hu et al., Reference Hu, Fan, Baskin, Baskin and Wang2015). The initial seed germination percentage of all species was greater than 80%, and the water-impermeable percentage of the five species was less than 5%.
Effect of temperature on germination
Germination responses to temperature were tested for seeds of all species by incubation at six constant temperatures from 10 to 35°C, depending on the species, at 5°C intervals. Seeds were exposed to a 12/12 h daily photoperiod (white fluorescent tubes, photo irradiance: 60 μmol m−2 s−1, 400–700 nm). For each treatment, three replicates of 50 seeds were placed in 10-cm-diameter Petri dishes on two sheets of filter paper (Shuangquan, Hangzhou, China) moistened with 7 ml of distilled water. Seeds were monitored for germination every 8, 16 and 24 h, depending on the germination rate, for at least 28 d until no further germination occurred for three consecutive days; seedlings were removed at each counting. Seeds were counted as germinated when the radicle was visible (≥2 mm). All chambers used for temperature experiments were set to have the same light and humidity conditions. The temperature, light and humidity in each chamber were monitored carefully, and the position of Petri dishes inside each chamber was randomized every day. Thus, we assumed that temperature was the only environmental factor that varied between the chambers.
Distributions
In this study, five distribution functions, namely, the log-normal, Gumbel, logistic, Weibull and log-logistic functions, were used to fit the data and describe the variation in θT(g) at suboptimal temperatures [see Mesgaran et al. (Reference Mesgaran, Mashhadi, Alizadeh, Hunt, Young, Cousens and Andersson2013) for more details on these distributions].
Log-normal distribution
At suboptimal temperatures, the log-normal distribution of the thermal time model is as follows:
 $${\rm \theta }_{{\rm T}( {\rm g} ) } = {\rm e}^{{\rm \sigma \;\cdot \;probit( g)\; + \ \;\mu \;}}$$
 $${\rm probit}( {\rm g) }\;{\rm} = \displaystyle{{{\rm ln\;}( {( {T{\rm \;}-{\rm \;}T_{\rm b}} ) {\rm \;\cdot \;}t_{\rm g}{\rm \;}} ) \;-\;{\rm \mu }} \over {\rm \sigma }}\;$$
where θT(g) is the thermal time required to reach the germination requirements among individual seeds in the population at the suboptimal temperatures (with units of °C per day or hour); probit(g) is the probit transformation of cumulative germination percentage g, which linearizes the sigmoidal time course on a log time scale (Finney, Reference Finney1971); μ(ln(θT(50))) and σ(σlnθT) are the median thermal time and standard deviation of ln(θT) requirements among individual seeds in the population, respectively; T is the germination temperature; T b is the minimum temperature and t g is the actual time to germination of fraction g. If θT(g) follows a log-normal distribution, then at ln(θT(g)) = μ, the fraction of germinated seeds is 0.5.
Gumbel distribution
The inverse cumulative distribution for predicting θT and the cumulative distribution function for predicting the germination percentage (g) with the Gumbel distribution can be formulated into a thermal time model at suboptimal temperatures as follows:
 $${\rm \theta }_{{\rm T}( {\rm g} ) } = {\rm \mu \;}-{\rm \;\sigma \;\cdot \;}\left[{{\rm ln}\left({{\rm ln}\left({\displaystyle{ 1 \over g}} \right)} \right)} \right]$$
 $${\rm \;}g\;{\rm} = {\rm exp}\left[{-{\rm \;exp}\left({-{\rm \;}\left({\displaystyle{{( {( {T{\rm \;}-{\rm \;}T_{\rm b}} ) {\rm \;\cdot \;}t_{\rm g}{\rm \;}-{\rm \;\mu }} ) } \over {\rm \sigma }}} \right)} \right)} \right]$$
where μ and σ are location and scale parameters, respectively. If θT(g) follows a Gumbel distribution, then at θT(g) = μ, the fraction of germinated seeds is ≈0.366 (with a log-normal distribution, the value is 0.5).
Logistic distribution
An applicability of the logistic distribution in thermal time models at suboptimal temperatures was evaluated as follows:
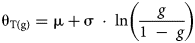 $${\rm \theta }_{{\rm T}( {\rm g} ) } = {\rm \mu } + {\rm \sigma \;\cdot \;ln}\left({\displaystyle{g \over {{\rm 1\;}-{\rm \;}g}}} \right)$$
 $$\;g\;{\rm} = \displaystyle{ 1 \over { 1 + {\rm exp\;}\left({-{\rm \;}\left({\displaystyle{{( {( {T\;-T_{\rm b}} ) {\rm \;\cdot \;}t_{\rm g}{\rm \;}-{\rm \;\mu }} ) } \over {\rm \sigma }}} \right)} \right)}}\;$$
Weibull distribution
The Weibull distribution can be incorporated into a thermal time model at suboptimal temperatures as follows:
 $${\rm \theta }_{{\rm T}( {\rm g} ) } = {\rm \mu } + {\rm \sigma \;\cdot \;}[ {-{\rm \;ln\;}( {{\rm 1\;}-{\rm \;}g} ) } ] ^{{1 / {\rm \lambda }}}$$
 $${\rm \;}g = {\rm 1\;}-{\rm \;}\left[{{\rm \;exp}\left({-{\rm \;}{\left({\displaystyle{{( {( {T{\rm \;}-{\rm \;}T_{\rm b}} ) {\rm \;\cdot \;}t_{\rm g}{\rm \;}-{\rm \;\mu }} ) } \over {\rm \sigma }}} \right)}^{\rm \lambda }} \right)} \right]$$
where λ is the shape parameter that determines the skewness and kurtosis of the distribution. Regardless of the shape value, if θT(g) − μ = σ, then the proportion of germinated seeds is ≈0.632.
Log-logistic distribution
For this distribution, the thermal time model at suboptimal temperatures becomes the following:
 $${\rm \theta }_{{\rm T}( {\rm g} ) } = {\rm \mu } + {\rm \sigma \;\cdot \;}\left({\displaystyle{g \over {{\rm 1\;}-{\rm \;}g}}} \right)^{{1 / {\rm \lambda }}}$$
 $$\;g\;{\rm} = \displaystyle{ 1 \over { 1 + {\left({\displaystyle{{( {( {T{\rm \;}-{\rm \;}T_{\rm b}} ) {\rm \;\cdot \;}t_{\rm g}{\rm \;}-{\rm \;\mu }} ) } \over {\rm \sigma }}} \right)}^{-{\rm \lambda }}}}\;$$
Data analysis
All distributions, having been formulated into a thermal time model, were fitted to data using non-linear regression in SPSS 25.0 (SPSS Inc., Chicago, IL). The value of θT(50) can be obtained from regression (equations 1, 3, 5, 7 and 9) when g = 50% in all models (in a log-normal distribution, the value is eμ). The model parameters, μ, σ, λ and T b, were estimated by an iterative method until the residual sum of squares (RSS) (equation 11) of the regression (equations 2, 4, 6, 8 and 10) was minimized (Ellis et al., Reference Ellis, Covell, Roberts and Summerfield1986). To identify the best model for estimating T b and θT(50) at suboptimal temperatures, the adjusted coefficient of determination (Ra 2) (equation 12) and the corrected Akaike information criterion (AICc) (equation 13) were used (Sugiura, Reference Sugiura1978; Hu et al., Reference Hu, Fan, Baskin, Baskin and Wang2015; Parmoon et al., Reference Parmoon, Moosavi, Akbari and Ebadi2015).
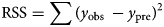 $${\rm \;RSS} = \sum ( {y_{{\rm obs\;}}-y_{{\rm pre}}} ) ^ 2$$
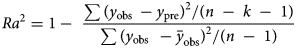 $$Ra^ 2 = 1-{\rm \;}\displaystyle{{\sum {( {y_{{\rm obs\;}}-y_{{\rm pre}}} ) }^ 2/( {n{\rm \;}-{\rm \;}k{\rm \;}-{\rm \;1}} ) } \over {\sum {( {y_{{\rm obs\;\;}}-{\bar{y}}_{{\rm obs}}} ) }^ 2/( {n{\rm \;}-{\rm \;1}} ) }}$$
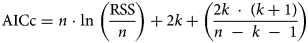 $${\rm \;AICc} = n{\rm \;\cdot \;ln\;}\left({\displaystyle{{{\rm RSS}} \over n}} \right) + 2k + \left({\displaystyle{{2k\;\cdot \;( {k + 1} ) } \over {n\;-\;k\;-\;1}}} \right)$$
 $${\rm \Delta }_{\rm i} = {\rm AICc\;}-{\rm \;AIC}{\rm c}_{{\rm min}}$$
where y obs refers to the observed values, y pre refers to the predicted values,  $\bar{y}_{{\rm obs}}$ is the mean of the observed values, n is the number of observations, k is the number of model parameters, and AICcmin is the minimum calculated AICc among all distribution models.
The most accurate estimation model is the one with the lowest RSS value, highest Ra 2 value and lowest AICc value, when the AICc value is estimated according to Parmoon et al. (Reference Parmoon, Moosavi, Akbari and Ebadi2015). If Δi < 10, there is no significant difference between models, and the model with a higher AICc value is also suitable. If Δi > 10, the model with a higher AICc value is not suitable and does not fit well. Therefore, to select the best model, appropriate AICc values were first determined according to the Δi value, and then, the values of RSS and Ra 2 were assessed.
Thermal time models include residuals, which were estimated from the difference between the virtual θT(g) and predicted θT(g) at suboptimal temperatures, and denoted RT. The residuals were plotted against fitted values to evaluate each distribution function visually for any systematic bias, and a quadratic polynomial was used to fit the residuals for better visualization of trends (Mesgaran et al., Reference Mesgaran, Mashhadi, Alizadeh, Hunt, Young, Cousens and Andersson2013).
Results
The parameter estimates of the 15 species obtained with the five distributions at suboptimal temperatures are summarized in Table 1. The log-logistic distribution provided the best fit to the θT(g) [or ln(θT(g))] data for 13 of the 15 species in this study (E. dahuricus, E. sibiricus, E. intermedia, F. sinensis, H. multijugum, L. apetalum, L. multiflorum, L. perenne, M. sativa, O. viciifolia, P. crymophila, S. bicolor and T. pratense). The log-normal and Weibull distributions provided the best fit for seeds of T. repens and E. nutans, respectively. On the contrary, the logistic and log-normal distributions provided the worst fit for 12 and 3 species, respectively (Table 1).
Table 1. Estimated parameters for five statistical distributions used in thermal time models for seed germination of 15 species at suboptimal temperatures

Using T. pratense as an example, the log-logistic distribution resulted in the best fit, with the lowest RSS and AICc values and the highest Ra 2 value among the five distributions (0.053, −233.040 and 0.976, respectively) (Table 1). The log-normal distribution gave the poorest fit (the RSS, AICc and Ra 2 values were 0.292, −172.424 and 0.873, respectively), and the other three distributions (Gumbel, logistic and Weibull) performed only slightly better. The fits between seed germination and thermal time at suboptimal temperatures for the five distributions are shown in Fig. 1, which shows the best agreement between the predicted and observed values for the log-logistic distribution. All these results were further evaluated by inspecting residual plots (Fig. 2), which showed that using the log-normal, Gumbel or logistic distribution led to highly biased predictions of θT(g) residuals (RT) compared with those obtained with the log-logistic and Weibull distributions. Similarly, the log-logistic distribution gave the best fit for 12 species (Table 1; supplementary Appendixes B and C).

Fig. 1. Thermal time of T. pratense seeds predicted by thermal time models based on five distributions at suboptimal temperatures. Circles show the observed mean thermal times. The red dashed lines show the predicted thermal time, which was fitted by the thermal time model based on the five distributions.

Fig. 2. Scatter plots of thermal time against residuals (RT) for five distributions used in thermal time models of T. pratense seeds at suboptimal temperatures. The red dashed lines are quadratic polynomials fitted to the residuals for better visualization of trends.
The Weibull and log-normal distributions were the most suitable distributions for E. nutans and T. repens, respectively, and the RSS, AICc and Ra 2 values were 0.269, −114.622 and 0.815 for E. nutans, respectively, and 0.252, −131.623 and 0.821 for T. repens, respectively (Table 1; supplementary Appendixes B and C). The logistic distribution provided the worst fit for these two species, with an apparent predicted thermal time–RT relationship; in other words, the outputs obtained with the logistic distribution were highly biased (supplementary Appendix C). Similarly, the logistic distribution provided the worst data fit for E. sibiricus, E. intermedia, F. sinensis, H. multijugum, L. multiflorum, L. perenne, O. viciifolia, P. crymophila and S. bicolor.
Discussion
Thermal time models, in a standard form (log-normal distribution) at suboptimal temperatures, provide several useful parameters of seed quality, which are related to the temperature tolerance (T b), speed [θT(50)] and uniformity (σθT) of germination (Bradford, Reference Bradford2002). The θT(g) [or ln(θT(g))] of the seed sample is commonly assumed to follow a log-normal (or normal) distribution (probit transformation) at suboptimal temperatures (Cheng and Bradford, Reference Cheng and Bradford1999; Bradford, Reference Bradford2002). However, in the present study, the data of only one of the 15 tested species were the best fit by this distribution at suboptimal temperatures. These results are similar to those that Mesgaran et al. (Reference Mesgaran, Mashhadi, Alizadeh, Hunt, Young, Cousens and Andersson2013) obtained with a hydrothermal time model, in which using the normal distribution resulted in the worst fit and led to biased predictions for three of four species. Thus, the log-normal (or normal) distribution, at least at suboptimal temperatures, is not necessarily the best distribution for thermal time [θT(g)] [or ln (θT(g))] in thermal time models; indeed, it may result in biased predictions. However, the suitability of the log-normal distribution has been taken for granted in thermal time models in most studies (Cheng and Bradford, Reference Cheng and Bradford1999; Bradford, Reference Bradford2002; Hu et al., Reference Hu, Zhou, Li, Wu and Wang2013, Reference Hu, Fan, Baskin, Baskin and Wang2015; Rong et al., Reference Rong, Li and Johnson2015; Daibes and Cardoso, Reference Daibes and Cardoso2018; Ostadian Bidgoly et al., Reference Ostadian Bidgoly, Balouchi, Soltani and Moradi2018; Zhang et al., Reference Zhang, Luo, Chen, Baskin, Baskin, Wang and Hu2020).
The log-logistic distribution (an asymmetrical model) consistently provided the best explanation of θT(g) and germination of all tested species except E. nutans and T. repens. Similar to the pattern observed for the parameter Ψb(g) in hydrothermal time models (Mesgaran et al., Reference Mesgaran, Mashhadi, Alizadeh, Hunt, Young, Cousens and Andersson2013), our results indicate that θT(g) may often be right-skewed. In addition, we found that using symmetrical models (the logistic distributions) resulted in the least precise and least accurate data fits for all species, which further confirm that the distribution of θT(g) is asymmetrical. Notably, the Weibull distribution (a generalized extreme-value model) was satisfactory only for seeds of E. nutans in describing the pattern of θT(g) variation, which was contrary to the results from a study by Watt et al. (Reference Watt, Xu and Bloomberg2010). All these results suggest that, at least at suboptimal temperatures, there will be a large deviation if the parameter distribution is not considered in the thermal time model. However, the standard form (the log-normal distribution) is used only for convenience. Compared with the Gumbel and logistic distributions, the log-logistic distribution is more flexible and can provide a more realistic estimate of θT(0) (Mesgaran et al., Reference Mesgaran, Mashhadi, Alizadeh, Hunt, Young, Cousens and Andersson2013). Therefore, the log-logistic distribution is an appropriate candidate among the five distributions used in this study.
It is worth noting that T b, the minimum temperature, was more than 10°C for L. apetalum seeds when using all five distributions and, thus, was overestimated by all thermal time models, as seed germination was 28% for L. apetalum when incubated at 10°C. One possible reason for the overestimation is that the germination temperature is very close to T b (10 vs 11°C), and a slight temperature fluctuation in the incubator may lead to a relatively high deviation in thermal unit, and consequently germination percentage and model fitting. Zhang et al. (Reference Zhang, Luo, Chen, Baskin, Baskin, Wang and Hu2020) also found a deviation between predicted and observed T b when the germination temperature was close to the T b. Similarly, the logistic distribution overestimated the value of T b for E. dahuricus seeds, which was two or more times greater than the values obtained with the other four distributions. This result further illustrates that the logistic distribution provided the worst fit among the five distributions used in our study. In addition, although the log-normal and Weibull distributions provided the best fit for seeds of T. repens and E. nutans, respectively, other distributions also explained the θT(g) variation of these species very well. These results imply that the appropriate distribution function used to describe the pattern of θT(g) variation in the thermal time model may not be unique for some species; similar results have been found in the study by Mesgaran et al. (Reference Mesgaran, Mashhadi, Alizadeh, Hunt, Young, Cousens and Andersson2013). Moreover, whether the best distribution function differs among species remains to be further studied, since the results based on individual cases (2 species vs 13 species) are not sufficient. In any case, our results suggested that the distribution of parameters [θT(g)] should be considered when using the thermal time model to prevent large deviations.
In conclusion, the assumption of a log-normal distribution, at least in some datasets, is clearly not appropriate and will lead to both a poor description and poor prediction of germination data when used in thermal time models. The log-logistic distribution, a more flexible distribution, can be used in thermal time models to describe the effect of temperature on seed germination. Future work should examine the reliability of our results through more empirical experiments.
Supplementary material
To view supplementary material for this article, please visit: https://doi.org/10.1017/S0960258521000040.
Acknowledgements
We are grateful to Professor Carol Baskin for her critical review and constructive suggestions on this study.
Financial support
This study was supported by the Gansu Provincial Science and Technology Major Projects (19ZD2NA002) and the National Natural Science Fund (31672473 and 31702164).
Conflicts of interest
No conflicts of interest have been declared.


