


INTRODUCTION
Shifts of the Intertropical Convergence Zone (ITCZ), an important forcing agent for Asian summer monsoon (ASM) variability (Webster et al., Reference Webster, Magaña, Palmer, Shukla, Tomas, Yanai and Yasunari1998; Wang et al., Reference Wang, Wang, Cheng, Fasullo, Guo, Kiefer and Liu2014, Reference Wang, Wang, Cheng, Fasullo, Guo, Kiefer and Liu2017; An et al., Reference An, Wu, Li, Sun, Liu, Zhou and Cai2015), are believed to have been highly sensitive to freshwater perturbations in the North Atlantic (Broccoli et al., Reference Broccoli, Dahl and Stouffer2006; Stouffer et al., Reference Stouffer, Yin, Gregory, Dixon, Spelman, Hurlin and Weaver2006). In these modeling studies, the ITCZ is southerly positioned when the Northern Hemisphere cools. In response to the interhemispheric thermal gradient, the ITCZ in the Pacific Ocean was reported to shift southward across a large latitudinal band, i.e., 4° south of its modern position in Heinrich Stadial (HS) 11 (Jacobel et al., Reference Jacobel, MacManus, Anderson and Winckler2016), 5° during the Little Ice Age (Sachs et al., Reference Sachs, Sachse, Smittenberg, Zhang, Battisti and Golubic2009), and about 2.5° to 7° in the last glaciation (Reimi and Marcantonio, Reference Reimi and Marcantonio2016). However, the ITCZ movement in these studies is traced by the rainfall maximum, not by the precipitation centroid (McGee et al., Reference McGee, Moreno-Chamarro, Green, Marshall, Galbraith and Bradtmiller2018), hampering a full understanding of past ITCZ changes and the dynamics involved.
Constraining the ITCZ location as the median latitude of zonally averaged precipitation between 20°N and 20°S (Donohoe et al., Reference Donohoe, Marshall, Ferreira and McGee2013; McGee et al., Reference McGee, Donohoe, Marshall and Ferreira2014) suggests that the ITCZ moves within a narrow latitude range, about 1° to 2° (Donohoe et al., Reference Donohoe, Marshall, Ferreira and McGee2013; McGee et al., Reference McGee, Donohoe, Marshall and Ferreira2014, Reference McGee, Moreno-Chamarro, Green, Marshall, Galbraith and Bradtmiller2018). In addition, a symmetrical expansion/contraction of ITCZ along the equator, rather than a latitudinal migration, has increasingly been proposed (Collins et al., Reference Collins, Schefuß, Heslop, Mulitza, Prange, Zabel and Tjallingii2011; Yan et al., Reference Yan, Wei, Soon, An, Zhou, Liu, Wang and Carter2015; Denniston et al., Reference Denniston, Ummenhofer, Wanamaker, Lachniet, Villarini, Asmerom and Polyak2016). If the expansion/contraction mode dominates, climate changes within the Northern and Southern Hemispheres would be synchronous. When a latitudinal shift happens, contrasting climate conditions (warming/cooling or greater precipitation/drought) would be expected between two hemispheres. Thus, the role of ITCZ in abrupt climate changes (Steffensen et al., Reference Steffensen, Andersen, Bigler, Clausen, Dahl-Jensen, Fischer and Goto-Azuma2008; Thomas et al., Reference Thomas, Wolff, Mulvaney, Johnsen, Steffensen and Arrowsmith2009) should be further evaluated. We present here a high-resolution speleothem-based ASM record during Marine Isotope Stage (MIS) 4 from Wulu Cave, southern China, that we have used to explore in detail ASM variability and its relationship with interhemispheric climate changes.
CAVE SITE, SAMPLE, AND METHODS
Wulu Cave is located at the Yun-Gui Plateau in southern China (26°3′N, 105°5′E, 1440 m asl) (Fig. 1). Modern vegetation at this site is mostly composed of deciduous herbs. The cave is about 800 m long, overlain by 40 m of Triassic limestone bedrock. The regional climate conditions are influenced by the subtropical East Asian and tropical Indian summer monsoons. Annual mean temperature at this site is about 14°C (1981–2015), with a maximum monthly mean value of 20.8°C in July and a minimum of 4.3°C in January. The annual mean precipitation is about 1400 mm, peaking (900 mm) during the summer (June through September), and significantly decreasing (80 mm) in the winter (December to February).
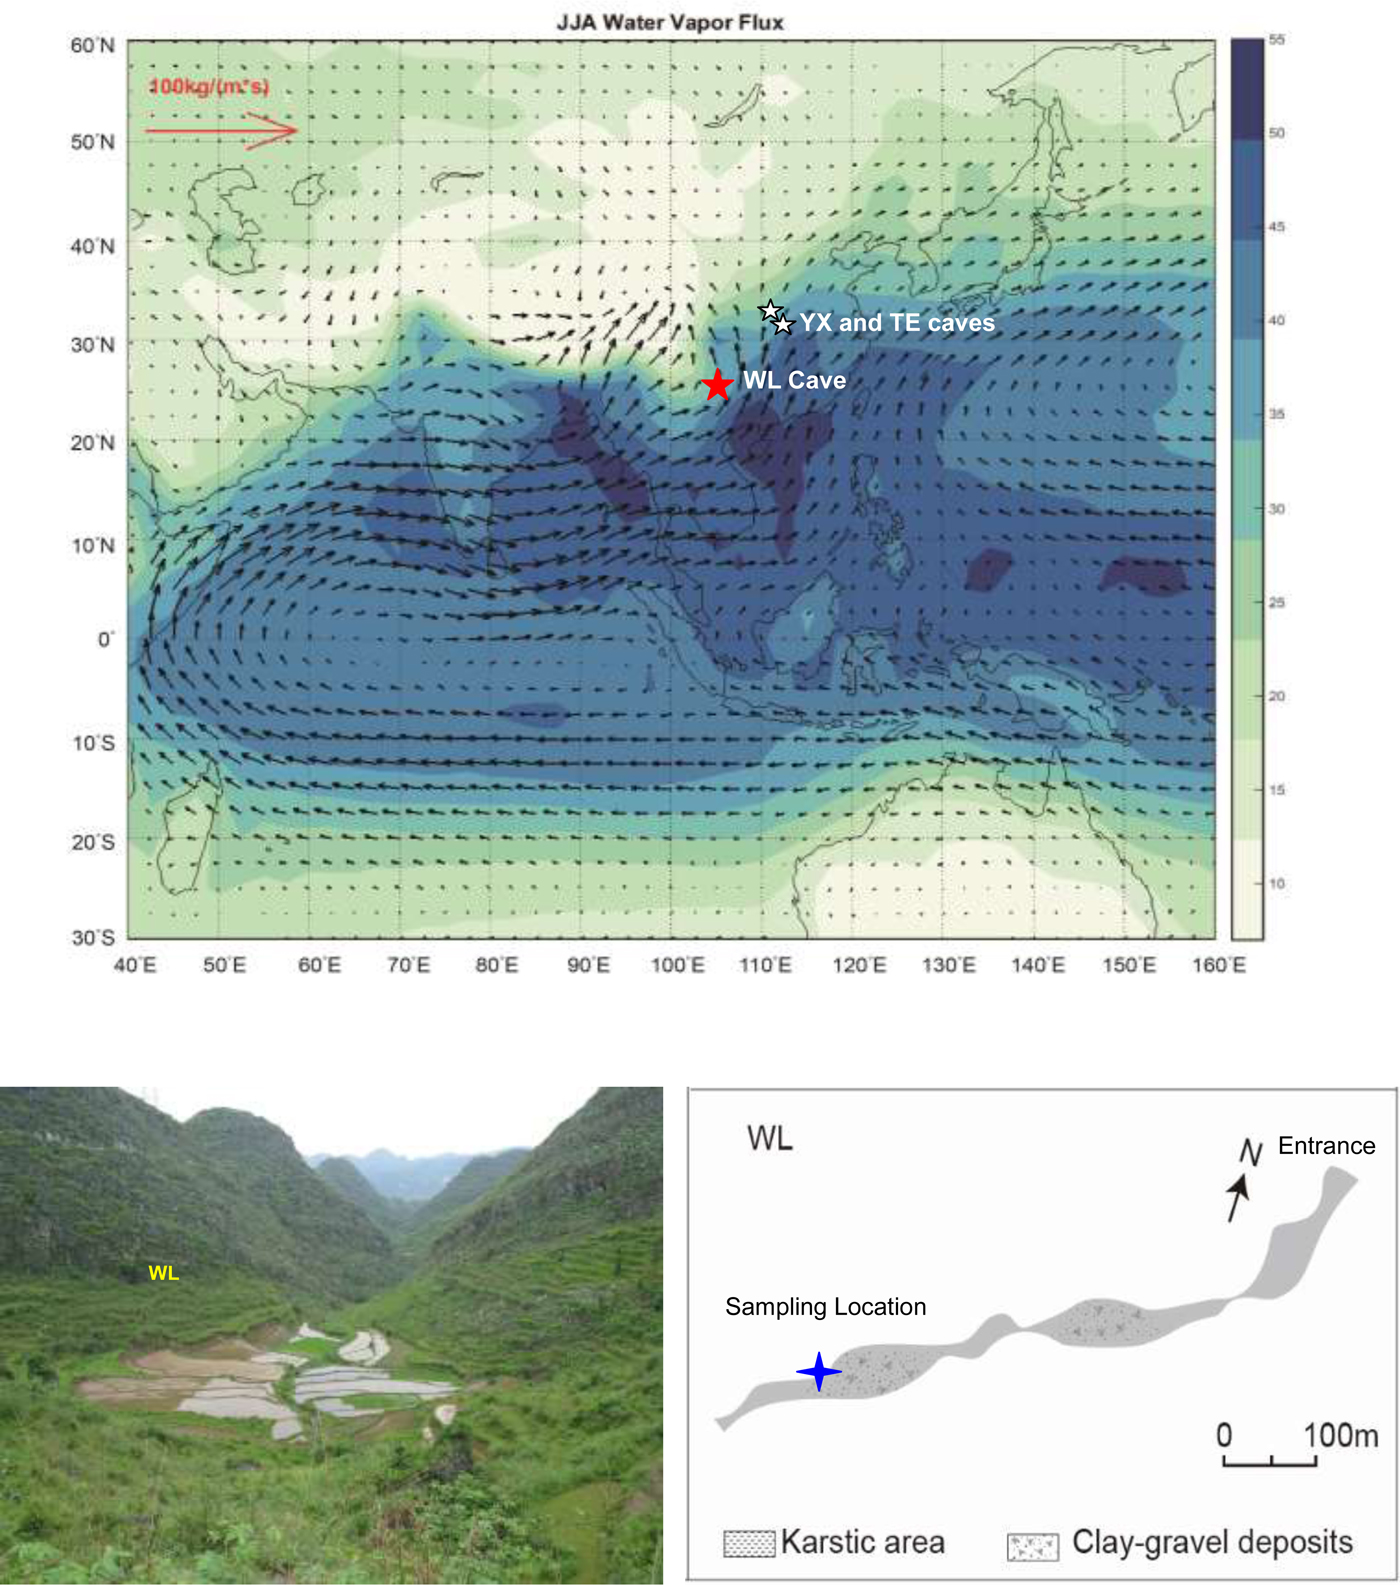
Figure 1. Study locations and the general circulation pattern of the Asian summer monsoon (ASM; June–August) between 1979 and 2016 (NCAR/NCFP, Kalnay et al., Reference Kalnay, Kanamitsu, Kistler, Collins, Deaven, Gandin and Iredell1996). The red star represents Wulu (WL) Cave, and the white stars show Tian'e (TE; Zhang et al., Reference Zhang, Cheng, Spötl, Cai, Sinha, Tan and Yi2018) and Yongxing Caves (YX; Chen et al., Reference Chen, Wang, Cheng, Edwards, Wang, Kong and Liu2016). The arrowed lines show the average circulation field of the ASM at 700 hPa between 1979 and 2016. In the right bottom panel, the cave site and surrounding environments are indicated, with a schematic map of WL and the sampling location (blue star) shown on the left. (For interpretation of the references to color in this figure legend, the reader is referred to the web version of this article.)
Stalagmite Wu87 was collected about 600 m from the cave entrance (Fig. 1). It is 545 mm high, with a candle shape, indicating a relatively stable growth history (Fig. 2A). This stalagmite is composed of translucent calcite. Along the central growth axis, dissolutional erosion of calcite occurs at about 119 and 430 mm (Fig. 2A, green dotted lines, and Fig. 3A, enlarged view). Immediately above 430 mm, large voids can be observed on the polished section, suggesting unsaturated conditions of infiltration waters across these depths. Beneath 50, 80, 172, and 267 mm, the apex of stalagmite diminishes toward the flank, indicating decreased dripwater during these periods (Fig. 2A, pink dashed lines). These lithological interfaces are similar to the type E and L layer-bounding surfaces defined by Railsback et al. (Reference Railsback, Akers, Wang, Holdridge and Voarintsoa2013). As suggested by those authors, the type E surface is caused by abundant undersaturated dripwater and represents dissolutional erosion, while the type L surface is attributed to diminished dripwater and indicates reduced growth.
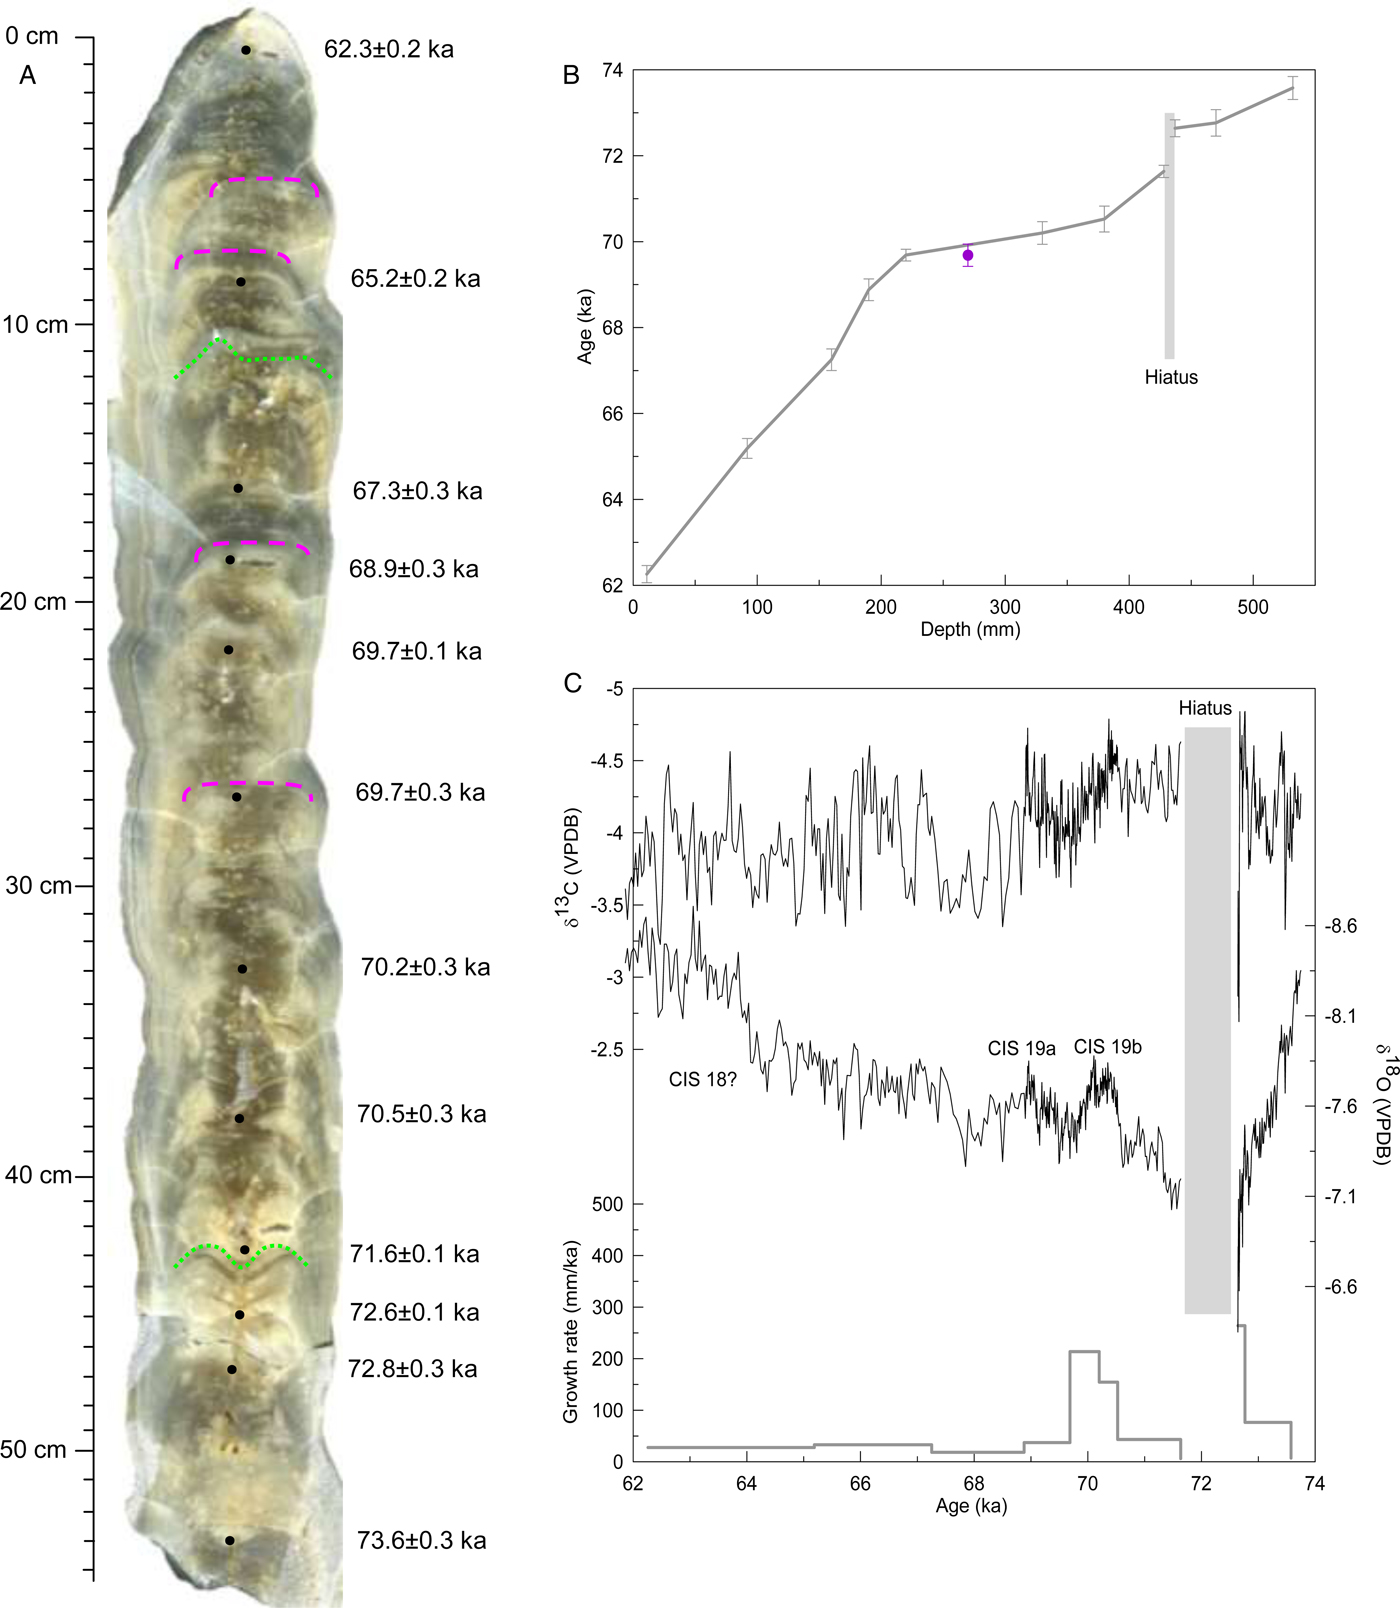
Figure 2. Slabbed section (A), age model (B), isotopic and growth rate records (C) for stalagmite Wu87. On the polished section, black dots, pink dashed lines, and green dotted lines label dating points, lithologic interfaces of dissolutional erosion, and zones of reduced growth, respectively. These surfaces were correspondingly defined as types E and L in Railsback et al. (Reference Railsback, Akers, Wang, Holdridge and Voarintsoa2013). Gray bar in B and C represents the growth hiatus, and the purple dot in B indicates the rejected age. (For interpretation of the references to color in this figure legend, the reader is referred to the web version of this article.)

Figure 3. Evaluation on isotopic signals across the dissolutional erosion section (between 400 and 450 mm). Two additional transects were chosen for isotopic subsample collection on the polished section (A), in which “L” shows the left transect, “R” represents the right, and “M” means the middle. Numbers on the polished section show depths of subsample collection, and arrows indicate observed lithological interfaces. δ18O results are indicated in B (green, left; gray, middle; orange, right), and δ13C results in C. In these panels, dashed lines depict positions of arrows on the middle transect and the equivalent depths on the right and left. This shows that at least 5- to 7-mm-thick calcite had been dissolved. For comparison, the isotopic data points were not truncated according to the growth cessation (between 428 and 436 mm). (For interpretation of the references to color in this figure legend, the reader is referred to the web version of this article.)
Twelve powder subsamples were collected along the growth axis with 0.9-mm-diameter carbide dental burrs for 230Th dating. The measurements were performed on a Neptune multicollector inductively coupled plasma mass spectrometer at the School of Geography, Nanjing Normal University. The chemical procedures used to separate uranium and thorium and the age determinations are similar to those described in Shao et al. (Reference Shao, Pons-Branchu, Zhu, Wang, Valladas and Fontugne2017). Half-life values for 234U and 230Th used in this study are 245,620 ± 260 and 75,584 ± 110 years, respectively (Cheng et al., Reference Cheng, Edwards, Shen, Polyak, Asmerom, Woodhead and Hellstrom2013). Dating results are listed in Table 1, with typical analytical errors (2σ) ranging from 100 to 300 years. For stable isotopic measurements, 545 subsamples were drilled with 0.3-mm-diameter carbide dental burrs. Analyses were performed on an online automated carbonate preparation system (Kiel) linked to a Finnigan MAT-253 mass spectrometer at the School of Geography, Nanjing Normal University. Spatial resolution is 1 mm, equivalent to an average temporal resolution of 20 years, according to our age model. Standards were run every 10 to 15 samples, and duplicates were run every 15 to 20 samples to check for nonlinearity. The results are reported relative to Vienna Pee Dee Belemnite, with standardization determined relative to NBS 19 (+1.95‰ for δ18O and −2.2‰ for δ13C). Precision of δ18O values is 0.06‰ at the 1σ level.
Table 1. 230Th dating results of sample Wu87 from Wulu Cave, southern China. Errors are 2σ analytical errors. Decay constant values are λ230 = 9.1577 × 10⁻⁶ yr−1; λ234 = 2.8263 × 10⁻⁶ yr−1; λ238 = 1.55125 × 10⁻¹⁰ yr−1. Corrected 230Th ages assume an initial 230Th/232Th atomic ratio of (4.4 ± 2.2) × 10−6. Corrected 230Th ages are indicated in bold and presented in thousand years before present (ka).

RESULTS
Chronology
Twelve 230Th dates reveal that sample Wu87 grew during the MIS 4, spanning 73.6 ± 0.3 to 62.3 ± 0.2 ka (Table 1). The ages for isotopic data were established with linear interpolation between adjacent dates. Two dates at 428 and 437 mm (71.6 ± 0.1 ka; 72.6 ± 0.1 ka) bracketing the dissolutional interface (between 429 and 436 mm) suggest a growth cessation of about 1000 years at this depth (Fig. 2A, green dotted line). In addition, the dating result at 270 mm (69.7 ± 0.3 ka) (Fig. 2B, purple dot) is very similar to that at 220 mm (69.7 ± 0.1 ka) (Table 1), which was rejected in establishing the age–depth relationship. The final chronology estimates a decreased growth rate in the upper 200 mm of sample Wu87 (Fig. 2B and C). Across this depth, the stalagmite is mostly composed of compact calcite, and three surfaces of reduced growth can be observed (Fig. 2A), suggesting the reliability of our age model.
Isotopic records
Over the growth period, Wu87 δ18O values vary from −7‰ to −8.5‰ (Fig. 2C). Two 18O-depleted events centering at about 70.3 and 68.9 ka (Fig. 2C) are temporally in line with Chinese Interstadials (CIS) 19b and 19a (Cheng et al., Reference Cheng, Edwards, Wang, Kong, Ming, Kelly, Wang, Gallup and Liu2006). Subsequently, δ18O values gradually decrease from −7.2‰ to −8‰ during Chinese Stadial (CS) 19 (blue bar in Fig. 4), followed by a sharp jump to −8.5‰ at about 64 ka (Fig. 2C). This 18O-depleted event surrounding 63 ka probably corresponds to CIS 18. Comparatively, shifts of δ13C fall within a narrow range (from −3.5‰ to −4.5‰). Moreover, the δ13C record is characterized by centennial-scale variability throughout MIS 4, showing a more obscure imprint of millennial-scale changes than the δ18O signal. Between 71 and 68.5 ka, CIS 19b and CIS 19a in the δ18O record also appear to be expressed in the δ13C record. However, the long-term δ18O depletion between 68 and 64 ka and CIS 18 are not expressed in the δ13C record.

Figure 4. Comparison of original and detrended isotopic records from sample Wu87 (upper panel) and cross-wavelet analysis between detrended δ18O and δ13C records (lower panel). The detrended isotopic data were obtained using the software package ChangePoint (Killick et al., Reference Killick, Fearnhead and Eckley2012). In the upper panel, the green bar indicates the period of muted Asian summer monsoon (ASM) variability during CIS 19, and the blue bar indicates the CS 19 interval. During CIS 19, centennial-scale ASM changes were absent in the wavelet analysis (lower panel). (For interpretation of the references to color in this figure legend, the reader is referred to the web version of this article.)
Growth rate of Wu87 was relatively stable in MIS 4, except during CIS 19b and before 72.6 ka (Fig. 2C, gray line). At about 70.5 ka, a sharp increase in the growth rate postdated the onset of CIS 19b, and an abrupt decrease at 69.7 ka led the end of CIS 19a. This relationship suggests that the growth rate has negligible impact on Wu87 δ18O variability. In Figure 2C, maximum δ18O values occur between 73 and 71 ka. At about 72.7 ka, δ18O and δ13C values rapidly increase to −6.3‰ and −2.7‰, respectively (Fig. 2C, gray bar). This change corresponds to the dissolutional depth spanning 429 to 436 mm (Fig. 2A). Isotopic analyses along three transects show that the results in the center deviate from those at the flank by 5 to 7 mm on average (Fig. 3). Some minor discrepancies between them are likely attributed to less precise subsample collection along a single growth layer. Hence, it is probably that at least 5- to 7-mm-thick calcite was dissolved on the central growth axis.
DISCUSSION
Environmental interpretation of isotopic records
Changes in speleothem δ18O are mainly dictated by the isotopic composition of meteoric precipitation. Along the moisture trajectory, the precipitation δ18O signal is further modulated by various processes, including the source effect, altitude and latitude effects, rainfall amount, surface and in-cave temperature changes, and water–rock interactions (McDermott, Reference McDermott2004; Fairchild et al., Reference Fairchild, Smith, Baker, Fuller, Spötl, Mattey and McDermott2006; Lachniet, Reference Lachniet2009). At the millennial scale, it has been suggested that speleothem δ18O records from the ASM area, especially from southeastern China, reflect local rainfall amounts (Cai et al., Reference Cai, Fung, Edwards, An, Cheng, Lee and Tan2015), precipitation seasonality (Wang et al., Reference Wang, Cheng, Edwards, An, Wu, Shen and Dorale2001; Zhang et al., Reference Zhang, Cheng, Spötl, Cai, Sinha, Tan and Yi2018), or ASM intensity (Cheng et al., Reference Cheng, Edwards, Wang, Kong, Ming, Kelly, Wang, Gallup and Liu2006; Wang et al., Reference Wang, Cheng, Edwards, Kong, Shao, Chen, Wu, Jiang, Wang and An2008). The rainfall amount assumption, however, is believed to be inconsistent with other precipitation proxies from loess/paleosol magnetic properties (Maher, Reference Maher2008). It is most likely that changes in the upstream circulation regime are more important (Pausata et al., Reference Pausata, Battisti, Nisancioglu and Bitz2011; Cheng et al., Reference Cheng, Sinha, Wang, Cruz and Edwards2012; Maher and Thompson, Reference Maher and Thompson2012;Tan, Reference Tan2014). Consequently, a strong southeasterly flow developing over the upstream region likely induces a strong ASM (with 18O-depleted moisture). At our study site, where the summer rainfall (June through September) contributes 64% (on average) to the annual mean, it is likely that summer moisture and its isotopic composition are most important. Following this reasoning, we interpret our speleothem δ18O signal as an indicator of average ASM intensity, with minimum values corresponding to a strong ASM. This explanation does not imply a reflection of rainfall amount or rainfall seasonality, but rather of changes in the average intensity of circulation regime, which transfers 18O-bearing moisture from tropical oceans to the Asian continent and results in the widely observed replication in spatially separated cave records (Cheng et al., Reference Cheng, Sinha, Wang, Cruz and Edwards2012; Maher and Thompson, Reference Maher and Thompson2012; Tan, Reference Tan2014).
Carbon isotopes (δ13C) in speleothems are primarily (60%–90%) derived from soil CO2 by plant respiration and microbial decomposition (Genty et al., Reference Genty, Blamart, Ouahdi, Gilmour, Baker, Jouzel and Van-Exter2003; Meyer et al., Reference Meyer, Feng, Breecker, Banner and Guifoyle2014). At the Wulu site, the modern vegetation type above the cave is mainly composed of deciduous herbs. Our previous work on speleothem records from the same cave revealed a consistent coupling of centennial-scale changes in δ18O and δ13C (Liu et al., Reference Liu, Wang, Cheng, Edwards, Kong and Li2016). This suggests that the soil moisture is important for δ13C variability at the centennial scale and is further supported by a recent study on δ13C values of dissolved inorganic carbon in cave dripwater in southern China (Li and Li, Reference Li and Li2018). At 72.7 ka (before the hiatus), sharp enrichments in both isotopic values (Fig. 2C) are likely a response to water deficiency at this time.
Muted ASM variability during interstadials in contrast to stadial instabilities
In Figure 4A and C, changes of Wu87 δ18O and δ13C during CIS 19 are characterized by weaker fluctuations (less than 0.3‰ and 0.5‰, respectively) than those in stadials. To further explore the structure of these minor oscillations, millennial-scale variability was removed using the software package ChangePoint (Killick et al., Reference Killick, Fearnhead and Eckley2012). Two detrended sequences (δ18Od, δ13Cd) reveal similar variations on a centennial time scale (r = 0.51, P < 0.01), especially during isotopic enrichment events (Fig. 4B, green bar). At the decadal scale, however, significant divergence can be observed. During stadials surrounding CIS 19, variations in δ18Od and δ13Cd are about 0.4‰ and 0.8‰, respectively, almost double the changes in CIS 19. Cross-wavelet analysis between δ18Od and δ13Cd records reveals that millennial to centennial variability is almost absent between 71.2 and 68.8 ka (Fig. 4, lower panel), supporting our visual observations.
During (peak) interstadials, weak ASM variability appears as a pervasive phenomenon in Asian speleothem records (Fig. 5) (Liu et al., Reference Liu, Wang, Cheng, Edwards, Kong, Wang and Hardt2010, Reference Liu, Wang, Cheng, Edwards, Kong and Li2016; Cui et al., Reference Cui, Wang, Cheng, Zhao and Kong2012; Zhang et al., Reference Zhang, Liu, Liu, Kong and Fang2019). In these cave records, δ18Od records are characterized by minor (less than 0.3‰ in amplitude) and high-frequency (centennial to decadal) variability during CIS 5.1 (Fig. 5B) (Liu et al., Reference Liu, Wang, Cheng, Edwards, Kong and Li2016), CIS 16 (Fig. 5C) (Liu et al., Reference Liu, Wang, Cheng, Edwards, Kong, Wang and Hardt2010), and CIS 19 (Fig. 5D) (Zhang et al., Reference Zhang, Liu, Liu, Kong and Fang2019). Similarly, such muted variability is also reflected in coeval δ13Cd records. During the stadials, changes in the δ18Od and δ13Cd records increase in amplitude and decrease in frequency. Cross-wavelet analysis between these δ18Od and δ13Cd sequences supports weak variability during interstadials (Supplementary Fig. 1). This suggests that limited perturbations were introduced into the ASM system and regional environments during peak interstadials. At the Medieval Warm Period (MWP)/Little Ice Age (LIA) boundary, however, a prominent change is reflected in the frequency domain of the two isotopic data sets, but not in the amplitude (Fig. 5A) (Cui et al., Reference Cui, Wang, Cheng, Zhao and Kong2012). Especially during the MWP, large oscillations are evident in the δ13C record as compared with the LIA. An increase of summer precipitation during the LIA caused by the Mei-Yu front was proposed by Cui et al. (Reference Cui, Wang, Cheng, Zhao and Kong2012). This effect of excess humidity in the LIA probably did not favor the dissolution of 13C-depleted soil CO2 in the infiltration water and led to elevated speleothem δ13C values (Bar-Matthews et al., Reference Bar-Matthews, Ayalon and Kaufman2000; Plagnes et al., Reference Plagnes, Causse, Genty, Paterne and Blamart2002).
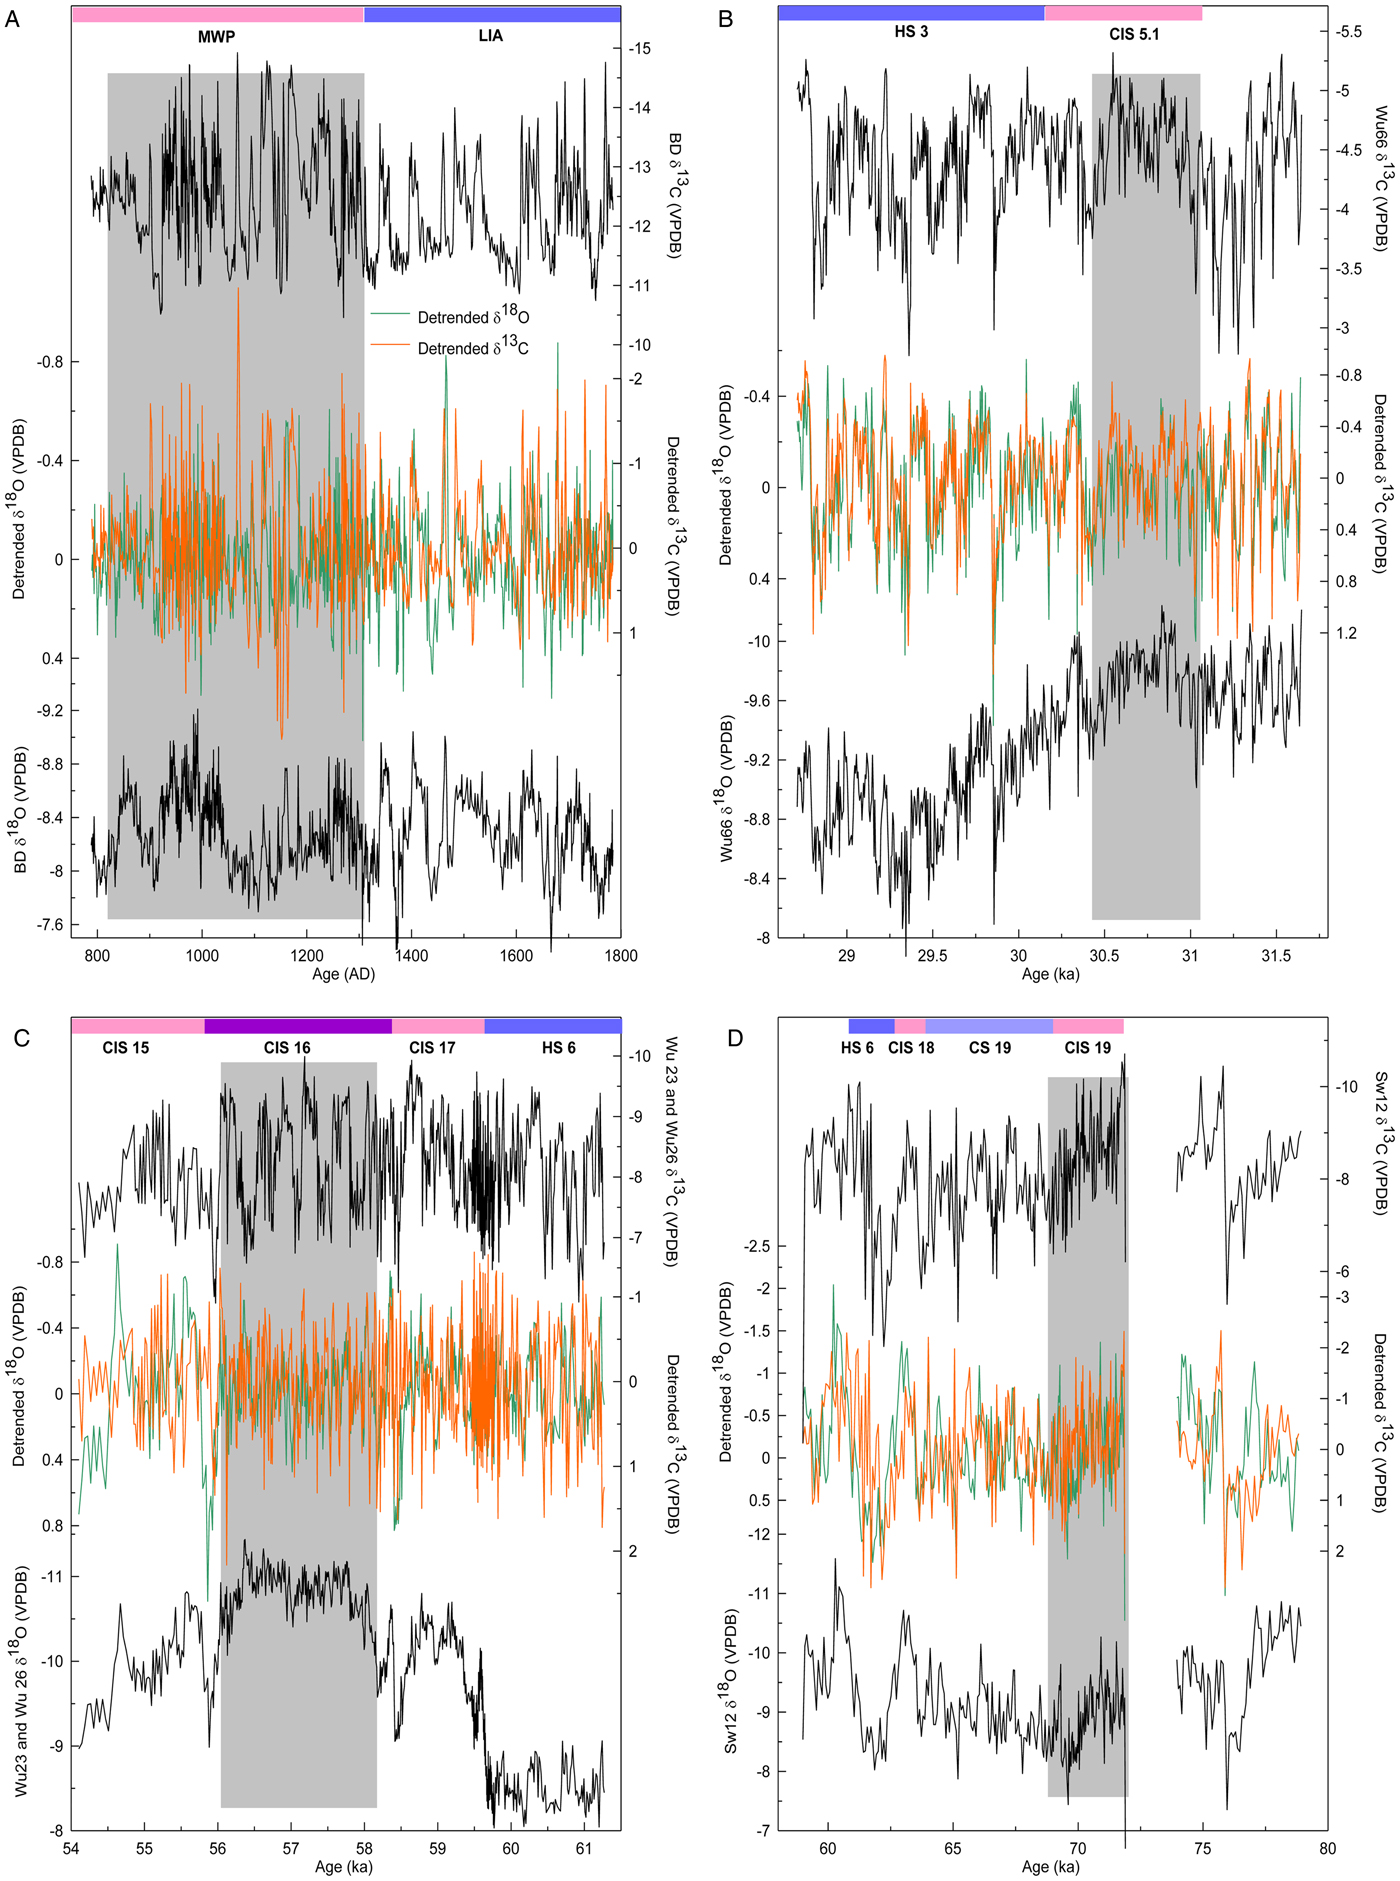
Figure 5. Correlation of intrainterstadial and intrastadial Asian summer monsoon (ASM) changes. Speleothem records from Heilong Cave, central China (A) (Cui et al., Reference Cui, Wang, Cheng, Zhao and Kong2012), Wulu Cave, southern China (B, C) (Liu et al., Reference Liu, Wang, Cheng, Edwards, Kong, Wang and Hardt2010; Reference Liu, Wang, Cheng, Edwards, Kong and Li2016), and Tian'e Cave, central China (D) (Zhang et al., Reference Zhang, Liu, Liu, Kong and Fang2019). Gray bars in these panels indicate interstadial or peak interstadial conditions, with interstadials/stadials labeled at the top. Detrended δ18O (green line) and δ13C (orange line) records are shown in the middle of each panel. CIS, Chinese Interstadial; CS, Chinese Stadial; HS, Heinrich Stadial; MWP, Medieval Warm Period; LIA, Little Ice Age. (For interpretation of the references to color in this figure legend, the reader is referred to the web version of this article.)
Stable interstadial climate conditions have been identified in North Atlantic sediment records (Vautravers et al., Reference Vautravers, Shackleton, Lopez-Martinez and Grimalt2004; Goñi et al., Reference Goñi, Landais, Cacho, Duprat and Rossignol2009) and paleolake records from western Europe (Ampel et al., Reference Ampel, Bigler, Wohlfarth, Risberg, Lotter and Veres2010). Typically, summer-related indicators in these studies exhibit a pattern similar to the ASM variability observed in our study These observations possibly shed some light on climate variability in the context of current global warming. In the last millennium, severe drought events seldom occurred during warming episodes (Zhang, Reference Zhang2005; Hou et al., Reference Hou, Yang and Feng2008), which is partly consistent with our results for interstadial conditions. Under the current warming, if the increased melting of the Greenland and Antarctic Ice Sheets (Bjørk et al., Reference Bjørk, Kjær, Korsgaard, Khan, Kjeldsen, Andresen, Box, Larsen and Funder2012; Shen et al., Reference Shen, Wang, Shum, Jiang, Hsu and Dong2018) induces a reduction of the Atlantic meridional overturning circulation (AMOC) (Mikolajewicz et al., Reference Mikolajewicz, Gröger, Maier-Reimer, Schurgers, Vizcáno and Winguth2007), a stadial-like climate and significant climate extremes are likely.
Detailed correlation of high- and low-latitude climates in MIS 4
In the last glaciation, abrupt reduction in the ASM intensity at the millennial scale was thought to be in line with Greenland temperature variability (Wang et al., Reference Wang, Cheng, Edwards, An, Wu, Shen and Dorale2001), possibly via the westerly winds (Porter and An, Reference Porter and An1995). Increasing evidence, however, shows that significant discrepancies can be observed between high- and low-latitude climate records. First, relatively gradual speleothem-based ASM variability was found during the late MIS 4 (Zhang et al., Reference Zhang, Li, Cheng, Edwards, Shen, Spötl, Li, Han, Li, Huang and Zhao2017), at the onset of CIS 12 (Cai et al., Reference Cai, An, Cheng, Edwards, Kelly, Liu, Wang and Shen2006), during the Bølling interstadial (Wang et al., Reference Wang, Cheng, Edwards, An, Wu, Shen and Dorale2001), and during the Younger Dryas (Liu et al., Reference Liu, Wang, Cheng, Edwards, Kong, Wang, Wu and Chen2008). During these periods, the rise/fall of ASM intensity was frequently accomplished in a longer time compared with Greenland temperature variability. Second, a decoupling of the ASM and Greenland temperature variability is clear during HSs (Zhang et al., Reference Zhang, Griffiths, Huang, Cai, Wang, Zhang, Cheng, Ning, Hu and Xie2016; Liu et al., Reference Liu, Wang, Cheng, Edwards, Kong, Chen and Liu2018), when the ASM is highly unstable. This suggests that the speleothem δ18O signal from the Asian continent exhibits an appreciably regional feature, which is not exclusive to cave records, as ASM-type changes are widely reflected in various marine and terrestrial records (Vautravers et al., Reference Vautravers, Shackleton, Lopez-Martinez and Grimalt2004; Schmidt et al., Reference Schmidt, Vautravers and Spero2006; Goñi et al., Reference Goñi, Landais, Fletcher, Naughton, Desprat and Duprat2008).
During MIS 4, double peaks in CIS 19 (19a and 19b) and a rapid depletion of 0.8‰ in δ18O values at 63 ka (likely corresponding to CIS 18) in the Wu87 record (Fig. 6A) agree well, within dating uncertainties, with other cave records from China (Fig. 6B and C) (Chen et al., Reference Chen, Wang, Cheng, Edwards, Wang, Kong and Liu2016; Zhang et al., Reference Zhang, Liu, Liu, Kong and Fang2019). These millennial-scale ASM oscillations, including subcycles, are also mirrored in North Greenland Ice Core Project (NGRIP) ice-core Ca2+ and δ18O (Fig. 6D and E) (Rasmussen et al., Reference Rasmussen, Bigler, Blockley, Blunier, Buchardt, Clausen and Cvijanovic2014) and δ15N-inferred temperature records (Fig. 6F) (Kindler et al., Reference Kindler, Guillevic, Baumgartner, Schwander, Landais and Leuenberger2014). Among these events, the short-lived cold/aridity episode between CIS 19a and CIS 19b (Fig. 6A–F, dotted lines) corresponds to a weak Antarctic warming (Fig. 6I) (Veres et al., Reference Veres, Bazin, Landais, Kele, Lemieux-Dudon, Parrenin and Martinerie2013). Additionally, CIS 18 in speleothem records and its equivalents in Greenland ice-core records (Fig. 6, dotted line) register as a notable cooling in West Antarctica (Fig. 6H) (WAIS Divide Project Members, 2015), although they are weakly expressed at the EDML ice core (Fig. 6I) (Veres et al., Reference Veres, Bazin, Landais, Kele, Lemieux-Dudon, Parrenin and Martinerie2013). This relationship supports a conception of interhemispheric climate changes as a bipolar seesaw (Broecker, Reference Broecker1998; Blunier and Brook, Reference Blunier and Brook2001).
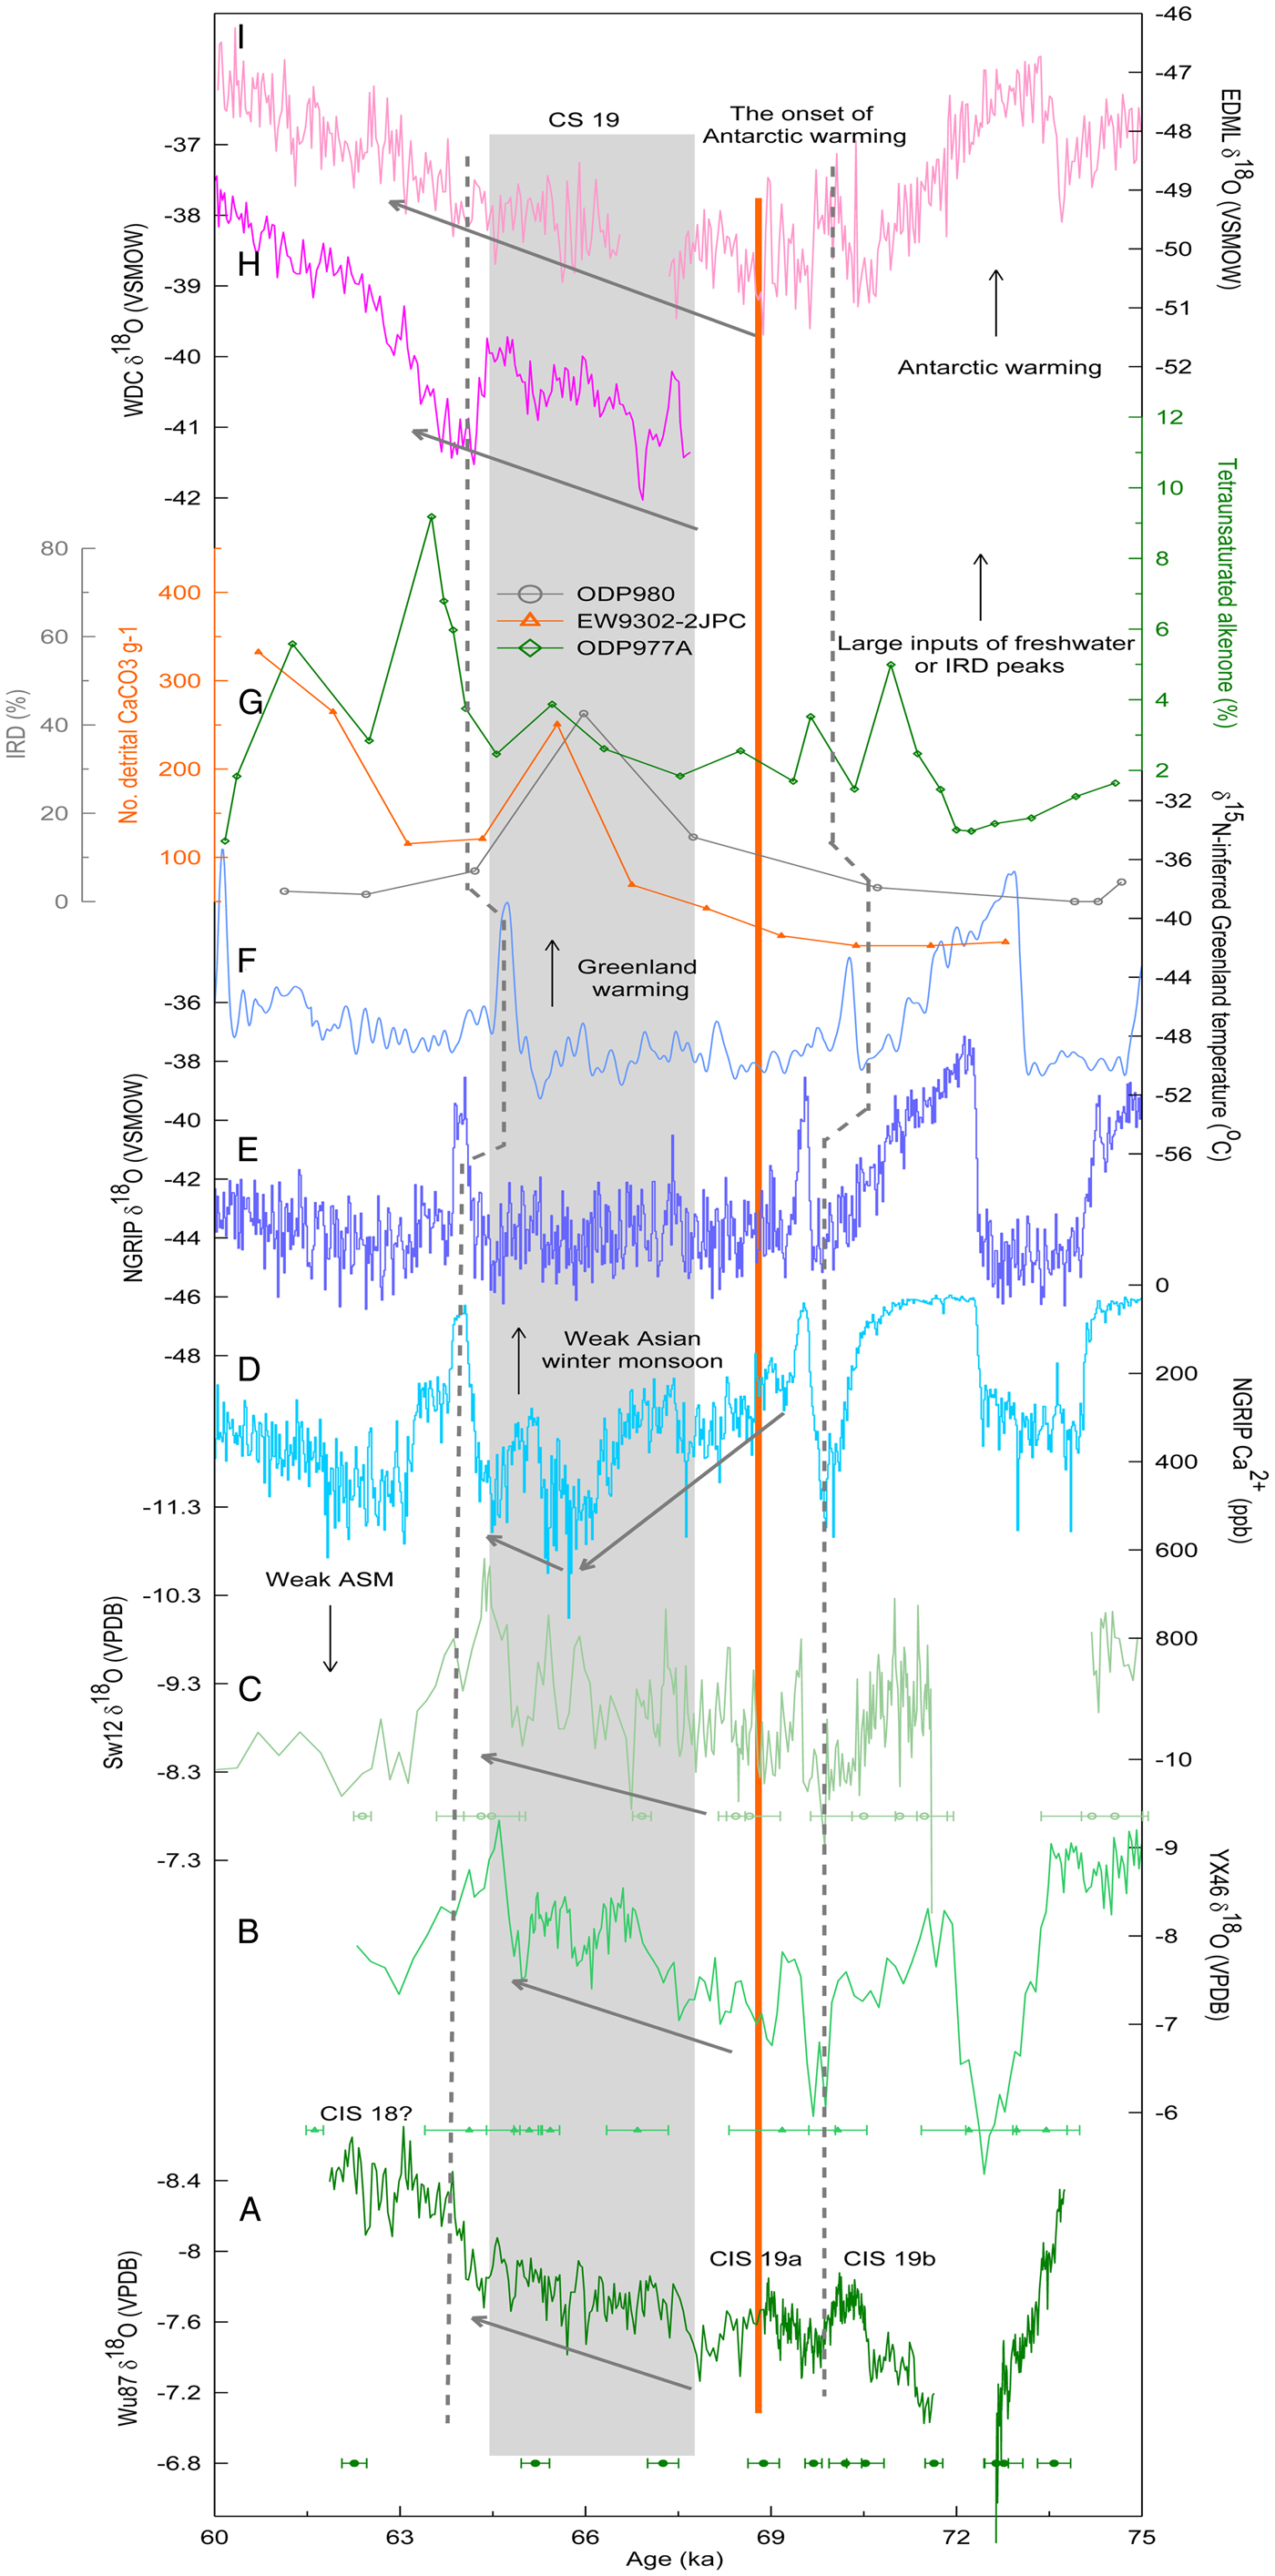
Figure 6. Climate events surrounding MIS 4. δ18O records from Wulu (A) (this study), Yongxing (B; Chen et al., Reference Chen, Wang, Cheng, Edwards, Wang, Kong and Liu2016), and Tian'e Caves (C; Zhang et al., Reference Zhang, Liu, Liu, Kong and Fang2019); Greenland ice-core Ca2+, δ18O (D, E; Rasmussen et al., Reference Rasmussen, Bigler, Blockley, Blunier, Buchardt, Clausen and Cvijanovic2014) and δ15N records (F; Kindler et al., Reference Kindler, Guillevic, Baumgartner, Schwander, Landais and Leuenberger2014); (G) Ice-rafted debris (IRD) is plotted as the number of detrital sediment grains (lithics) from core ODP980 (55°29′N, 14°42′W, depth of 2179 m) (gray line; McManus et al., Reference McManus, Oppo and Cullen1999) and ice-rafted detrital CaCO3 grains g−1 from core EW9302-2JPC (48°47.70′N, 45°05.09′W, depth of 1251 m), North Atlantic (pink line; Marcott et al., Reference Marcott, Clark, Padman, Klinkhammer, Springer, Liu and Otto-Bliesner2011); tetraunsaturated alkenone record from core ODP977A, western Mediterranean (36°1.907′N, 1°57.319′W, depth of 1984 m) is a tracer for low-salinity water masses (green line; Martrat et al., Reference Martrat, Grimalt, Lopez-Martinez, Cacho, Sierro, Flores, Zahn, Canals, Curtis and Hodell2004); and Antarctic δ18O records from the WDC (H; WAIS Divide Project Members, 2015) and EDML ice cores (I; Veres et al., Reference Veres, Bazin, Landais, Kele, Lemieux-Dudon, Parrenin and Martinerie2013). The dotted lines show the correlation of interhemispheric climate changes during Interstadial 18 and the stadial between Interstadials 19a and 19b, respectively. The orange bar denotes the initiation of Antarctic warming during MIS 4, and the gray bar indicates Stadial 19 (early MIS 4). Substages of Asian summer monsoon (ASM) variability are also shown at the bottom. (For interpretation of the references to color in this figure legend, the reader is referred to the web version of this article.)
Regardless of this tight interhemispheric climate link, Greenland temperatures remained in a stable cold state during Stadial 19 (Fig. 6E and F, gray bar), a climate condition similar to that during late MIS 4. At Antarctica, a rise of surface temperature initiated at about 68.9 ka (Fig. 6I, orange line), immediately after the end of Interstadial 19a. This Antarctic warming persisted throughout MIS 4 and accelerated appreciably after Interstadial 18 (Fig. 6H and I). Similarly, a gradual ASM intensification is exceptionally clear in early MIS 4 (Fig. 6B and C, gray bar), especially in our newly retrieved Wu87 record (Fig. 6A). In these speleothem records, the ASM intensity during CS 19 appears stronger on average, or is at least not weaker than during CIS 19. This pattern of ASM variability generally follows Antarctic temperature changes, but is decoupled from Greenland temperatures. Consequently, these observations show that the climate of the Southern Hemisphere and the ASM were intimately related during early MIS 4.
A southern and northern imprint on the ASM variability
The idea of an AMOC impact on the interhemispheric climate link appears valid during the interstadials, as shown in Figure 6, where an antiphase relationship is evident. In this regard, the northern displacement of the ITCZ during southern stadials (Broccoli et al., Reference Broccoli, Dahl and Stouffer2006; Stouffer et al., Reference Stouffer, Yin, Gregory, Dixon, Spelman, Hurlin and Weaver2006) that accompanies a strong AMOC can induce a strong ASM and more precipitation in southern China (Wang et al., Reference Wang, Auler, Edwards, Cheng, Ito and Solheid2006). Thus, a more stable ASM during CIS, as derived from our speleothem records (Fig. 5), likely points to an average northerly positioned ITCZ. In contrast, in northern stadials, the frequent intrusion of a northern high-pressure system, including a southerly positioned ITCZ, could have reduced ASM intensity and triggered ASM instabilities (Webster et al., Reference Webster, Magaña, Palmer, Shukla, Tomas, Yanai and Yasunari1998; Wang et al., Reference Wang, Wang, Cheng, Fasullo, Guo, Kiefer and Liu2014, Reference Wang, Wang, Cheng, Fasullo, Guo, Kiefer and Liu2017; An et al., Reference An, Wu, Li, Sun, Liu, Zhou and Cai2015) when the AMOC was weak and frigid cold returned to the northern high latitudes.
During MIS 4, peaks of ice-rafted debris (IRD) from limited-resolution oceanic sediment records suggest catastrophic iceberg and freshwater discharges into the North Atlantic occurred at about 66 ka (Fig. 6G, gray and orange lines) (McManus et al., Reference McManus, Oppo and Cullen1999; Marcott et al., Reference Marcott, Clark, Padman, Klinkhammer, Springer, Liu and Otto-Bliesner2011). Additionally, a high-resolution alkenone record from core ODP977A indicates that a large volume of low-salinity water masses intruded into the western Mediterranean at about 64 ka (Fig. 6G, green line) (Martrat et al., Reference Martrat, Grimalt, Lopez-Martinez, Cacho, Sierro, Flores, Zahn, Canals, Curtis and Hodell2004). Taking the dating uncertainties of these oceanic sediment records into consideration,, these lines of evidence show that a significant AMOC reduction most likely occurred in late MIS 4 (HS 6), as summarized in Hemming (Reference Hemming2004). Accordingly, Greenland temperature (Fig. 6E and F) (Kindler et al., Reference Kindler, Guillevic, Baumgartner, Schwander, Landais and Leuenberger2014; Rasmussen et al., Reference Rasmussen, Bigler, Blockley, Blunier, Buchardt, Clausen and Cvijanovic2014) and ASM intensity declined significantly after Interstadial 18 (Fig. 6C, arrowed line) (Chen et al., Reference Chen, Wang, Cheng, Edwards, Wang, Kong and Liu2016; Zhang et al., Reference Zhang, Liu, Liu, Kong and Fang2019). In response to the interhemispheric thermal gradient caused by freshwater perturbations, a southerly positioned ITCZ and an accelerated Antarctic warming would be expected (Fig. 6H and I) (Veres et al., Reference Veres, Bazin, Landais, Kele, Lemieux-Dudon, Parrenin and Martinerie2013; WAIS Divide Project Members, 2015).
Nevertheless, this idea of latitudinal shifts in the ITCZ (in a scenario of freshwater impact) lacks validity regarding synchronous increase in the ASM intensity and Antarctic temperature in early MIS 4 (CS 19) (Fig. 6), because IRD peaks for that time period were insignificant (Fig. 6G). One possibility for the coupling of ASM and Antarctic temperature is an expansion of the ITCZ (Collins et al., Reference Collins, Schefuß, Heslop, Mulitza, Prange, Zabel and Tjallingii2011; Yan et al., Reference Yan, Wei, Soon, An, Zhou, Liu, Wang and Carter2015; Denniston et al., Reference Denniston, Ummenhofer, Wanamaker, Lachniet, Villarini, Asmerom and Polyak2016). In early MIS 4, the Mg/Ca-based summertime sea-surface temperatures (SSTs), reconstructed from Globigerinoides ruber records from the western tropical Pacific (6.3°N, 125.83°E), were relatively stable (generally above 28°C) (Stott et al., Reference Stott, Poulsen, Lund and Thunell2002). This implies that thermal conditions in the Indo-Pacific Warm Pool (IPWP) were favorable for ITCZ expansion at this time, as a rise in SST to 27.5°C is required for initiation of deep convection (Graham and Barnett, Reference Graham and Barnett1987). ITCZ position is sensitive to slight shifts in the atmospheric energy balance. Currently, the hemispherically asymmetric contrast of mid-tropospheric temperatures is less than 3 Kelvin in the zonal mean between 20°N and 20°S (Schneider et al., Reference Schneider, Bischoff and Haug2014). It is believed that a gradient of 1 Kelvin between high- and low-latitude SSTs could trigger the displacement of the ITCZ (Hastenrath and Heller, Reference Hastenrath and Heller1977). Moreover, other sediment records have shown that the tropical Pacific SST in early MIS 4 reached its average modern value (22°C to 29°C), with centennial-scale changes falling within the seasonal range of 2°C (Fig. 7C) (Rosenthal et al., Reference Rosenthal, Oppo and Linsley2003; Lea et al., Reference Lea, Pak and Spero2000, Reference Lea, Pak, Belanger, Spero, Hall and Shackleton2006). A significant warming of about 2°C was also registered at the midlatitudes of the southern Pacific (Fig. 7B) (Pahnke and Sachs, Reference Pahnke and Sachs2006; Tachikawa et al., Reference Tachikawa, Vidal, Sonzogni and Bard2009) and the South China Sea (Fig. 7D) (Oppo and Sun, Reference Oppo and Sun2005). This SST variability is in line with the gradual increase in ASM intensity in our speleothem record (Fig. 7A). Consequently, the concurrent increase in ASM intensity and Antarctic temperature (Fig. 6, orange line) should reflect an expansion of ITCZ when freshwater discharges ceased.
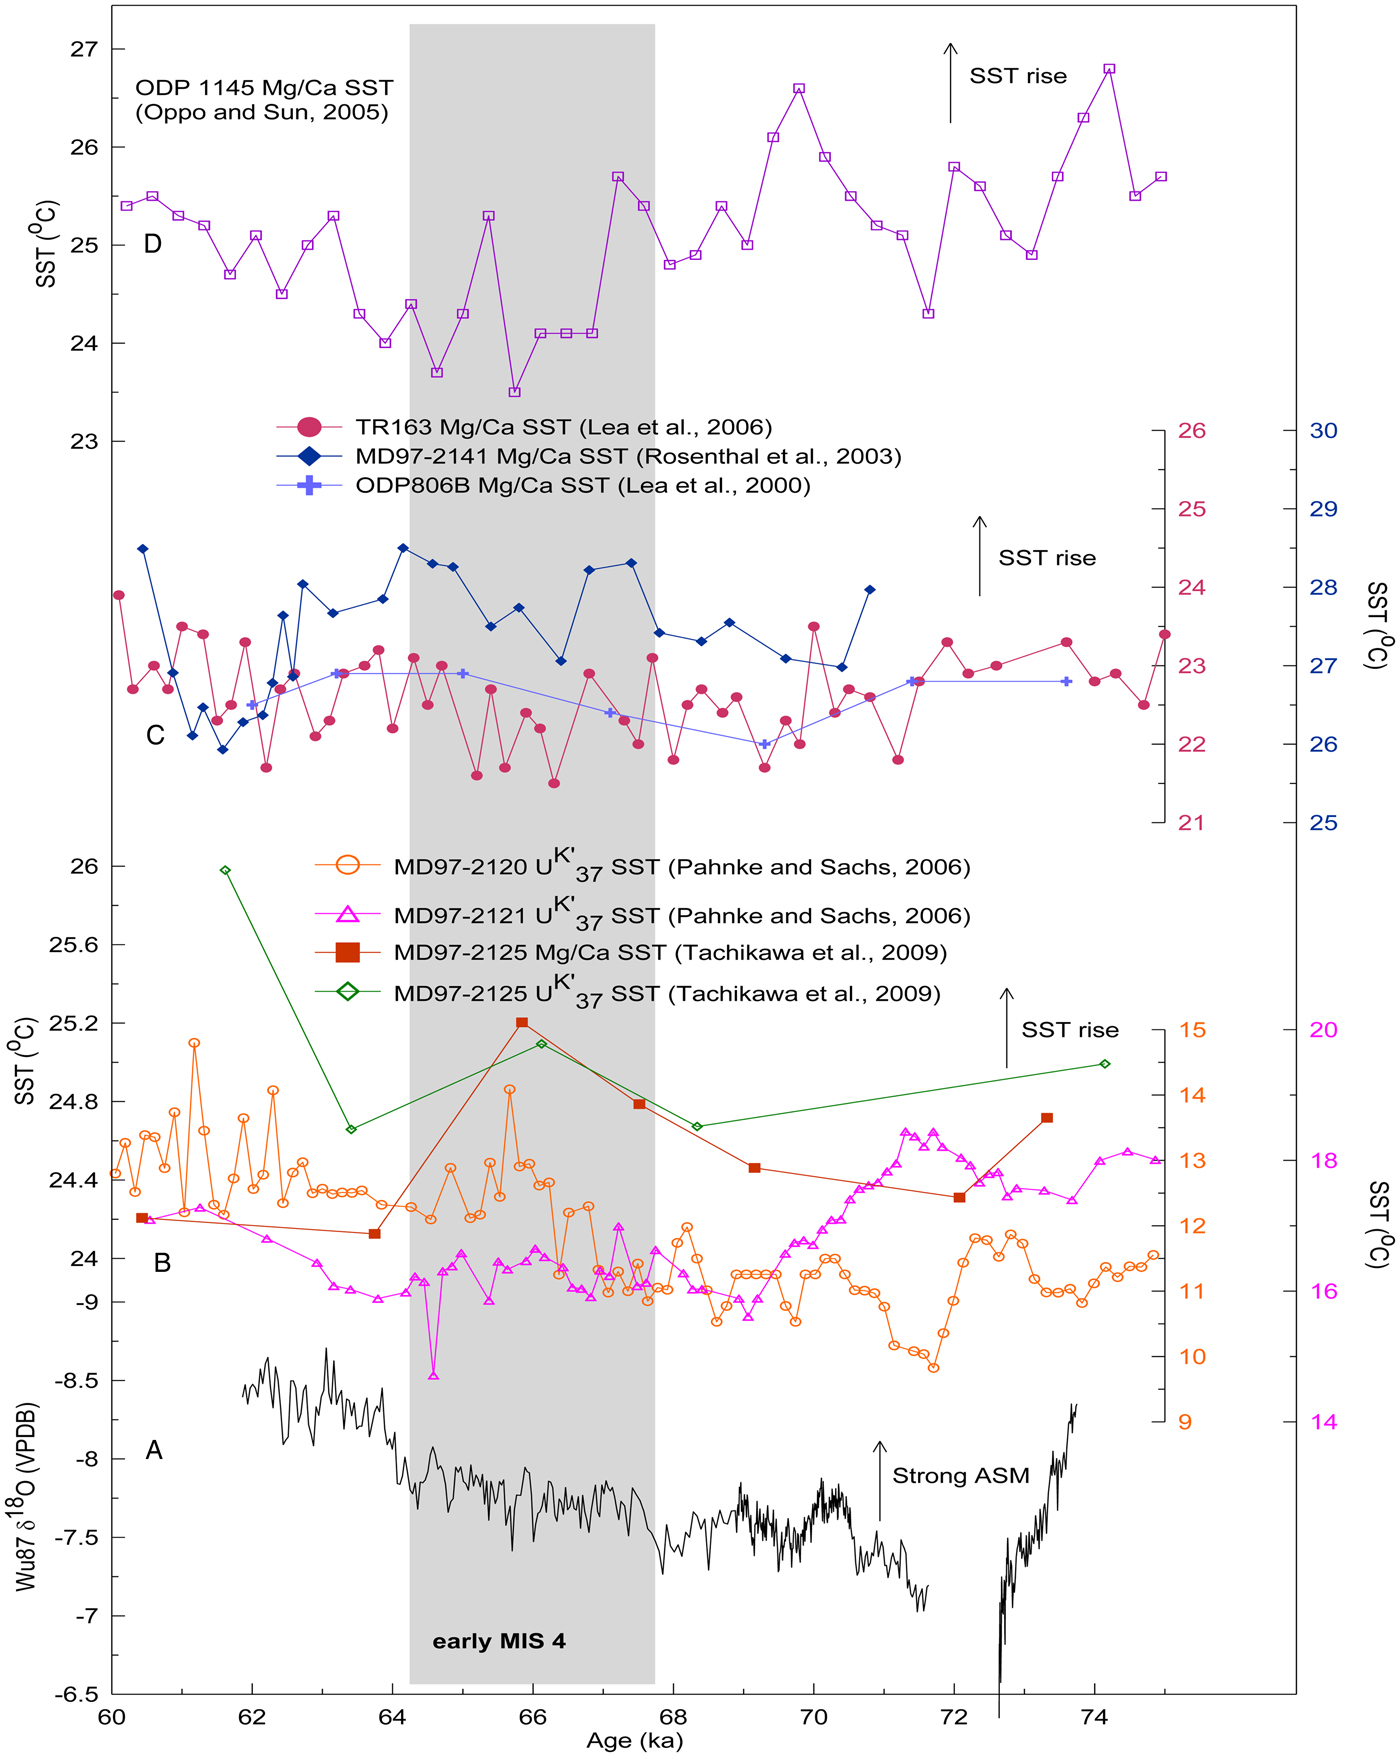
Figure 7. (Color online) Dynamic link of Asian summer monsoon (ASM) changes and sea-surface temperature (SST) records in MIS 4. (A) Wu87 δ18O record (this study); (B) SST changes at subtropical southern Pacific (MD97-2120 [45°32.06′S, 174°55.85′E] and MD97-2121 [40°22.8′S, 177° 59.4′E]; Pahnke and Sachs, Reference Pahnke and Sachs2006; MD2125 [22°34′S, 161°44′E]; Tachikawa et al., Reference Tachikawa, Vidal, Sonzogni and Bard2009); (C) IPWP SST (ODP806B [0°19.04′N, 159°21.25′E]; Lea et al., Reference Lea, Pak and Spero2000; TR163 [0°30.9′N, 92°23.9′W]; Lea et al., Reference Lea, Pak, Belanger, Spero, Hall and Shackleton2006; MD97-2141 [8.8°N, 121.3°E]; Rosenthal et al., Reference Rosenthal, Oppo and Linsley2003); (D) SST changes at the South China Sea (ODP1145 [19°35′N, 117°38′E]; Oppo and Sun, Reference Oppo and Sun2005). Gray bar indicates early MIS 4, when SST in each site reached its modern level.
Hence, the thermal contrast between the two hemispheres is very important. We speculate that when the AMOC is exceptionally strong (or weak), a large interhemispheric thermal gradient would result in a latitudinal migration of the ITCZ, as demonstrated by modeling studies (Broccoli et al., Reference Broccoli, Dahl and Stouffer2006; Stouffer et al., Reference Stouffer, Yin, Gregory, Dixon, Spelman, Hurlin and Weaver2006). This could explain the antiphase relationship between the ASM and Antarctic temperature during Interstadials 19 and 18 and late MIS 4 (Fig. 6). In contrast, a small thermal gradient between the two hemispheres is favorable for an expansion/contraction of the ITCZ, which is partly reminiscent of the concurrent rise in the ASM strength and Antarctic temperature during early MIS 4. This simplified concept of ocean–atmosphere response is probably similar to the mechanism associated with triple AMOC states, that is, a glacial mode, a Heinrich mode, and a modern mode (Clark et al., Reference Clark, Pisias, Stocker and Weaver2002), which is further modulated by ice-shelf and sea-ice interactions (Boers et al., Reference Boers, Ghil and Rousseau2018). It is currently out of our scope to evaluate the northernmost boundary of the ITCZ. Our comparison suggests that the impact of the ITCZ is probably limited to mid- to low latitudes, as an increase in NGRIP ice-core Ca2+ concentration (indicating a strong Asian winter monsoon) can be observed before the onset of Interstadial 18 (Fig. 6D) (Rasmussen et al., Reference Rasmussen, Bigler, Blockley, Blunier, Buchardt, Clausen and Cvijanovic2014). In our speleothem records, the ASM intensification persisted throughout early MIS 4 (Fig. 6A–C, gray bar). A decoupling of ASM intensity and Greenland temperature was also observed during mid-HS (Liu et al., Reference Liu, Wang, Cheng, Edwards, Kong, Chen and Liu2018). In this study, speleothem records from central to southern China revealed a gradual ASM intensification in mid-HS, in stark contrast to a stable cold climate state in Greenland. It is probably a reflection of the impact of low-latitude hydrothermal processes.
These observations are of vital importance for understanding the dynamics of millennial-scale climate changes, because the frequency and amplitude of interstadials/stadials are controlled by North Atlantic processes, and their magnitude increases with increasing latitude (Masson-Delmotte et al., Reference Masson-Delmotte, Buiron, Ekaykin, Frezzotti, Gallée, Jouzel and Krinner2011; Shakun et al., Reference Shakun, Clark, Marcott, Mix, Liu, Otto-Bliesner, Schmittner and Bard2012; Cuffey et al., Reference Cuffey, Clow, Steig, Buizert, Fudge, Koutnik, Waddington, Alley and Severinghaus2016). However, the evolution and duration of millennial-scale climate events, especially within northern low latitudes, is probably determined by southern oceanic processes (Buizert and Schmittner, Reference Buizert and Schmittner2015). In Asian speleothem records, gradual δ18O variability can be expected at CIS/CS transitions in contrast to abrupt changes in Greenland temperature (Wang et al., Reference Wang, Cheng, Edwards, An, Wu, Shen and Dorale2001; Cai et al., Reference Cai, An, Cheng, Edwards, Kelly, Liu, Wang and Shen2006; Liu et al., Reference Liu, Wang, Cheng, Edwards, Kong, Wang, Wu and Chen2008, Reference Liu, Wang, Cheng, Edwards, Kong, Chen and Liu2018; Zhang et al., Reference Zhang, Li, Cheng, Edwards, Shen, Spötl, Li, Han, Li, Huang and Zhao2017). Sensitive to the interhemispheric temperature gradient, the ITCZ can act a bridge to link bipolar climates via expansion/contraction and “pull–push” mechanisms (Rohling et al., Reference Rohling, Liu, Roberts, Stanford, Rasmussen, Langen and Siddall2009). Therefore, one needs to precisely pinpoint the “zero-anomaly line” of the interhemispheric thermal gradient in the past (Stouffer et al., Reference Stouffer, Yin, Gregory, Dixon, Spelman, Hurlin and Weaver2006; Zarriess et al., Reference Zarriess, Johnstone, Prange, Steph, Groeneveld, Mulitza and Machensen2011). Within the IPWP, a sharp precipitation boundary between the maritime continents and Australia was located at about 8–10°S during the last termination (Lo et al., Reference Lo, Shen, Wei, Burr, Mii, Chen, Lee and Tsai2014); however, a geographic mismatch between meridional thermal and rainfall patterns (Linsley et al., Reference Linsley, Rosenthal and Oppo2010) suggests that the zero-anomaly line variability deserves further investigation, especially at contrasting climate boundaries.
CONCLUSIONS
A high-resolution speleothem δ18O record from southern China presents a detailed ASM history spanning CIS 19 to the onset of CIS 18. During these interstadials and late MIS 4, ASM variations were in line with millennial-scale changes in northern high-latitude temperatures derived from Greenland ice-core δ18O (Rasmussen et al., Reference Rasmussen, Bigler, Blockley, Blunier, Buchardt, Clausen and Cvijanovic2014) and δ15N records (Kindler et al., Reference Kindler, Guillevic, Baumgartner, Schwander, Landais and Leuenberger2014), but antiphased with Antarctic climates. In early MIS 4, however, an increase in ASM intensity can be observed just after CIS 19, in agreement with a rise in Antarctic temperature. At the centennial scale, the ASM was stable during peak interstadials, while significant instabilities were evident in stadials. In the antiphase scenario (i.e., CIS 19, CIS 18, and late MIS 4), latitudinal shifts of the ITCZ might dominate, as large freshwater discharges can be found in late MIS 4. In an in-phase case, a symmetrical expansion/contraction of the ITCZ would be expected. Consequently, we speculate that an expansion/contraction mode is important for ITCZ movement when freshwater perturbations are negligible (Collins et al., Reference Collins, Schefuß, Heslop, Mulitza, Prange, Zabel and Tjallingii2011; Yan et al., Reference Yan, Wei, Soon, An, Zhou, Liu, Wang and Carter2015; Denniston et al., Reference Denniston, Ummenhofer, Wanamaker, Lachniet, Villarini, Asmerom and Polyak2016).
ACKNOWLEDGMENTS
We are grateful to three anonymous reviewers for their generous technical comments on an early version of this manuscript. This work was jointly supported by grants from the National Nature Science Foundation of China (no. 41672161), a project funded by the Priority Academic Program Development of Jiangsu Higher Education Institutions (164320H116), the Jiangsu Center for Collaborative Innovation in Geographical Information Resource Development and Application, and the Key Laboratory of Virtual Geographic Environments (Nanjing Normal University).
SUPPLEMENTARY MATERIAL
The supplementary material for this article can be found at https://doi.org/10.1017/qua.2019.36


