


Introduction
Alcohol use, across the lifespan, can be characterized by a series of transitions: from early experimentation to hazardous drinking and possible development of alcohol use disorders (AUD), or to non-problematic alcohol intake. Some of these transitions are developmentally salient: for instance, hazardous drinking is common during adolescence and early adulthood, but does not always portend problematic use in later adulthood (Degenhardt et al., Reference Degenhardt, O'Loughlin, Swift, Romaniuk, Carlin, Coffey and Patton2013; Wennberg, Andersson, & Bohman, Reference Wennberg, Andersson and Bohman2000). Similarly, individuals with AUD might remit, even to abstinence, or persist into later life (McCutcheon et al., Reference McCutcheon, Grant, Heath, Bucholz, Sartor, Nelson and Martin2012; Trim, Schuckit, & Smith, Reference Trim, Schuckit and Smith2013). Furthermore, alcohol-related behavior can be broadly disarticulated into two components – the extent to which an individual consumes alcohol and the potential problems that they experience related to their intake. For instance, AUD are characterized not by excessive alcohol consumption but by measurable physiological changes that accompany addiction (e.g. withdrawal, tolerance) as well as the loss of control over drinking and drinking despite physical and emotional impairment (American Psychiatric Association, 2013). These complexities underlying the life course of alcohol use and misuse pose challenges in the dissection of etiology.
Most stages of alcohol involvement include a heritable contribution (twin h 2 = 40–70%), although the magnitude of these genetic effects varies considerably across development (Edwards et al., Reference Edwards, Heron, Vladimirov, Wolen, Adkins, Aliev and Kendler2017; ENOCH, Reference ENOCH2006; Pagan et al., Reference Pagan, Rose, Viken, Pulkkinen, Kaprio and Dick2006). Common genetic variants from genome-wide association studies (GWAS) explain 4–13% of the phenotypic variance in alcohol use and misuse (Clarke et al., Reference Clarke, Adams, Davies, Howard, Hall, Padmanabhan and McIntosh2017; Kranzler et al., Reference Kranzler, Zhou, Kember, Smith, Justice, Damrauer and Gelernter2019; Liu et al., Reference Liu, Jiang, Wedow, Li, Brazel, Chen and Vrieze2019; Sanchez-Roige et al., Reference Sanchez-Roige, Fontanillas, Elson, Gray, de Wit, Davis and Palmer2017; Schumann et al., Reference Schumann, Liu, O'Reilly, Gao, Song, Xu and Elliott2016; Walters et al., Reference Walters, Polimanti, Johnson, McClintick, Adams, Adkins and Agrawal2018). The largest GWAS of alcohol dependence to date (Kranzler et al., Reference Kranzler, Zhou, Kember, Smith, Justice, Damrauer and Gelernter2019) suggests that the genetic correlation between alcohol consumption (units per week) and ICD-coded AUD is variable [r g ranging from 0.54 (beer/cider) to 0.004 (champagne/white wine)].
A recent study (Sanchez-Roige, Palmer, Fontanillas, Elson, & Clarke, Reference Sanchez-Roige, Palmer, Fontanillas, Elson and Clarke2018) conducted GWAS of both the consumption and problem subscales of the Alcohol Use Disorders Identification Test (AUDIT), a short screener for drinking in the past year (Saunders, Aasland, Babor, De la Fuente, & Grant, Reference Saunders, Aasland, Babor, De la Fuente and Grant1993). In the UK Biobank (UKB) sample, genetic liability to the consumption subscale (AUDIT-C; three items with information pertaining to alcohol consumption) was positively correlated with educational achievement and unrelated to psychopathology whereas liability to the problem subscale (AUDIT-P; seven items with information pertaining to alcohol problems) was negatively correlated with educational achievement and positively correlated with psychopathology. These findings are consistent with the lack of genetic correlation between psychiatric illness and genetic liability to alcohol consumption in the largest GWAS of the trait (drinks per week; Liu et al., Reference Liu, Jiang, Wedow, Li, Brazel, Chen and Vrieze2019). In contrast, two recent studies suggest moderate genetic correlations between AUD and consumption indices, including the AUDIT-C (e.g. r g = 0.52, p = 2.40 × 10−42) (Kranzler et al., Reference Kranzler, Zhou, Kember, Smith, Justice, Damrauer and Gelernter2019; Marees et al., Reference Marees, Smit, Ong, MacGregor, An, Denys and Derks2019), while another study found that polygenic risk scores (PRS) for past week alcohol consumption predicted a modest but significant amount of variance in AUD (e.g. R 2 = 0.56%; Johnson et al., Reference Johnson, St.Pierre, Meyers, Aliev, McCutcheon, Lai and Agrawal2019), suggesting that the genetic correspondence between recent consumption and dependence may be complicated by several factors, including the characteristics of the sample, and the nature of the assessment [e.g. alcohol quantity v. frequency (Marees et al., Reference Marees, Smit, Ong, MacGregor, An, Denys and Derks2019)].
In this study, we sought to examine the extent to which PRS derived from the AUDIT-C and AUDIT-P GWAS predicted variance in multiple aspects of alcohol use and misuse, ranging from levels of alcohol consumption to hazardous drinking and AUD, in four independent samples that vary in their age and ascertainment scheme. PRS represent an individual's genetic liability for a certain trait or disorder, created by aggregating the effects of many risk variants for the phenotype of interest, weighting the effect sizes by the number of effect alleles an individual carries at each locus. Prior evidence indicates that association between PRS and phenotype in the target sample is improved when both the discovery and target samples for PRS analyses are derived using similar ascertainment strategies (Savage et al., Reference Savage, Salvatore, Aliev, Edwards, Hickman, Kendler and Kaprio2018). Based on a study showing positive correlations between psychopathology and AUDIT-P (but not AUDIT-C; Sanchez-Roige et al., Reference Sanchez-Roige, Palmer, Fontanillas, Elson and Clarke2018), we hypothesized that AUDIT-P PRS would be more closely related to liability to AUD than would AUDIT-C PRS, which would be more closely related to the aspects of alcohol consumption (e.g. regular consumption, units per week). We also hypothesized that associations with AUDIT-C would be stronger in the youngest sample while the AUDIT-P would be more predictive of drinking in older, ascertained samples in which problem drinking is more established. While there have been some recent studies examining the genetic overlap between alcohol consumption and indices of problem drinking (e.g. Johnson et al., Reference Johnson, St.Pierre, Meyers, Aliev, McCutcheon, Lai and Agrawal2019), none have yet compared the performance of consumption (AUDIT-C) v. problem drinking (AUDIT-P) PRS across multiple samples. Taken together, the current analyses demonstrate how genetic findings derived from a simple and fast screening tool could serve to outline the polygenic underpinnings of different stages of alcohol use and problems in diversely ascertained samples.
Materials and methods
Discovery GWAS
The summary statistics of the recent GWAS of AUDIT-C and AUDIT-P in 121 604 unrelated individuals of European ancestry from the UKB cohort (Sanchez-Roige et al., Reference Sanchez-Roige, Palmer, Fontanillas, Elson and Clarke2018) were used to construct PRS for alcohol-related outcomes in four independent target samples. The UKB (www.ukbiobank.ac.uk) is a population-based sample of 502 629 participants who were recruited from 22 assessment centers across the UK from 2006 to 2010 (Bycroft et al., Reference Bycroft, Freeman, Petkova, Band, Elliott, Sharp and Marchini2018); the AUDIT was delivered as part of the online Mental Health Questionnaire follow-up. Discovery GWAS analyses were performed using BGENIE (Bycroft et al., Reference Bycroft, Freeman, Petkova, Band, Elliott, Sharp and Marchini2018), version 1.1, with AUDIT scores (AUDIT-C score, and AUDIT-P score, tested independently) as the outcome variable and age, sex, genotyping array, and the first 20 principal components derived from genotype data as covariates to account for any remaining population stratification. Further details regarding the discovery GWAS are provided in the online Supplemental Materials.
Target sample demographics and characteristics
Collaborative Study on the Genetics of Alcoholism
The Collaborative Study on the Genetics of Alcoholism (COGA) (Begleiter et al., Reference Begleiter, Reich, Hesselbrock, Porjesz, Li, Schuckit and Rice1995; Nurnberger et al., Reference Nurnberger, Wiegand, Bucholz, O'Connor, Meyer, Reich and Bierut2004; Schuckit et al., Reference Schuckit, Smith, Danko, Kramer, Bucholz, McCutcheon and Hesselbrock2018) includes probands meeting criteria for alcohol dependence, their family members, and community control families. There were 7645 participants of European ancestry with genotype data available as well as data on alcohol-related phenotypes; of these, 6850 were ⩾20 years (the mean age of onset of alcohol dependence) and reported lifetime alcohol use.
Avon Longitudinal Study of Parents and Children
The Avon Longitudinal Study of Parents and Children (ALSPAC) recruited 14 541 pregnant women residing in Avon, UK, with expected dates of delivery from 1 April 1991 to 31 December 1992. The enrolled sample consisted of 14 775 children. Additional details are provided in the online Supplemental Materials. For the current analyses, phenotypic data were available for up to 5911 participants, depending on the phenotype and wave of assessment. Ethical approval for the study was obtained from the ALSPAC Ethics and Law Committee and the Local Research Ethics Committees.
Generation Scotland
The Scottish Family Health Study (GS) is a family-based cohort recruited from the general population of Scotland from 2006 to 2011 (N = 24 084) (Smith et al., Reference Smith, Campbell, Linksted, Fitzpatrick, Jackson, Kerr and Morris2013). A subset of GS participants responded to a re-contact in 2015 (Navrady et al., Reference Navrady, Wolters, MacIntyre, Clarke, Campbell, Murray and McIntosh2018) and provided additional information on mental health, which included information on alcohol misuse (N = 17 461).
UK Biobank
Individuals who were part of the AUDIT discovery GWAS (Sanchez-Roige et al., Reference Sanchez-Roige, Palmer, Fontanillas, Elson and Clarke2018) were removed from the UKB target sample, leaving 245 947 individuals with phenotypic data for these analyses.
Alcohol use measures
A summary of the alcohol-related outcomes included in the analyses is presented in Table 1. Across all samples, participants who did not endorse lifetime alcohol use were removed to account for those with high genetic liability who elect not to drink for personal or socio-cultural reasons, or were not old enough to have had a first drink. Each target sample used a different assessment. Details regarding each assessment are available in the online Supplementary Materials. Briefly, COGA participants were administered the Semi-Structured Interview for the Genetics of Alcoholism [SSAGA; (Bucholz et al., Reference Bucholz, Cadoret, Cloninger, Dinwiddie, Hesselbrock, Nurnberger and Schuckit1994)], which includes diagnostic assessments for DSM-IV and DSM-5 AUD as well as other aspects of alcohol use. ALSPAC participants completed the AUDIT questionnaire, and DSM-IV alcohol dependence was derived for 4328 participants, using symptom-level items adapted from Kendler, Heath, Neale, Kessler, and Eaves (Reference Kendler, Heath, Neale, Kessler and Eaves1992). In GS, participants reported on their alcohol intake (units per week) using a pre-clinical questionnaire, and were also administered the CAGE (Cut-Annoyed-Guilty-Eye) screener (Ewing, Reference Ewing1984). In the UKB, ICD-9 and 10 codes for AUD were derived from linkage to hospital inpatient records. Phenotypic correlations between alcohol use measures across the samples are shown in online Supplementary Table S16.
Table 1. Alcohol-related measures in each target sample
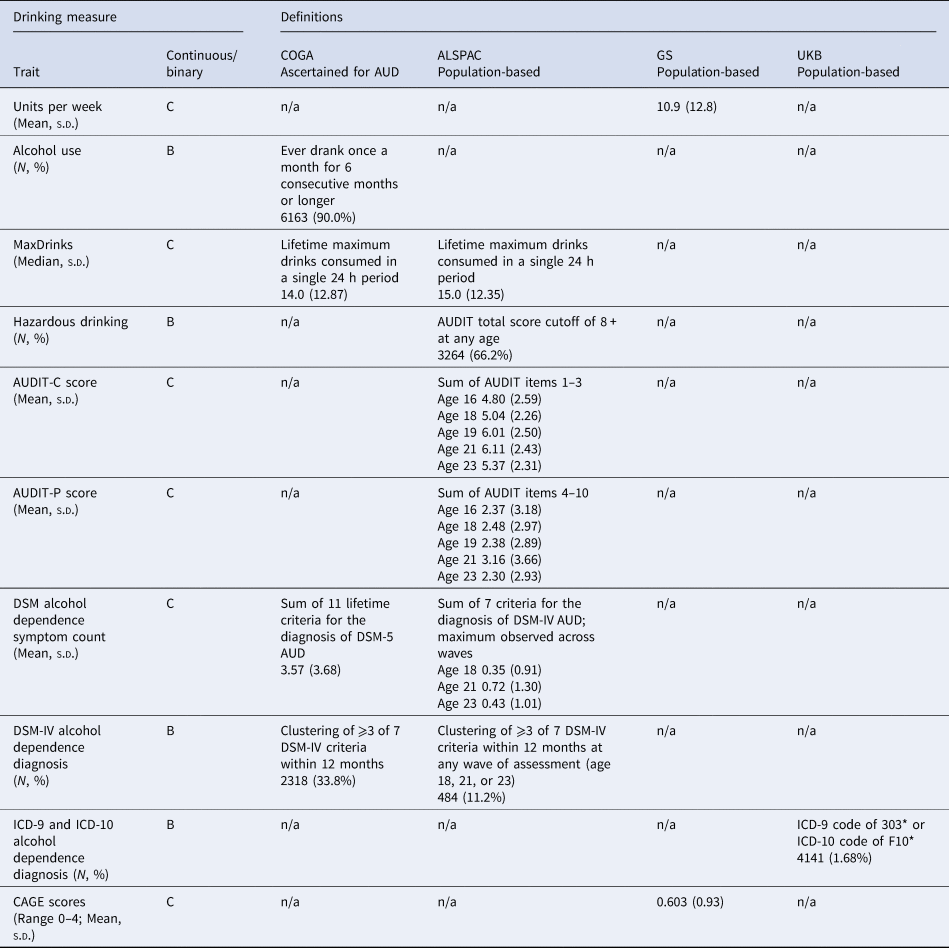
C, continuous (linear regression model used); B, binary (logistic regression model used).
Genotypes
Details on genotyping and quality control are shown in the online Supplementary Materials.
Polygenic risk score construction
For all samples, PRS were coded for every individual by multiplying an individual's number of effect alleles at a particular SNP by that SNP's effect size (β) from the discovery GWAS (Sanchez-Roige et al., Reference Sanchez-Roige, Palmer, Fontanillas, Elson and Clarke2018) then averaging across SNPs to create one score per person. The discovery GWAS summary statistics were clumped using PLINK (Chang et al., Reference Chang, Chow, Tellier, Vattikuti, Purcell and Lee2015; Purcell et al., Reference Purcell, Neale, Todd-Brown, Thomas, Ferreira, Bender and Sham2007) using the linkage disequilibrium (LD) pattern from the 1000 Genomes European (Consortium, 2015) reference sample, with an LD threshold of r 2 ⩾ 0.25 and a 500 kb physical distance. PRS were constructed for eight thresholds (p T < 0.0001, p T < 0.001, p T < 0.01, p T < 0.10, p T < 0.20, p T < 0.30, p T < 0.40, p T < 0.50) and standardized using the scale function in R within each sample to ease interpretation of effect sizes. For ALSPAC and COGA, PRS were generated using PLINK; for UKB and GS samples, PRS were created using PLINK implemented in PRSice-2 (Euesden, Lewis, & O'reilly, Reference Euesden, Lewis and O'reilly2014) using the same R 2 thresholds for clumping and the same p value thresholds.
Statistical analyses
Linear and logistic regression models were used to examine whether AUDIT-C and AUDIT-P PRS were associated with each of the alcohol-related phenotypes (see Table 1), and to determine which PRS threshold (i.e. p T) was most predictive of each measure based on the p value and observed (linear) or pseudo (logistic) R 2. For the cohorts of unrelated individuals (ALSPAC and UKB), the partial R 2 was extracted from linear regression models for continuous traits, while Nagelkerke's pseudo-R 2 was extracted from logistic regression models for binary traits. For the cohorts that employed mixed-effect models to account for within-sample relatedness (COGA and GS), variance explained by the PRS in the continuous outcomes (e.g. MaxDrinks, CAGE) was calculated by multiplying the PRS by its regression coefficient and dividing the variance of that value by the variance of the outcome to derive a coefficient of determination between 0 and 1 (Nakagawa & Schielzeth, Reference Nakagawa and Schielzeth2012); in COGA, the ‘MuMIn’ package in R was used to calculate marginal R 2 for the logistic mixed-effect models for the binary outcomes (Barton, Reference Barton2011). Once the most predictive AUDIT-C and AUDIT-P PRS thresholds were determined in the single-PRS models (n.b. p T was allowed to vary between AUDIT-C and AUDIT-P PRS), the most predictive PRS for both AUDIT-C and AUDIT-P PRS were simultaneously entered into a joint regression model along with covariates (results for single-PRS models are available in online Supplemental Tables S1–S12). We primarily report on the results of the joint (AUDIT-C PRS + AUDIT-P PRS) regression models, as we wished to examine the relative contribution of each AUDIT subscale PRS while controlling for the other subscale PRS. As the primary analyses consisted of two tests (AUDIT-C PRS and AUDIT-P PRS) for each of the 12 outcomes, and the number of independent tests across the PRS p value thresholds was estimated to be approximately 5 [calculated using spectral decomposition, via the matSpD.R R script (Nyholt, Reference Nyholt2004)], we corrected for 120 tests using a Bonferroni p value = 0.0004.
COGA
Sex, four ancestral principal components (chosen via visual inspection of a scree plot of the eigenvalues), total number of interviews, birth cohort (born 1890–1929, 1930–1949, 1950–1969, ⩾1970), and array type (see online Supplemental Materials) were included as fixed effects, while the family identifier and recruitment site were included as random effects (family nested within site).
ALSPAC
In keeping with standard practice for genetic analyses in ALSPAC, sex and 10 ancestral principal components were included as covariates. ALSPAC assessments are age-specific; therefore, age was not included as a covariate.
GS
Analyses were performed in AS-REML-R fitting pedigree information as a random effect to control for relatedness in the sample. Fixed effects included age, sex, and four multidimensional scaling components to correct for population stratification.
UKB
Age, sex, and 10 ancestry principal components were used as covariates.
Cox proportional hazards survival models for the onset of hazardous drinking (AUDIT total score ⩾8) in ALSPAC and DSM-IV alcohol dependence in COGA were fit to the data with identical covariates as the regression analyses. Those who did not meet criteria for hazardous drinking or alcohol dependence were censored at their age at last interview (since age at birth). For ease of comparison across the two samples, the same PRS threshold (p T < 0.5) was used in both COGA and ALSPAC and for both the AUDIT-C and AUDIT-P PRS. Violations of the proportional hazards assumption for the PRS were tested using scaled Schoenfeld residuals. All analyses were conducted in R (R Core Team, 2017). In COGA, family identifier and recruitment site were included in the survival models as a nested frailty term [i.e. (1 | site/family)], using the ‘coxme’ package for mixed-effect Cox proportional hazards models containing Gaussian random effects (Therneau & Grambsch, Reference Therneau and Grambsch2013; Therneau, Reference Therneau2018). ALSPAC data were analyzed using the ‘survival’ and ‘survminer’ packages in R (Kassambara, Kosinski, & Biecek, Reference Kassambara, Kosinski and Biecek2017; Therneau & Lumley, Reference Therneau and Lumley2015)
For illustrative purposes, PRS were also split into quartiles for COGA, ALSPAC, and UKB, and the odds of having an AUD diagnosis (DSM-IV alcohol dependence in COGA and ALSPAC, ICD-9/ICD-10 alcohol-related codes in UKB) was calculated in each quartile using the lowest quartile as the reference group.
Results
Target sample demographics and characteristics
The prevalence of each alcohol use measure for each target sample is shown in Table 1. The SNP-heritability of AUDIT-C was 11%, while the SNP-heritability of the AUDIT-P score was 9%, and the genetic correlation (i.e. SNP-r g) between them was r g = 0.70 [as reported in the original paper (Sanchez-Roige et al., Reference Sanchez-Roige, Palmer, Fontanillas, Elson and Clarke2018)]. See online Supplemental Table S15 for the number of SNPs in each PRS threshold.
COGA
A total of 33.8% of the participants (N = 2318) met DSM-IV criteria for alcohol dependence during their lifetime, with 77.6% of those endorsing ⩾6 (i.e. severe) DSM-5 AUD criteria. A median of 14.0 drinks (s.d. = 12.9; ~96 g of alcohol, or 14 standard US drinks) in a single 24 h period was reported (i.e. MaxDrinks). A total of 90.0% of the participants reported drinking at least once a month for 6 consecutive months or longer (i.e. monthly alcohol use).
ALSPAC
By age 23, 11.2% (N = 484) had met DSM-IV criteria for alcohol dependence within the past year at any of the three assessment waves, while 66.2% reported hazardous drinking (AUDIT total score ⩾8). The median MaxDrinks was 15 UK units (s.d. = 12.4; approximately 120 g of alcohol, or 8.5 standard US drinks).
GS
Mean alcohol intake was 10.9 units per week (s.d. = 12.8; approximately 87.2 g of alcohol, or 6.2 standard US drinks; N = 17 461) and the mean CAGE score was 0.6 (s.d. = 0.93).
UKB
There were 4141 (1.68%) individuals in the subset of UKB selected for analysis who had at least one ICD-9 or ICD-10 code assigned as a primary or secondary diagnosis of alcohol-related disorders during time as a hospital inpatient.
Associations between AUDIT PRS and alcohol consumption measures
COGA
As shown in Table 2, only the AUDIT-P PRS was significantly associated with monthly alcohol use (R 2 = 0.65%, p = 1.24 × 10⁻⁴) and MaxDrinks (R 2 = 0.47%, p = 2.00 × 10⁻⁸). We also converted the pseudo-R 2 values for all binary outcomes to R 2 on the liability scale (Lee, Goddard, Wray, & Visscher, Reference Lee, Goddard, Wray and Visscher2012), but as estimates did not differ, these results are not presented.
Table 2. Associations between AUDIT-C and AUDIT-P PRS and multiple indices of alcohol use in COGA, UKB, ALSPAC, and GS samples
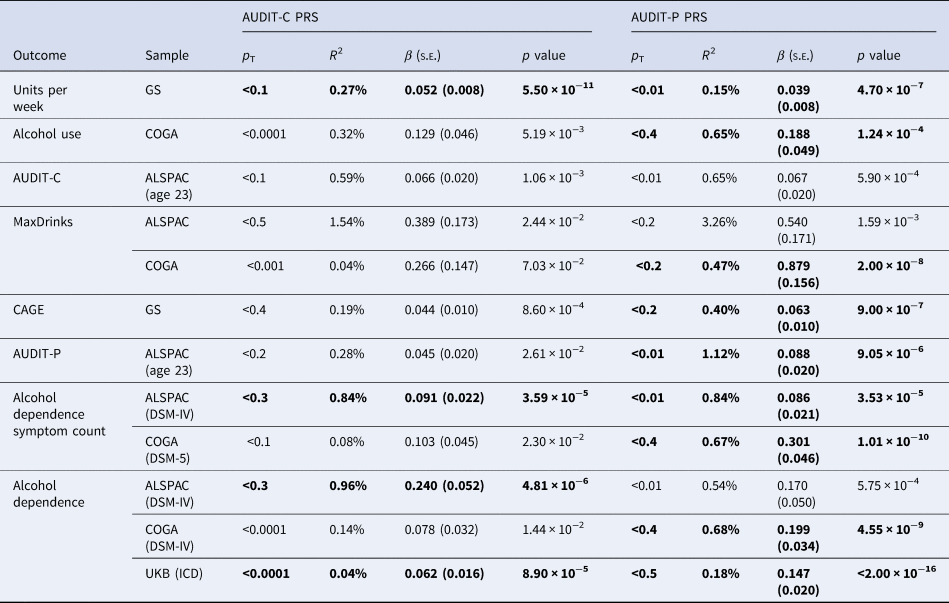
The PRS threshold (p T) that most strongly predicted each outcome (based on the highest R 2) is presented. Results significant at p < 0.0004 are bolded. Complete results are available in online Supplemental Tables S1–S12.
ALSPAC
AUDIT-C and AUDIT-P PRS accounted for increasing proportions of phenotypic variance in AUDIT-C and AUDIT-P scores as the sample aged, from ~0.50% at age 16 to 1.12% at age 23 (see online Supplementary Tables S8 and S9 for complete results). Here we focus on results for age 23 for comparability to other samples, which consisted predominantly of adults. No association survived the correction for multiple tests. The strongest associations observed were for AUDIT-C and AUDIT-P PRS, which were both associated with higher AUDIT-C scores in ALSPAC at age 23, each explaining 0.60% of the variance (p = 1.06 × 10⁻³ and 5.9 × 10⁻⁴, respectively), and between AUDIT-P PRS and MaxDrinks (R2 = 3.30%, p = 1.59 × 10⁻³); a 1-s.d. increase in AUDIT-P PRS corresponds to a predicted increase of 0.54 drinks.
GS
The AUDIT-P PRS explained 0.15% of the variance in units per week (p = 4.7 × 10⁻⁷) and 0.40% of the variance in CAGE scores (p = 9.0 × 10⁻⁷), while the AUDIT-C PRS explained 0.27% of the variance in units per week (p = 5.5 × 10⁻¹¹).
Associations between AUDIT PRS and alcohol problem measures
COGA
As shown in Table 2, only the AUDIT-P PRS was significantly associated with DSM-IV alcohol dependence (R 2 = 0.68%, p = 4.55 × 10⁻⁹) and DSM-5 AUD symptom count (R 2 = 0.67%, p = 1.01 × 10⁻¹⁰). For individuals in the top quartile of AUDIT-P PRS risk, the odds of being diagnosed with alcohol dependence was 1.74 [95% confidence intervals (CI) 1.47–2.07] compared to those in the lowest quartile, while being in the top AUDIT-C PRS quartile was associated with an odds ratio (OR) of 1.30 (95% CI 1.10 to −1.54) compared to those in the lowest quartile (Fig. 1). Comparison of the OR and their 95% CI suggest that for AUDIT-C, those in the 4th quartile are at significantly elevated likelihood of AUD compared to those in the lowest quartile, though there were overlapping 95% CI between the 2nd, 3rd, and 4th quartiles. In contrast, for AUDIT-P, the likelihood of AUD escalates at the mid-point, with those in both the 3rd and 4th quartiles being at significantly greater risk of AUD than those in the lowest quartile of AUDIT-P PRS.

Fig. 1. Odds ratios (OR) and 95% confidence interval for alcohol dependence diagnosis by PRS quartiles in ALSPAC, COGA, and UKB. PRS were split into quartiles and odds ratios calculated for case status for each quartile of risk compared to quartile 1 (lowest). (a) Alcohol dependence in ALSPAC was coded by DSM-IV diagnosis (484 cases, 3837 controls). (b) Alcohol dependence was coded via DSM-IV diagnosis in the COGA sample (2318 cases, 4532 controls). (c) A sample of European ancestry, unrelated British individuals who had ever drank, had ICD9 and ICD-10 codes available, and were not included in the discovery GWAS were used (4141 cases, 241 806 controls).
ALSPAC
Only AUDIT-P PRS were associated with AUDIT-P scores, accounting for 1.1% of the variance (p = 9.05 × 10⁻⁶). AUDIT-C PRS and AUDIT-P PRS were both positively associated with DSM-IV alcohol dependence, explaining 1.0% (p = 4.81 × 10⁻⁶) and 0.50% (p = 5.75 × 10⁻⁴) of the variance, respectively, although only the AUDIT-C PRS passed multiple testing corrections. Both PRS scores were also positively associated with DSM-IV alcohol dependence symptom count (R 2 = 0.8% for both; AUDIT-C p = 3.59 × 10⁻⁵, AUDIT-P p = 3.53 × 10⁻⁵). For individuals in the top quartile of AUDIT-C PRS, the odds of being diagnosed with AUD was 1.73 (95% CI 1.29–2.33) compared to those in the lowest quartile, while being in the top AUDIT-P PRS quartile was associated with an OR of 1.25 (95% CI 0.93 to −1.68) compared to those in the lowest quartile (Fig. 1). Due to wider 95% CI (suggesting imprecision potentially due to smaller sample size and/or less of a dose–response association pattern), it was difficult to draw comparisons of the ORs across quartiles in the ALSPAC sample. For AUDIT-C, differentiation in the likelihood of AUD appeared to occur at the 3rd quartile, while for AUDIT-P, there was no clear distinction in the OR across the 2nd, 3rd, and 4th quartiles.
UKB
Positive associations with AUD-related ICD codes were observed for both AUDIT-P (R 2 = 0.18%, p < 2 × 10⁻¹⁶) and AUDIT-C (R 2 = 0.04%, p = 8.9 × 10⁻⁵) PRS. For individuals in the top quartile of AUDIT-P PRS, the odds of having a mental or behavioral disorder due to alcohol was 1.45 (95% CI 1.37–1.54) compared to those in the lowest quartile. For AUDIT-C PRS, being in the top PRS quartile was associated with an OR of 1.11 (95% CI 1.02–1.20) compared to those in the lowest quartile (Fig. 1). In the UKB, likelihood of AUD across quartiles seemed to follow a dose–response pattern with increasing OR for each quartile of polygenic risk for both AUDIT-C and AUDIT-P (though with overlapping CI for AUDIT-C), with the 4th quartile of AUDIT-P PRS being statistically significantly more likely to be diagnosed with AUD relative to the 3rd quartile.
Associations between AUDIT PRS and the onset of hazardous drinking and alcohol dependence
COGA
The AUDIT-P, but not the AUDIT-C, PRS was associated with increased hazards of alcohol dependence onset (AUDIT-P HR = 1.15, 95% CI 1.10–1.20, p = 4.7 × 10⁻⁸; online Supplemental Table S13). Those in the top quartile of AUDIT-P PRS were at considerably higher risk for onset of alcohol dependence (HR = 1.50, 95% CI 1.36–1.64, p = 9.7 × 10⁻¹⁰) relative to any other group; the risk attributable to the top AUDIT-C PRS quartile was lower in magnitude (HR = 1.27, 95% CI 1.14–1.40, p = 1.8 × 10⁻⁴).
ALSPAC
Only the AUDIT-C PRS was associated with the onset of hazardous drinking, although not significant after multiple testing corrections (online Supplemental Table S14; AUDIT-C HR = 1.06, 95% CI 1.02–1.10, p = 2.28 × 10⁻³).
Discussion
The course of alcohol use and misuse consists of several stages, each with polygenic and environmental underpinnings. At earlier ages, how much and how often a person drinks often serves as an indicator of their genetic susceptibility to alcohol misuse (Dick, Meyers, Rose, Kaprio, & Kendler, Reference Dick, Meyers, Rose, Kaprio and Kendler2011; Irons, Iacono, & McGue, Reference Irons, Iacono and McGue2015). As an individual progresses toward maladaptive alcohol intake, a unique genetic susceptibility to physiological and psychological impairments related to alcohol misuse may unfold (Kendler, Gardner, & Dick, Reference Kendler, Gardner and Dick2011). Our goal was to outline the extent to which PRS derived from a discovery GWAS of the AUDIT consumption (AUDIT-C) and problem (AUDIT-P) subscales predicted variance in a range of alcohol use behaviors across samples that were variously ascertained. With few exceptions, polygenic liability to AUDIT-P was a superior predictor of indices of heavy drinking and alcohol problems compared to the AUDIT-C.
Overall, across several ascertainment strategies, AUDIT-P PRS outperformed AUDIT-C as a predictor of both normative and disordered drinking (see Fig. 2 for an overview). For example, AUDIT-P PRS predicted up to 3.3% of the variance in the lifetime maximum number of drinks consumed in a 24 h period (although this was a clear outlier in terms of variance explained), 1.1% of the variance in AUDIT-P scores, and 0.7% of the variance in DSM-5 AUD symptom counts. Exceptions to the superior performance of AUDIT-P PRS were observed within ALSPAC, where AUDIT-C PRS explained higher proportions of the variance than AUDIT-P PRS in some adolescent AUDIT-C and AUDIT-P assessments (prior to age 23; see online Supplemental Materials). AUDIT-C PRS also accounted for more variance in DSM-IV AD in ALSPAC.
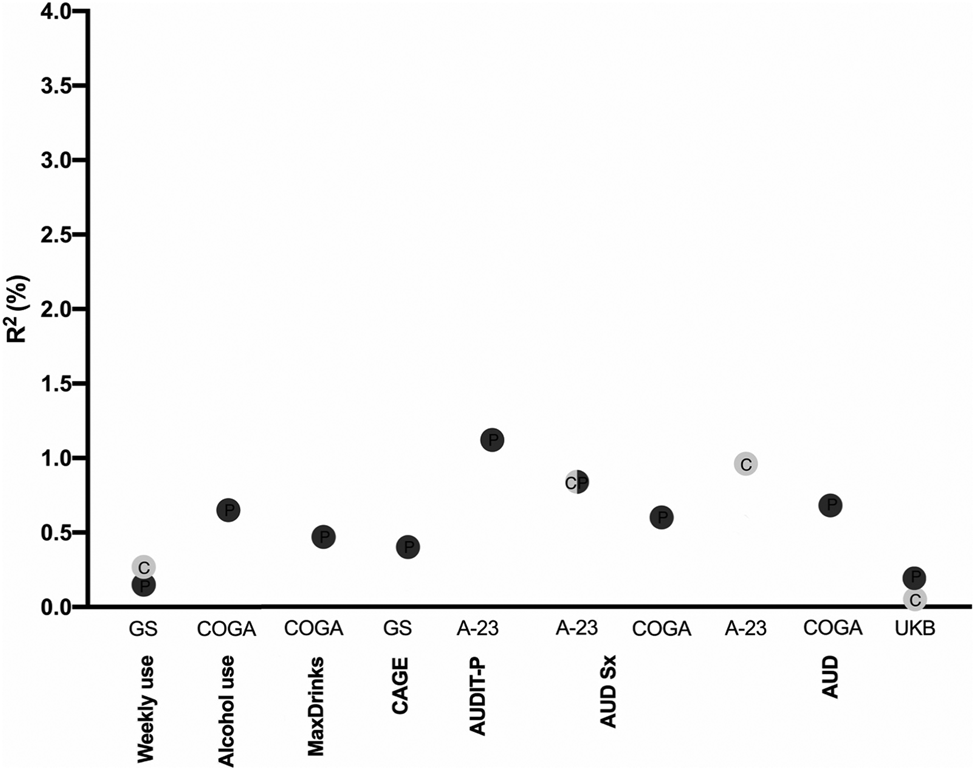
Fig. 2. Overview of the magnitude of predicted variance (R 2, %) across the alcohol-related phenotypes probed in the four independent samples (Generation Scotland, GS; ALSPAC at age 23, A-23; Collaborative Study on the Genetics of Alcoholism, COGA; and UK Biobank, UKB). The color of the dots denotes AUDIT-C (light gray) or AUDIT-P (dark gray) PRS. Only the significant (p < 0.0004) associations are shown. C, AUDIT-C; P, AUDIT-P.
Even indices of alcohol consumption, such as lifetime maximum drinks in 24 h and monthly alcohol use, were more closely related to the genetic liability indexed by AUDIT-P PRS than AUDIT-C PRS. However, this difference was most notable in COGA, for which drinking for at least 6 months during the lifetime represents a highly heterogeneous group of individuals, which may include both non-problem drinkers and those with AUD. As expected, and in line with prior studies (Mies et al., Reference Mies, Verweij, Treur, Ligthart, Fedko, Hottenga and Vink2018; Sanchez-Roige et al., Reference Sanchez-Roige, Palmer, Fontanillas, Elson and Clarke2018), AUDIT-P outperformed AUDIT-C for measures of problem drinking within each sample (i.e. COGA, ALSPAC, GS, and UKB; see Table 2), confirming that the AUDIT-P is more closely related to genetic susceptibility to alcohol misuse than AUDIT-C.
Overall, the variance explained by PRS was low, even when the discovery and target phenotypes were identical (e.g. AUDIT scores in ALSPAC). These estimates are nonetheless consistent with other PRS studies (Mies et al., Reference Mies, Verweij, Treur, Ligthart, Fedko, Hottenga and Vink2018; Savage et al., Reference Savage, Salvatore, Aliev, Edwards, Hickman, Kendler and Kaprio2018), and the proportion of explained variance may improve as the discovery GWAS get larger. In agreement with previous studies (Savage et al., Reference Savage, Salvatore, Aliev, Edwards, Hickman, Kendler and Kaprio2018), we demonstrated that ascertainment is likely to be a crucial factor in polygenic prediction analyses. For instance, while the AUDIT-P PRS explained a larger amount of variance in dependence in COGA than in ALSPAC, the AUDIT-C PRS was not a significant predictor for any phenotype in COGA over and above the effect of AUDIT-P PRS, suggesting that the effect sizes for AUDIT-C from a volunteer cohort (UKB) may not be optimal for capturing genetic risk to AUD in high-risk families, such as those in COGA. AUDIT-C associations in COGA using other addiction-enriched samples, such as the Million Veteran Program (Kranzler et al., Reference Kranzler, Zhou, Kember, Smith, Justice, Damrauer and Gelernter2019), where the genetic correlation between AUDIT-C and AUD is high, will likely provide insights into the extent of the effect of ascertainment differences in discovery and target samples. Interestingly, variance explained by either PRS was the highest in ALSPAC, a population-based cohort that is noticeably younger than the discovery sample (age 39–79 years). Lastly, the variance explained for AUD in the (independent) subset of UKB participants itself was markedly lower than in ALSPAC. Here, it is worth recognizing that AUDIT is a past-year screener for alcohol consumption/problems, and there may have been individuals in the original AUDIT GWAS with low scores who were formerly problem drinkers. Furthermore, using ICD codes derived from hospital records as a proxy for AUD in the UKB may have resulted in false negatives; some of the ‘controls’ could have been problem drinkers but had not been diagnosed with an alcohol-related condition as a hospital inpatient. Thus, the lower prediction in the UKB sample may reflect the instruments used to measure AUD in both the discovery and target GWAS.
Our findings should be viewed in the context of several limitations. First, the AUDIT is a past-year screener for alcohol consumption and problems, and thus may not capture individuals who had alcohol use problems in the past. Second, the AUDIT discovery GWAS was performed in a subset of the UKB that consisted of individuals who responded to an email request to complete a mental health follow-up survey. A recent study of the genomic profiles of these individuals has found them to represent a lower polygenic risk for psychopathology and greater polygenic load for educational achievement, suggesting selection bias in the discovery sample itself (Adams et al., Reference Adams, Hill, Howard, Davis, Deary, Hotopf and McIntosh2018). In addition, these individuals had relatively low endorsement of AUDIT-P items, which might have limited the statistical power of the discovery GWAS to capture the full spectrum of problem drinking and, in turn, limited our ability to compare across the AUDIT-C and AUDIT-P. Third, as the discovery GWAS was conducted on individuals of primarily European descent, these PRS could not be applied to other ancestral groups, reflecting a research gap in the dearth of large discovery GWAS of non-European populations (Martin et al., Reference Martin, Gignoux, Walters, Wojcik, Neale, Gravel and Kenny2017). Results from the recent AUDIT-C GWAS by Kranzler et al. (Reference Kranzler, Zhou, Kember, Smith, Justice, Damrauer and Gelernter2019), which includes 57 340 African-Americans, for instance, will be instrumental in bridging this gap. Fourth, it is likely that the pattern of results reflects a complex interplay between developmental effects, ascertainment strategy, the psychometrics of the assessment instruments, and even population selection effects. For instance, distinctions between ALSPAC and COGA could be attributed to the higher median age of COGA participants, or even drinking patterns prevalent in earlier birth cohorts that are represented within COGA. Potential moderation of PRS by sex are also possible; however, power for such exploratory analyses is limited and beyond the scope of this study. Fifth, although this study examined a range of alcohol use phenotypes (from a measure of monthly alcohol use to dependence), the cross-sectional design cannot capture potential longitudinal changes in PRS association across the progression of stages of alcohol use. A sixth limitation is that we did not control for any measures of socioeconomic status (SES) in our models, although SES has been shown to be a potential moderator of polygenic risk for alcohol consumption (Barr, Silberg, Dick, & Maes, Reference Barr, Silberg, Dick and Maes2018; Clarke, Reference Clarke, Smith, Gelernter, Kranzler, Farrer, Hall and McIntosh2016), as the measures available varied widely and inconsistently across our target samples. The imbalance of cases and controls in the UKB target sample is another limitation; this imbalance would be more likely to seriously bias a discovery GWAS, but may still have confounded the regression analyses in our target sample. A final limitation is that the strength of PRS associations varied across p value thresholds (p T; see online Supplementary Tables S1–S12); because we chose the best-performing p T for each model, as is typical for the pruning + thresholding (P + T) method of PRS analyses (Euesden et al., Reference Euesden, Lewis and O'reilly2014), we run the risk of over-fitting.
Collectively, these analyses demonstrate that much of the polygenic liability to alcohol use and misuse remains unaccounted for – we anticipate that much larger GWAS of phenotypes representing disordered drinking, in conjunction with other risk indices (e.g. PRS for negative affect, a hallmark of later stages of AUD) will be necessary to explain additional variance. Importantly, as the use of PRS becomes increasingly common in attempts to dissect the transitions from experimentation, to regular or problem use and further, to AUD, differences between the discovery sample and target sample(s) in age, ascertainment, and other characteristics will need to be considered in the interpretation of findings. In addition, our findings highlight the high degree of heterogeneity and polygenicity underlying alcohol use and misuse – not only is there no ‘gene for’ alcoholism, there is currently no robust ‘polygenic indicator for’ clinical prediction of liability to problem drinking. Furthermore, while we focused on contrasting the genetic relationship of each individual AUDIT subscale with the variety of alcohol-related measures across our different samples, it should be noted that the proportion of variance explained in the alcohol-related outcomes is larger when we consider both the AUDIT-C and AUDIT-P PRS together, suggesting that multiple polygenic scores provide more utility than PRS for the individual sub-scales. The two scores are only modestly correlated and likely, some of this commonality is due to variants in ADH1B that exert a relatively large effect. Overall, our analyses suggest that even though it is too small to be statistically significant, there is some incremental contribution of variance from the inclusion of the AUDIT-C. Despite these caveats, our analyses demonstrate the feasibility of using a fast and simple screening questionnaire, the AUDIT, that assesses both consumption and problem drinking, to understand the course of alcohol use and misuse.
Supplementary material
The supplementary material for this article can be found at https://doi.org/10.1017/S0033291719004045
Acknowledgements
This research was conducted using the UK Biobank Resource, application number 4844. ECJ was supported by funding from NIAAA (F32AA027435). S.S-R was supported by the Frontiers of Innovation Scholars Program (FISP; #3-P3029), the Interdisciplinary Research Fellowship in NeuroAIDS (IRFN; MH081482), a pilot award from the NIH (DA037844), and a NARSAD Young Investigator Award from the Brain and Behavior Foundation (Grant Number 27676). SSR and AAP were supported by funds from the California Tobacco-Related Disease Research Program (TRDRP; Grant Number 28IR-0070 and T29KT0526). AA receives support from K02DA032573. VH receives support from P60AA03510. DMD acknowledges support from K02AA018755. JLM is supported by K01DA037914. ALSPAC: We are extremely grateful to all the families who took part in this study, the midwives for their help in recruiting them, and the whole ALSPAC team, which includes interviewers, computer and laboratory technicians, clerical workers, research scientists, volunteers, managers, receptionists, and nurses. The UK Medical Research Council and Wellcome (Grant ref: 102215/2/13/2) and the University of Bristol provide core support for ALSPAC. This publication is the work of the authors and EMC, ACE, and AA will serve as guarantors for the contents of this paper. A comprehensive list of grants funding is available on the ALSPAC website (http://www.bristol.ac.uk/alspac/external/documents/grant-acknowledgements.pdf). This research was specifically funded by NIH grants AA021399, AA018333, and AA022537. ACE was further supported by a Young Investigator award from the Brain and Behavior Foundation (Grant Number 24864). GWAS data were generated by Sample Logistics and Genotyping Facilities at Wellcome Sanger Institute and LabCorp (Laboratory Corporation of America) using support from 23andMe. COGA: The Collaborative Study on the Genetics of Alcoholism (COGA), Principal Investigators B. Porjesz, V. Hesselbrock, H. Edenberg, L. Bierut, includes eleven different centers: University of Connecticut (V. Hesselbrock); Indiana University (H.J. Edenberg, J. Nurnberger Jr., T. Foroud; Y. Liu); University of Iowa (S. Kuperman, J. Kramer); SUNY Downstate (B. Porjesz); Washington University in St. Louis (L. Bierut, J. Rice, K. Bucholz, A. Agrawal); University of California at San Diego (M. Schuckit); Rutgers University (J. Tischfield, A. Brooks); Department of Biomedical and Health Informatics, The Children's Hospital of Philadelphia; Department of Genetics, Perelman School of Medicine, University of Pennsylvania, Philadelphia PA (L. Almasy), Virginia Commonwealth University (D. Dick), Icahn School of Medicine at Mount Sinai (A. Goate), and Howard University (R. Taylor). Other COGA collaborators include: L. Bauer (University of Connecticut); J. McClintick, L. Wetherill, X. Xuei, D. Lai, S. O'Connor, M. H. Plawecki, S. Lourens (Indiana University); G. Chan (University of Iowa; University of Connecticut); J. Meyers, D. Chorlian, C. Kamarajan, A. Pandey, J. Zhang (SUNY Downstate); J.-C. Wang, M. Kapoor, S. Bertelsen (Icahn School of Medicine at Mount Sinai); A. Anokhin, V. McCutcheon, S. Saccone (Washington University); J. Salvatore, F. Aliev, B. Cho (Virginia Commonwealth University); and Mark Kos (University of Texas Rio Grande Valley). A. Parsian and H. Chen are the NIAAA Staff Collaborators. We continue to be inspired by our memories of Henri Begleiter and Theodore Reich, founding PI and Co-PI of COGA, and also owe a debt of gratitude to other past organizers of COGA, including Ting-Kai Li, P. Michael Conneally, Raymond Crowe, and Wendy Reich, for their critical contributions. This national collaborative study is supported by NIH Grant U10AA008401 from the National Institute on Alcohol Abuse and Alcoholism (NIAAA) and the National Institute on Drug Abuse (NIDA). Generation Scotland: Generation Scotland received core support from the Chief Scientist Office of the Scottish Government Health Directorates [CZD/16/6] and the Scottish Funding Council [HR03006]. Genotyping of the GS:SFHS samples was carried out by the Genetics Core Laboratory at the Wellcome Trust Clinical Research Facility, Edinburgh, Scotland and was funded by the Medical Research Council UK and the Wellcome Trust (Wellcome Trust Strategic Award ‘STratifying Resilience and Depression Longitudinally’ (STRADL) Reference 104036/Z/14/Z). AMM received support from an MRC Mental Health Data Pathfinder Grant (reference MC_PC_17209).
Financial support
Dr McIntosh has received research support from Eli Lilly, Janssen, Pfizer, and the Sackler Foundation. The remaining authors report no potential conflicts of interest to disclose.


