Introduction
Major depressive disorder (MDD) is a leading cause of disability worldwide, affecting 350 million people each year (World Health Organization, 2008). The conditions of more than half of patients with MDD become chronic or recurrent after the first depressive episode, resulting in huge economic and medical burdens (Cuijpers, Beekman, & Reynolds, Reference Cuijpers, Beekman and Reynolds2012). Although substantial efforts have been made in the past decade, the pathophysiological mechanism of MDD remains largely unknown.
Resting-state functional magnetic resonance imaging (rs-fMRI) is increasingly emerging as a promising tool to delineate spontaneous brain activity of the human brain, which has prominent advantages in clinical research due to the minimal need for cooperation from patients. Previous studies have demonstrated altered resting-state spontaneous brain activity in MDD via various approaches (Fitzgerald, Laird, Maller, & Daskalakis, Reference Fitzgerald, Laird, Maller and Daskalakis2008; Geng et al., Reference Geng, Yan, Shi, Chen, Mo, Shao and Lu2019; Guo et al., Reference Guo, Liu, Xue, Yu, Ma, Tan and Zhao2011a, Reference Guo, Sun, Liu, Xu, Wu, Liu and Zhao2011b; Xia et al., Reference Xia, Si, Sun, Ma, Liu, Wang and Group2019), among which regional homogeneity (ReHo) shows high reproducibility (Zang, Jiang, Lu, He, & Tian, Reference Zang, Jiang, Lu, He and Tian2004) and has been repeatedly reported to be changed in MDD (Lai, Reference Lai2018; Sun et al., Reference Sun, Luo, Yuan, Zhang, He, Yao and Xiao2018; Xia et al., Reference Xia, Si, Sun, Ma, Liu, Wang and Group2019). However, ReHo can reflect only static temporal synchronization of spontaneous brain activity among nearby voxels, which is inconsistent with the concept that spontaneous brain activity is a time-dependent dynamic process (Hutchison et al., Reference Hutchison, Womelsdorf, Allen, Bandettini, Calhoun, Corbetta and Chang2013). In recent years, dynamic functional connectivity has been used to assess large-scale dynamic patterns of temporal synchronization of spontaneous brain activity between spatially remote brain regions/voxels (Friston, Reference Friston2011; Hutchison et al., Reference Hutchison, Womelsdorf, Allen, Bandettini, Calhoun, Corbetta and Chang2013), and its changes have been reported in neuropsychiatric diseases, including schizophrenia (Sakoglu et al., Reference Sakoglu, Pearlson, Kiehl, Wang, Michael and Calhoun2010), Alzheimer's disease (de Vos et al., Reference de Vos, Koini, Schouten, Seiler, van der Grond, Lechner and Rombouts2018), epilepsy (Liu et al., Reference Liu, Wang, Li, Wang, Li, Zhang and Chen2017), and MDD (Demirtaş et al., Reference Demirtaş, Tornador, Falcón, López-Solà, Hernández-Ribas, Pujol and Deco2016; Han et al., Reference Han, Wang, He, Sheng, Zou, Li and Chen2019; Kaiser et al., Reference Kaiser, Whitfield-Gabrieli, Dillon, Goer, Beltzer, Minkel and Pizzagalli2016; Qiu et al., Reference Qiu, Xia, Cheng, Yuan, Kuang, Bi and Gong2018). However, few studies have focused on the dynamic properties of regional temporal synchronization of spontaneous brain activity among nearby voxels, which can be measured by dynamic ReHo (dReHo). Furthermore, no studies have investigated dReHo changes in MDD.
MDD has an estimated heritability of approximately 37% (Sullivan, Neale, & Kendler, Reference Sullivan, Neale and Kendler2000); however, reproducible risk loci of MDD rarely have been identified in previous genome-wide association studies (GWASs) (Howard et al., Reference Howard, Adams, Shirali, Clarke, Marioni, Davies and McIntosh2018, Reference Howard, Adams, Clarke, Hafferty, Gibson, Shirali and McIntosh2019, Sullivan et al., Reference Sullivan, de Geus, Willemsen, James, Smit, Zandbelt and Penninx2009; Wray et al., Reference Wray, Ripke, Mattheisen, Trzaskowski, Byrne and Abdellaoui2018), possibly due to the inadequate sample size. As intermediate phenotypes, neuroimaging features of MDD are theoretically closer to genetic substrates of MDD (Gottesman & Gould, Reference Gottesman and Gould2003). In addition, gene expression is theoretically closer to neuroimaging features of MDD than genetic variants. Therefore, several studies have used cross-sample or cross-region spatial correlation analysis to investigate associations between brain gene expression and neuroimaging features of major psychiatric disorders and have achieved great success (Liu, Tian, Li, Li, & Zhuo, Reference Liu, Tian, Li, Li and Zhuo2019; Morgan et al., Reference Morgan, Seidlitz, Whitaker, Romero-Garcia, Clifton, Scarpazza and Bullmore2019; Romero-Garcia, Warrier, Bullmore, Baron-Cohen, & Bethlehem, Reference Romero-Garcia, Warrier, Bullmore, Baron-Cohen and Bethlehem2019; Romme, de Reus, Ophoff, Kahn, & van den Heuvel, Reference Romme, de Reus, Ophoff, Kahn and van den Heuvel2017). Nevertheless, no transcription-neuroimaging association studies have been carried out to identify genes whose brain expression profiles are correlated with dReHo changes in MDD.
We hypothesize that brain gene expression is related to regional spontaneous brain activity changes in MDD. Here, gene expression data were derived from six postmortem brains provided by the Allen Human Brain Atlas (AHBA) (Hawrylycz et al., Reference Hawrylycz, Miller, Menon, Feng, Dolbeare, Guillozet-Bongaarts and Lein2015), and regional spontaneous brain activity was assessed by dReHo since it is more consistent with the fact that brain activity is dynamic (Hutchison et al., Reference Hutchison, Womelsdorf, Allen, Bandettini, Calhoun, Corbetta and Chang2013). We then identified genes associated with dReHo changes in MDD by performing cross-sample spatial correlations between gene expression data from the postmortem AHBA brains and case-control dReHo differences from living human brains. Finally, the function of the identified genes associated with dReHo changes in MDD was explored by several enrichment analyses. An overview of the analytical framework is summarized in Fig. 1.
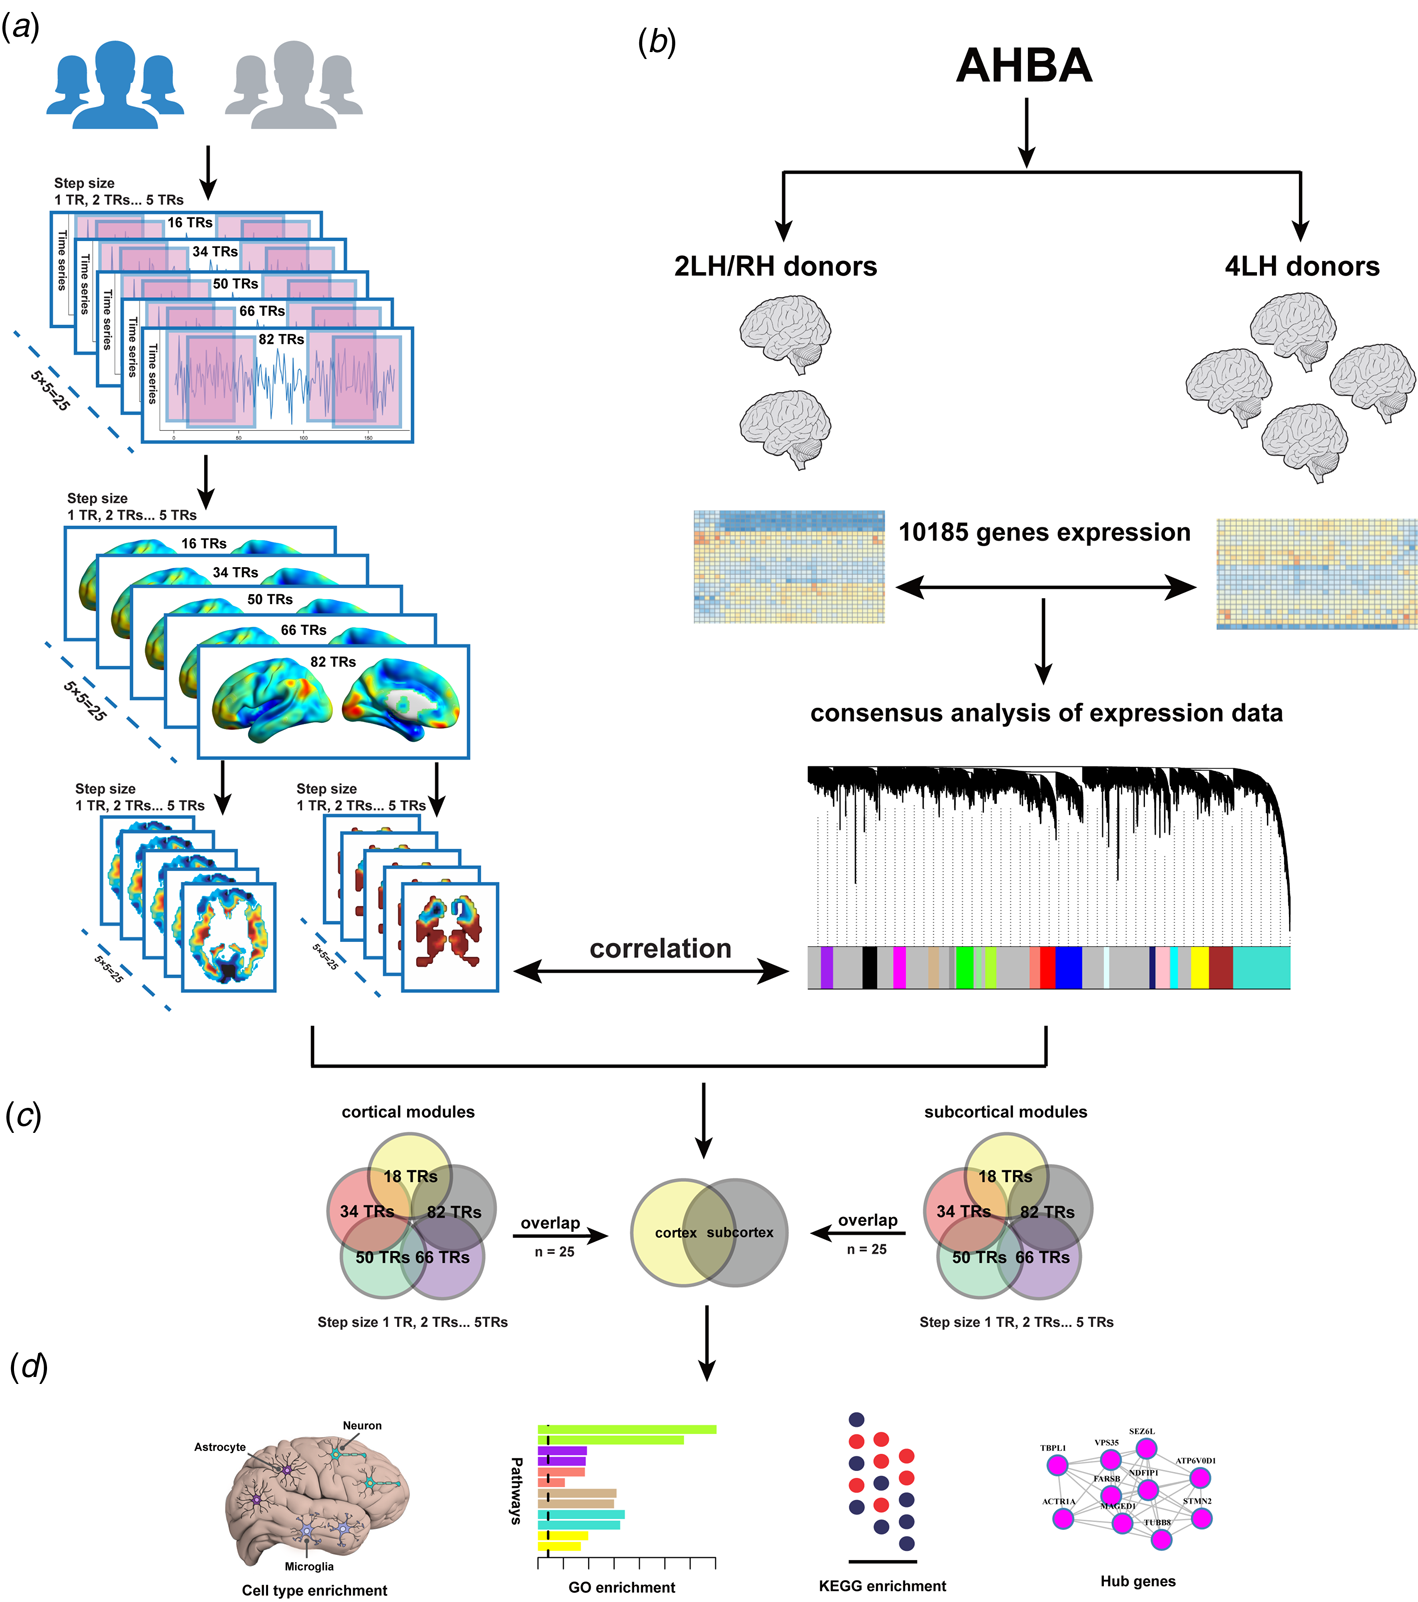
Fig. 1. Overview of the analysis pipeline. (a) a sliding window method was utilized to compute dReHo, and between-group comparisons of dReHo maps were performed; (b) the association between dReHo differences and gene expression from the AHBA was explored; (c) stable cortical and subcortical modules related to MDD were identified; (d) enrichment analysis was applied for these modules. dReHo, dynamic regional homogeneity; AHBA, Allen Human Brain Atlas.
Materials and methods
Subjects
Sixty-seven first-episode, treatment-naïve patients with MDD were recruited from Tianjin Medical University General Hospital. MDD was diagnosed based on the diagnostic criteria of the Structure Clinical Interview of DSM-IV (SCID). Following previous studies (Khan, Bhat, Kolts, Thase, & Brown, Reference Khan, Bhat, Kolts, Thase and Brown2010), we recruited only MDD patients with Hamilton Depression Rating Scale-17 (HDRS-17) scores ⩾18. The Hamilton Anxiety Rating Scale-14 (HARS-14) was used to evaluate anxiety symptoms in these patients, but we did not set a cut-off value. Moreover, patients with other psychiatric diseases, including schizophrenia, bipolar disorder, mental retardation and personality disorder, were excluded. A total of 69 age- and sex-matched healthy controls were recruited from the local community, and the SCID Non-Patient Edition was used to confirm that they were free of any psychiatric disorders. Common exclusion criteria for all participants were (1) age younger than 18 years or older than 65 years; (2) left-handedness; (3) the presence of organic intracranial lesions; (4) any history of comorbid alcohol or drug abuse; (5) poor image quality; and (6) MRI contradictions. The Ethics Institution of Tianjin Medical University General Hospital approved the study protocol and written informed consent was obtained from participants.
Image acquisition
All MRI images were obtained using a 3.0-Tesla Discovery MR750 scanner (General Electric, Milwaukee, WI). Foam paddings and earplugs were utilized to minimize head movement and reduce noise. The rs-fMRI data were obtained using a single-shot gradient-recalled-echo echo-planar-imaging (SS-GRE-EPI) sequence with the following parameters: repetition time (TR) = 2000 ms; echo time (TE) = 30 ms; field of view (FOV) = 220 mm × 220 mm; matrix = 64 × 64; flip angle (FA) = 90°; slice thickness = 3 mm, no gap; 36 interleaved transverse slices; and 180 volumes. During the fMRI scanning, subjects were asked to close their eyes, hold still, think of nothing in particular, and not fall asleep. Sagittal 3D T1-weighted images were acquired by a brain volume sequence using the following parameters: TR = 8.14 ms; TE = 3.17 ms; inversion time = 450 ms; FOV = 256 mm × 256 mm; matrix = 256 × 256; FA = 12°; slice thickness = 1 mm, no gap; and 188 slices.
Image preprocessing
The imaging quality of each subject was carefully examined, and subjects with poor imaging quality were excluded. The rs-fMRI data were preprocessed using the Data Processing Assistant for Resting-State fMRI (DPARSF) (Chao-Gan & Yu-Feng, Reference Chao-Gan and Yu-Feng2010) based on Statistical Parametric Mapping 12 (http://www.fil.ion.ucl.ac.uk/spm). Briefly, the first ten volumes were discarded to allow the signal to reach equilibrium and the remaining 170 volumes were corrected for temporal differences between slices and head motion. Participants with maximum displacement >2.0 mm and maximum rotation >2.0° were excluded from the subsequent analyses. In addition, the mean framewise displacement (FD) (Van Dijk, Sabuncu, & Buckner, Reference Van Dijk, Sabuncu and Buckner2012) was calculated. Subsequently, individual structural images were co-registered to the mean functional image, and then the transformed structural images were segmented into grey matter, white matter and cerebrospinal fluid. Based on these segmented images, the normalization parameters from individual native space to Montreal Neurological Institute (MNI) space were estimated by the Diffeomorphic Anatomical Registration Through Exponentiated Lie algebra (DARTEL) tool (Ashburner, Reference Ashburner2007). The motion-corrected functional imaging data were normalized to MNI space using these normalization parameters and resampled to 3-mm cubic voxels. Spurious variances were removed by regression, including linear drift, Friston-24 head motion parameters (Friston, Williams, Howard, Frackowiak, & Turner, Reference Friston, Williams, Howard, Frackowiak and Turner1996), and signals from white matter and cerebrospinal fluid. Finally, temporal bandpass filtering (0.01–0.08 Hz) was applied to reduce the effects of low-frequency drift and high-frequency noise.
dReHo calculation
dReHo was calculated using the sliding window approach with the Data Processing & Analysis of Brain Imaging (DPABI) toolbox (Yan, Wang, Zuo, & Zang, Reference Yan, Wang, Zuo and Zang2016). Since there is no consensus on the selection of window length and step size, we calculated individual dReHo maps (Fig. 1a and online Supplementary Table S1) based on 25 combinations of the two parameters (window lengths: 18, 34, 50, 66, 82 TRs; step sizes: 1, 2, 3, 4, 5 TRs) that have been used in prior studies (Hutchison & Morton, Reference Hutchison and Morton2015; Leonardi & Van De Ville, Reference Leonardi and Van De Ville2015; Li, Duan, Cui, Chen, & Liao, Reference Li, Duan, Cui, Chen and Liao2019; Li, Lu, & Yan, Reference Li, Lu and Yan2020; Liao et al., Reference Liao, Zhang, Mantini, Xu, Ji, Zhang and Lu2014). For each combination, ReHo was computed for each sliding window and then the standard deviation was calculated across these ReHo maps to characterize the dReHo. The dReHo maps were finally smoothed with a Gaussian kernel of 8-mm full width at half-maximum.
dReHo comparison
Voxel-wise two-sample t tests were performed to identify dReHo differences between the two groups in each combination (five window lengths and five step sizes), and 25 t-maps were generated while adjusting for age, sex and mean FD. Multiple comparisons were corrected by the topological false discovery rate (FDR) method (the initial height threshold: uncorrected p < 0.001; topological FDR: q < 0.05). The topological FDR is an extension of the Benjamini-Hochberg FDR (BH-FDR) and is specially designed to correct multiple comparisons in neuroimaging analyses (Chumbley, Worsley, Flandin, & Friston, Reference Chumbley, Worsley, Flandin and Friston2010). To reduce the influence of the selection of window lengths and step sizes on the dReHo differences between groups, we created a probability map to show highly consistent brain regions with significant differences in dReHo calculated by different parametric combinations. In addition, mean dReHo values of clusters with 100% probability were extracted to perform partial correlations between dReHo and clinical variables (HDRS, HARS and illness duration) in patients with MDD while adjusting for age, sex, and mean FD. Given that whole-brain coverage including the cerebellum and brain stem was not available for all subjects, we restricted between-group comparisons to within the cerebrum.
Gene expression data preprocessing
Publicly available gene expression data of six postmortem neurotypical adult brains were obtained from the AHBA database (Hawrylycz et al., Reference Hawrylycz, Lein, Guillozet-Bongaarts, Shen, Ng, Miller and Jones2012), which, in total, consists of normalized microarray expression data of more than 20 000 genes measured in 3702 brain samples. Among them, four donors had expression data only in the left hemisphere, and two donors had expression data in both hemispheres. Based on the newly proposed pipeline (Arnatkevic Iūtė, Fulcher, & Fornito, Reference Arnatkevic Iūtė, Fulcher and Fornito2019), we separately processed the two datasets and obtained two sample × gene expression matrices of 1196 × 10 185 from the four donors and 1209 × 10 185 from the two donors (Fig. 1b and online Supplementary Material). Here, the samples represent brain tissue samples, and the screening process of tissue samples is provided in online Supplementary Fig. S1.
Creation of gene modules
Weighted gene co-expression network analysis (WGCNA) is an effective tool that clusters genes into network modules and detects biologically meaningful results (Zhang & Horvath, Reference Zhang and Horvath2005). Therefore, we first constructed a signed network for each sample × gene expression matrix. Then, a WGCNA consensus network was created from two networks to identify common expression patterns across the two aforementioned expression matrices, and 19 gene modules were finally obtained (online Supplementary material, Supplementary Fig. S2 and Table S2). For each module, the expression pattern (a matrix represented by sample × number of genes in this module) was summarized by the first principal component, defined as the module eigengene (ME, number of samples × 1 vector).
Transcription-neuroimaging association analysis
To establish the sample correspondence between gene expression and neuroimaging data, we defined a 6-mm radius sphere centred at the MNI coordinate of each tissue sample and extracted the mean value on each t-statistical map of dReHo difference (25 t-statistical maps). Then, for each module, we calculated Pearson's correlation between the ME and the t-value across brain tissue samples. The correlation analysis was performed separately for the cortical and subcortical samples because of great differences in gene expression profiles between cortical and subcortical regions (Hawrylycz et al., Reference Hawrylycz, Lein, Guillozet-Bongaarts, Shen, Ng, Miller and Jones2012). Multiple comparisons were corrected using the BH-FDR method (q < 0.05). Gene modules with significant correlations between the ME and the t-value in cortical samples were defined as cortical modules, and subcortical modules were defined by the same approach. As shown in Fig. 1c, based on the results of correlation analyses, we first intersected the results of 25 combinations of dynamic parameters in cortical and subcortical modules, respectively. The cortical/subcortical modules that were correlated with all t-statistical maps derived from different combinations were considered stable modules. Then, the stable cortical and subcortical gene modules were also intersected to identify shared and distinct gene modules for cortical and subcortical regions.
Enrichment analysis
Enrichment analysis (Fig. 1d) for stable modules was mainly performed by the web server g: Profiler (https://biit.cs.ut.ee/gprofiler), including the Gene Ontology (GO) and Kyoto Encyclopedia of Genes and Genomes (KEGG) databases and putative transcription factor binding sites (TFBS) from the TRANSFAC database (Reimand et al., Reference Reimand, Arak, Adler, Kolberg, Reisberg, Peterson and Vilo2016). All the 10 185 included genes were defined as a background gene set, and the AutoAnnotate Cytoscape application (Shannon et al., Reference Shannon, Markiel, Ozier, Baliga, Wang, Ramage and Ideker2003) was used to show the enrichment results. In addition, cell-type enrichment analysis was conducted using Fisher's exact test with a specificity index probability (pSI) (Dougherty, Schmidt, Nakajima, & Heintz, Reference Dougherty, Schmidt, Nakajima and Heintz2010) of 0.05 (BH-FDR correction) based on previously published gene expression data for different cell types of the human brain (Zhang et al., Reference Zhang, Sloan, Clarke, Caneda, Plaza, Blumenthal and Barres2016).
Results
Demographic information and clinical characteristics
After excluding two subjects (one patient and one control) due to poor image quality and three subjects (one patient and two controls) due to excessive head motion, 65 MDD patients and 66 healthy controls were finally included in this study. The demographic and clinical data of these subjects are displayed in online Supplementary Table S3. The two groups did not show significant differences in sex (chi-squared test, p = 0.78), age (two-sample t test, p = 0.65), or mean FD (two-sample t test, p = 0.31).
Case-control difference in dReHo
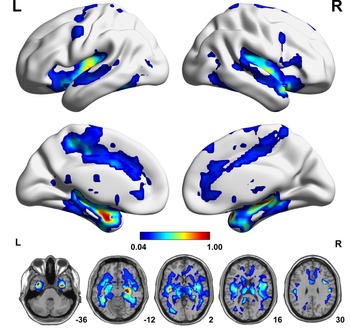
Based on individual dReHo maps from each of the 25 parametric combinations, we compared voxel-wise dReHo differences between patients with MDD and healthy controls (q < 0.05, topological FDR corrected), from which we created a probability map (Fig. 2) to show the probability of a given voxel with a significant intergroup difference in these comparisons. Compared with healthy controls, patients with MDD consistently (100% probability) showed significantly decreased dReHo in both fusiform gyri and the right hippocampus and temporal pole (superior part) (Fig. 2 and online Supplementary Table S4). We did not find significantly increased dReHo in any comparisons in patients with MDD relative to healthy controls. We also tested the impact of HARS score on our results, but we did not find significant effects (online Supplementary Results and Supplementary Fig. S3).
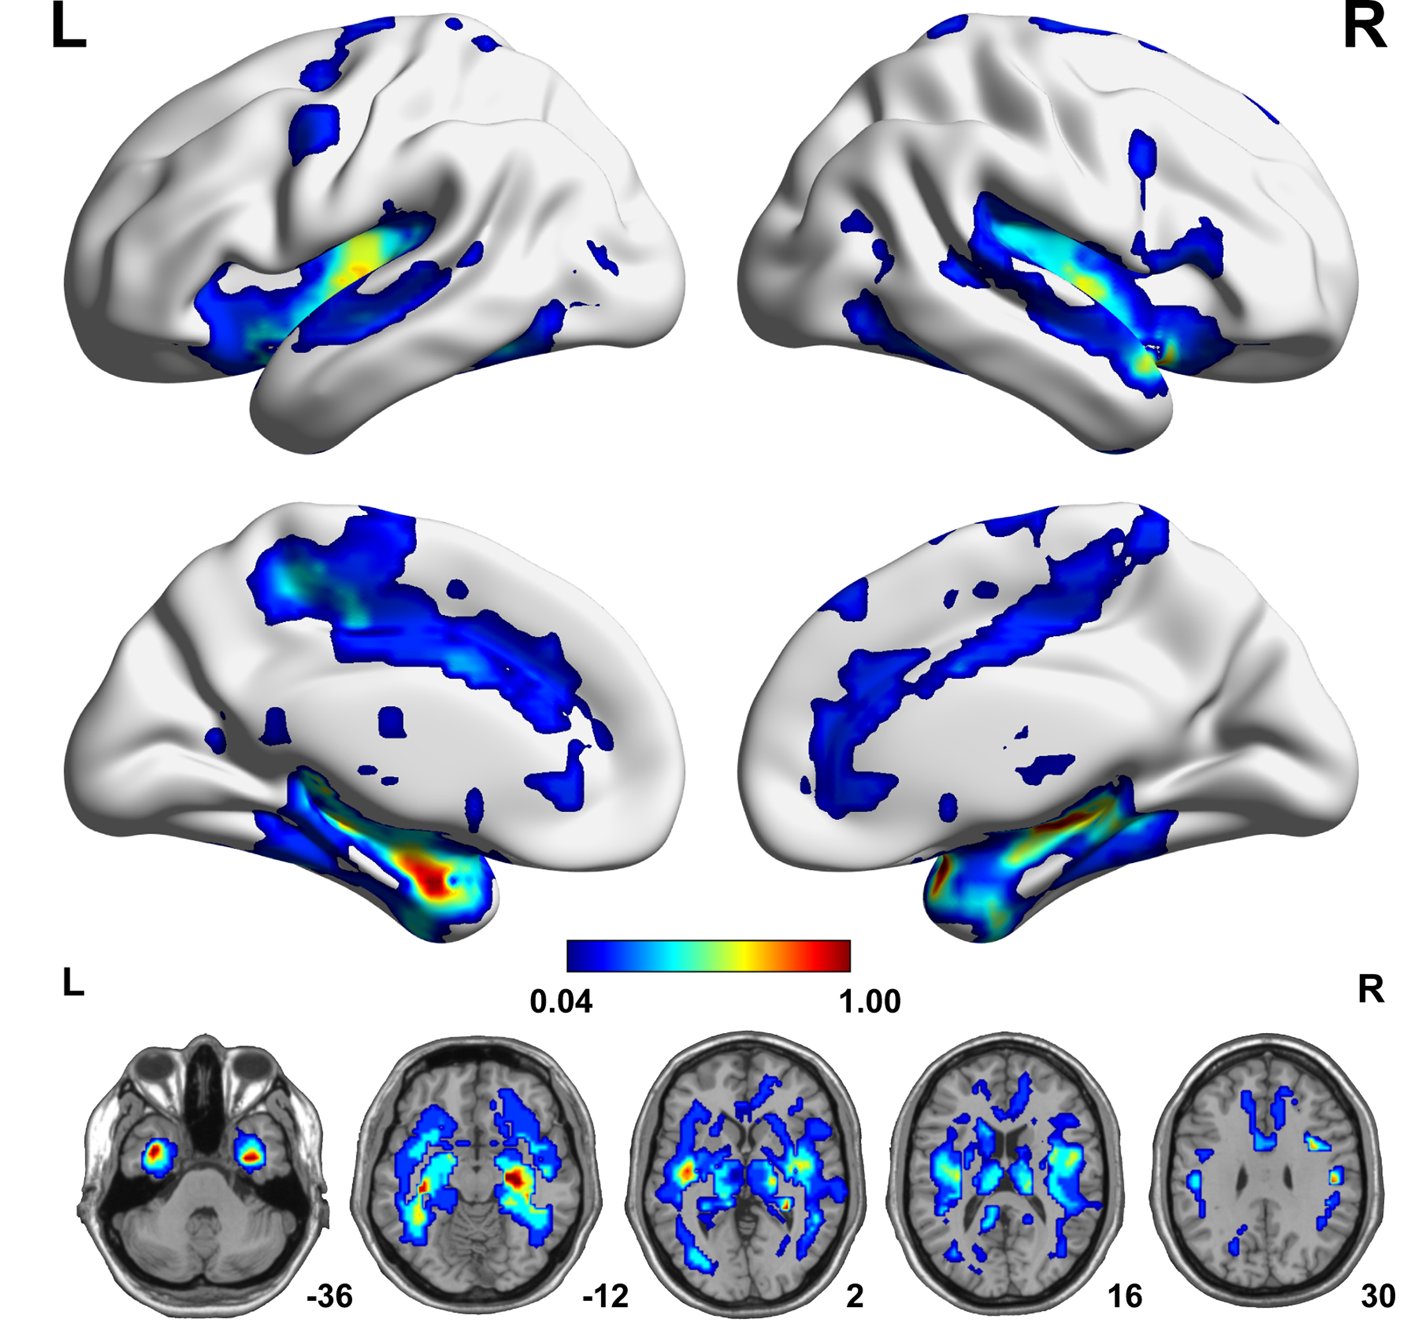
Fig. 2. A probability map showing brain voxels with significant dReHo differences (q < 0.05, topological FDR corrected) between the MDD and HC groups. The colour bar represents the probability of a given voxel showing a significant intergroup difference in the 25 comparisons. Each comparison is performed on individual dReHo maps calculated by a distinct combination of dynamic parameters. FDR, false discovery rate; HC, healthy control; L, left; MDD, major depressive disorder; R, right.
Correlations between dReHo and clinical variables
The mean dReHo values of clusters with consistent (100% probability) reduction in patients with MDD were extracted. Partial correlation analysis was conducted between the mean dReHo values and clinical variables, including HARS and HDRS scores and illness duration, while adjusting for age, sex, and FD. No significant correlations (all p > 0.05) were found between dReHo and any clinical variables in patients with MDD.
Transcription-neuroimaging associations
Nineteen consensus modules were identified from WGCNA analysis based on expression data from four left-hemispheric and two bi-hemispheric brain samples (Fig. 3). Cross-sample Pearson's correlation was calculated between MEs of each module and dReHo differences to show the consistent correlation pattern of modules across the two expression datasets and the 25 combinations. The results showed that there were 16 consistently significant MDD-related modules, 14 of which belonged to cortical modules and six of which belonged to subcortical modules (overlapping four modules) (Figs. 4 and 5a). The positive correlation means that brain regions with significant dReHo reduction in MDD show higher gene expression, and the negative correlation means that those regions show lower gene expression (online Supplementary Figs. S4 and S5).

Fig. 3. Consensus analysis of expression data. (a) WGCNA dendrogram showing consensus modules based on the topological co-expression of 10 185 genes from four left hemispheres and two whole brains. (b) To avoid the scenario that co-expression networks constructed accidentally based on the set of WGCNA parameters used, we rebuilt networks by applying different parameter sets. The final consensus modules used in this study were conserved among the majority of the tests with different parameter sets. WGCNA, weighted gene co-expression network analysis.

Fig. 4. Correlations between gene expression and dReHo changes in MDD. (a) The heatmap shows Pearson's correlation coefficients between MEs of gene modules and t values of case-control dReHo differences in cortical samples. Each column represents a gene module (n = 18), and each row represents a case-control dReHo difference map derived from dReHo maps calculated with a given combination (n = 25) of window size and step size. In the rows of the upper half, gene expression data were obtained from two AHBA donors with whole-brain coverage; in the rows of the lower half, however, they were obtained from four AHBA donors only with left-brain coverage. (b) The heatmap shows correlations in subcortical samples. * indicates that the correlation reaches the significance of q < 0.05 (BH-FDR corrected) in all analyses. The colour bar represents Pearson's correlation coefficients between MEs of gene modules and t values of case-control dReHo differences.

Fig. 5. Enrichment of genes in stable modules and hub genes. (a) Counts of MDD-related cortical and subcortical modules. (b) KEGG enrichment for genes in all modules (top two pathways shown for each module). All obtained results could pass q < 0.05 (BH-FDR correction) and showed odds ratios >1. (c) GO enrichment for genes in all modules (top two pathways shown for each module marked by different colours). (d) Cell-type marker enrichment of genes in cortical modules. The bubble size represents significance for – log10FDR (BH-FDR correction), and the bubble colour represents whether the module is significant or not. (e) The top 10 hub genes are shown for all MDD-related modules. Edges are weighted by the strength of correlation between nodes (genes). KEGG, Kyoto Encyclopedia of Genes and Genomes; GO, Gene Ontology.
Enrichment analysis
GO enrichment analysis was conducted for each preserved module (see detailed results in online Supplementary Data Table S1). Genes in these preserved modules were enriched for pathways related to synaptic signalling, adenosine triphosphate synthesis, epithelial regulation, immune response, the regulation of transcription and translation, protein localization and metabolic regulation, ion channel activities, mitochondrial function, axon ensheathment and central nervous system development. KEGG enrichment analysis revealed that genes in these preserved modules were related to the glutamatergic system, serotonergic system, neurodegenerative diseases (such as Alzheimer's disease, Parkinson disease and Huntington disease), autoimmune diseases and circadian rhythms (Figs. 5b, c, online Supplementary Tables S5 and S6). As illustrated in Fig. 5d and online Supplementary Table S7, there were seven preserved modules specifically enriched for neurons, two for astrocytes, two for microglia, one for endothelial cells and one for oligodendrocytes. Moreover, TFBS enrichment showed that 11 out of 16 preserved modules were related to transcriptional control (online Supplementary Table S8 and Data Table S1).
Discussion
To our knowledge, this is the first attempt to apply dReHo to investigate regional temporal synchronization changes in spontaneous brain activity in first-episode, treatment-naïve patients with MDD and, in parallel, to directly correlate brain gene expression with case-control dReHo differences to explore gene modules associated with dReHo changes in MDD and to characterize the involved biological pathways.
In the present study, we observed that first-episode, treatment-naïve patients with MDD consistently showed significantly decreased dReHo in the fusiform gyrus, hippocampus and temporal pole, which were present in all 25 combinations of window lengths and step sizes. The fusiform gyrus is involved in the processing of emotional faces (Kanwisher, McDermott, & Chun, Reference Kanwisher, McDermott and Chun1997; Weiner & Grill-Spector, Reference Weiner and Grill-Spector2010). Thus, our finding of reduced dReHo in the fusiform gyrus supports and extends previous reports of the structural and functional impairments in this area in MDD (Schmaal et al., Reference Schmaal, Hibar, Samann, Hall, Baune, Jahanshad and Veltman2017; Truong et al., Reference Truong, Minuzzi, Soares, Frey, Evans, MacQueen and Hall2013). As an association area, the temporal pole is involved in various high-level cognitive functions, such as facial recognition (Olsson & Ochsner, Reference Olsson and Ochsner2008), memory (Munoz-Lopez, Mohedano-Moriano, & Insausti, Reference Munoz-Lopez, Mohedano-Moriano and Insausti2010), and language processing (Hickok & Poeppel, Reference Hickok and Poeppel2007). This structure also plays a role in emotion regulation and the theory of mind mainly by interacting with the amygdala and orbital frontal cortex (Frith & Frith, Reference Frith and Frith2010), which also showed a high probability of having decreased dReHo in patients with MDD. Moreover, this result extends the finding of the reduced static ReHo in MDD (Guo et al., Reference Guo, Sun, Liu, Xu, Wu, Liu and Zhao2011b; Liu et al., Reference Liu, Xu, Xu, Wang, Zhao, Lv and Du2010) to the impairment of regional dynamics of temporal synchronization of spontaneous brain activity in the disorder. It has been widely accepted that exposure to life stress is a major risk factor for MDD (McEwen, Reference McEwen2008), which is related to the fact that overwhelming stress can impair normal hippocampal function. An increasing number of studies have demonstrated that the hippocampus is highly sensitive to stress (Pittenger & Duman, Reference Pittenger and Duman2008), the most important environmental risk factor for the development of MDD (Kessler, Reference Kessler1997) and it is also the main target associated with the genetic risk of MDD (Xu et al., Reference Xu, Li, Qin, Jun Li, Zhuo, Liu and Yu2018). This is why our study and others always show hippocampal impairment in patients with MDD (Gold, Reference Gold2015; Liu et al., Reference Liu, Guo, Liu, Long, Ma, Xue and Chen2013). Taking previous and our findings together, we propose that functional impairment in the cognition- and emotion-regulatory networks is an important feature of MDD.
Unexpectedly, we did not find any significant correlations between dReHo values in the consistently reduced dReHo regions and clinical variables (HARS and HDRS scores and illness duration) in patients with MDD. The reasons for the non-significant findings are elusive, but they may be related to the clinical features of patients (first-episode, treatment-naïve), the lack of clinical assessments (such as rumination) reflecting other aspects of MDD, the relatively short illness duration, and others. Thus, the clinical value of dReHo changes in MDD needs to be clarified in future studies.
In contrast to previous GWASs that failed to identify reproducible risk loci of MDD (Howard et al., Reference Howard, Adams, Shirali, Clarke, Marioni, Davies and McIntosh2018, Reference Howard, Adams, Clarke, Hafferty, Gibson, Shirali and McIntosh2019; Sullivan et al., Reference Sullivan, de Geus, Willemsen, James, Smit, Zandbelt and Penninx2009; Wray et al., Reference Wray, Ripke, Mattheisen, Trzaskowski, Byrne and Abdellaoui2018), by combining an endophenotype (dReHo) of MDD and brain gene expression data, we found a dozen gene modules with various functions associated with dReHo changes in MDD, indicating that MDD may develop via complex polygenetic and polypathway mechanisms. Gene expression profiles in both cortical and subcortical areas, in multiple cell types, in different biological functions and pathways might be related to the development of MDD. Gene expression in both cortical and subcortical areas was associated with dReHo changes in MDD, mimicking the pattern of the brain structural and functional changes in this disorder (Chen et al., Reference Chen, Liu, Xun, Chen, Hu, Guo and Zhao2012; Liu et al., Reference Liu, Guo, Liu, Long, Ma, Xue and Chen2013; Ma et al., Reference Ma, Ding, Li, Guo, Long, Liu and Chen2012; Vasic, Walter, Hose, & Wolf, Reference Vasic, Walter, Hose and Wolf2008). The co-existence of the shared and specific gene modules between cortical and subcortical areas reflects the complexity of the molecular substrates of MDD. This complexity was also supported by the involvement of the related gene modules in various cell types, biological functions and pathways. For example, several modules enriched for neurons were mainly implicated in synaptic transmission and neuronal development, indicating that neuronal impairment and maldevelopment may be possible mechanisms of MDD (Krishnan & Nestler, Reference Krishnan and Nestler2008; Willner, Scheel-Kruger, & Belzung, Reference Willner, Scheel-Kruger and Belzung2013). Several modules enriched for microglia are mainly implicated in the immune system, which is consistent with the stress model of MDD via microglial activation and the inflammatory response (Felger & Lotrich, Reference Felger and Lotrich2013; Hodes, Kana, Menard, Merad, & Russo, Reference Hodes, Kana, Menard, Merad and Russo2015; Setiawan et al., Reference Setiawan, Wilson, Mizrahi, Rusjan, Miler, Rajkowska and Meyer2015). Since dReHo is calculated based on blood-oxygen-level-dependent (BOLD) signals, the association of dReHo changes in MDD with the expression profiles of gene modules enriched for neurons, astrocytes and endothelial cells is consistent with the neurovascular coupling theory of BOLD signals because these cells are the main components of the neurovascular unit (Iadecola, Reference Iadecola2017; Muoio, Persson, & Sendeski, Reference Muoio, Persson and Sendeski2014). These findings indicate that impaired neurovascular coupling may also contribute to depressive symptoms. In addition, the enrichment of MDD-related genes for neurodegenerative diseases may be a reflection of the shared assaulting target (such as hippocampus) by the risk factors for these disorders (Xu et al., Reference Xu, Li, Qin, Jun Li, Zhuo, Liu and Yu2018). Moreover, hub gene detection can provide candidate genes for further studies. For example, several immune-related genes were identified by hub gene detection, which may be used to explore the immune mechanism of MDD.
At least two limitations should be considered when interpreting our findings. The first limitation is that gene expression data and brain imaging data were not obtained from the same subjects. The identified correlations between gene expression data from six postmortem brains and brain imaging data from other living human brains may be correct only if gene expression profiles are highly conserved across individuals. That is, this study would inevitably miss genes or gene modules with great individual differences. Since gene expression profiles are dependent on age, sex, and ethnicity (Mogil et al., Reference Mogil, Andaleon, Badalamenti, Dickinson, Guo, Rotter and Wheeler2018; Somel et al., Reference Somel, Guo, Fu, Yan, Hu, Xu and Khaitovich2010), the mismatch of age, sex, and ethnicity between expression and imaging data may introduce bias to this study. Another limitation is the impact of the selection of dynamic parameters on the calculation of dReHo. Although we used 25 combinations of dynamic parameters to identify consistent results, the development of strategies to select the optimal combination of parameters is still critically important.
In this study, we found that first-episode, treatment-naïve patients with MDD showed reduced dReHo in the regulatory networks of cognition and emotion, indicating that functional abnormalities in these networks are important features of MDD. The case-control differences in dReHo showed replicable spatial correlations with the expression profiles of gene modules associated with various cell types, biological functions and pathways, indicating that MDD may develop via complex polygenetic and polypathway mechanisms.
Supplementary material
The supplementary material for this article can be found at https://doi.org/10.1017/S0033291720003876.
Acknowledgements
We thank the Allen Institute for Brain Science founders and staff who supplied the brain expression data. This study was funded by the National Key Research and Development Program of China (2018YFC1314300), the National Natural Science Foundation of China (82030053 and 82072001), the Tianjin Key Technology R&D Program (17ZXMFSY00090), and the Natural Science Foundation of Tianjin Municipal Science and Technology Commission (18JCQNJC10900).
Author contributions
Kaizhong Xue and Sixiang Liang made substantial contributions to the conception and design of the work and to the acquisition, analysis, and interpretation of data, and they drafted the manuscript. Bingbing Yang, Dan Zhu and Yingying Xie helped draft the manuscript. Wen Qin and Feng Liu critically revised the manuscript for important intellectual content. Yong Zhang and Chunshui Yu approved the final version of the manuscript to be published and agreed to be accountable for all aspects of the work, ensuring that questions related to the accuracy or integrity of any part of the work were appropriately investigated and resolved. All authors read, critically revised, and approved the manuscript.
Conflict of interest
None.
Ethical standards
The authors assert that all procedures contributing to this work comply with the ethical standards of the relevant national and institutional committees on human experimentation and with the Helsinki Declaration of 1975, as revised in 2008.