


Introduction
Researchers in the fields of psychiatry and psychology are fundamentally interested in the nature of individual differences that explain variability observed among people, objects, relationships and other entities. The forms of heterogeneity that are of interest are features of observations obtained from experimental, psychopharmacological, physiological, clinical, genetic, epidemiological and psychometric data. Latent variable modeling is a flexible analytical approach that allows researchers to study patterns of observations in data and make inferences about unobserved sources of population heterogeneity. The flexibility of latent variable modeling also allows researchers to study patterns of observations in data in relation to other external variables including covariates and distal outcomes. Latent variable mixture modeling (LVMM) is an extension of latent variable modeling to occasions when researchers are interested in testing hypotheses about categorical sources of population heterogeneity within a dataset. The purpose of this review is to provide a primer on LVMM and illustrate the use of LVMM by analysing cross-sectional data on psychotic experiences.
A brief primer on LVMMs
Researchers interested in the sources of individual differences are faced with an added conundrum of distinguishing among kinds of latent heterogeneity, that is, whether the observed pattern of responses is best explained by a few set dimensions or domains or non-arbitrary boundaries that distinguish ‘types’ of responders. The LVMM modeling framework provides tools that allows the researcher to sort cases into homogeneous subgroups of respondents that are more similar to each other than other subgroups. LVMM allows the researchers to directly test the comparative viability of alternate conjectures of the number of subgroups that underpin observations in the data. Recent analytic strategies also allow researchers to distinguish data with: (1) a categorical latent structure – that is, the observed distribution comprises two or more latent categories or subgroups of responders; (2) a dimensional structure – wherein observations subsume a single population and are best explained by one or more latent dimensions; and (3) a hybrid structure with observations explained by categorical and dimensional sources of heterogeneity.
Fundamentally, all latent variable models involve mathematical representations of the relation between latent variables and observed variables (Muthén & Muthén, Reference Muthén and Muthén2008). Models investigated depend on the distribution of the observations (dichotomous, ordered/unordered categorical, continuous, count, and mixed) and latent variable, and the cross-sectional v. longitudinal nature of the data. For example, latent class analysis (LCA) models categorical latent variables with categorical cross-sectional observations. Latent profile analysis is an extension of LCA to situations in which the indicator variables are continuous rather than categorical (Marsh et al. Reference Marsh, Lüdtke, Trautwein and Morin2009). Factor analysis models dimensional latent variables whereas LVMMs involve at least one categorical latent variable. Whereas individuals are represented along dimensions in factor analysis, mixture models assign cases into classes or subgroups. In LVMM, posterior probabilities, which represent the probability that an individual belongs to each class, are obtained and used to infer the correct class membership. It is expected that posterior probabilities may be non-zero for many classes (i.e. partial membership); however, individuals are assigned to the class with which they have the highest probability.
More complex latent variable models may incorporate causal or path relations (structural equation models, structural equation mixture models) or combine multiple latent variable models into hybrid models [e.g. factor mixture models (FMMs), growth mixture models] (Hoyle, Reference Hoyle2012). Fig. 1 provides a decision tree for selecting among several psychometric models for studying heterogeneity in datasets.
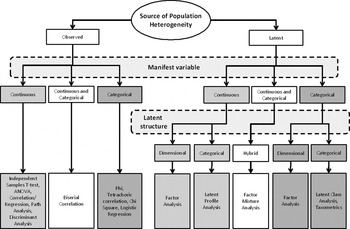
Fig. 1. A decision tree for selecting among different psychometric models for studying heterogeneity in datasets. ANOVA, Analysis of variance.
Previous reviews that discussed the application of latent variable models in psychiatry or psychology research (Raykov et al. Reference Raykov, Tomer and Nesselroade1991; Crowley & Fan, Reference Crowley and Fan1997; MacCallum & Austin, Reference MacCallum and Austin2000; Curran & Hussong, Reference Curran and Hussong2003; Streiner, Reference Streiner2005, Reference Streiner2006; Nelson et al. Reference Nelson, Aylward and Steele2008) are often quite old or focus on specific latent variable methods. The more recent reviews include those by Masyn et al. (Reference Masyn, Henderson and Greenbaum2010), Sterba & Bauer (Reference Sterba and Bauer2010), Hallquist & Wright (Reference Hallquist and Wright2014) and Wright & Hallquist (Reference Wright and Hallquist2014). In this article we present a mixture modeling framework that allows a researcher to determine whether a psychiatric construct is best viewed as categorical, dimensional or both (such that it conforms to a hybrid model). This framework seeks evidence of the best structural model by comparing purely dimensional models using the general factor model to categorical models (see, for example, Kuo et al. Reference Kuo, Aggen, Prescott, Kendler and Neale2008; Ahmed et al. Reference Ahmed, Green, Goodrum, Doane, Birgenheir and Buckley2013, Reference Ahmed, Strauss, Buchanan, Kirkpatrick and Carpenter2015; Wright et al. Reference Wright, Krueger, Hobbs, Markon, Eaton and Slade2013; Eaton et al. Reference Eaton, Krueger, Docherty and Sponheim2014; Lubke & Miller, Reference Lubke and Miller2015). The current effort focuses on the modeling of cross-sectional data with LCA and factor mixture modeling. We will illustrate the use of mixture models to study the latent structure of psychotic symptoms using data from the National Comorbidity Survey (NCS; Kessler et al. Reference Kessler, McGonagle, Zhao, Nelson, Hughes, Eshleman, Wittchen and Kendler1994).
LCA
We begin with LCA, a statistical procedure that can be used to classify individuals into homogeneous subgroups or latent classes. The latent class model is essentially a regression of observed indicator variables onto a set of one or more latent class variables (with dummy-coded variables representing individual categories of the latent class variable). The latent class model can be configured for outcome indicators that are binary, polytomous, ordered/unordered categorical, count or a combination of these response types. LCA may be appropriate for occasions in which the researcher believes that sample heterogeneity is best explained by two or more subgroups. LCA can be used in such a context to determine the number of classes or subgroups of respondents needed to sufficiently explain the differences in observed response patterns (Geiser, Reference Geiser2013). LCA makes a strong assumption of local independence in which the latent class variable accounts for all observed variation and covariance patterns observed in the data. Within individual classes, there is zero covariance and dependence among the observed indicator variables. In practice, the local independence assumption may be unrealistic for many psychiatric and psychological constructs. For example, within clinical samples, symptoms such as hallucinations, delusions, depression and anxiety are often fairly correlated and may be apt to violate local independence assumptions in ordinary LCA. Alternate configurations of the latent class model may relax assumptions of local independence and allow some observed variables to covary within classes (Vermunt & Magidson, Reference Vermunt and Magidson2000). In such models, direct effects or correlated errors may be incorporated to account for non-zero dependence among pairs of observations. Models that relax the independence assumption may be more appropriate for psychiatric data and the researcher may consider such models instead of ordinary LCA. It is reasonable to, however, begin by fitting ordinary LCA to the data and compare with one with relaxed local independence assumptions. This will allow the validity of the local independence assumption to be checked for the class solution imposed on the data to adjudge the appropriateness of the ordinary LCA to the data. Independence assumptions can be checked through an examination of the bivariate residuals. More on LCA can be found from previous reviews (Muthén, Reference Muthén, Marcoulides and Schumacker2001; Hagenaars & McCutcheon, Reference Hagenaars and McCutcheon2002; Collins & Lanza, Reference Collins and Lanza2010).
One consideration in the application of LCA to psychiatric data is determining the number of classes to fit to the data or the class models to compare. It is helpful in this case to be informed by theoretical conjectures regarding the latent structure of the construct. LCA may provide a means to compare the relative viabilities of alternate conjectures regarding subtypes or subgroups. One common example is comparing a dimensional (one-class) hypothesis to dichotomous or polytomous conjectures. Many studies using LCA have chosen to compare several class solutions by progressively increasing the number of classes fitted on the data until a preferred solution is reached. However, fitting multiple structural models to the same data might inflate type 1 error rates for failing to reject less complex models. Therefore, the results may be less reliable using this approach.
FMMs
More recent investigations of subgroups in samples have used a collection of modeling techniques that represent a fusion of LCA and factor analysis (Yung, Reference Yung1997; Dolan & van der Maas, Reference Dolan and van der Maas1998; Arminger et al. Reference Arminger, Stein and Wittenberg1999; Vermunt & Magidson, Reference Vermunt, Magidson, Hagenaars and McCutcheon2002; Lubke & Muthén, Reference Lubke and Muthén2005; Muthén, Reference Muthén2006). This family of FMMs is advantageous because they are capable of representing categorical and dimensional state of affairs (Muthén, Reference Muthén2006). FMMs can provide the numbers of latent classes that best describe the data. FMMs can also provide factor scores, which may aid in determining whether differences across groups on indicators are best viewed as qualitative or quantitative through an examination of class differences in factor scores. FMMs are based on the premise that the observed relationship among a set of indicators is influenced by one latent class variable and one or more continuous factors. FMMs draw from LCA in their assumption that a latent class variable influences the observations in the population, but depart from LCA in that they do not assume local independence, but rather suggest that within classes, one or more factors influence the indicator variables, causing them to covary. As enumerated by Muthén and colleagues, FMMs vary in their degree of complexity (Lubke & Muthén, Reference Lubke and Muthén2005; Clark et al. Reference Clark, Muthén, Kaprio, D'Onofrio, Viken, Rose and Smalley2013). Indeed ordinary LCA is a very restricted form of FMM with zero factor loadings or factor variance. Compared with other FMMs, however, LCA tends to extract many more classes given that response patterns and association among observed variables are attributed to mean differences across classes. Fewer classes are needed to explain observed associations in FMM if within-class covariance is permitted.
Latent class factor analysis (LCFA)
LCFA (Muthén, Reference Muthén2006) represents another simple configuration of FMM. Relative to other FMMs, LCFA is characterized by class-invariant factor loading and item thresholds – LCFA and other simple configurations of FMMs may fix factor loadings and item thresholds to be equal across classes. In this case, the computed factor variance and covariance are zero whereas item probabilities are unequal. In more complex configurations, factor variance/covariance across classes can be relaxed and item thresholds may be unequal across classes (Clark et al. Reference Clark, Muthén, Kaprio, D'Onofrio, Viken, Rose and Smalley2013). The flexibility of FMMs also allows the researcher to incorporate the effect of covariates on latent variables. For example, if a researcher is interested in whether a family history of alcoholism contributes to the likelihood of group membership in a particular class, this variable may be incorporated into the model as a covariate on which factor and class variables can be regressed. Lubke & Muthén (Reference Lubke and Muthén2007) conceptualize the final step as a multinomial logistic regression with the covariate predicting the log odds of the probability of belonging to one class as compared with belonging to the reference category.
The flexibility of the FMM approach allows the researcher to build measurement models that may be most reasonable for response patterns observed in the data. In this context, decisions have to be made about: (1) the number of factors to be imposed on the model; (2) the number of classes to be fitted on the model; and (3) whether factor loading should be variant or invariant across conjectured classes. As with other latent variable models, a theory-driven approach may confer the advantage of limiting the number of factor–class configurations that would be fitted to the data, thereby limiting the risk of type 1 error. Competing conjectures about the factor structure and/or class structure of the construct may be tested directly in FMM. In the absence of strong theories, an exploratory approach informed by previous findings regarding factor and/or class structure may be useful. Depending on the source of the data, one may expect items that assess psychiatric symptoms to have low probabilities in general population samples but higher probabilities in hospital-based samples. Psychiatric patients would be expected to endorse such items at higher rates than non-clinical cases. LCFA may be most appropriate for occasions in which item probabilities are not expected to be starkly different across classes – that is, the observed variable is equally relevant to each class. It might be, however, worthwhile to free factor loading and variances across classes to allow for more complex response patterns in general population samples. This would allow items to vary in the degree to which they contribute to within-class severity differences and allow classes to differ in their level of heterogeneity.
Interpretational framework
The family of LVMMs allows researchers to compare the relative fits of competing structural models to the research data. The structural hypotheses to be compared often vary by the number of classes to be imposed on the data and the number of underlying factors or dimensions that explain the covariance among outcome variables. Suppose a researcher were interested in the optimal number of classes and dimensions that underlie data. As previously discussed, existing conjectures about the construct would serve well to inform model specification and analytic strategy. In the absence of guiding theory, an exploratory approach could be taken but results have to be interpreted with caution. The first step would be to run a series of confirmatory factor analyses (CFAs) to compare the relative fits of either theoretically conjectured or exploratory factor solutions to the data. The best factor structure can be selected informed by relevant fit indices that include information criteria (discussed below), confirmatory fit index (CFI), Tucker–Lewis index (TLI) and the root mean square error of approximation (RMSEA). The available fit indices would depend on the estimator selected to analyse the model. The next step would be to run a series of LCAs testing various class solutions. In the final step, FMMs can be conducted, informed by the best factor solution from CFA while imposing several class solutions. Given the propensity of LCA to favor models with a larger number of classes and extract too many classes from the data, it is suggested that LCA set an upper limit for the number of extracted classes in the FMM (see, for example, Ahmed et al. Reference Ahmed, Green, Goodrum, Doane, Birgenheir and Buckley2013).
Model fit
The preferred class model is selected using fit indices; however, the selection of preferred models should also be informed by theory and previous research (Bauer & Curran, Reference Bauer and Curran2003; Ram & Grimm, Reference Ram and Grimm2009). Likelihood ratio-based statistics and three sets of information criteria including the Akaike information criterion (AIC; Akaike, Reference Akaike1987), Bayesian information criterion (BIC; Schwarz, Reference Schwarz1978) and sample size-adjusted BIC (aBIC; Sclove, Reference Sclove1987) are available (e.g. in Mplus) as fit indices (Nylund et al. Reference Nylund, Asparouhov and Muthén2007). For more information on these fit indices and on available statistical software, see the online Supplementary Appendices S1 and S2.
Mixture modeling of psychosis data from the NCS
This section illustrates the use of mixture modeling to examine the latent structure of psychosis in the NCS (Kessler et al. Reference Kessler, McGonagle, Zhao, Nelson, Hughes, Eshleman, Wittchen and Kendler1994). To investigate if classes underpin psychotic experiences, several considerations can inform the model specification and analytic strategy. Competing theories about the existence of boundaries in the psychosis phenotype can inform a research question and analytic strategy. The current Diagnostic and Statistical Manual of Mental Disorders (DSM) classification of psychotic disorders is informed by the Kraepelinian dichotomy that distinguishes psychosis in schizophrenia and other psychotic disorders from psychotic experiences in mood disorders (Craddock & Owen, Reference Craddock and Owen2005; Tandon et al. Reference Tandon, Keshavan and Nasrallah2008). The DSM thus posits a categorical approach to psychosis with two or more classes. In contrast, dimensional models of psychosis posit that psychotic experiences cut across diagnostic boundaries so that they are feature of psychotic disorders, mood disturbances and other psychiatric illnesses (Strauss, Reference Strauss1969; Allardyce et al. Reference Allardyce, Suppes and van Os2007). Dimensional views also argue that psychotic experiences, which are prevalent among even the unaffected, exist on a severity gradient, with people with psychotic disorders at the severe end and the rest of the population at various levels of the gradient (Strauss, Reference Strauss1969). Previous LCA studies of psychosis have tended to identify three or four classes (Shevlin et al. Reference Shevlin, Murphy, Dorahy and Adamson2007; Murphy et al. Reference Murphy, Shevlin, Adamson and Houston2010; Gale et al. Reference Gale, Wells, McGee and Oakley Browne2011; Ndetei et al. Reference Ndetei, Muriungi, Owoso, Mutiso, Mbwayo, Khasakhala, Barch and Mamah2012; Mamah et al. Reference Mamah, Owoso, Mbwayo, Mutiso, Muriungi, Khasakhala, Barch and Ndetei2013). Shevlin et al. (Reference Shevlin, Murphy, Dorahy and Adamson2007), who used data from the NCS, found evidence of four classes of psychotic experiences. These studies, however, suggested that a latent dimension may underlie the classes they detected without actually testing a dimensional hypothesis.
Factor analytic studies of subclinical psychotic experiences have been less consistent, mostly due to differences in the item coverage of symptoms (Kitamura et al. Reference Kitamura, Okazaki, Fujinawa, Takayanagi and Kasahara1998; Wuthrich & Bates, Reference Wuthrich and Bates2006; Fonseca-Pedrero et al. Reference Fonseca-Pedrero, Lemos-Giráldez, Paino, Sierra-Baigrie, Villazón-García, García-Portilla González and Muñiz2010; Murphy et al. Reference Murphy, Shevlin, Adamson and Houston2010; Bakhshaie et al. Reference Bakhshaie, Sharifi and Amini2011; Heering et al. Reference Heering, van Haren and Derks2013). Factor solutions have ranged from two to as many as five factors. One study using data from the NCS produced evidence of a three-factor structure of psychotic experiences (Murphy et al. Reference Murphy, Shevlin, Adamson and Houston2010). No studies have, however, examined the structure of psychosis using hybrid FMMs. The greater question of whether psychotic experiences are categorical, dimensional or possess elements of both can be addressed by comparing purely dimensional models with class models and hybrid FMMs. Previous investigations in the NCS data have favored as many as four classes and three factors; thus it might make sense to fit as many classes and factors in LCA and CFA models, respectively.
Although psychotic experiences were prevalent in the NCS sample, endorsed by 28.4% of respondents, the actual prevalence of non-affective psychosis in the sample was no greater than 0.7% (Kendler et al. Reference Kendler, Gallagher, Abelson and Kessler1996). One question is how to handle the majority of respondents who neither meet criteria nor endorse any psychotic experiences. One consideration could be to exclude those individuals from the analysis but this is an undesirable approach given that zero-response patterns are a property by virtue of many psychiatric constructs when measured in the general population. Moreover, covariates of zero response patterns may be useful and informative in some context. A more defensible approach is to incorporate a zero class in which factor means and variances are set to zero for the specified zero class whereas non-zero classes are allowed to be estimated (Muthén & Asparouhov, Reference Muthén and Asparouhov2006). The degree to which incorporating a zero class improves or degrades a model can be investigated.
With regard to psychiatric theory, purely dimensional models may suggest that factor loading should be naturally invariant across the entire sample and similar for both individuals that meet criteria for non-affective psychosis and unaffected cases. Hybrid theoretical models can, however, accommodate the presence or absence of measurement invariance. An example is the similarities in the dimensions that underlie schizotypy across clinical samples and unaffected individuals (Reynolds et al. Reference Reynolds, Raine, Mellingen, Venables and Mednick2000). Analytically, it is possible to fit and compare models that assume that the same factors influence item probabilities across classes (i.e. LCFA) and more complex models that relax this assumption (more complex FMMs). In the latter, the dimensions are not equivalent across classes.
Sample size considerations
Adequate sample sizes are needed for implementing mixture models. Although conventions common to latent variable models such as 10 observations to each parameter estimated have been applied to LVMM, this has been found to be unreliable (Wolf et al. Reference Wolf, Harrington, Clark and Miller2013). Moreover, the sample size requirements depend on many factors including the complexity of the models to be estimated, the number of variables and their distribution, and the number of classes to be estimated (Muthén & Muthén, Reference Muthén and Muthén2002; Wolf et al. Reference Wolf, Harrington, Clark and Miller2013). The use of Monte Carlo samples has been recommended as a method for determining the adequacy of sample size for latent variable models (Muthén & Muthén, Reference Muthén and Muthén2002; Wolf et al. Reference Wolf, Harrington, Clark and Miller2013). The models to be evaluated are imposed on several samples that mimic the characteristics of the research data. Adequate sample sizes are necessary for attenuating bias in the estimation of parameters and standard errors, and decreasing the risk of non-convergence, and improper solutions. Relevant and meaningful classes, particularly those with small class probabilities, may be poorly represented and difficult to detect in small samples. The use of an epidemiological sample in the current demonstration, however, ensures that putative classes are well represented for the analysis.
The NCS was completed by the Survey Research Center of the University of Michigan between 1990 and 1992. The epidemiological survey assessed several psychiatric symptoms in 8098 non-institutionalized individuals aged 18–54 years, living in the USA. The NCS obtained information about psychotic experiences from 5908 respondents using survey questions drawn from the World Mental Health Composite International Diagnostic Interview (WMH-CIDI). The NCS psychosis questionnaire comprised 90 items that assessed positive symptoms, age of onset, duration, rule outs and treatment seeking. For the ease of running the mixture models, we selected 20 symptom items from the psychotic disorders section (Table 1). The selected items assessed hallucinations of all sensory domains, although many more items focused on auditory hallucinations. Participants’ responses to the 20 items were submitted to LCA, CFA, LCFA and a less restrictive form of FMM. All analyses were completed using Mplus 5 (Muthén & Muthén, Reference Muthén and Muthén2008). Annotated syntaxes are presented in the online Supplementary Appendix S3.
Table 1. Selected National Comorbidity Survey Items, endorsement rates and loadings from exploratory factor analysis a

a Loadings were generated from a Quartimin rotation.
b Preferred factor assignment.
CFA of NCS psychosis data
First, factor models were fitted to the psychosis symptom items. We fitted one to four factors because fitting these models would allow us to compare the three-factor model of Murphy et al. (Reference Murphy, Shevlin, Adamson and Houston2010) of the NCS psychosis items to alternative models. Each CFA was tested using two estimators – maximum likelihood parameter estimates with standard errors robust to non-normality (robust maximum likelihood; MLR) and robust weighted least square (WLSM). The fit statistics for the factor models are presented in Table 2 including maximum log-likelihood estimates, information criteria, CFI, TLI and RMSEA. Examination of the fit statistics suggests that a three-factor model is the preferred model. The information criteria are lowest for a three-factor model. Moreover, examination of the CFI, TLI and RMSEA shows little improvement from a three-factor to a four-factor model. The CFA results confirmed the finding of Murphy et al. (Reference Murphy, Shevlin, Adamson and Houston2010) of a three-factor structure for the NCS psychosis items. Table 2 also includes results of an exploratory factor analytic run which similarly favored a three-factor model.
Table 2. Factor analysis of National Comorbidity Survey psychosis data: model fit results

LL, Log-likelihood; k, number of free parameters; AIC, Akaike information criterion; BIC, Bayesian information criterion; aBIC, sample size-adjusted BIC; CFI, confirmatory fit index; TLI, Tucker–Lewis index; RMSEA, root mean square error of approximation; CFA, confirmatory factor analysis; EFA, exploratory factor analysis.
a Preferred model.
LCA of NCS psychosis data
Next, the 20 psychosis items were submitted to LCA with solutions ranging from two to five classes. Fitting this number of models will allow us to confirm/disconfirm prevalent LCA models of psychosis that often suggest three or four classes, including the finding of Shevlin et al. (Reference Shevlin, Murphy, Dorahy and Adamson2007) of a four-class model. Table 2 summarizes the fit statistics obtained from all analytic models. The AIC and the aBIC slightly favored the four-class model whereas the BIC favored the three-class model. While the four-class preference of Shevlin et al. (Reference Shevlin, Murphy, Dorahy and Adamson2007) is supported, an argument can also be made for a three-class model. The aBIC only decreases by nine points and the AIC by about 22 points going from the three-class to the four-class model, suggesting that not much is gained beyond the three-class model. Fig. 2 depicts the item profiles of the three-class solution with the item numbers on the x-axis and the item probability on the y-axis. The item endorsement profile across classes is parallel with the classes, appearing to be ordered from lowest to highest in item endorsement probabilities. The mixing proportions of the three classes from class 1, which has the highest endorsement probability, to class 3, which has the lowest, are 2.34, 81.95 and 15.71%. The classification quality (entropy) or the degree to which classes could readily be distinguishable is adequate at 0.826.

Fig. 2. Item profiles of the three-class solution with the item numbers on the x-axis and the item probability on the y-axis.
FMM of NCS psychosis data
Given that the endorsement of psychosis items is highest among people who met criteria for a psychotic disorder and lowest among unaffected individuals, it made sense to fit a FMM that relaxes measurement invariance assumptions to the data. We compared this relatively more complex FMM with a simple FMM with class-invariant factor loadings and item thresholds (LCFA). All of the fitted hybrid models included three factors, informed by the best-fit CFA model. We set a four-class structure as the upper limit for the number of classes, informed partly by the preferred model from the LCA. It should be noted that for both the LCFA and the more complex FMM, the three-factor four-class solution could not be estimated by the program. In some cases, this may suggest that too many classes are being extracted from the data.
The results of the FMM and the fit statistics are summarized in Table 3. When the LCFA and the complex FMM are compared, the LCFA is a slightly better fit when all of the fit indices are examined. However, when all of the hybrid models are compared with the three-factor CFA, the information criteria are lower for the latter. Next, we examine the p values obtained when the three-factor solution is nested within the more complex three-factor two-class solution. Here, the p values produced by the LMR, aLMR and bootstrap likelihood ratio test exceed the 0.05 α level. We therefore fail to reject the three-factor solution. Across all latent variable models (CFA, LCA, LCFA and FMM), the fit indices suggest that the psychosis data are best described by three factors and one population (i.e. a purely dimensional model).
Table 3. Latent variable mixture modeling of National Comorbidity Survey psychosis data: model fit results a

LL, Log-likelihood; k, number of free parameters; AIC, Akaike information criterion; BIC, Bayesian information criterion, aBIC, sample size-adjusted BIC; LMR, Lo–Mendell–Rubin test; aLMR, sample size-adjusted LMR; BLRT, bootstrap likelihood ratio test; LCA, latent class analysis; LCFA, latent class factor analysis; FMM, factor mixture models.
a Note that the three-factor, four-class models were non-identified.
b Preferred model.
On the latent structure of the psychosis phenotype
Responses to psychosis items on the NCS conform to a three-factor structure, suggesting that psychotic experiences exist on continua of severity in the general population. The absence of distinct boundaries in psychotic experiences is consistent with dimensional conceptions of the psychosis phenotype (Strauss, Reference Strauss1969; Allardyce et al. Reference Allardyce, Suppes and van Os2007; Ahmed et al. Reference Ahmed, Buckley and Mabe2012a , Reference Ahmed, Green, Buckley and McFarland b ).
Conclusions
Latent variable models are a family of flexible procedures that allow researchers to describe the associations that exists among latent variables, their manifest indicators and their covariates. The flexibility of latent variable models allows the latent variables of interest and their manifest indicators to be continuous, categorical or both. Factor analytic models depict associations between a continuous latent variable and a set of categorical and/or continuous manifest (outcome) variables. LVMM is an extension of latent variable modeling to occasions when researchers are interested in testing hypotheses about categorical sources of population heterogeneity within a dataset. LCA depicts the association between a categorical latent variable and its categorical and/or dimensional manifest variables. The family of FMMs combines factor analysis and LCA to estimate models that conjecture the existence of co-occurring categorical and dimensional latent variables that both influence manifest variables.
LVMMs have seen an increased use in their application to study psychiatric and psychological constructs, no doubt due to the simultaneous development of computer capacity and the availability of analysis software. LVMMs, however, remain underutilized. Although ideal for this sort of investigations, very few studies have used FMMs to study discontinuities in psychiatric disorders. This represents an unfavorable contrast to the wide application of LCA and multivariate taxometric methods (Meehl, Reference Meehl1999; Haslam et al. Reference Haslam, Holland and Kuppens2012). The current application of LVMM to NCS psychosis data demonstrates that it can provide results that are consistent with those of taxometric methods. Specifically, the dimensional structure of psychotic experiences in the general population is further supported by the current demonstration.
LVMMs require several choices from the researchers – the variables that are to be used in analyses, the associations to be modeled and how the latent variables are named and interpreted. All these choices should be well justified. LVMM offers substantial advantages over more traditional statistical methods and use of these methods is recommended for various research questions and designs in psychiatric and psychological research.
Supplementary material
For supplementary material accompanying this paper visit http://dx.doi.org/10.1017/S0033291715002305
Acknowledgements
This study has been funded by the Academy of Finland (project grant 268336), the Jalmari and Rauha Ahokas Foundation, the Sigrid Jusélius Foundation and the Northern Finland Health Care Support Foundation. The funders had no role in the conduct of the study.
Declaration of Interest
None.


