


Introduction
Difficulty in making decisions is one of the more distressing symptoms of major depressive disorder (MDD) (Trivedi & Greer, Reference Trivedi and Greer2014), and distortions in decision-making have been found in clinical (Leahy, Reference Leahy2001) and experimental settings (Harlé et al. Reference Harlé, Allen and Sanfey2010; Engelmann et al. Reference Engelmann, Maciuba, Vaughan, Paulus and Dunlop2013; Gradin et al. Reference Gradin, Pérez, MacFarlane, Cavin, Waiter, Engelmann, Dritschel, Pomi, Matthews and Steele2015). Such abnormal decision-making in patients with MDD may be due to emotional disturbances and cognitive biases. Specifically, depression-related emotional disturbances, such as anhedonia and deficits in reward processing, can lead to underweighting the rewarding outcomes of decisions (Treadway & Zald, Reference Treadway and Zald2011; Der-Avakian & Markou, Reference Der-Avakian and Markou2012; Paulus & Yu, Reference Paulus and Yu2012). Moreover, cognitive disturbances commonly reported in MDD (Peckham et al. Reference Peckham, McHugh and Otto2010; Armstrong & Olatunji, Reference Armstrong and Olatunji2012) are thought to arise from biases in information processing and can manifest as selective attention to negative aspects of situations, thereby distorting choice behaviors (Beck, Reference Beck2008; Disner et al. Reference Disner, Beevers, Haigh and Beck2011).
From a clinical perspective, the consequences of distorted choice behavior can be highly impactful in patients with MDD. In the realm of employment, negatively biased decision-making can lead to reduced earning potential and promotion (Whooley et al. Reference Whooley, Kiefe, Chesney, Markovitz, Matthews and Hulley2002). Interpersonal relationships are also threatened by impaired choice behavior (Thompson & Heller, Reference Thompson and Heller1993), as are physical and psychological health outcomes, perhaps related to reduced treatment adherence or decisional passivity (DiMatteo et al. Reference DiMatteo, Lepper and Croghan2000). Finally, distortions in valuation and expectation may contribute to the risk for suicide attempts (Richard-Devantoy et al. Reference Richard-Devantoy, Olié, Guillaume and Courtet2016).
Neurobiologically, little is known about how the presence of affective biases distorts choice behavior and influences the core cognitive processes that support decision-making and its underlying neural circuitry (Knutson et al. Reference Knutson, Wimmer, Kuhnen and Winkielman2008; Harlé et al. Reference Harlé, Chang, van't Wout and Sanfey2012; Engelmann et al. Reference Engelmann, Meyer, Fehr and Ruff2015). Understanding the neural mechanisms of abnormal decision-making caused by emotional disturbances may support the development of interventions targeted to improve the choices, and thereby the quality of life, of depressed individuals (Sharp et al. Reference Sharp, Monterosso and Montague2012).
Making choices requires determining the subjective value of potential outcomes of decisions, which involves consideration of an outcome's valence, magnitude, and likelihood (Rangel et al. Reference Rangel, Camerer and Montague2008). Studies of healthy adults have identified the neural underpinnings of valuation of choice options (Rangel et al. Reference Rangel, Camerer and Montague2008; Levy & Glimcher, Reference Levy and Glimcher2012) that have recently been integrated into a coordinate-based meta-analysis of neuroimaging studies (Bartra et al. Reference Bartra, McGuire and Kable2013). Specifically, Bartra et al. (Reference Bartra, McGuire and Kable2013) identified a core neural network that is involved in the neural coding of subjective value and includes ventral (VS) and dorsal striatum (DS), ventromedial prefrontal cortex (VMPFC), and anterior insula (AI). Importantly, these brain regions differentially encode the valence (gains v. losses) of the choice alternatives (Seymour et al. Reference Seymour, Daw, Dayan, Singer and Dolan2007; Knutson & Greer, Reference Knutson and Greer2008). Signal in the VS and VMPFC responds more strongly to gains, consistent with the literature on reward processing (McClure et al. Reference McClure, York and Montague2004). In contrast, regions modulating responses to both losses and gains likely contribute to the computations involved in mixed valence scenarios that involve both costs and benefits, and include the AI and DS (Tom et al. Reference Tom, Fox, Trepel and Poldrack2007; Bartra et al. Reference Bartra, McGuire and Kable2013). Others have found that loss magnitude is correlated with activation in the amygdala and insula (Weber et al. Reference Weber, Aholt, Neuhaus, Trautner, Elger and Teichert2007; Canessa et al. Reference Canessa, Crespi, Motterlini, Baud-Bovy, Chierchia, Pantaleo, Tettamanti and Cappa2013; Sokol-Hessner et al. Reference Sokol-Hessner, Camerer and Phelps2013), consistent with the theory that negative emotions may increase sensitivity to losses (Camerer, Reference Camerer2005; Cohn et al. Reference Cohn, Engelmann, Fehr and Maréchal2015).
The structures implicated in neural value coding show substantial overlap with regions that display differential activation patterns for MDD compared with healthy controls (HC) in resting state and task-based imaging studies. For example, the amygdala and AI consistently show metabolic hyperactivation at rest in patients with MDD (Price & Drevets, Reference Price and Drevets2010; Sliz & Hayley, Reference Sliz and Hayley2012), while regions implicated in reward processing, such as the caudate nucleus, demonstrate hypoactivation (Pizzagalli et al. Reference Pizzagalli, Holmes, Dillon, Goetz, Birk, Bogdan, Dougherty, Iosifescu, Rauch and Fava2009). It has therefore been suggested that the persistent negative affective states associated with MDD may lead to long-term changes in neural valuation processes (Paulus & Yu, Reference Paulus and Yu2012; Huys et al. Reference Huys, Pizzagalli, Bogdan and Dayan2013). Indeed, recent studies have reported distorted choice-related activity in the AI and DS in MDD subjects (Gradin et al. Reference Gradin, Pérez, MacFarlane, Cavin, Waiter, Engelmann, Dritschel, Pomi, Matthews and Steele2015; Pammi et al. Reference Pammi, Pillai Geethabhavan Rajesh, Kesavadas, Rappai Mary, Seema, Radhakrishnan and Sitaram2015).
Here, we used functional magnetic resonance imaging (fMRI) to investigate how depression severity modulates the neural coding of gains and losses during risky economic decision-making in unmedicated patients with MDD compared with HC. We hypothesized that MDD patients would show alterations of activity in core valuation regions relevant for decision-making and that these alterations may be reflected in differential choices between MDD and HC subjects.
Methods
Study design
We conducted a case–control study of HC and MDD subjects. The Emory Institutional Review Board reviewed and approved the study protocol.
Participants
Subjects were recruited through the Mood and Anxiety Disorders Program of Emory University. All subjects were English speakers between the ages of 18 and 60 years and signed a written informed consent form.
Eligible MDD subjects met criteria for MDD diagnosed using Structured Clinical Interview for Diagnostic and Statistical Manual of Mental Disorders, Fourth Edition (DSM-IV) (SCID) (First, Reference First1995) and confirmed by a study psychiatrist. The major depressive episode had to be of at least 8 weeks’ duration and subjects had to score ⩾18 on the 17-item Hamilton Depression Rating Scale (HAMD) (Hamilton, Reference Hamilton1967) at the screening visit. Eligibility criteria for HC included an absence of any current Axis I psychiatric disorder, absence of lifetime history of MDD, and a past week HAMD score ⩽7, reflecting minimal or absent depressive symptoms. All participants had to be free of psychoactive medications for 4 weeks prior to the scanning visit.
Exclusionary criteria for all subjects included a lifetime diagnosis of bipolar disorder, psychotic disorder, obsessive compulsive disorder, tic disorder, eating disorder, cognitive disorder, substance abuse or dependence in the previous 6 months or positive urine drug screen, or clinically significant suicidal ideation. Subjects were also excluded if they had uncontrolled medical conditions, current or past central nervous system-related disease, or were pregnant or breast feeding.
Visits
The study consisted of three visits.
The screening visit consisted of obtaining informed consent, a psychiatric interview, and evaluation of subjects using the SCID, HAMD, and the Hamilton Anxiety Rating Scale (HAMA) (Hamilton, Reference Hamilton1959). The neuropsychological testing and endowment visit was conducted 1 week prior to the scanning visit. Subjects completed the Wechsler Abbreviated Scale of Intelligence (WASI) (Wechsler, Reference Wechsler1999), and were told that this test, though challenging, was necessary for the study. By completing the WASI, subjects ‘earned’ their endowment of $100 for the decision-making task to be conducted the following week, thereby minimizing the ‘house money effect’, which may distort decision-making by increasing tolerance of risk (Thaler & Johnson, Reference Thaler and Johnson1990). Finally, participants practiced the decision-making task in order to minimize learning effects in the scanner. The scanning visit involved completing the task in the scanner.
Task
The subjects’ $100 endowment served as a starting balance for the decision-making task. Subjects were told that their decisions during the scanning session could lead to gains or losses to their endowment. During fMRI, subjects made a total of 240 decisions (six runs of 40 self-paced trials) about whether to accept a mixed lottery offering of a 50% chance of winning a cash amount X and a 50% probability of losing a cash amount Y (Fig. 1a ). In order to avoid income effects and learning (Kahneman et al. Reference Kahneman, Knetsch and Thaler1990; Pessiglione et al. Reference Pessiglione, Seymour, Flandin, Dolan and Frith2006), subjects did not receive any feedback about their decisions during scanning. Thus, the current task allowed for analyses of the neural circuitry involved in the computations involved in evaluating the costs and benefits of accepting a lottery, without the potential distortions induced by changing choice strategies due to feedback about subjects’ decisions. Only after completion of the scanning session was the final payout determined by choosing three of the lotteries at random. For each of the three randomly selected lotteries, if the subjects had accepted to play the lottery, a computerized coin was flipped providing a 50% chance of additional winnings or losses, as specified by the lottery amounts. If the subject rejected the lottery, the lottery was not played, and their endowment remained unchanged. Gain amounts varied between $0 and $40 that incremented in steps of $4 and loss amounts varied between $0 and $20 that incremented in steps of $2. Figure 1b shows the distribution of expected values. Every lottery was presented twice. Timing and order of presentation was randomized and optimized for fMRI using in-house software programmed in Matlab. The task used in the current study was modified from a previous fMRI study of decision-making in HC (Tom et al. Reference Tom, Fox, Trepel and Poldrack2007).
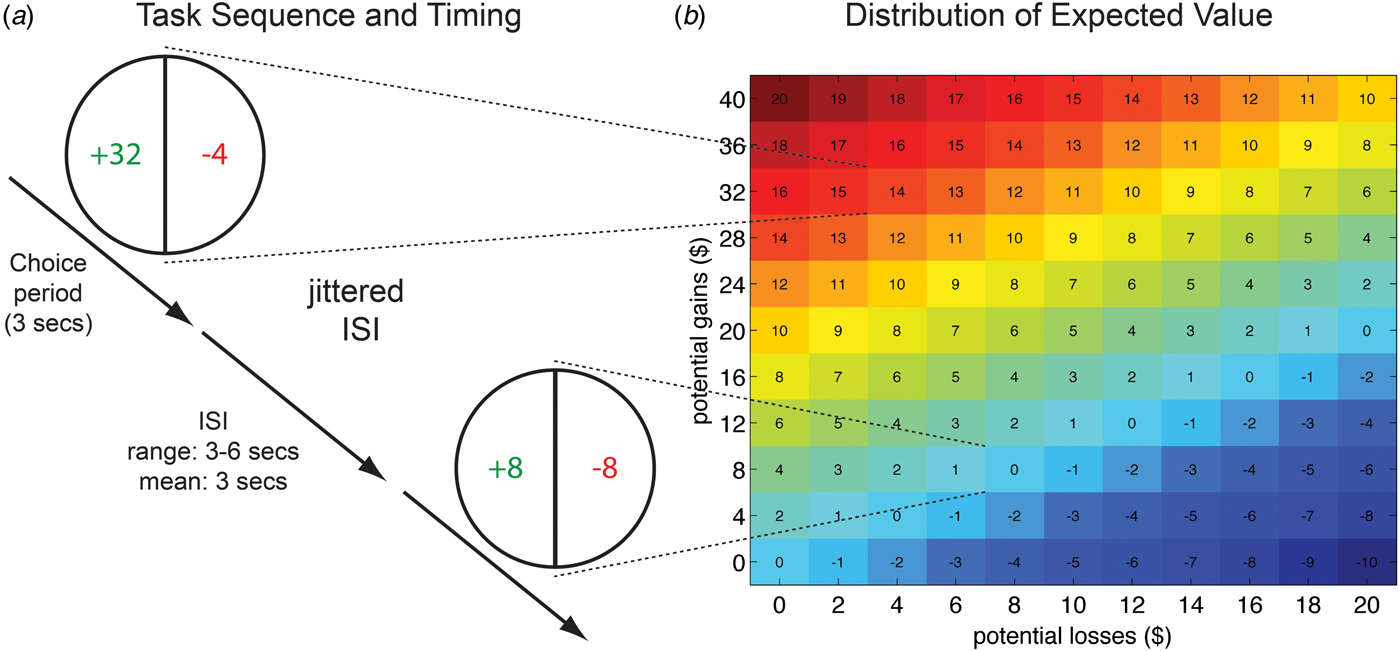
Fig. 1. Sequence and timing of fMRI task and distribution of mixed lottery values. (a) Subjects were presented with mixed lotteries that offered a gain amount, shown on the left side of the pie chart (green in the scanner), and a loss amount, shown on the right side of the pie chart (red in the scanner). Subjects repeatedly decided whether to play a lottery or whether to reject it. If subjects chose to play a lottery on a payout-relevant trial (selected at random at the end of the experiment), an even coin decided with a 50% probability whether the gain amount is added to their final payout, or whether the loss amount is subtracted from the initial endowment of $100. Rejection to play the lottery on the payout-relevant trial led to no change in the initial endowment. Gain and loss amounts of lotteries varied on each trial. (b) The matrix on the right of the figure shows the distribution of gains and losses and expected value (EV) of corresponding lotteries. EV = (0.5 × gain amount) – (0.5 × loss amount).
Functional magnetic resonance imaging
Neuroimaging data were collected using a 3-Tesla Siemens Magnetron Trio whole-body scanner (Siemens Medical Systems, Erlangen, Germany). A three-dimensional, high-resolution anatomical dataset was acquired using Siemens’ magnetization prepared rapid acquisition gradient echo sequence (TR = 2300 ms, TE = 3.93 ms, TI = 1100 ms, 1 mm isotropic voxels and a 256 mm FOV). fMRI data consisted of 35 axial slices that were sampled with a thickness of 3 mm and encompassing a field of view of 192 mm with an in-plane resolution of 64 × 64 (T2*weighted, TR = 2500 ms, TE = 31 ms). The task was presented with Presentation software (Neurobehavioral Systems, Albany, California, USA).
fMRI preprocessing
Image analysis was performed using SPM8 (Wellcome Department of Imaging Neuroscience). Data underwent motion correction and slice-time acquisition correction. Anatomical and mean functional datasets were co-registered and co-registration success was confirmed visually for all subjects. Individual gray matter tissue probability maps were computed from anatomical datasets and spatially warped to standard MNI space. Functional images were subsequently normalized to standard MNI space by applying the transformation matrix obtained from normalizing the anatomical datasets. Functional data then underwent spatial smoothing using an isotropic Gaussian kernel of 8 mm full width at half maximum.
Behavioral analysis
Behavioral data analysis was conducted using the R statistical package (www.r-project.org). Robust regressions correcting for heteroscedasticity and correlated responses from each subject were conducted using the Huber–White method. Regression analyses analyzed the effect of both gain and loss amounts on decisions to accept or reject the lottery (logistic regression) and choice latencies (ordinary least square regression). A dummy variable was used to reflect group (HC, MDD), and, additionally, all results were subsequently confirmed using subjects’ HAMD scores (online Supplementary Table S1). For the choice latency analyses, we excluded outlier trials, defined as response latencies > 3s.d. from the subject-specific mean. We tested whether gains and losses affected decision-making differentially in MDD patients compared with HC subjects via the two- and three-way interactions between group and gain/loss amounts. Additionally, age, gender, past year income, and WASI score were identified a priori as potential confounders and included in all behavioral analyses.
Finally, to enable investigations of brain–behavior relationships based on individual differences in choice behaviors in the context of varying gain and loss amounts, we estimated each participant's sensitivity towards losses relative to gains using the unstandardized coefficient estimates from regression analyses for losses (β losses) and gains (β gains) as λ = β losses/β gains. This approach assumes linear utility and probability weighting functions (Tom et al. Reference Tom, Fox, Trepel and Poldrack2007). Individual loss sensitivity parameters were then square root transformed (√λ) to reduce skewness and kurtosis of the distribution. Finally, transformed loss sensitivity parameters were regressed against neural gain–loss coding to identify brain regions that show modulation of neural value coding by the level of behavioral loss sensitivity. The robustness of our behavioral results was confirmed with several regression analyses showing that controlling for choice difficulty, income, and anxiety does not significantly influence the reported results (data not shown).
fMRI data analysis
The fMRI data were analyzed using a standard regression model at the single-subject level implemented in SPM8. Regressors were modeled using a canonical hemodynamic response function with time and dispersion derivatives (Henson et al. Reference Henson, Price, Rugg, Turner and Friston2002). First-level models included the decision event (modeled as a function of the response time on each trial) with two parametric modulators reflective of gain (ranging from $0 to $40 in increments of $4) and loss amounts (ranging from $0 to $20 in increments of $2), as well as motion parameters estimated by the realignment procedure. Parametric modulators for gain and loss amounts directly reflect trial-by-trial fluctuations in the value of the choice options, and are therefore a central feature, underlying value computations. We employed a variable epoch model, which minimizes distortions due to time-on-task effects (Grinband et al. Reference Grinband, Wager, Lindquist, Ferrera and Hirsch2008; Yarkoni et al. Reference Yarkoni, Barch, Gray, Conturo and Braver2009).
Second-level analyses focused on the parametric modulators reflecting the trial-by-trial correlations between brain activity and lottery amounts (gains and losses). This approach allowed us to identify which brain regions track the value of gains and losses by showing linear increases or decreases in BOLD signal as the value of the lottery amounts change on each trial (see also Tom et al. Reference Tom, Fox, Trepel and Poldrack2007; Engelmann et al. Reference Engelmann, Meyer, Fehr and Ruff2015). To examine neural gain–loss coding during decision-making, we contrasted the correlation magnitude for gains to that for losses. First, we confirmed that choice-related activity within our regions of interest (ROIs) is relevant for behavior by regressing individual behavioral loss sensitivity parameters against the contrast of gains v. losses. Next, we investigated the impact of group on neural gain–loss coding. We tested the two-way interaction between group (HC, MDD) and neural gain–loss coding via two-sample t tests. Finally, we investigated the modulatory influence of depression and anxiety severity on neural loss sensitivity in the MDD subjects by regressing HAMD and HAMA scores against the contrast of gains v. losses.
A priori ROIs were required to be both involved in valuation (Bartra et al. Reference Bartra, McGuire and Kable2013) and, at the same time, to show differential activity in MDD v. HC subjects (Price & Drevets, Reference Price and Drevets2010; Sliz & Hayley, Reference Sliz and Hayley2012). These regions included the caudate nucleus, AI, and the VMPFC. We created a combined mask that included (1) bilateral AI, with peak voxels (mask sizes) at −36, 20, −6 (k = 335) in the left and at 40, 22, −6 (k = 359) in the right AI; and (2) VMPFC with the peak voxel at −2, 40, −8 (k = 701) and (3) a custom anatomical mask for the caudate head, created by limiting the Automated Anatomical Labeling (AAL) template for the caudate nucleus provided by WFU-pickatlas to all voxels below z = 20 (left: k = 238; right: k = 242, ventral–dorsal extent z = −13 to 20), thereby excluding only the caudate tail (shown in online Supplementary Fig. S1). Small-volume familywise-error (SV FWE) correction for multiple comparisons (p < 0.05 at voxel level) was employed for all analyses to identify significant activation within the combined ROI mask. Brain–behavior relationships were inspected by regressing covariates of interest (√λ, HAMD, HAMA) against the contrast reflecting neural gain–loss coding (gains > losses). Note that the robustness of all brain–behavior correlations was confirmed via Iteratively Reweighted Least Squares (IRLS) robust regression analyses that reduce the influence of potential outliers (Wager et al. Reference Wager, Keller, Lacey and Jonides2005). Results from robust regression analyses confirm results reported in the main paper and are reported in online Supplementary Table S3 (√λ), 7 (HAMD) and 8 (HAMA). Finally, whole-brain and exploratory ROI analyses were conducted to explore whether additional regions outside our a priori ROIs showed effects of group on valuation-related signals and are reported in online Supplementary Fig. S4 and Tables S4–S6.
Results
In total 46 subjects consented to participate, 21 MDD and 25 HC. Four subjects (two per group) did not return for the MRI or had unusable MRI data, resulting in analyzable data for 19 MDD (nine females) and 23 HC (nine females). The overall mean age, income, and WASI score did not significantly differ between the groups. Online Supplementary Table S1 compares the groups’ demographic and clinical characteristics.
Depression does not affect revealed preferences
Consistent with prior reports, we found that both gains and losses have a highly significant effect on the acceptance rates of mixed gambles (both p < 0.001; online Supplementary Table S2). These effects were not influenced by MDD, as indicated by a lack of significant interactions between group and choice parameters (Figs 2a , b and online Supplementary Table S2). Results from an econometric model (Tom et al. Reference Tom, Fox, Trepel and Poldrack2007), in which behavioral loss sensitivity (λ = β losses/β gains) was calculated separately for each group, confirmed the absence of differences in revealed preferences between MDD and HC subjects (λ HC:1.77; λ MDD:1.72, p = n.s.).
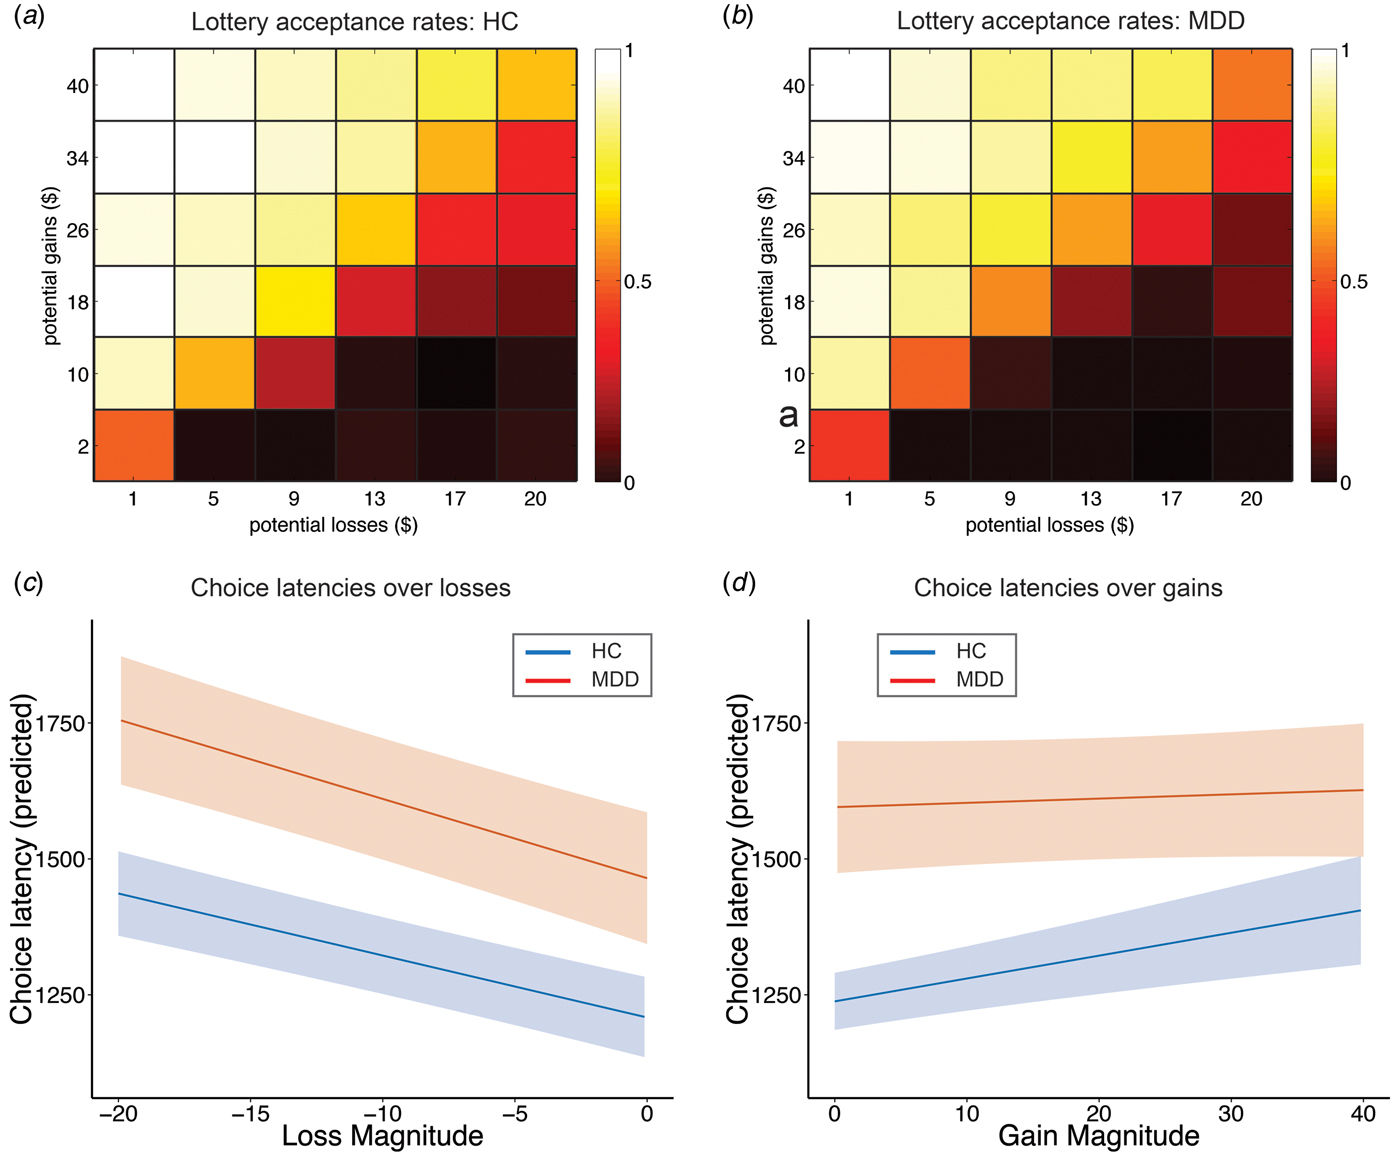
Fig. 2. Depression influences choice latency but not revealed preferences. (a, b) Gains and losses significantly influence acceptance rates of mixed lotteries in a manner consistent with a greater sensitivity to losses than gains, as illustrated via a 6 × 6 color-shaded heatmap that collapses over the lotteries with similar EV illustrated in Fig. 1 (see Supplementary Table S1, columns 1 and 2 for regression results). Color shading depicts the probability of mixed lottery acceptance, with brighter colors reflecting high probabilities and darker colors reflecting low probabilities. The influence of depression on mixed lottery acceptance rates is minimal. (c, d) Depression has a significant and specific impact on choice latencies. Specifically, gain magnitude does not affect choice latencies of depressed subjects to the same extent as HC (gains × depression, p = 0.011, see Supplementary Table S2 columns 3 and 4 for regression results). Depressed subjects show significantly increasing choice latencies as a function of increasing losses. These results indicate that valuation processes are more heavily influenced by losses in depressed subjects. Predicted choice latencies for gains and losses were estimated using the regression model reported in Supplementary Table S2 by holding all other variables (e.g. a priori confounders) at their mean. Plots show regression lines with bounds reflecting robust and clustered standard errors.
Depression eliminates the association between stake size and choice latency in the domain of gains
MDD significantly modulated response latencies in the domain of gains as shown in Figs 2c , d and online Supplementary Table S2. Specifically, we observed increasing choice latencies with increasing stakes for both HC and MDD subjects in the domain of losses, as indicated by a significant main effect of losses (p < 0.001) and a non-significant interaction between losses and group (p = 0.243). These results demonstrate that both groups’ choice latencies increased as potential losses increased. In contrast, a significant interaction between gains and group (p = 0.016) indicates that MDD subjects did not show changes in choice latencies with increasing stake sizes in the domain of gains, an effect that choice latencies of HC clearly displayed. Follow-up analyses for each group separately confirm these results, showing significant effects of both losses (coefficient = −11.735, p < 0.001) and gains (coefficient = 4.391, p = 0.022) in HC subjects; while in MDD subjects, only losses (coefficient = −15.214, p < 0.001), not gains (coefficient = 0.995, p = 0.692) showed this effect. These effects are also visible in a model-free representation of the data shown in online Supplementary Fig. S2. However, given that the three-way interaction between gains, losses, and group did not reach significance (p = 0.198, online Supplementary Table S2), behavioral differences between depressed and HC may not be specific for the gain domain. To test whether choice difficulty contributed to choice latency (Krajbich et al. Reference Krajbich, Bartling, Hare and Fehr2015), we examined whether expected value influenced choice latency, but found no effect (see online Supplementary Text S1). Finally, we report results from additional regression analyses showing that anxiety (HAMA) does not influence decisions and choice latency (see online Supplementary Text S2).
Behavioral loss sensitivity correlates with neural gain–loss coding across all subjects
First, we confirmed that choice-related activity within our ROIs is relevant for economic decision-making by regressing individual loss sensitivity parameters against neural gain–loss coding. Group-independent regression analyses in a priori ROIs identified a network of regions that show correlations between behavioral loss sensitivity (√λ) and neural gain–loss coding (Fig. 3a ). Regions included bilateral areas within the caudate nucleus (Figs 3b , c ; left: −12, 14, 10, k = 129, t = 5.8; right: 12, 11, 4, k = 155, t = 5.55, both SV FWE-corrected peak p < 0.002) and AI (Figs 3d , e ; left: −30, 23, 1, k = 161, t = 5.46; right: 33, 17, −2, k = 201, t = 6.08, both SV FWE-corrected peak p < 0.002), and dorsomedial PFC (−3, 32, 37, k = 23, t = 4.49, SV FWE-corrected peak p = 0.032). Regions in this network exhibited a positive relationship between behavioral loss sensitivity and neural gain–loss coding. The decomposition of the contrast effect into separate gain and loss components using robust and clustered regression analysis is illustrated in Fig. 3, which shows that larger levels of behavioral sensitivity for losses were associated with increasingly negative coding of losses (but not gains) in core valuation regions. ROI analyses using IRLS robust regression confirm these results and are reported in online Supplementary Table S3.
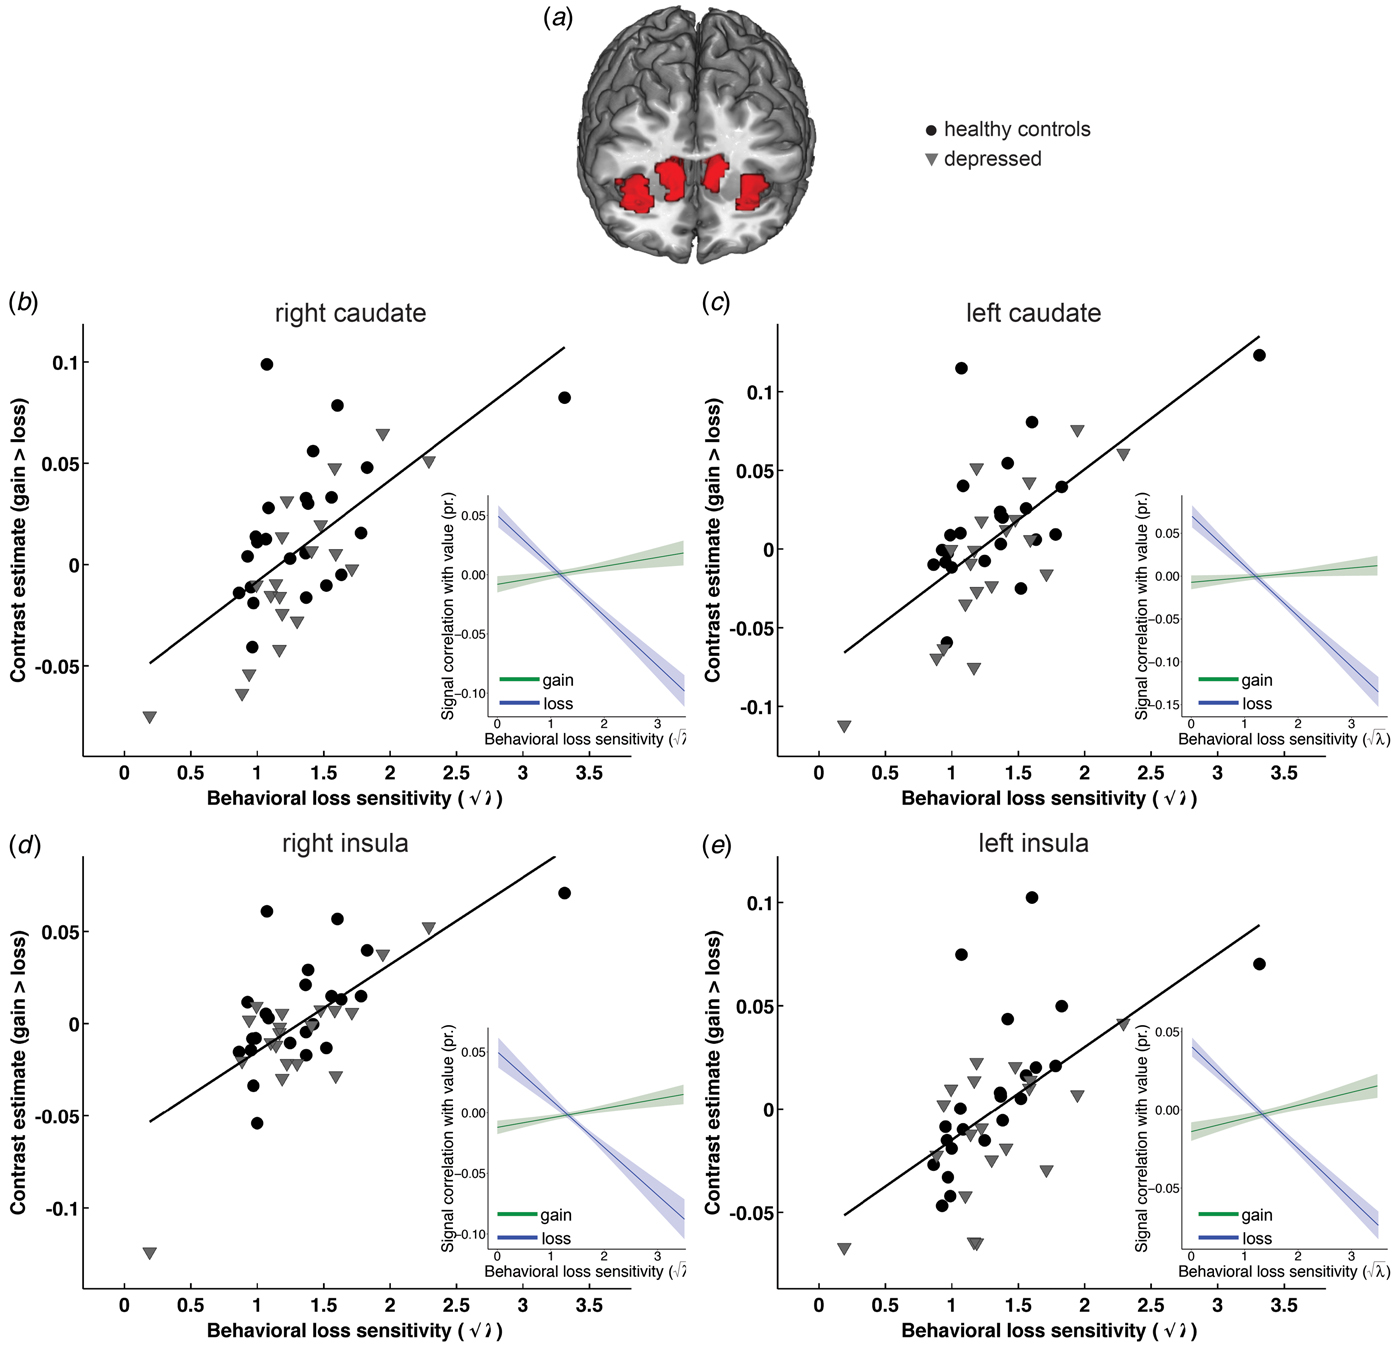
Fig. 3. Behavioral loss sensitivity correlates with neural gain–loss coding across all subjects. Group-independent ROI analyses identified bilateral areas within caudate nucleus and AI (shown in a) that show correlations between behavioral loss sensitivity (√λ = √(β losses/β gains) and neural gain–loss coding. Specifically, behavioral loss sensitivity correlated with gain–loss coding in bilateral caudate nucleus (b shows left: −12, 14, 10, k = 129; c shows right: 12, 11, 4, k = 155, both SV FWE corrected peak p < 0.002) and bilateral AI (d shows left: −30, 23, 1, k = 161; e shows right: 33, 17, −2, k = 201; both SV FWE corrected peak p < 0.002) as well as dorsomedial PFC (−3, 32, 37, k = 23; SV FWE-corrected peak p = 0.032, not shown). As illustrated in scatterplots, regions in this network exhibit a positive relationship between behavioral loss sensitivity and neural gain–loss coding. The decomposition of the contrast effect into separate gain and loss components using robust regression (shown in inserts) illustrates that these effects are driven primarily by the significant relationship between behavioral loss sensitivity and negative coding of losses, such that a greater sensitivity to losses is associated with a stronger negative relationship between regional signal and loss magnitude in core valuation regions. Individual data points and regression plots reflect separate β values for gains and loses extracted from a 6 mm sphere around the activation peak.
Depression reverses neural gain–loss coding in AI
Figure 4 shows a significant effect of MDD on neural gain–loss coding present in left AI (Fig. 4a ; −33, 29, −17, k = 29, t = 4.48, SV FWE-corrected peak p = 0.032) and a trend-level effect in right AI (Fig. 4b ; 42, 20, −14, k = 25, t = 4.04, SV FWE-corrected peak p = 0.098). At a relaxed threshold of p < 0.005, uncorrected, additional group differences in gain–loss coding were observed in bilateral caudate nucleus (online Supplementary Fig. S3; left caudate: −18, 23, −2, k = 13, t = 3.36; right caudate: 21, 26, −2, k = 23, t = 3.27).
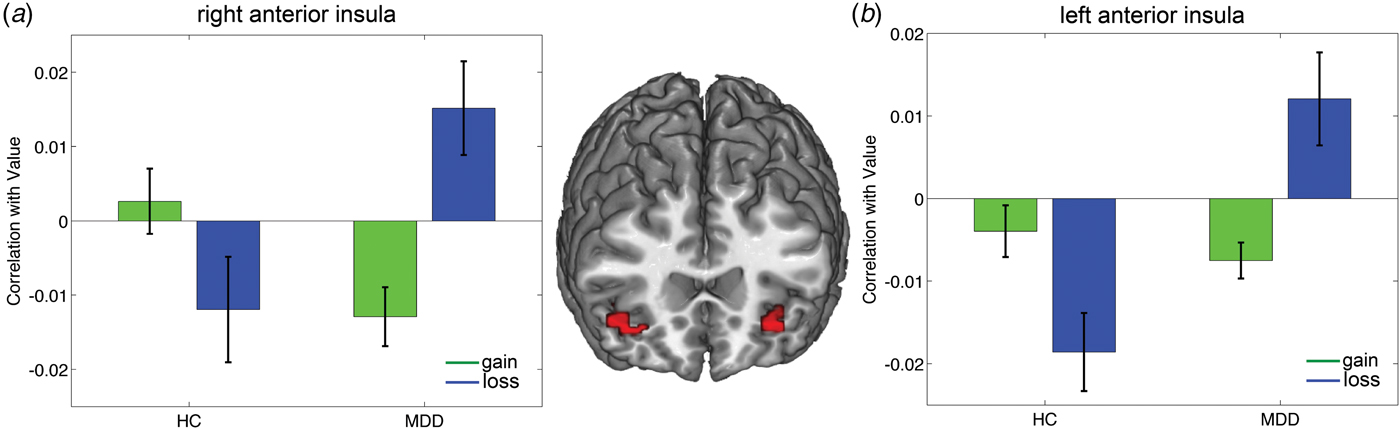
Fig. 4. Reversal of neural gain–loss coding in MDD patients compared with HC subjects. Bilateral AI shows a reversal of neural gain–loss coding as a function of depression. ROI analysis identified regions in (a) left AI (−33, 29, −17, k = 29, SV FWE-corrected peak p = 0.032) and (b) right AI (42, 20, −14, k = 25, SV FWE-corrected peak p = 0.098) that show an interaction between group and neural gain–loss coding. Results indicate that loss sensitivity is processed differentially by MDD compared with HC subjects. Specifically, activation patterns within these regions show significantly greater activity due to increasing losses (dark bars) relative to gains (light bars) in MDD participants, whereas in HC participants, the reverse activation pattern is observed, with gains leading to significantly greater recruitment of these regions relative to losses. Bar plots reflect parametric correlation with value (gain/loss) extracted from 6 mm spheres around peak voxels. Confidence bounds are reflective of one standard error.
To characterize these significant interaction effects, we conducted tests of simple effects within SPM, testing group differences between MDD and HC for gain and loss coding separately. Only the simple effect for MDD > HC during loss coding, showed significant effects within our ROIs. Specifically, a region in left AI showed greater positive coding of losses in MDD relative to HC (−33, 29, −17, k = 27, t = 4.26, SV FWE-corrected peak p = 0.059). At a relaxed threshold (p < 0.005, uncorrected), additional group differences were found within our ROIs in right insula (42, 23, −14, k = 2, t = 3.06) and left caudate (left: −18, 23, −2, k = 6, t = 3.22). No other tests of simple effects yielded significant differences between MDD v. HC during both loss and gain coding.
Moreover, no other ROIs showed this activation pattern, but additional regions were identified via the whole-brain analysis. Regions shown in online Supplementary Fig. S4 and Supplementary Table S4 demonstrate similar reversals of encoding of losses in MDD compared with HC and include the supplemental motor area (Fig. S4b; −6, 11, 64, k = 441) and inferior frontal gyrus (Fig. S4c; −33, 29, −17, k = 330). Finally, within-group effects tested separately for HC and MDD subject via FWE-corrected whole-brain analyses are reported in online Supplementary Table S5.
Depression severity increases neural coding of losses in depressed subjects
Depression severity modulated neural coding of losses in VMPFC, left AI, and right caudate nucleus (Fig. 5), such that greater HAMD scores displayed a negative relationship with neural gain–loss coding. Decomposing the contrast effect into separate gain and loss components using robust and clustered regression analysis showed that increasing HAMD scores were associated with greater neural coding of losses, but not gains, as illustrated in Figs 5b–d (right column). This effect was observed in left AI (Fig. 5b ; −30, 32, −5, k = 31, t = 5.56, SV FWE-corrected peak p = 0.04), right caudate nucleus (Fig. 5c ; 18, 20, −8, k = 104, t = 5.42, SV FWE-corrected peak p = 0.05), and VMPFC (Fig. 5d ; 3, 47, −20, k = 327, t = 5.68, SV FWE-corrected peak p = 0.032). At a relaxed threshold of p < 0.005, uncorrected, additional regions within the ROI mask showed modulation of neural coding of losses by depression severity. These are depicted in online Supplementary Fig. S5 and include right AI (36, 29, 7, k = 23, t = 4.89) and left caudate (−3, 5, −5, k = 92, t = 4.53). Whole-brain analysis identified regions showing a relationship between HAMD scores and altered neural coding of losses outside our a priori ROIs (summarized in online Supplementary Table S6). ROI analyses using IRLS robust regression confirm these results and are reported in online Supplementary Table S7.

Fig. 5. Depression severity (HAMD) in MDD subjects modulates the neural coding of losses, but not gains. ROI analyses identified significant negative correlations between HAMD scores and the contrast gains v. losses in (a) the left AI (−30, 32, −5, k = 31, SV FWE-corrected peak p = 0.04), (b) right caudate nucleus (18, 20, −8, k = 104, SV FWE-corrected peak p = 0.05), and (c) VMPFC (3, 47, −20, k = 327, SV FWE-corrected peak p = 0.032). The decomposition of the contrast effect into separate gain and loss components using robust regression analysis (right column) illustrates the influence of depression severity on the differential neural coding of gains (light shading) v. losses (dark shading). These results show that increased levels of HAMD scores are specifically associated with increased encoding of losses, but not gains, in these valuation regions. Individual data points and regression plots reflect separate β values for gains and loses extracted from a 6 mm sphere around the activation peak.
Finally, the opposite pattern was observed for HAMA scores, such that increasing scores are associated with negative coding of losses in right AI (54, 23, 7, k = 282, t = 5.74; SV FWE-corrected peak p = 0.028; online Supplementary Fig. S6), confirming previous reports of the effects of anxiety on value coding in the insula (Engelmann et al. Reference Engelmann, Meyer, Fehr and Ruff2015). ROI analyses using IRLS robust regression confirm these results and are reported in online Supplementary Table S8.
Discussion
The present study demonstrates distorted choice-relevant neural activation in patients with MDD compared with HC. We identified a network of regions that is clearly involved in choice-relevant computations of mixed lotteries that offer both potential gains and losses. This network consists of AI, VMPFC, and striatum, and is significantly modulated during economic decision-making by subjects’ behavioral sensitivity to losses. Within this network of valuation regions, we confirm previously demonstrated patterns in HC subjects, with positive coding of gains and negative coding of losses in a network of regions that spans VMPFC, striatum, inferior frontal gyrus, and dorsolateral PFC (Tom et al. Reference Tom, Fox, Trepel and Poldrack2007). Importantly, this pattern significantly reverses in MDD subjects. In MDD, there is abnormally enhanced neural coding of losses (relative to gains) in the AI, and greater depressive severity enhances neural coding of losses (but not gains) in this region. These results are consistent with prior work demonstrating that sustained aversive emotional states in healthy subjects can lead to differential coding of subjective value within core valuation regions that include AI, caudate, and VMPFC (Engelmann et al. Reference Engelmann, Meyer, Fehr and Ruff2015).
We did not find an effect of depression on actual choices made in response to the mixed lotteries. As noted by others (Callicott et al. Reference Callicott, Mattay, Verchinski, Marenco, Egan and Weinberger2003; McClure et al. Reference McClure, Monk, Nelson, Parrish, Adler, Blair, Fromm, Charney, Leibenluft, Ernst and Pine2007), such matched task performance across groups reduces the possibility that confounding factors, e.g. group differences in the ability to perform or comply with the task, drive the observed neural activation differences (Wilkinson & Halligan, Reference Wilkinson and Halligan2004). However, our results suggest a non-specific difference between the HC and MDD groups in behavior at the level of choice latency. HC demonstrated increasing choice latencies with increasing stakes for both gains and losses, whereas choice latencies in MDD subjects only increased with increasing potential loss amounts and were unaffected by gain stake size. The increased latency in HC with increasing stake size is expected, given the greater potential impact of larger stakes on the final payout. That MDD subjects do not show this increased latency with increased stake sizes for gains supports the notion that depressed patients focus on potential losses to the possible neglect of gains.
Reduced attention to gains during economic decision-making in MDD may be caused by the interference of depressive symptoms at various stages of the decision-making cascade outlined by Rangel et al. (Reference Rangel, Camerer and Montague2008): at the representational stage, by biasing attention to negative potential outcomes; at the valuation stage, by diminishing the influences of rewarding outcomes on value computations; and, finally, by blunting reinforcement learning about the outcomes of decisions as shown previously (Gradin et al. Reference Gradin, Kumar, Waiter, Ahearn, Stickle, Milders, Reid, Hall and Steele2011; Ubl et al. Reference Ubl, Kuehner, Kirsch, Ruttorf, Diener and Flor2015). In the current study, no direct feedback about decisions was given, thereby precluding reinforcement learning. Our behavioral and neural results therefore suggest the impact of depression emerges in the representational or valuation stages.
In light of the established attentional biases towards negatively valenced stimuli (Peckham et al. Reference Peckham, McHugh and Otto2010) and difficulties disengaging from negative material in MDD subjects (Armstrong & Olatunji, Reference Armstrong and Olatunji2012), our results agree well with the interpretation that cognitive models of depression extend to the domain of value-based choice (Disner et al. Reference Disner, Beevers, Haigh and Beck2011). This notion finds support in recent neuroeconomic research on the role of attention in decision-making (Armel et al. Reference Armel, Beaumel and Rangel2008; Krajbich et al. Reference Krajbich, Armel and Rangel2010; Lim et al. Reference Lim, O'Doherty and Rangel2011; Krajbich et al. Reference Krajbich, Lu, Camerer and Rangel2012). Specifically, attentional guidance of visual fixations on specific choice options can lead to biased decisions in favor of the option that is being fixated upon (Armel et al. Reference Armel, Beaumel and Rangel2008; Krajbich et al. Reference Krajbich, Armel and Rangel2010, Reference Krajbich, Lu, Camerer and Rangel2012). Abnormal fixation patterns on choice options with negative valence therefore offer a likely explanation for our behavioral and imaging results.
This conjecture is supported by our neuroimaging results. Recent reports that VMPFC and VS encode fixation-dependent relative value signals during decision-making in the domain of gains (Lim et al. Reference Lim, O'Doherty and Rangel2011) postulate the AI as a likely counterpart in the domain of losses. The abnormal neural coding of losses in AI of MDD patients is consistent with prior results implicating the AI in subjective value coding on the one hand, and showing abnormal activation patterns as a function of emotional disturbances on the other. Specifically, a recent meta-analysis has implicated the insula in both positive and negative subjective value coding (Bartra et al. Reference Bartra, McGuire and Kable2013). This interpretation is further strengthened by recent results in HC demonstrating negative subjective value coding in the insula, but only in the context of sustained aversive affect (Engelmann et al. Reference Engelmann, Meyer, Fehr and Ruff2015). Moreover, heightened activity in AI has been implicated in harm avoidance and neuroticism during risky decision-making (Paulus et al. Reference Paulus, Rogalsky, Simmons, Feinstein and Stein2003) and linked to anxiety (Paulus & Stein, Reference Paulus and Stein2006). Furthermore, resting state metabolism of the AI (McGrath et al. Reference McGrath, Kelley, Holtzheimer, Dunlop, Craighead, Franco, Craddock and Mayberg2013; Dunlop et al. Reference Dunlop, Kelley and McGrath2015), and its functional connectivity with the subcallosal cingulate cortex (Dunlop et al. Reference Dunlop, Rajendra, Craighead, Kelley, McGrath, Choi, Kinkead, Nemeroff and Mayberg2017), has been identified as a potential biomarker for treatment selection in patients with MDD. In light of these prior findings, our imaging results call for an integration of the AI as an important node for processing salient aversive information in cognitive–biological models of MDD (Disner et al. Reference Disner, Beevers, Haigh and Beck2011). The emerging literature on salience processing and neuroimaging predictors of treatment outcome may provide the opportunity to develop non-imaging surrogates for aberrant information processing in MDD; such tests could be employed in the clinic to enhance precision medicine approaches to MDD (Dunlop, Reference Dunlop2015). For example, employing eye tracking to directly assess the attentional focus during decision-making in MDD could shed further light on how attentional processes influence subsequent reward and loss processing in depressed subjects within the insula, and may predict likely response to psychotherapy or medication treatments for MDD (Treadway & Zald, Reference Treadway and Zald2011; Der-Avakian & Markou, Reference Der-Avakian and Markou2012; Paulus & Yu, Reference Paulus and Yu2012).
Although our results integrate well with those of prior studies, the relatively modest sample size is a limitation to this study. Another potential limitation is that, contrary to our hypothesis based on our prior results showing significant effects of depression on economic decision-making (Engelmann et al. Reference Engelmann, Maciuba, Vaughan, Paulus and Dunlop2013), we did not detect higher levels of behavioral loss aversion in MDD subjects. This may have occurred because our design was tailored to previously reported levels of loss aversion in HC. To improve the task's sensitivity to loss aversion in MDD, future studies could employ more gambles around subjects’ indifference points. Finally, the finding that choice latency did not increase with increasing stake size in the domain of gains among MDD subjects, in contrast to HC, did not achieve statistical significance in testing the three-way interaction between gains, losses, and group. This precludes the interpretation that results from the two-way interaction indicating a relative absence of modulation of choice latency by gain amounts in MDD compared with HC subjects are specific for the gain domain (online Supplementary Table S2). Nonetheless, these results are relevant as they suggest the presence of subtle behavioral differences that are consistent with the distortionary effects of depression on the neural correlates underlying gain and loss coding.
In conclusion, our behavioral and fMRI results jointly indicate that during economic decision-making, MDD subjects show neural overweighting of losses in AI cortex that may be accompanied by relatively subtle choice latency effects in the domain of gains and reduced recruitment and functional coupling of attentional and cognitive control networks.
Supplementary Material
The supplementary material for this article can be found at https://doi.org/10.1017/S0033291717001428.
Acknowledgements
This study was supported by National Institutes of Health grant K23 MH086690 (BWD). JBE gratefully acknowledges support from the Radboud Excellence Initiative, a joint initiative of Radboud University and Radboud University Medical Center.
Declaration of Interest
JBE and GSB report no relevant financial disclosures. BWD has received research support from Assurex, Axsome, Janssen, NIMH, Otsuka, Pfizer, and Takeda. He has served as a consultant to Medavante.
Ethical Standards
The authors assert that all procedures contributing to this work comply with the ethical standards of the relevant national and institutional committees on human experimentation and with the Helsinki Declaration of 1975, as revised in 2008.


