


Introduction
Depressive disorder was ranked the third leading cause of non-fatal health loss in the Global Burden of Disease Study 2017 (GBD 2017 Disease and Injury Incidence and Prevalence Collaborators, 2018). As reported by the World Health Organization, more than 300 million people were suffering from depression in 2017 (World Health Organization, 2017). Among patients with depression, cardiovascular diseases (CVD) often co-exist. Observational studies and meta-analyses demonstrated that depression and CVD [including coronary artery disease (CAD) (Gan et al., Reference Gan, Gong, Tong, Sun, Cong, Dong and Lu2014), myocardial infarction (MI) (Gan et al., Reference Gan, Gong, Tong, Sun, Cong, Dong and Lu2014), stroke (Barlinn et al., Reference Barlinn, Kepplinger, Puetz, Illigens, Bodechtel and Siepmann2015) and atrial fibrillation (AF) (Garg et al., Reference Garg, O'Neal, Diez-Roux, Alonso, Soliman and Heckbert2019; Goren, Liu, Gupta, Simon, & Phatak, Reference Goren, Liu, Gupta, Simon and Phatak2013)] were associated with each other, and the relationship was bi-directional (Lippi, Montagnana, Favaloro, & Franchini, Reference Lippi, Montagnana, Favaloro and Franchini2009). Nevertheless, there is insufficient evidence on whether depression causally leads to various CVD traits or vice versa. Emerging reports also called for clinical awareness on the interplay between stress-related psychiatric disorders and CVD (Bacon, Reference Bacon2019; Song et al., Reference Song, Fang, Arnberg, Mataix-Cols, Fernandez de la Cruz, Almqvist and Valdimarsdottir2019). Given the high prevalence of the diseases and the huge public health impact incurred, it is important to understand the relationship between depression and CVD although stress is just one of the risk factors for depression.
Published genome-wide association studies (GWAS) have adopted different depression phenotypes, ranging from self-declared depression-related phenotypes to clinical diagnosis of major depressive disorder (MDD). As accumulating evidence suggested that genetic association results obtained from the combination of carefully curated research cohorts with self-declared depression cohorts are applicable to clinical MDD (Wray et al., Reference Wray, Ripke, Mattheisen, Trzaskowski, Byrne and Abdellaoui2018), increasing number of studies are using this approach. Recently, Howard et al. conducted a GWAS meta-analysis of depression with 807 553 individuals (246 363 cases; 561 190 controls) (Howard et al., Reference Howard, Adams, Clarke, Hafferty, Gibson, Shirali and McIntosh2019) from the three largest studies of different depression phenotypes, including self-reported clinical diagnosis or treatment of depression in 23andMe participants (75 607 cases and 231 747 controls) (Hyde et al., Reference Hyde, Nagle, Tian, Chen, Paciga, Wendland and Winslow2016), self-reported diagnosis together with conventional methods like structured diagnostic interviews in participants of Psychiatric Genomics Consortium (PGC) (43 204 cases and 95 680 controls) (Wray et al., Reference Wray, Ripke, Mattheisen, Trzaskowski, Byrne and Abdellaoui2018), and broad depression, which was defined as ‘self-reported past help-seeking via a general practitioner or psychiatrist for problems with nerves, anxiety, tension or depression’ in UK Biobank participants (127 552 cases and 233 763 controls) (Howard et al., Reference Howard, Adams, Shirali, Clarke, Marioni, Davies and McIntosh2018). The availability of GWAS data enables the conduct of Mendelian randomization (MR) analysis, which is considered a powerful approach making use of genetic variation as random experiment to evaluate the causal association between two traits or diseases when such relationships cannot be directly evaluated using clinical trials (Davies, Holmes, & Davey Smith, Reference Davies, Holmes and Davey Smith2018). Its principles were described clinically elsewhere (Davies et al., Reference Davies, Holmes and Davey Smith2018). In brief, genetic variants that influence the susceptibility to a disease/trait (like depression as exposure) could serve as instruments and determine the association of lifelong risk of another disease/trait (like CAD as outcome). The randomly assigned genetic variants utilized in MR analyses were fixed at conception, making MR findings less likely to be influenced by unmeasured confounding and reverse causation when compared to observational studies (Davies et al., Reference Davies, Holmes and Davey Smith2018), relying on several assumptions (Fig. 1). In this study, we adopted a bi-directional two-sample MR approach to infer causality between genetically determined depression and several types of CVD after confirming genetic correlation exists between the traits (Fig. 1). We also aim to identify the potential mediators in the causal pathway.
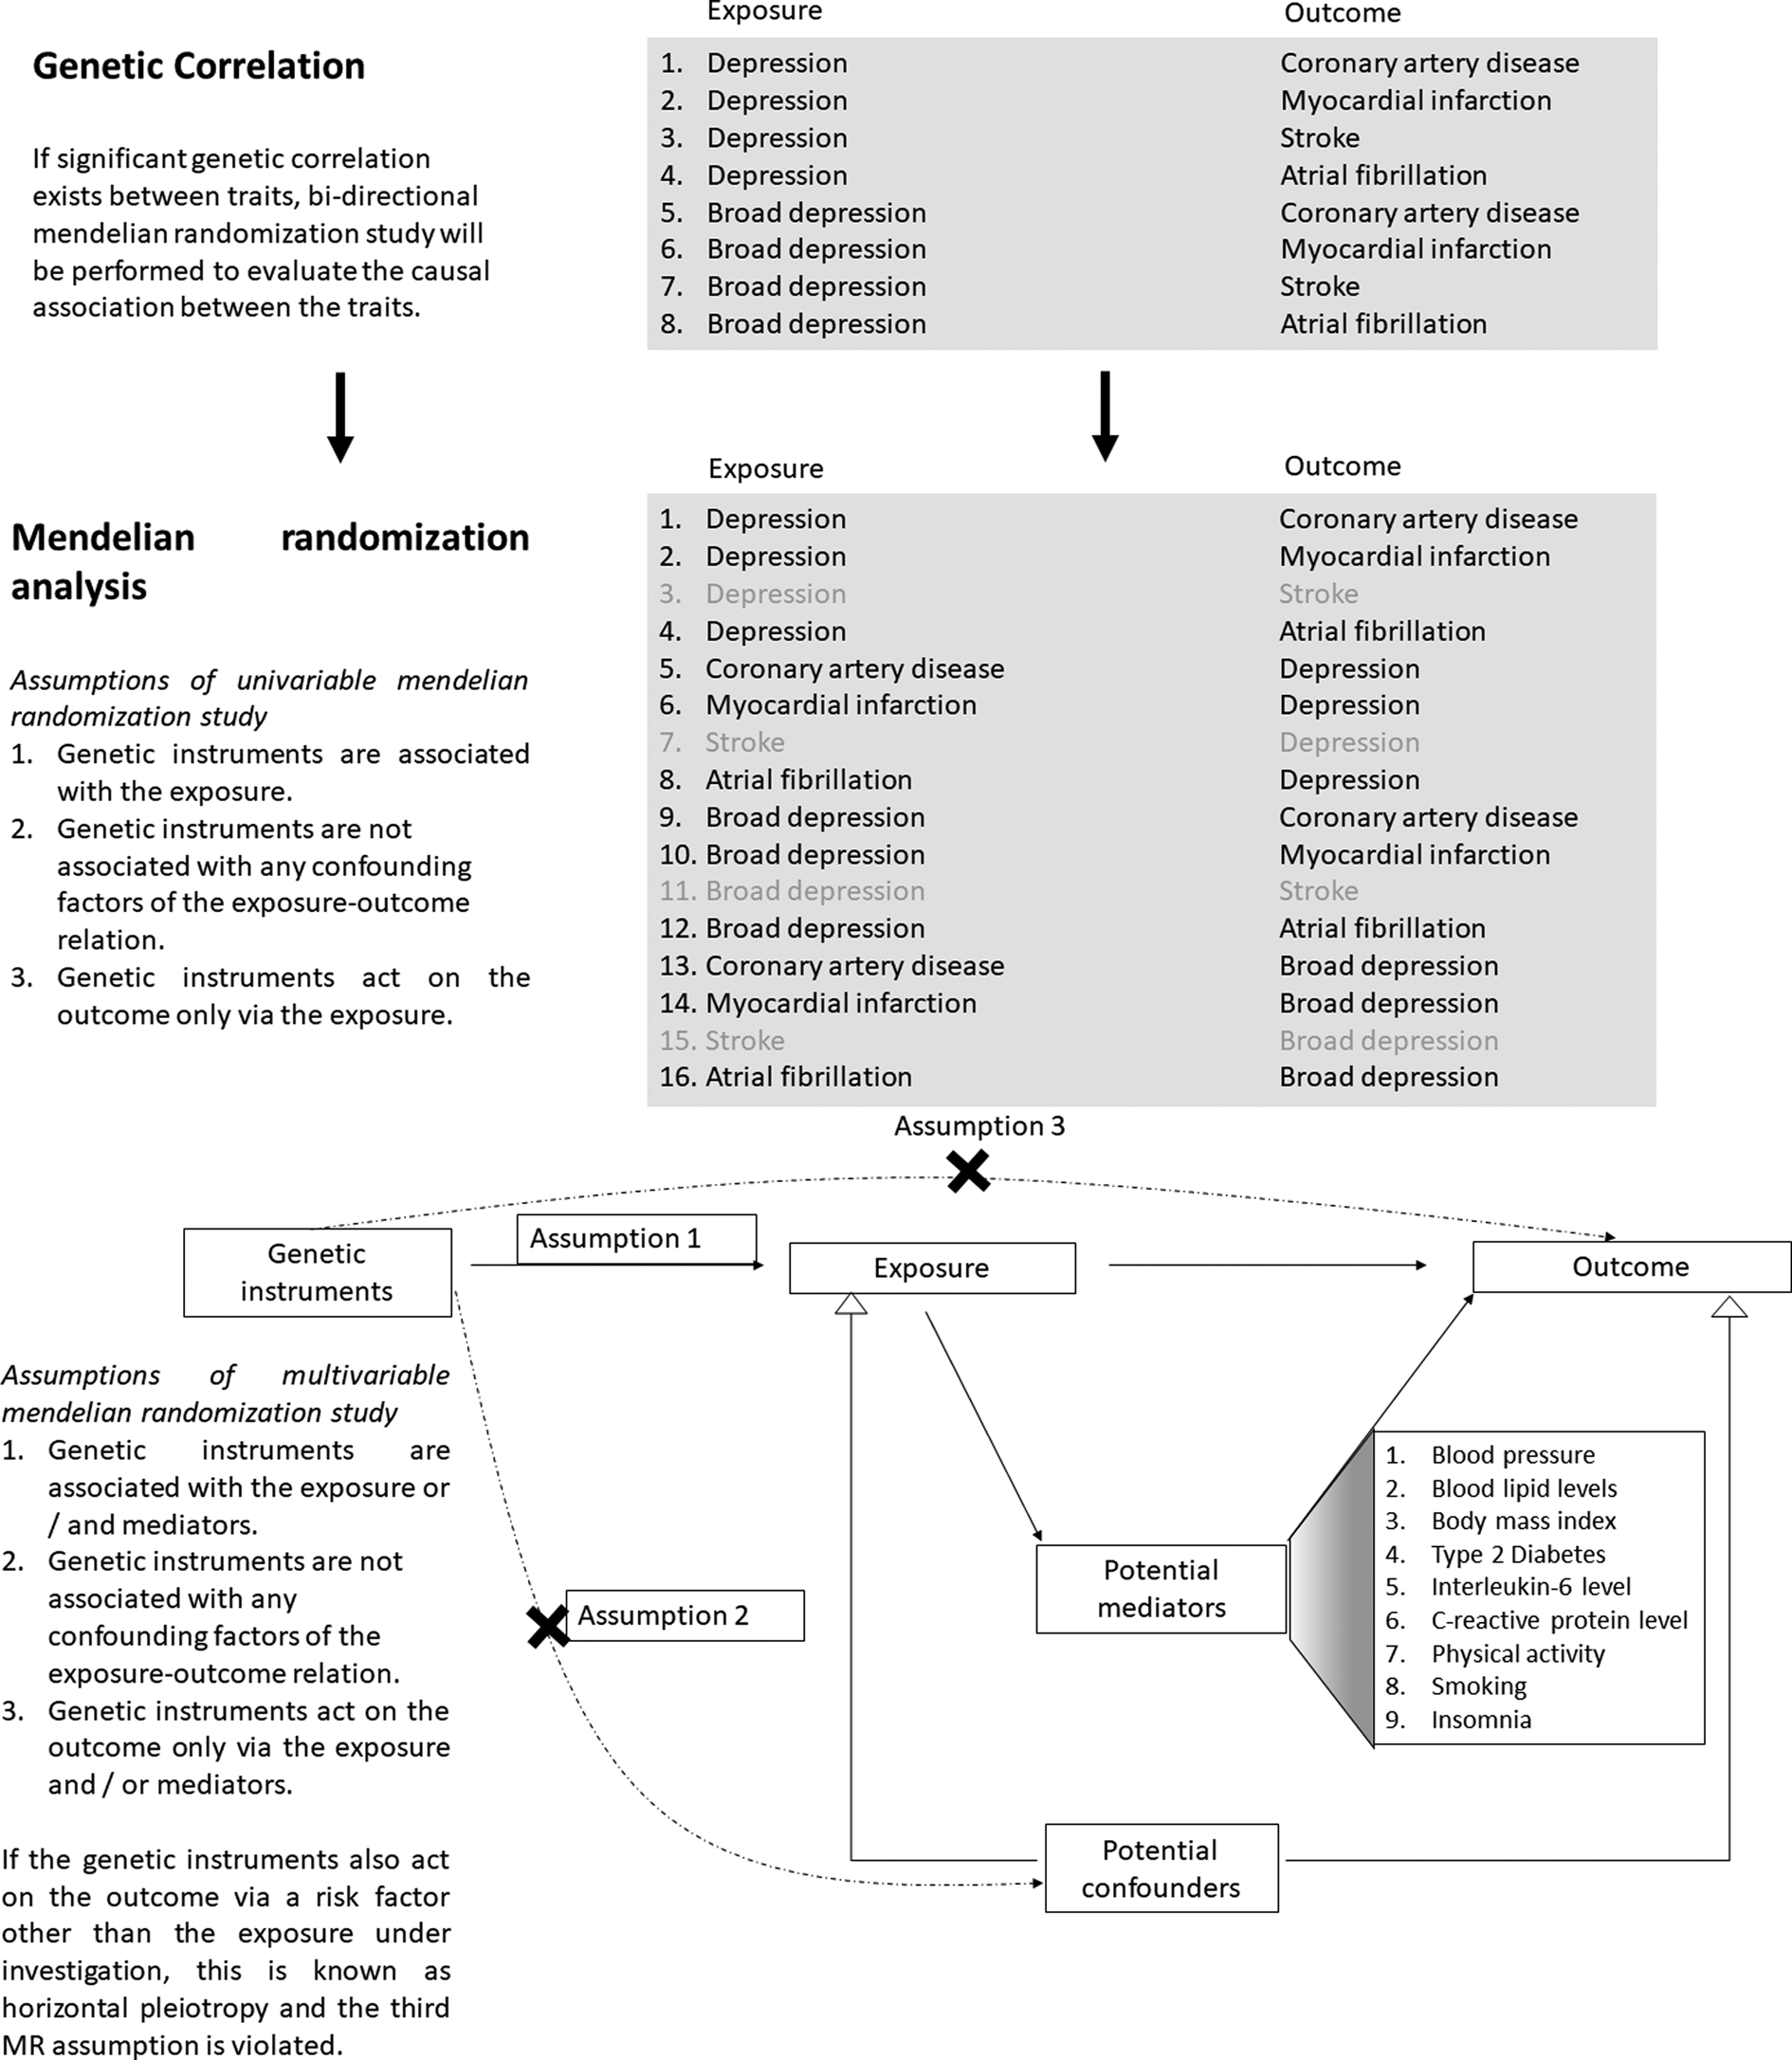
Fig. 1. Study design of the current study: genetic correction and mendelian randomization analysis.
Methods
Data sources
The meta-analysis of depression conducted by Howard et al. (Reference Howard, Adams, Clarke, Hafferty, Gibson, Shirali and McIntosh2019) included the three largest GWAS using different depression phenotypes in participants from 23andMe, PGC and UK Biobank (Howard et al., Reference Howard, Adams, Clarke, Hafferty, Gibson, Shirali and McIntosh2019). Notably, the summary statistics of all genetic variants in the study by Howard et al. were only publicly available in the form of the meta-analysis of PGC and UK Biobank studies without samples from 23andMe, comprising 170 756 cases and 329 443 controls. Taking into account the GWAS sample size of different depression phenotypes, the primary analyses in the current study examines the relationship between depression and various CVD, with depression defined by the meta-analysis of PGC (self-reported diagnosis together with conventional identification methods) and UK Biobank (broad depression) studies comprising 500 199 individuals. Meanwhile, the broad depression dataset is a subset of the GWAS meta-analysis of depression conducted by Howard et al. (Reference Howard, Adams, Clarke, Hafferty, Gibson, Shirali and McIntosh2019). Due to its relatively small sample size, only 14 SNPs reached genome-wide significance, limiting the number of genetic instruments employed in MR analyses. In view of the anticipated low power, MR analyses evaluating the causal association between broad depression and CVD were included as secondary analyses.
In evaluating the genetic correlation/causal association between depression phenotypes and various CVD, summary statistics of genetic instruments were extracted from the largest possible publicly available GWAS/GWAS meta-analysis. Out of the 15 GWAS datasets from which summary statistics were extracted, 13 of the GWAS were conducted in Europeans only, while two GWAS comprised approximately 80% participants of European ancestry. Biases of the causal estimates may arise due to sample overlap. If both the case and control participants in the outcome dataset are also in the exposure dataset, the extent of bias is a linear function of the proportion of overlap between the exposure and outcome datasets (Burgess, Davies, & Thompson, Reference Burgess, Davies and Thompson2016). Therefore, GWAS datasets with minimal chance of sample overlap were chosen. For example, there was a published GWAS meta-analysis of CAD comprising UK Biobank participants, with a larger sample size but possible sample overlap with depression datasets. To avoid any possible biases due to sample overlap, we conducted the MR analyses using a smaller CAD dataset without UK Biobank participants.
On the other hand, depression is reported to be associated with several risk factors of CVD, including blood pressure (Lewington et al., Reference Lewington, Clarke, Qizilbash, Peto, Collins and Prospective Studies2002; Sparrenberger et al., Reference Sparrenberger, Cichelero, Ascoli, Fonseca, Weiss, Berwanger and Fuchs2009), levels of blood lipid [low-density lipoprotein cholesterol (LDL-C), high-density lipoprotein cholesterol (HDL-C) and triglycerides] (Enko et al., Reference Enko, Brandmayr, Halwachs-Baumann, Schnedl, Meinitzer and Kriegshauser2018; Welty, Reference Welty2013), body mass index (BMI) (Khan et al., Reference Khan, Ning, Wilkins, Allen, Carnethon, Berry and Lloyd-Jones2018; Luppino et al., Reference Luppino, de Wit, Bouvy, Stijnen, Cuijpers, Penninx and Zitman2010), type-2 diabetes (Kannel & McGee, Reference Kannel and McGee1979; Vancampfort et al., Reference Vancampfort, Mitchell, De Hert, Sienaert, Probst, Buys and Stubbs2015), inflammatory markers [levels of interleukin-6 (IL-6) and C-reactive protein (CRP) (Pepys & Hirschfield, Reference Pepys and Hirschfield2003) as proxies of systemic inflammation] (Howren, Lamkin, & Suls, Reference Howren, Lamkin and Suls2009; Libby, Reference Libby2006), physical activity (in terms of average acceleration measured by wrist-worn accelerometer) (Kamphuis et al., Reference Kamphuis, Geerlings, Tijhuis, Giampaoli, Nissinen, Grobbee and Kromhout2007), smoking status (Ambrose & Barua, Reference Ambrose and Barua2004; Wootton et al., Reference Wootton, Richmond, Stuijfzand, Lawn, Sallis, Taylor and Munafo2019) and insomnia (Larsson & Markus, Reference Larsson and Markus2019; Nutt, Wilson, & Paterson, Reference Nutt, Wilson and Paterson2008). However, it remains unknown if these risk factors mediate the association between depression and CVD, or depression itself is an independent risk factor (Carney & Freedland, Reference Carney and Freedland2017). By multivariable MR approach (Burgess et al., Reference Burgess, Thompson, Rees, Day, Perry and Ong2017; Burgess & Thompson, Reference Burgess and Thompson2015), we examine if such risk factors may potentially mediate the association between depression and CVD. Data sources of exposures, potential mediators and outcomes are listed in online Supplementary Table S1.
Estimation of genetic correlation
Using genome-wide summary statistics, linkage disequilibrium (LD) score regression (LDSC) (Bulik-Sullivan et al., Reference Bulik-Sullivan, Finucane, Anttila, Gusev, Day, Loh and Neale2015a, Reference Bulik-Sullivan, Loh, Finucane, Ripke, Yang and Neale2015b) was employed to estimate the genetic correlation between two depression phenotypes and various CVD [including MI, stroke and AF but not CAD which was evaluated in the original GWAS (Howard et al., Reference Howard, Adams, Shirali, Clarke, Marioni, Davies and McIntosh2018, Reference Howard, Adams, Clarke, Hafferty, Gibson, Shirali and McIntosh2019)]. As these complex diseases were affected by thousands of genetic variants with small effect size, utilizing genome-wide data in genetic correlation analyses might provide more information regarding their genetic etiology than using only the significantly associated SNPs in MR studies, which also depend on the statistical power of respective GWAS. Therefore, LCSD was firstly employed to unravel the genetic correlation between diseases, providing insights on shared genetic ethology between diseases. The results of genetic correlation analyses subsequently help to prioritize the identification of likely causal relationships (Bulik-Sullivan et al., Reference Bulik-Sullivan, Finucane, Anttila, Gusev, Day, Loh and Neale2015a). Pre-computed LD scores suitable for European-ancestry samples and Python command line tool were used.
Selection of genetic instruments for MR analyses
The causal association was tested between genetically correlated depression/broad depression and CVD trait pairs. The genetic instruments adopted in univariable and multivariable MR analyses for each exposure-outcome pair are the same, and they satisfied the MR assumptions (Fig. 1). Briefly, independent GWAS-derived exposure-associated genetic variants, which were not in LD with each other, were initially selected as the genetic instruments to represent genetic predisposition to the exposure trait. The summary statistics of these initial genetic instruments were retrieved from the datasets of outcome and potential mediators. If an initial genetic instrument was unavailable in the GWAS of outcome or potential mediator datasets, a proxy variant in high LD (r 2> 0.8) and present in all the exposure, outcome and potential mediator datasets were selected as the genetic instrument to replace the initial one. If no proxies could be identified, the genetic instrument was excluded from MR analysis. One of the MR assumptions is that the genetic instruments only act on the outcome via the exposure and/or potential mediators (Fig. 1). Violation of this assumption is known as horizontal pleiotropy. Pleiotropic genetic instruments associated with the outcome through pathways other than the exposure/mediators under investigation were excluded from MR analyses. Such genetic variants were defined as those with a genome-wide significant association with alternative pathways in GWAS conducted by representative consortiums, as revealed by the web-interfaced PhenoScanner (Staley et al., Reference Staley, Blackshaw, Kamat, Ellis, Surendran, Sun and Butterworth2016), a curated database of publicly available GWAS. If MR pleiotropy residual sum and outlier (MR-PRESSO) identified outliers, the MR analyses were repeated after exclusion of the outliers. Genetic instruments selected by the above procedures constituted the main analysis. As a sensitivity analysis, the MR analysis was repeated after excluding the genetic instruments which did not reach genome-wide significance in the exposure dataset (such as proxies). Detailed selection of genetic instruments is elaborated in Supplementary Methods 1. The number of genetic instruments and summary statistics applied in each MR analysis are included in Table 1 and online Supplementary Tables S2–S13 respectively.
Table 1. Power calculation of MR analysis for depression phenotypes and various CVD

Power calculation
The proportion of variance in the exposure explained by the genetic instruments was derived from the Mangrove package (Jostins, Reference Jostins2017) in R, which also takes into account the disease prevalence. An online web tool, mRnd (http://cnsgenomics.com/shiny/mRnd/) (Brion, Shakhbazov, & Visscher, Reference Brion, Shakhbazov and Visscher2013), was employed to perform power calculation. Strength of genetic instruments for each MR analysis is presented in Table 1. For each pair of the causal relationship under investigation, a plot of power against odds ratio of the true underlying association is shown in online Supplementary Fig. S1.
MR analyses
All the genetic instruments were oriented such that the effect alleles were positively associated with the exposure. The effect alleles were matched across the summary data of the exposure, potential mediator and outcome dataset. Due to the unavailability of effect allele frequency of some GWAS datasets, allele frequencies were not used to align palindromic genetic instruments on ambiguous strands across different datasets. Non-palindromic proxies in high LD (r 2 ⩾ 0.8) were identified for the palindromic instruments (Hartwig, Davies, Hemani, & Davey Smith, Reference Hartwig, Davies, Hemani and Davey Smith2016). Univariable inverse-variance weighted (IVW) method was used for main MR analysis to assess the total effect of the exposure on the outcome (Burgess, Butterworth, & Thompson, Reference Burgess, Butterworth and Thompson2013; Burgess et al., Reference Burgess, Thompson, Rees, Day, Perry and Ong2017). Weighted median method (Bowden, Davey Smith, Haycock, & Burgess, Reference Bowden, Davey Smith, Haycock and Burgess2016) was employed as a sensitivity analysis. MR-Egger intercept test (Bowden, Davey Smith, & Burgess, Reference Bowden, Davey Smith and Burgess2015) and global test of MR-PRESSO (Verbanck, Chen, Neale, & Do, Reference Verbanck, Chen, Neale and Do2018) were employed to detect for the presence of pleiotropy. In case univariable MR analysis suggested the presence of causal association, multivariable IVW analysis was also performed to dissect the mechanisms in the causal pathway from the risk factor to the outcome (Burgess & Thompson, Reference Burgess and Thompson2015; Burgess et al., Reference Burgess, Thompson, Rees, Day, Perry and Ong2017). It was reported that the causal estimates derived from univariable MR analysis represents the total effect of the exposure on the outcome. Multivariable MR analysis can be used to estimate the direct causal effect of the exposure on the outcome by keeping the potential mediator constant. Presence of difference between the causal estimates of the univariable (total effect) and multivariable MR analysis (direct causal effect) implies that causal effect acts at least in part via the potential mediator (indirect effect) (Burgess et al., Reference Burgess, Thompson, Rees, Day, Perry and Ong2017). Multivariable MR-Egger intercept test was applied to detect the presence of residual pleiotropy via other unmeasured risk factors (Rees, Wood, & Burgess, Reference Rees, Wood and Burgess2017). Different methods of MR analyses are described in Supplementary Methods 2.
As the exposures in all the MR analyses are binary variables, the causal estimates were initially equivalent to the change in the outcome per unit change in the exposure on the log odds scale (=exponential 1, i.e. 2.72-fold change in the odds of the exposure). For the sake of interpretation, the causal estimates were converted by multiplying 0.693 (=ln 2) and then exponentiating to represent the change in outcome per 2-fold change in the prevalence of the exposure (Burgess & Labrecque, Reference Burgess and Labrecque2018).
Results
Genetic correlation
Genetic correlation between the depression phenotypes and various CVD are shown in Table 2. Depression had a strong and positive genetic correlation with broad depression (rG = 0.9732; s.e. = 0.0041; p = 0). A positive significant genetic correlation was observed for both depression phenotypes with MI (depression: rG = 0.1688; s.e. = 0.0294; p = 9.03 × 10⁻⁹; broad depression: rG = 0.1231; s.e. = 0.0324; p = 1 × 10⁻⁴) and AF (depression: rG = 0.1124; s.e. = 0.0251; p = 7.80 × 10⁻⁶; broad depression: rG = 0.1258; s.e. = 0.0272; p = 3.62 × 10⁻⁶), but not with stroke. In addition to CAD which was demonstrated to be genetically correlated with depression phenotypes (Howard et al., Reference Howard, Adams, Shirali, Clarke, Marioni, Davies and McIntosh2018, Reference Howard, Adams, Clarke, Hafferty, Gibson, Shirali and McIntosh2019), bi-directional two-sample MR was conducted for six pairs of traits (two depression phenotypes v. CAD, MI and AF).
Table 2. Genetic correlation among the two depression phenotypes and various CVD

a Genetic correlation between the two depression phenotypes and coronary artery disease were computed in the original GWAS (Howard et al., Reference Howard, Adams, Shirali, Clarke, Marioni, Davies and McIntosh2018)/GWAS meta-analysis (Howard et al., Reference Howard, Adams, Clarke, Hafferty, Gibson, Shirali and McIntosh2019). The relevant figures were extracted here.
Two-sample MR of depression and CVD
To account for multiple testing, we applied a conservative Bonferroni corrected threshold (α = 4.167 × 10−3 = 0.05/12) in the subsequent two-sample bi-directional MR analyses. The primary analysis aims to evaluate the causal relationship between depression and various types of CVD. With 93 genetic instruments in the main analysis, univariable IVW method demonstrated that genetically doubling the odds of depression increased the risk of CAD and MI by 9.9% and 14.6%, respectively (CAD: OR = 1.099; 95% CI 1.031–1.170; MI: OR = 1.146; 95% CI 1.070–1.228) (Fig. 2a; online Supplementary Figs S2a and S3a). Sensitivity analysis of weighted median method yielded similar estimates (CAD: OR = 1.138; 95% CI 1.042–1.242; MI: OR = 1.163; 95% CI 1.057–1.281). The association remained significant after corrected for multiple testing. In multivariable IVW analysis adjusting for beta estimates of smoking status, the causal association between depression and CAD/MI were attenuated (CAD: OR = 1.027; 95% CI 0.956–1.103; MI: OR = 1.053; 95% CI 0.975–1.139). With adjustment for blood lipid levels, the causal association was also attenuated between depression and CAD (OR = 1.060; 95% CI 0.994–1.130), but not for MI. There was little change in causal estimate after adjustment for other potential mediators (Fig. 2b). MR-Egger intercept tests were insignificant in all univariable and multivariable MR analyses of depression on both CAD and MI (p > 0.05) (Figs 2a and 2b). MR-PRESSO global tests did not detect any horizontal pleiotropy (p > 0.05) (Fig. 2a).

Fig. 2. Result of Mendelian Randomization analysis in evaluating the casual association between depression and various CVD. (a) Casual estimates for various CVD (in odds ratio) per doubling of the odds of depression in univariable MR analyses. (b) Causal estimates for various CVD (in odds ratio) per doubling of the odds of depression in multivariable MR analyses.
In the sensitivity analyses, genetic instruments which no longer attained genome-wide significance in the depression dataset were excluded. The same pattern of results was observed. With 34 genetic instruments, univariable IVW analysis showed that genetic predisposition to increased risk of depression was causally linked to increased risk of CAD and MI (CAD: OR = 1.103; 95% CI 1.014–1.199; MI: OR = 1.180; 95% CI 1.068–1.303). Similar causal estimates were obtained from the weighted median method (CAD: OR = 1.131; 95% CI 1.004–1.274; MI: OR = 1.162; 95% CI 1.014–1.331) (Fig. 3a; online Supplementary Figs S2b and S3b). In multivariable MR analysis, the causal association of depression with both CAD and MI was attenuated after adjustment for beta estimates of smoking status (CAD: OR = 1.030; 95% CI 0.931–1.138; MI: OR = 1.085; 95% CI 0.971–1.213) (Fig. 3b). In addition, the causal association between depression and CAD was also attenuated when adjusted for blood lipid levels (OR = 1.041; 95% CI 0.948–1.143), type 2 diabetes (OR = 1.083; 95% CI 0.994–1.180), BMI (OR = 1.079; 95% CI 0.992–1.175) and blood pressure (OR = 1.086; 95% CI 0.996–1.183) in multivariable MR analyses. MR-PRESSO global tests, as well as MR-Egger intercept tests in both univariable and multivariable MR analyses, were insignificant (p > 0.05), indicating the absence of horizontal pleiotropy.

Fig. 3. Sensitivity analysis results in evaluating the causal association between depression and various CVD using only genetic instruments that remained genome-wide significant in the samples excluding 23andme cohort. (a) Causal estimates for various CVD (in odds ratio) per doubling of the odds of depression in univariable MR analysis. (b) Causal estimates for various CVD (in odds ratio) per doubling of the odds of depression in multivariable MR analysis.
Using 93 genetic instruments in the main analysis, univariable IVW analyses showed null causal association between depression and AF (Fig. 2a). While MR-Egger intercept test suggested no evidence of pleiotropy, MR-PRESSO suggested three horizontal pleiotropy outliers were present. Consistent null causal association was observed after excluding the outliers with the use of 90 instruments (Fig. 2a, online Supplementary Fig. S4). MR-PRESSO global test was still statistically significant (p = 0.002), implying that overall horizontal pleiotropy might be present. However, MR-PRESSO did not identify any significant outliers of horizontal pleiotropy. In sensitivity analysis including only 34 instruments reaching genome-wide significance in the meta-analysis of depression, there was null causal association between depression and AF in the univariable analysis. Insignificant MR Egger intercept and MR-PRESSO global tests implied the absence of horizontal pleiotropy (Fig. 3a; online Supplementary Fig. S4b).
We found no evidence of causal effects of any CVD on depression (online Supplementary Table S14a and Figs S5–S7). MR-Egger intercept and MR-PRESSO global tests did not detect any horizontal pleiotropy outliers.
In the secondary analysis evaluating the causal relationship between broad depression and various CVD, a similar pattern of results was obtained. Results of the secondary analysis were detailed in online Supplementary Text 1, Supplementary Figs S8–S15.
Discussion
In this study, we demonstrate the presence of the genetic correlation between depression and MI, as well as AF. The primary two-sample MR analysis provides evidence that genetically increasing odds of depression are causally associated with increased risk of CAD and MI. We found no evidence on the presence of the causal relationship between depression and AF. Reverse causation of CVD on depression is not detected. The same pattern of results was observed in the secondary analysis which assesses the causal relationship between broad depression (as a subset of depression) and CVD. We also investigated if any potential mediator plays a role in the causal pathway from depression to CVD.
Our LDSC analysis revealed that depression and broad depression were strongly correlated with each other. A positive genetic correlation was present between both depression phenotypes and MI, as well as AF. A genetic correlation was also reported between depression and CAD (Howard et al., Reference Howard, Adams, Shirali, Clarke, Marioni, Davies and McIntosh2018, Reference Howard, Adams, Clarke, Hafferty, Gibson, Shirali and McIntosh2019), suggesting these traits may have shared genetic etiology. Stroke was the only tested CVD trait which did not have a genetic correlation with both depression phenotypes. As causal association was less likely in the absence of genetic correlation, subsequent MR analysis was not performed in the current study. In line with this, a two-sample MR analysis did not support the presence of a causal relationship between genetically determined risk of depression on ischemic stroke (Gill et al., Reference Gill, James, Monori, Lorentzen, Fernandez-Cadenas and Lemmens2019).
We inferred causality of depression on various CVD by MR approach as our primary analysis. Univariable IVW analysis using 93 genetic instruments showed that genetically doubling the odds of depression increased the risk of CAD and MI by 9.9% (OR = 1.099) and 14.6% (OR: 1.146), respectively. The causal association remained significant after corrected for multiple testing. Similar causal estimates were obtained in the sensitivity analysis using 34 genetic instruments. These are consistent with the previous meta-analysis of population-/community-based prospective cohort studies (Gan et al., Reference Gan, Gong, Tong, Sun, Cong, Dong and Lu2014). Results from MR-Egger intercept and MR-PRESSO global tests implied that horizontal pleiotropy is unlikely. The current study provides robust evidence on the causality of depression on CAD and MI. A similar pattern of results was observed in the secondary analysis evaluating the causal effects of broad depression on CAD and MI.
Depression and CVD are hypothesized to be linked by several biological (inflammatory processes, dysfunction in the autonomic nervous system, endothelial and platelet dysfunction) and behavioral mechanisms (physical exercise, medical treatment and smoking) (Carney & Freedland, Reference Carney and Freedland2017). We evaluated some of the above mechanisms using multivariable MR analyses. The attenuation of the causal effect of genetically determined depression on CAD/MI after adjustment for smoking status suggested that smoking status might potentially mediate the causality. Patients with depression may smoke as ‘self-medication’ to alleviate symptoms of the illness or side-effects of medications (Wootton et al., Reference Wootton, Richmond, Stuijfzand, Lawn, Sallis, Taylor and Munafo2019) but toxic components of cigarettes might increase the incidence of CAD and MI by inflammation, thrombosis or increase in oxidative stress (Ambrose & Barua, Reference Ambrose and Barua2004). On the other hand, multivariable MR analysis adjusted for blood lipid levels (LDL-C, HDL-C and triglycerides) attenuated the causality between depression and CAD. Patients with MDD were reported to have lower HDL-C, higher triglycerides (Enko et al., Reference Enko, Brandmayr, Halwachs-Baumann, Schnedl, Meinitzer and Kriegshauser2018) and LDL-C (Parekh, Smeeth, Milner, & Thure, Reference Parekh, Smeeth, Milner and Thure2017) levels in serum. One possible explanation for such lipid profile could be life-style-related factors (Enko et al., Reference Enko, Brandmayr, Halwachs-Baumann, Schnedl, Meinitzer and Kriegshauser2018), such as sedentary behaviors and poor adherence to physical exercises and diet [e.g. eating comfort food rich in fats and sugar to improve mood (Atlantis et al., Reference Atlantis, Lange, Goldney, Martin, Haren, Taylor and Wittert2011)] for patients with depression (Carney & Freedland, Reference Carney and Freedland2017). Meanwhile, a combination of low HDL-C, high LDL-C and triglyceride levels are well-known risk factors of atherosclerosis (Welty, Reference Welty2013), and thus increasing the risk of CAD. For broad depression, the causal association with CAD was attenuated after adjusting for blood lipid levels, type 2 diabetes, BMI, blood pressure and smoking status in multivariable MR analysis, indicating that causality might be partly mediated by these factors. This is further discussed in Supplementary Text 1. Due to the difference in definitions (detailed in Supplementary Text 2), slightly different results of MR analyses of depression and broad depression on CAD/MI were observed in the present study, which is discussed in Supplementary Text 3. A few published MR studies also investigated the causality between depression and CVD traits. Comparison with these studies is further discussed in Supplementary Text 4.
There are several clinical implications. Our research findings suggest that genetic predisposition to depression is a causal risk factor of CAD and MI, leading to the hypothesis that alleviation in depression might reduce the risk of CAD and MI. Although a few randomized controlled trails (RCTs) demonstrated that antidepressant therapy improved depression but had no effect on cardiac outcomes (Berkman et al., Reference Berkman, Blumenthal, Burg, Carney, Catellier and Cowan2003; Zuidersma et al., Reference Zuidersma, Conradi, van Melle, Ormel and de Jonge2013), such null effect might be because the antidepressant intervention on depression was weak and short-term that did not pose much effect on the long-term cardiac outcome (Shapiro, Reference Shapiro2013). In addition, some depression-related medications would result in arrhythmias (Girardin et al., Reference Girardin, Gex-Fabry, Berney, Shah, Gaspoz and Dayer2013), weight gain (Gafoor, Booth, & Gulliford, Reference Gafoor, Booth and Gulliford2018) and type 2 diabetes (Galling et al., Reference Galling, Roldan, Nielsen, Nielsen, Gerhard, Carbon and Correll2016), which are known risk factors of CVD (Girardin et al., Reference Girardin, Gex-Fabry, Berney, Shah, Gaspoz and Dayer2013). The robust causal association between depression and CAD/MI strengthens the idea that prevention and early diagnosis of depression or related mood disorder may help preventing CVD. Moreover, the depression definition adopted in this study is a mix of self-reported diagnosis together with conventional methods like structured diagnostic interviews, as well as broad depression, which represents self-awareness of mood problems (a stage preceding and not necessarily a clinical diagnosis of depression), and a proxy phenotype of stress. In a recent population-based, sibling controlled cohort study comprising 136 637 patients with stress-related disorders, the crude incidence rate of any CVD in these patients were higher than their unaffected siblings and matched unexposed individuals from the general population (Song et al., Reference Song, Fang, Arnberg, Mataix-Cols, Fernandez de la Cruz, Almqvist and Valdimarsdottir2019). A meta-analysis of 46 cohorts with 2 017 276 participants (222 253 with an anxiety disorder) revealed that anxiety was associated with an elevated risk of coronary heart disease, heart failure, but not AF (Emdin et al., Reference Emdin, Odutayo, Wong, Tran, Hsiao and Hunn2016). The findings of our study may partly explain the comorbidity of stress-related and anxiety disorders with CVD. Given the potential mediating roles of smoking and blood lipid levels in the causal pathway of depression to CVD, appropriate stress management strategies with a change of lifestyle-related factors (such as smoking cessation and intake of less comfort foods of high energy) may be warranted to prevent CVD in patients with depression, stress-related or anxiety disorders.
The current study has several strengths. MR approach is applied to infer causality between two diseases, which is infeasible by RCT, as it is unethical to leave the patients with one disease untreated with the aim to observe the occurrence of another disease outcome. Two-sample MR approach is reported to have increased statistical power particularly for testing causality on binary disease outcomes (Lawlor, Reference Lawlor2016). Genetic instruments adopted in this study were selected from the largest possible and well-powered GWAS studies. Hence, the current study is well-powered (online Supplementary Fig. S1). The relatively high F-statistic (⩾1523.43) of the genetic instruments involved in the main primary MR analyses of depression implied a lower chance of weak instrument bias. Although the genetic instruments employed in the MR analyses of broad depression (Table 1) were relatively weak, this should have causal estimates biased towards the null in two-sample MR analysis (Pierce & Burgess, Reference Pierce and Burgess2013). The causality inferred for broad depression is thus unlikely to be false positive.
This study also has limitations. Firstly, functions of the genetic instruments and how they influence the risk factors were not fully understood. Although we intended to be stringent in identifying pleiotropic instruments based on the information available in PhenoScanner in order to exclude genetic instruments likely to have horizontal pleiotropy with the outcome, it is possible that the genetic instruments may have an indirect effect on the outcome via a currently unknown pathway that does not involve the risk factor of interest. Nevertheless, we addressed this issue by adopting MR-Egger intercept and MR-PRESSO tests, though it cannot be ruled out unequivocally. Secondly, we attempted to reveal the potential mediators in the causal pathway from depression to CVD by multivariable MR analysis. However, we acknowledged that the list of potential mediators being examined may not be exhaustive and future studies on additional potential mediators are warranted. Thirdly, two out of the 15 GWAS datasets from which the summary statistics were extracted from comprised predominantly Europeans (approximately 80%). Population stratification may confound the association between depression and various CVD, violating one of the MR assumptions. Nevertheless, adjustments for principal components were performed in the respective GWAS (Hoffmann et al., Reference Hoffmann, Ehret, Nandakumar, Ranatunga, Schaefer, Kwok and Risch2017; Nikpay et al., Reference Nikpay, Goel, Won, Hall, Willenborg, Kanoni and Farrall2015), alleviating the potential effects of population stratification on the MR findings. Fourthly, we intended to explore the potential mediator in the causal pathway from depression to CVD by multivariable MR analysis. Yet, the sample size of GWAS of the two inflammation markers, CRP (n = 9961) (Prins et al., Reference Prins, Kuchenbaecker, Bao, Smart, Zabaneh, Fatemifar and Zeggini2017) and IL-6 (n = 8293) (Ahola-Olli et al., Reference Ahola-Olli, Wurtz, Havulinna, Aalto, Pitkanen, Lehtimaki and Raitakari2017), were small. The roles of various inflammatory markers in the causal pathway may be examined again when summary statistics from larger GWAS become available. Fifthly, study participants included in the depression meta-analysis were not screened for CVD at baseline and vice versa. The presence of outcome in the exposure dataset may inflate the causal estimates in MR analyses. However, this is a general limitation of two-sample MR analyses and is inevitable without individual-level data. Sixthly, non-overlapping samples were utilized in the exposure and outcome datasets as far as possible to avoid bias. However, due to the unavailability of the raw genetic data, we could not determine the proportion of sample overlap between exposure and outcome datasets.
In conclusion, genetic predisposition to depression is causally associated with CAD and MI, but reverse causation is not observed. Genetic susceptibility to increased self-awareness of mood problems, preceding and not necessarily a clinical diagnosis of depression, may be a strong causal risk factor of CAD and MI. The causal association contributes to the shared comorbidity of depression and CAD/MI.
Supplementary material
The supplementary material for this article can be found at https://doi.org/10.1017/S0033291720003566.
Author contributions
GHL and CLC had full access to all the data in the study and took responsibility for the integrity of the data and the accuracy of the data analysis. GHL and CLC designed the study and wrote the first draft of the manuscript. GHL, CLC, AKC, BMC, ICW, MLF, PCA and PCS interpreted, critically evaluated, and improved the study design and manuscript, and shared the responsibility for the final manuscript and the decision to submit. GHL and CLC were responsible for data collection and evaluation, and approval of the manuscript.
Conflicts of interest
The authors declare no conflict of interest.


