Introduction
Depression is a remarkably destructive problem. Major depressive disorder (MDD) is a leading cause of medical disability worldwide (World Health Organization, 2014) and costs the USA over $210 billion each year (Greenberg et al. Reference Greenberg, Fournier, Sisitsky, Pike and Kessler2015). An indicator of its complexity, depression is also resistant to change. Despite decades of widespread intervention, research and public awareness efforts, prevalence rates of MDD remain stable (Ferrari et al. Reference Ferrari, Charlson, Norman, Patten, Freedman, Murray, Vos and Whiteford2013). Antidepressant medications, while being used at an all-time high (National Center for Health Statistics, 2014), have not demonstrated a consistent advantage over placebo pills (Kirsch et al. Reference Kirsch, Deacon, Huedo-Medina, Scoboria, Moore and Johnson2008), and only half of psychotherapy patients recover after their first course of treatment (e.g. Barber et al. Reference Barber, Barrett, Gallop, Rynn and Rickels2012; Carter et al. Reference Carter, McIntosh, Jordan, Porter, Frampton and Joyce2013).
Major public health problems often persist, despite best efforts to intervene, when they are more complex than the narrow frameworks used to understand them (Sterman, Reference Sterman2006). As physicist Bohm (Reference Bohm1980) warned, ‘…the notion that the fragments are really separate is, in essence, what has led to the growing series of extremely urgent crises that is confronting us today’ (p. 2). Narrow perspectives of depression are common and are reflected in the theories of pathogenesis that range from cognitive theory (Beck, Reference Beck2008) to the hypothalamic–pituitary–adrenal (HPA) axis dysfunction theory (Pariante & Lightman, Reference Pariante and Lightman2008), inflammation theory (Miller et al. Reference Miller, Maletic and Raison2009), neurodegenerative theory (Wainwright & Galea, Reference Wainwright and Galea2013) and stress generation theory (Hammen, Reference Hammen2006), among others. To understand how frequently research is guided by the common-cause view of depression, we calculated roughly the number of published studies that examined MDD and a single variable or multiple variables related to depressive pathogenesis. We searched PubMed for articles published between 1980 and 2014 that included the term ‘major depressive disorder’ and key variable terms designed to optimize the relevancy of results returned (see the online Supplementary material for details). The numbers of published MDD studies that addressed one variable are represented on the diagonal in Table 1 and the remaining figures reflect studies on more than one key MDD variable. The search identified 12 060 articles; about 93% (n = 11 169) studied one key variable and only 7% (n = 891) studied two or more. The lack of published works on the intersecting agents that drive depression is striking.
Table 1. Results of PubMed search for articles on major depressive disorder 1980–2014 a

a For a more comprehensive description of search terms and procedures, see Appendix A in the online Supplementary material.
New frameworks have been suggested in place of the common-cause approach (e.g. Kendler et al. Reference Kendler, Zachar and Craver2011; Insel, Reference Insel2014). Kendler et al. (Reference Kendler, Zachar and Craver2011) recommended a shift from seeking an ‘essence’ that is directly responsible for a mental disorder to delineating the complex causal mechanisms that underlie psychiatric syndromes. Network and dynamic methods have been recommended for such investigations (e.g. Borsboom & Cramer, Reference Borsboom and Cramer2013; van De Leemput et al. Reference Van De Leemput, Wichers, Cramer, Borsboom, Tuerlinckx, Kuppens, Van Nes, Viechtbauer, Giltay, Aggen, Derom, Jacobs, Kendler, Van Der Maas, Neale, Peeters, Thiery, Zachar and Scheffer2014) since traditional psychometric approaches often assume a linear and latent variable model and cannot estimate intra-individual effects. System dynamic modeling is a useful tool for understanding how diverse causal feedback mechanisms create a systemic syndrome with heterogeneous patient trajectories (Sterman, Reference Sterman2000). It uses an iterative process of gathering diverse data, diagraming causal mechanisms from a whole-system perspective, and quantifying and validating a simulation model (Forrester, Reference Forrester1994).
In this paper, we present the first causal loop diagram of adult depression dynamics. The model builds upon prior efforts to map mechanisms of depression (Kendler et al. Reference Kendler, Gardner and Prescott2002, Reference Kendler, Gardner and Prescott2006; Stapelberg et al. Reference Stapelberg, Neumann, Shum, McConnell and Hamilton-Craig2011; Borsboom & Cramer, Reference Borsboom and Cramer2013; van De Leemput et al. Reference Van De Leemput, Wichers, Cramer, Borsboom, Tuerlinckx, Kuppens, Van Nes, Viechtbauer, Giltay, Aggen, Derom, Jacobs, Kendler, Van Der Maas, Neale, Peeters, Thiery, Zachar and Scheffer2014; Wichers, Reference Wichers2014), and was developed through a structured review of the literature in which key cognitive, social, environmental and biological drivers of MDD and the interactions among them were identified. Results from the literature review were synthesized and used to model unipolar depression assuming a continuous definition (e.g. Aggen et al. Reference Aggen, Neale and Kendler2005; Hankin et al. Reference Hankin, Fraley, Lahey and Waldman2005). In the next section, we will introduce important methodological concepts such as feedback loops and stock variables and will use a simple system dynamics model of MDD as an illustration of the approach. We will then explain the procedures used in this study, describe the final model, and highlight preliminary insights and opportunities that extensions of the model might provide.
Understanding systems’ dynamics using feedback loops and stock variables
As with most systemic conditions, feedback loops are likely to play a key role in explaining the observed patterns of unipolar depression. Feedback processes regulate dynamic phenomena, from biological and natural systems to ones that are engineered (Richardson, Reference Richardson1999). In the context of depression, they include not only the homeostatic (balancing) processes that keep various neurotransmitters, hormones and other biological mechanisms in approximate balance, but also feedback loops that cut across different domains and may be of a reinforcingFootnote 1 Footnote † nature. For example, economic hardship is a stressor that can increase depressive symptoms. On the other hand, one consequence of increased depressive symptoms is loss of motivation and an increased chance of hurting one's economic wellbeing, e.g. due to job loss. Together, the two causal links create a reinforcing loop, which may trap an individual in increasing financial hardship and depression.
Identifying reinforcing feedback loops is essential in understanding heterogeneous health outcomes across different individuals (Sterman, Reference Sterman2000). A nuanced expression of feedback loops can send people toward unique trajectories, i.e. different health outcomes. Let us consider a simple simulation model designed to illustrate the role of feedback loops (see Fig. 1). In this example, the gap between the environmental stressors an individual is exposed to and his/her regulatory resources for handling those stressors is used as a proxy that informs MDD levels. These regulatory resources may span various cognitive (e.g. positive schemas), social (e.g. close family ties) and material (e.g. food, shelter, economic safety) dimensions. When stressors significantly exceed what an individual can handle given his/her regulatory resources, MDD symptoms manifest in our model. Let us now consider the addition of two feedback loops into this ‘toy’ model. First, assume that a small positive gap between current environmental stressors and an individual's current resource level can stimulate building of resilience, i.e. expands resources. This may happen because in dealing with challenges that are not too hard to overcome, the individual learns new skills, expands his/her positive schemas, or deepens his/her social relationships, all enabling the individual to deal better with the next stressor, i.e. closing a balancing feedback loop that reduces vulnerability to MDD. The second feedback relates to deterioration of those resources as a result of MDD, e.g. through loss of intimacy in relationships, negative rumination or loss of financial independence. Note that this second loop is reinforcing: an episode of MDD leads to a lower resource base, which in turn increases the likelihood of future episodes.

Fig. 1. A simple model for illustration of feedback loops and stock variables. In the stock and flow diagram on the left the stock variable ‘Regulatory Resources’ is represented in a box, with Resource Development and Resource Erosion as its flows. Reinforcing loop ‘Resource Erosion’ is indicated with an R sign, and the balancing loop ‘Resilience Building’ with a B. Histograms for ‘Regulatory Resource’ (top) and major depressive disorder (MDD) (bottom) are shown for a population of 1000 individuals. Each simulated individual is subjected to a distinct stream of normally distributed autocorrelated ‘Environmental Stress’ noise and their level of Regulatory Resources and MDD are reported at the end of 100 months of simulation. The noise streams have identical parameters and only differ in their random realizations. Two scenarios are shown: without any feedbacks (i.e. constant ‘Regulatory Resource’) (gray) and with both feedbacks active (black). Full equations and instructions for replicating the simulations consistent with reporting guidelines for simulation models (Rahmandad & Sterman, Reference Rahmandad and Sterman2012) are available in Appendix B of the online Supplementary material.
Fig. 1 presents a stock and flow diagram of this illustrative model and reports the resource and MDD distributions for 1000 simulated individuals exposed to identical patterns of environmental stressors under the two scenarios (excluding and including feedbacks). In the absence of any feedback loops between MDD and those resources, MDD patterns are determined directly by the environmental stressors: at times when environmental stressors are over one (the assumed constant resource), some level of MDD is observed, so the variations in MDD are determined only by the variations in environmental stressors. However, the introduction of feedbacks leads to endogenous changes in resources: starting from the same initial resource, some individuals experience moderate stressors that help them build further resources, while others face significant stressors that are more than they can handle, which reduces their ability to cope. Despite identical initial points, parameters and exposure to random stressors that are similar in expectation, the population separates over time into two groups: those who develop resiliency in the face of stressors and those susceptible to depression due to low resource levels. As a result, the observed MDD patterns follow a bimodal distribution with some individuals more likely to experience successive bouts of depression, even due to rather small environmental stressors, and others resilient to much larger shocks. In essence, the reinforcing loops and minor differences in environmental stressors are enough to lead to significantly different outcomes. This model is presented to illustrate basic concepts and not to inform actual MDD trajectories. Nevertheless, similar dynamics have been documented in experiments exposing rats to various levels of stressors, with those exposed to moderate stressors building resiliency, while extreme stressors led to learned helplessness (Maier et al. Reference Maier, Amat, Baratta, Paul and Watkins2006).
Absent of empirical grounding, this model is not informative about actual MDD patterns, but is intended to highlight two features of complex dynamic systems that motivate our study. First, under certain conditions, reinforcing feedback loops can amplify small variations among individuals, leading to significant population-level heterogeneity from much smaller variations in exogenous influences such as genetics and environmental factors. Second, the strength of the loops and the resulting dynamics are highly dependent on the sources of inertia on the causal pathways (i.e. stock or state variables) and the speed in which they change. In our simple MDD model example, the speed by which the stock of resources grows, or declines, is central to the dynamics. Fast growth rates for this stock shift the dynamics toward the equilibrium, with many resilient individuals and few at risk for MDD. Faster erosion rates increase risks. Therefore, understanding a complex system requires not only the mapping of feedback processes, but also the identification of key inertial factors, their speed of change and the potential asymmetries in their growth v. decline mechanisms.
Method
A qualitative model of depression dynamics
We used a structured approach to incorporate findings from the literature into a conceptual model (e.g. see Hu et al. Reference Hu, Rahmandad, Smith-Jackson and Winchester2011). In the absence of prior efforts to compile a systems mapping, we selected a broad model boundary (i.e. cognitive, social, environmental and biological processes and diverse disciplinary perspectives) at the expense of going in depth into any single area. In fact, several excellent review articles provide more in-depth reviews of specific mechanisms (Mössner et al. Reference Mössner, Mikova, Koutsilieri, Saoud, Ehlis, Müller, Fallgatter and Riederer2007; De Raedt & Koster, Reference De Raedt and Koster2010; Palagini et al. Reference Palagini, Baglioni, Ciapparelli, Gemignani and Riemann2013). The focus of this article is making connections among MDD drivers. To develop the model, we selected review papers on mechanisms of MDD pathogenesis (e.g. Kendler et al. Reference Kendler, Gardner and Prescott2002, Reference Kendler, Gardner and Prescott2006; Belmaker & Agam, Reference Belmaker and Agam2008; Gotlib & Hammen, Reference Gotlib and Hammen2014) and identified key reinforcing feedbacks and inertial factors. We then used reference lists from those publications and additional literature searches to develop an initial model of candidate drivers and their intersections. We assessed the strength of empirical support for each mechanism, prioritized mechanisms that had been validated, and revised our conceptual structure. Next, we invited five experts in unique areas of MDD research to critique our model and suggest additional literature, informing further model revisions. The final database used to develop the model included 594 publications. Only findings confirmed in human models were included in our synthesis due to concerns with rodent models in late-stage translational research (e.g. Seok et al. Reference Seok, Warren, Cuenca, Mindrinos, Baker, Xu, Richards, McDonald-Smith, Gao, Hennessy, Finnerty, López, Honari, Moore, Minei, Cuschieri, Bankey, Johnson, Sperry, Nathens, Billiar, West, Jeschke, Klein, Gamelli, Gibran, Brownstein, Miller-Graziano, Calvano, Mason, Cobb, Rahme, Lowry, Maier, Moldawer, Herndon, Davis, Xiao, Tompkins, Abouhamze, Balis, Camp, De, Harbrecht, Hayden, Kaushal, O'Keefe, Kotz, Qian, Schoenfeld, Shapiro, Silver, Smith, Storey, Tibshirani, Toner, Wilhelmy, Wispelwey and Wong2013; Lacro et al. Reference Lacro, Dietz, Sleeper, Yetman, Bradley, Colan, Pearson, Selamet Tierney, Levine, Atz, Benson, Braverman, Chen, De Backer, Gelb, Grossfeld, Klein, Lai, Liou, Loeys, Markham, Olson, Paridon, Pemberton, Pierpont, Pyeritz, Radojewski, Roman, Sharkey, Stylianou, Wechsler, Young and Mahony2014).
In our review, we identified the reinforcing loops that could be relevant for understanding the etiology of depression and candidate stock variables that may regulate the strength and dynamics of these loops. Many balancing (homeostatic) feedbacks are also present in this system, yet given the breadth of the model we focused on the reinforcing feedbacks that could play a substantial role in creating heterogeneous depression-related outcomes among individuals. Only factors thought, based on the current literature, to determine the behavior of MDD were included. We note that not all pathways are active for all depressed individuals so each empirical case may best be explained by a subset of these loops. Moreover, some factors may be considered ‘two sides of the same coin’, i.e. previous literature may have used different levels of aggregation for describing causal processes that are otherwise rooted in the same biological mechanisms. We do not attempt to reconcile those alternative descriptions here and incorporate both in our diagram.
Next, we present the model and describe each feedback loop. To simplify the discussion, we describe cognitive, social and environmental, and biological dimensions separately, noting that some loops cross these conceptual boundaries. The causal loop diagram of the full model is depicted in Fig. 4 (see the online Supplementary material for further details). For each feedback loop, we discuss candidate stock variables and their speeds of change and examine how various exogenous (i.e. non-feedback) factors interact with the feedback mechanisms we identify.
Cognitive dimensions
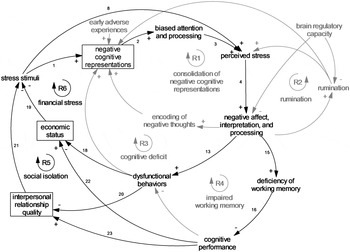
As Fig. 2 illustrates in reinforcing feedback loop 1, or R1 (consolidation of negative cognitive representations), early adversity such as abuse or neglect of a child is processed and stored in the form of negative cognitive representations within an individual's memory (McGinn et al. Reference McGinn, Cukor and Sanderson2005). Negative cognitive representations influence the way in which one attunes to stress stimuli, leading an individual to orient and maintain his/her focus on negative information. Negatively biased attention and processing increases one's perceived level of stress which leads to negative affect such as sadness and biased interpretations of negative stimuli that often align with one's negative mental models (De Raedt & Koster, Reference De Raedt and Koster2010). The processing of negative thoughts and affect is encoded and stored in one's memory, further strengthening existing negative cognitive representations (Cole et al. Reference Cole, Dukewich, Roeder, Sinclair, McMillan, Will, Bilsky, Martin and Felton2014). In R2 (rumination), negative affect and interpretations intensify one's propensity for ruminative thought which further compounds perceptions of stress and increases negative affect (Nolen-Hoeksema & Morrow, Reference Nolen-Hoeksema and Morrow1991). In R3 (cognitive deficit), negative affect and interpretations contribute to dysfunctional behaviors (Hamilton et al. Reference Hamilton, Stange, Shapero, Connolly, Abramson and Alloy2013) and strengthen negative cognitive models (Pettit & Joiner, Reference Pettit and Joiner2006). An example of this is the self-perceptions of worthlessness and feelings of guilt one might experience after having shoved his/her partner during a heated argument. The dysfunctional behavior in this example intensifies the perception of oneself as worthless. As R4 (impaired working memory) illustrates, increased negative affect inhibits the efficiency of one's working memory (De Lissnyder et al. Reference De Lissnyder, Koster, Everaert, Schacht, Van Den Abeele and De Raedt2012), leading to less optimal cognitive performance. Cognitive performance is weakened by impaired memory and sleep problems (Van Dongen et al. Reference Van Dongen, Maislin, Mullington and Dinges2003) and further contributes to dysfunctional behaviors (McCall & Dunn, Reference McCall and Dunn2003). Dysfunctional behaviors reinforce negative cognitive representations and lead to biased attentional processes, increased perceptions of stress, negative affect and interpretations, and further inhibit the efficiency of working memory.

Fig. 2. Causal loop diagram of cognitive dimension. References for each link are represented by the numbers on the diagram and the reference list is available in Appendix C of the online Supplementary material.
Temporal sensitivity of key stock candidates
Negative cognitive representations are key candidates for the inertia driving depression within the cognitive sector of the model and are important targets of change in cognitive theories of depression. Negative cognitive representations are, in essence, patterns embedded in neural connections in the brain that accumulate over months and years (Beck, Reference Beck2008). Negative cognitive representations are expected to change slowly in many cases, making these loops most relevant for dynamics that unfold over longer time horizons (Padesky, Reference Padesky1994). This stock has the potential to drive illness from early in life.
Social and environmental dimensions
Fig. 3 is a causal loop diagram of the social and environmental dimensions of the model. Affected by cognitive actors, R5 (social isolation) depicts how dysfunctional behaviors contribute to weakened social networks in the form of poor interpersonal relationship quality or social isolation (Lovejoy et al. Reference Lovejoy, Graczyk, O'hare and Neuman2000). Stress related to interpersonal relationships contributes to negative affect and processing (Joiner et al. Reference Joiner, Wingate and Otamendi2005) and can lead to problematic responses (e.g. aggression) which, in turn, depletes interpersonal relationship quality. As depressed patients become further plagued by challenging relationships or isolation, their negative cognitive representations are reinforced. One's economic status, including material assets, income and reputation, can be depleted through the effects of poor cognitive performance (McIntyre et al. Reference McIntyre, Cha, Soczynska, Woldeyohannes, Gallaugher, Kudlow, Alsuwaidan and Baskaran2013) or behaviors at work and beyond (Stewart et al. Reference Stewart, Ricci, Chee, Hahn and Morganstein2003) as shown in R6 (financial stress). Absenteeism or presenteeism can lead to job loss or limits to promotions and underemployment, thereby severing or restricting one's income. Poor cognitive performance in the face of various risks at work and in society can also cause economic and reputational damage. Financial stress can produce negative affect and problematic behavioral responses that increase economic adversity and reinforce negative mental models (Hobfoll et al. Reference Hobfoll, Johnson, Ennis and Jackson2003).

Fig. 3. Causal loop diagram of cognitive, social and environmental dimensions. References for each link are represented by the numbers on the diagram and the reference list is available in Appendix C of the online Supplementary material.
Temporal sensitivity of key stock candidates
Social support and financial resources could be important stock variables in the feedback loops described above. An individual's personal economics and social networks typically build over the span of years, but have the potential to be depleted more quickly than they accumulate, an asymmetry that can exacerbate these reinforcing loops when they act as vicious cycles.
Biological dimensions
The biological dimensions are illustrated in Fig. 4. Stress initiates a cascade of responses relevant to depression. In R7 (elevated cortisol response), perceived psychosocial stress activates the central nervous system by inducing the secretion of corticotrophin-releasing hormone and vasopressin in the hypothalamus that stimulates adrenocorticotrophin hormone in the anterior pituitary and, in turn, releases cortisol in the adrenal cortex. As concentrations of cortisol increase, glucocorticoid receptors (GRs) become overburdened (Strüber et al. Reference Strüber, Strüber and Roth2014). Excess cortisol, cortisol reactivity, and altered GR function inhibit the HPA system and reinforce HPA dysregulation which has negative consequences for an individual's physical and mental health. For clarity, the effects of brief periods of stress on cortisol are often adaptive and resolve autonomously, but chronic stress is what drives illness (Herbert et al. Reference Herbert, Goodyer, Grossman, Hastings, De Kloet, Lightman, Lupien, Roozendaal and Seckl2006). Early adverse experiences, both in utero and in early childhood, can also initiate changes to basal and stress-related cortisol secretion (Slopen et al. Reference Slopen, Kubzansky and Koenen2013).
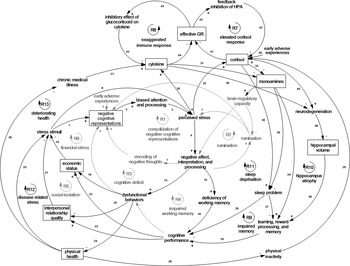
Fig. 4. Causal loop diagram of cognitive, social, environmental, and biological dimensions. References for each link are represented by the numbers on the diagram and the reference list is available in Appendix C of the online Supplementary material. GR, Glucocorticoid receptors.
The R7 and R8 (exaggerated immune response) loops are highly interrelated given extensive communication among the immune, endocrine and central nervous systems. During increased periods of stress or chronic illness, pro-inflammatory cytokines are released. Cytokines are known to inhibit GR function. Although cortisol is a key anti-inflammatory hormone, when chronic stress sustains cortisol response and GRs become overburdened, cortisol signaling becomes insufficient and unable to reduce immune responses, which leads to inflammation (Miller et al. Reference Miller, Maletic and Raison2009).
Chronic exposure to cortisol and cytokines reduces the availability of monoamines like serotonin, dopamine and norepinephrine by influencing synthesis and reuptake (Miller et al. Reference Miller, Maletic and Raison2009; Strüber et al. Reference Strüber, Strüber and Roth2014). Monoamine neurotransmitters regulate sleep and wakefulness and deficiencies lead to sleep problems. Sleep is vital to long-term memory consolidation, which is necessary for learning, and sleep problems can disrupt this process (Choi & Abel, Reference Choi, Abel, Shaw, Tafti and Thorpy2013). Learning and memory deficits, including deficiencies in reward processing (Eshel & Roiser, Reference Eshel and Roiser2010; Pizzagalli, Reference Pizzagalli2014), inhibit effective cognitive performance which leads to dysfunctional behaviors, economic problems, and poor interpersonal relationships which increase stress and heighten immune and HPA response. This in turn triggers further monoamine neurotransmission abnormalities and compounds sleep problems (R11 sleep deprivation) and learning and memory deficits (R9 impaired memory). Monoamines also play an important role in emotion regulation. Serotonin deficiency reduces the brain's regulatory capacity by not adequately modulating amygdala response to negative stimuli which leads to sustained emotional responding in the face of stress (De Raedt & Koster, Reference De Raedt and Koster2010) and plays a key role in reinforcing negative cognitive and emotional processes in the R1, R2 and R3 feedback loops.
The hippocampus is sensitive to cortisol toxicity and elevated pro-inflammatory cytokines, in part, because of its high concentration of GRs (Herbert et al. Reference Herbert, Goodyer, Grossman, Hastings, De Kloet, Lightman, Lupien, Roozendaal and Seckl2006; Zunszain et al. Reference Zunszain, Anacker, Cattaneo, Carvalho and Pariante2011). Relevant to R10 (hippocampus atrophy), high levels of cortisol and cytokines in the context of GR resistance act to suppress neurogenesis and promote neuronal death that leads to hippocampal atrophy (Sapolsky, Reference Sapolsky2000). Reduction of hippocampal volume has a negative effect on learning and memory, especially in relation to explicit memory formation, which leads to memory deficits and impaired cognitive performance. Poor cognitive performance hinders one's personal economics and intimate relationship quality, producing additional stress that compounds exaggerated cortisol and immune response and further reduces hippocampal volume.
Physical health also interacts with depression. One of the two reinforcing feedback loops relevant to physical health works through the same paths as described for personal relationships and economics (R12 disease-related stress). As an illustration, dysfunctional behaviors such as medication non-adherence (DiMatteo et al. Reference Dimatteo, Lepper and Croghan2000) and poor diet (e.g. diets low in omega-3 essential fatty acids or polyunsaturated fatty acids) have a negative effect on one's health and perceived stress. The second loop for physical health relates to the deteriorating health (R13) one can experience when poor behaviors such as physical inactivity due to loss of motivation contributes to chronic medical problems (Ye et al. Reference Ye, Muntner, Shimbo, Judd, Richman, Davidson and Safford2013), affecting immune functioning, HPA axis reactivity, and sleep and eventually reinforcing declines in health. Also, declining physical health can limit an individual's capacity to engage in physical activity and physical inactivity increases cortisol concentrations (Paddon-Jones, Reference Paddon-Jones2006).
Temporal sensitivity of key stock candidates
There is more uncertainty about potential stock variables within this portion of the model. Plausible candidates include the level of cytokines (changing over hours; Xiang et al. Reference Xiang, Del Ben, Rehm and Marshall2011), effective GRs (changing over days; De Kloet et al. Reference De Kloet, Vreugdenhil, Oitzl and Joëls1998), cortisol (changing over minutes; Gruenewald et al. Reference Gruenewald, Kemeny, Aziz and Fahey2004), monoamines (changing over minutes; Clow et al. Reference Clow, Patel, Najafi, Evans and Hucklebridge1997) and hippocampal volume (changing over years; Peng et al. Reference Peng, Feng, He, Chen, Liu, Liu and Luo2015). An additional candidate is physical health which tends to accumulate slowly and can either be lost quickly in the face of an accident or fast-acting disease or may dwindle slowly. Physical health is probably a stronger driver of depression for aging adults. Many of the relevant dynamics in understanding depression unfold over longer time horizons, and thus some of the stock variables may not represent the most viable candidates for explaining longer-term dynamics. It remains to be seen if there are slow-moving biological mechanisms beyond the formation of neural pathways that we discussed under cognitive factors and the change in hippocampal volume. For example, sleep disturbances can persist well past depression remission, yet mechanisms for this slow-moving change are unknown, meaning that our stock candidates do not account for it.
Exogenous drivers
Our synthesis has been focused on endogenous reinforcing loops that could explain depression. These loops, in turn, are often triggered through various factors that are exogenous to the boundary of our model. Those include, among others, genes, personality (e.g. neuroticism), gender, socio-economic status, nutritional environment, and the built environment that influences opportunities for exercise. Also relevant are various random events such as accidents, the loss of loved ones, and early adverse events (which are partially identified in our model). These variables are included as exogenous and determine different parameters or exogenous drivers if we wished to quantify the feedback loops. The interaction between exogenous factors and feedback loops also creates the potential for endogeneity through epigenetics.
Discussion
This is the first attempt to apply qualitative systems mapping to bring a feedback perspective to understanding the broad etiology of depression and to develop a basis for building a quantitative model of depression dynamics. It describes a causal loop diagram of MDD that was developed based on a structured review of the literature in which we identified key drivers of disorder and their interconnections. The model highlights three conceptual insights in understanding depression. First, whereas research often focuses on depression as the outcome of some exogenous factor (be it genes, environmental stressors, or early childhood adversity), our model maps depression as a partially endogenous condition. Various reinforcing loops, activated by exogenous factors, will push some individuals towards a trajectory of increasingly negative cognitive representations, declining social, economic, and health resources, and various perturbations in hormones, immune response and neurotransmitters. Once in such equilibrium, the individual may have a hard time escaping, even if the original exogenous driver is removed. On the other hand, if the underlying reinforcing feedback is mitigated (by chance, intervention, or strengthening of homeostatic processes), spontaneous remission may ensue even in the presence of original exogenous shocks. Second, the strength and relevance of different loops depend heavily on the stock variables on each loop and their speeds of change. Identifying those stock variables and their change mechanisms, including the timing in which they unfold and influence one another, is an important program of research that this feedback perspective underscores. For example, such knowledge could better predict the treatment targets and dosages required to alter the feedbacks driving illness and return a patient to a healthy equilibrium. Third, this model explains how the specific feedback loops that trap patients into the same type of disorder could be unique across individuals. Some patients may be kept down by cognitive feedbacks, others by social ones, some by biological feedbacks, and others by combinations. Quantifying the model and estimating it empirically would allow for assessment of the relative strength of different mechanisms. Such a model could then play a significant role in personalized treatment, where we could identify the feedback loops most relevant for understanding each depressed patient and target those loops differentially.
Limitations
Our model was informed by existing literature and partially absorbs deficits in the current knowledge of depression, e.g. many mechanisms, particularly biological ones, are not well understood and studies do not often explicate causal drivers and their intersections. Therefore, more empirical studies and simulation models that expose the multiple drivers of depression and exactly how they intersect are needed to enhance the reliability of our model. Being a qualitative study, other limitations inherent to this mode of inquiry are relevant here as well, e.g. investigator bias and limits to replicability. However, qualitative systems mapping is an important first step towards developing new insights into the disorder, as well as quantifying and empirically validating simulation models of depression dynamics. Finally, the broad scope of this project led us to focus solely on reinforcing loops. Focusing on reinforcing mechanisms in the absence of homeostatic mechanisms may lead to overestimating the role of reinforcing loops and the heterogeneity that a system produces. An important next step is to integrate key balancing processes.
Future directions
Future research is needed to develop a quantitative simulation model of depression dynamics (Forrester, Reference Forrester1994). While ambitious, early efforts are encouraging (e.g. Hosseinichimeh et al. Reference Hosseinichimeh, Rahmandad and Wittenborn2015; N Hosseinichimeh et al. unpublished observations). For example, we developed a dynamic model of depression and rumination and predicted the response of 32 patient profiles to a mindfulness intervention in simulation (AK Wittenborn et al. unpublished observations). Other studies could identify intervention leverages and priorities and inform clinical decision-making such as dosage, treatment timing and complementary intervention strategies. Future models could identify which causal inertial factors are at the core of a patient's depression, and intervention could be re-imagined as resetting stocks to promote a new equilibrium v. treating symptoms of an underlying disorder. Simulation studies and more traditional methods could be used in combination, for example, by confirming the results of intervention testing in simulation through randomized controlled trials. Inquiries of prevention might also identify tipping points of illness (e.g. van De Leemput et al. Reference Van De Leemput, Wichers, Cramer, Borsboom, Tuerlinckx, Kuppens, Van Nes, Viechtbauer, Giltay, Aggen, Derom, Jacobs, Kendler, Van Der Maas, Neale, Peeters, Thiery, Zachar and Scheffer2014).
Conclusions
This paper presents the first causal loop diagram of depression dynamics. The model demonstrates a feasible path towards a causal-based understanding of the systemic syndrome of depression. Furthering this line of research may produce a powerful tool for predicting best practices for personalized prevention and treatment of depression and propel progress in alleviating the burden of illness for the 350 million suffering worldwide (World Health Organization, 2008).
Supplementary material
To view supplementary material for this article, please visit http://dx.doi.org/10.1017/S0033291715002044
Acknowledgements
Research reported in this article was supported by the National Institute of Mental Health of the National Institutes of Health (award R21MH100515). The content is solely the responsibility of the authors and does not necessarily represent the official views of the National Institutes of Health.
We wish to thank Steven Hollon, Adrian Blow, Lena Brundin, Daniel Pine and the anonymous reviewers for their comments on the development of the model and article.
Declaration of Interest
None.