


I. INTRODUCTION
There are many photographs of Roman coins that can be found on the internet or in books corresponding to commercial sales or museum collections. In general, older copper coins are similar in appearance to more recent copper coins where the copper has oxidized and has a brown-red surface patina. However, coins produced at various Roman mints during the 3rd and 4th centuries exhibit an amazing array of colors and various hues. Non-destruction evaluation (NDE) methods utilizing X-ray diffraction (XRD) and X-ray fluorescence (XRF) were used to examine a collection of coins, investigate the coinage metals, and their common oxidation products. The authors also wanted to evaluate whether one can correlate the appearance of the patina to compositional characteristics.
Several unusual analysis methods were applied in this study. The coins were studied using non-destructive methods on non-uniform patinas and microstructures. A new “intelligent” Reference Intensity Ratio (RIR) method was used to quantitate silver and copper using XRD. The different X-ray methods utilized different incident radiation sources, providing an understanding of the chemistries with depth penetration. For the XRD phase identifications, custom user subfiles were created containing coin chemistries based on the XRF analyses. This helped with both speed and accuracy since false positive results owing to incorrect chemistry were eliminated by the subfile selection.
II. EXPERIMENTAL
Twenty-four Roman coins were purchased by one of the authors (TGF), over a period of many years, from a commercial dealer (see Table I). The majority of these coins are very common bronzes that were produced in significant volume during the 3rd and 4th centuries (Carlson, Reference Carlson1990). The author deliberately selected bronze coins with various mint marks and from different time periods (emperors). Overall nine different mints and 13 Roman emperors were represented in the collection. The coins range in diameter from 14 to 26 mm, and the collection has examples of common size bronze coins (AE1 through AE4) minted in the 4th century A.D. Besides measuring the dimensions, the weights of the coins were recorded. All the coins in this study had a copper base, most were bronzes and some were silver washed coins. Several excellent literature sources on Roman coinage were used to identify the coins. These coins are representative of the period, by comparison, both in analysis and appearance, to data on Roman coins in the literature. All coins were examined non-destructively.
XRD analyses were performed using a Bruker D2 Phaser equipped with the copper X-ray tube and a Linxeye™ Si strip detector. Scans were collected from 5° to 70 ° 2θ, a step size of 0.02° was used with either 2 second, 1 second, or half-second count time. The count time typically depended on the composition and crystallinity of the patina, with longer count times used to enhance phase identification. In coins with high Pb and Sn content, depth penetration into the coin is limited to the surface by X-ray absorption and longer count times were needed to obtain phase identification results. In general, the corrosion phases were crystalline with crystallite sizes on the order of a few hundred angstroms. The bronze coins were of various sizes, smaller bronzes (denarius, AE2, AE3, AE4) easily fit into a standard Bruker specimen mount. For larger bronzes (AE1 or equivalent, 26 mm), a custom modified mount was necessary. For non-destructive analysis (NDA), it is desirable to place the surface of the coin at the instrumental focal point for the specimen in order to reduce displacement errors. The coins were rotated (15 rotations per minute) during data collection to reduce preferred orientation. The authors were pleasantly surprised to find that preferred orientation, frequently seen in NDA of modern coins, was not observed with most of the bronzes. This observation is attributed to the casting methods used during this period, and the small crystallite size of the corrosion products in the patina. Cast coins often exhibit a relatively random grain structure in their microstructure as shown by XRD pole figure analyses (Schreiner et al., Reference Schreiner, Fruhmann, Jembrih-Simburger and Linke2004). A March-Dollase orientation function was used to identify and semi-quantify orientation but it was not necessary in most cases.
Phase identifications were performed using Release 2016 and Release 2018 PDF-4 + with Sieve + (Fawcett et al., Reference Fawcett, Kabekkodu, Blanton and Blanton2017). This database and software combination allows the user to create custom subfiles for phase identification (Fawcett et al., Reference Fawcett, Crowder, Kabekkodu and Kaduk2011), The major elements, Cu, Sn, Pb, and Ag were used to define a subset of materials by using a “or” Boolean operator. Such a subfile contains 54 838 ambient entries and includes the alloys, metals as well as their corrosion products. Another subfile can be created from “Just” the combination of coinage metals (Cu, Sn, Pb, Ag) and common corrosion elements (C, O, H, and Cl) that generates a file of 6091 entries useful for coins with the bronze disease. This more targeted subfile was used after a few coins were analyzed by XRF and XRD and the authors eliminated sulfur and phosphorus-based corrosion products for these specific coins. The use of target custom subfiles practically limited the identifications to the elements identified in the XRF analysis, which eliminates false positives. In practice the more difficult and cluttered the pattern, the more you get inherent false positives owing to accidental peak overlaps and the more you need subfiles to limit the candidates. With corrosion products the subfile selection is very helpful since corrosion products are often non-stoichiometric and either poorly crystalline or small crystallite size. Both of these effects can influence peak positions because of peak breadth increase and resultant severe peak overlap when multiple phases are involved. This typically lowered the goodness of merit fit parameters in the search match. Pattern simulations were used to characterize this overlap, account for crystallite size and confirm the identifications. The pattern simulation software is included in the PDF-4 + product software and described elsewhere (Fawcett et al., Reference Fawcett, Kabekkodu, Blanton and Blanton2017).
Subsequent to phase identification, an “intelligent” RIR method was used to quantify the phases. The intelligence in the RIR method is that this method uses quality marks and quality evaluations to choose the most appropriate RIR value for a given phase. If available, the highest quality, ambient temperature, reference RIR value is used for the quantification. In this particular study, most of the coinage metals and their corrosion products are common phases with a selection of reference compounds and the intelligent RIR substitutions were frequently made. This process also provides a consistency in the analysis since each particular phase will be associated with a specific “best” RIR value. Details of this process are published in an ICDD Technical Bulletin (ICDD, 2014) “Search and Identify with Sieve/Sieve + ”.
The XRF analyses were performed by directly analyzing the coin surface. Two separate sets of coins were analyzed, one set in 2013 and another set in 2017. The first set was analyzed by a Bruker S8 wavelength dispersive spectrometer, using a rhodium source, by placing the coin directly in the specimen holder using a sample cup with polypropylene film. The holder diameter size was sufficiently large for the coins and the coins were centered in the cup, assuring that the beam was entirely on the coin surface. The metals were analyzed as elements, which in some cases may have overestimated the concentration, as subsequent XRD analyses indicated some oxides. The second series was analyzed with a PANalytical Epsilon 3x XRF Spectrometer. The coins were placed in a polypropylene cup. A silver tube was used in the analysis and the tube effects were corrected by the software for the coins containing silver. Both systems used proprietary fundamental parameter software to calculate the elemental composition. In both cases, the software can estimate the concentration based on elements or based on the elemental oxides. For this particular case, small errors could occur because in actuality the coins were a mixture of the elements and their corrosion products.
The overall aim of this study was to evaluate the coin types and patina types. Neither the XRD nor the XRF analyses were designed to obtain highly accurate assays of the total coin composition. This has been studied by numerous previous authors. Our intent was to investigate the surface chemistry of the coins and to use XRD and XRF analyses as complimentary tools. Semi-quantitative techniques were used in both studies and the results compared. As mentioned, the XRF calculations used fundamental parameters. Elemental composition of the sampled surfaces could be estimated by XRD using the RIR method as developed and implemented in the PDF-4 + software. Both methods sampled similar but not identical regions of the coins. The XRF technique tends to analyze a smaller spot size but uses a more penetrating X-ray source. The XRD technique analyzes a larger specimen surface area but with Cu sources are less penetrating.
During the course of the investigation, it was noticed that some coins had similar phase chemistries. Commercial cluster analysis programs by Bruker-AXS and PANalytical were used to cluster the 24 XRD data sets. The two programs produced similar results and the output of these programs such as dendrograms, similarity matrices, and principal component analyses (PCA) were used to distinguish different groups of coins and their patinas.
III. DISCUSSION
The Oxford Handbook on Greek and Roman Coinage (Metcalf, Reference Metcalf2012) provides an excellent discussion on the problems of using NDE XRF methods to assay coinage metals. In fact, they discourage most NDE techniques because of the known non-uniformity of the phases and elements in the coins. The non-uniformity is caused by the known silver coating techniques and alloying methods used during this time period. Alloy coinage metals often became segregated during production or they were never properly alloyed in the first place. Microscopy studies of silvered Roman coins (Carlson, Reference Carlson1990; Ingo et al., Reference Ingo, Balbi, de Caro, Fragala, Angelini and Bultrini2006a, Reference Ingo, de Caro, Riccucci and Khosroffb) clearly show silver layering and alloy segregation in coins of this period. Additional literature investigations discuss layering techniques (Vlachou et al., Reference Vlachou, McDonnell and Janaway2002) and scientists argue that there may have been more than one method used, especially considering the length of time of mint operation and variety of mint locations. The cited references contain many images of coin microstructures demonstrating the wide variety of phase segregation in most Roman coins. The Oxford Handbook does show that whole coin destructive analyses demonstrate that coinage metals were regulated, standardized, and often complied to the periodic currency regulations of the Roman empire and currency reforms of Aurelian, Constantine, and Valentine. The variability in elemental concentrations shown in this study is expected to be wider than if the whole coins were analyzed. For example during the time of Emperor Diocletian, Ag content and Cu/Sn ratios were specified (Carlson, Reference Carlson1990). Furthermore, the above references suggest that corrosion products can often extend deep into the coin surface, as much as 60 µm, and in the XRD and XRF investigations the authors were typically studying the top 10 µm or less of the coin surface.
A. Influence of sampling volume on results
The NDE XRD and XRF results were influenced by the microstructure and composition. The XRF analyses demonstrate that many coins had significant concentrations, >20 weight %, of silver, tin, and lead. Each of these elements has a large mass attenuation coefficient when using CuK α radiation, the radiation source used in all the diffraction experiments. Using the XRF analysis compositional data one can compute the half depth of penetration for several coins analyzed in this study. Coins containing high concentrations of Pb, Sn, and/or Ag have a much smaller depth of penetration because of their large mass attenuation coefficients combined with their high densities. For coins that were primarily composed of copper, diffraction occurs in the top 10 µm of the coins surface. For those with significant heavy metal content, most of the diffraction occurs within the first micron of the surface. Therefore, there was a significant change in the sampling volume depending on the heavy metal content. This was very apparent in the XRD patterns from the signal to noise. High copper and low heavy metal content coins (large sampling volume) had well-characterized patterns with high signal to noise and easily detected phases of copper and copper oxide (Cu2O) that dominated the pattern. Coins with high heavy metal content (Ag, Sn, Pb) had a much weaker signal and the copper pattern was significantly diminished. This is easily explained by absorption resulting in less depth penetration and a resulting smaller sampling volume.
In contrast, the XRF experiments used either Ag or Rh incident radiation. These X-rays are higher energy and more penetrating than copper radiation and a cross-comparison of the coinage metals and their attenuation coefficients would suggest that the XRF experiments would sample approximately 2–3X the depth of the XRD experiments (Chantler, Reference Chantler2000; Hubbell and Seltzer, Reference Hubbell and Seltzer2004).
The aforementioned silver layering techniques often concentrated heavy metals on the surface of the coins. The XRD and XRF results generally reflect the phase chemistry of the patina layer. This does help us correlate appearance to surface chemistries. In addition, electrochemical oxidation potentials (Willard et al., Reference Willard, Merritt and Dean1974) would predict that Pb and Sn would preferentially oxidize if present on the surface of coin. This has been observed on many coins. When all the diffraction results were compiled it became obvious that results could be clustered and that there were distinct groupings based on the phase chemistry and presence and absence of heavy metals.
B. General characteristics of the collection
The composition of the coins was compared with literature in two previously cited reference books, “Coins of the Roman Empire” and “The Oxford Handbook of Greek and Roman Coinage”. All of the coins exhibited the phase of cuprite in their XRD patterns, all except one also contained a phase of base coinage metal, either pure copper or copper alloy with 5% tin. One can calculate that a pure copper coin would have a half depth of penetration using CuKα X-rays at 45° 2θ of approximately 10 µm. The concentrations of cuprite and copper give an indication of the thickness of the patina layer. Since the authors detected copper or bronze in 23/24 coins, then the patina layers were usually <10 μm. The bulk coinage metals, as identified by XRF analysis, were Cu, Ag, Sn, and Pb. While brass coins were produced by the Roman empire the authors did not detect any significant bulk concentrations of Zn in the coins. The XRF analyses did identify some elements in some coins usually associated with the coinage metal ores, such as Se, Sb, and As. Six of the coins had elements (Ca, Al, Mg, Si, P) and minerals commonly associated with soils.
Many of the coins contained significant (>10 weight %) concentrations of Ag, Sn, and Pb. The silver was found in the metallic state. While some small amounts of tin can be associated with the bronze, the most common phase of tin was cassiterite, SnO2. The Pb was most commonly found as PbO and PbCO3, but in individual coins, the authors also identified lead carbonate chloride and lead phosphate chloride. In all cases, the lead was found in an oxidized state. This is to be expected based on the oxidation potentials of the three metals and their oxidation products. This would predict that the oxidation tendency would be Pb>Sn>Cu>Ag.
By looking at the quantitative phase analysis results using the RIR method, one can determine that the corrosion product composition ranged from 0 to 100% of the total volume analyzed. The coin with the smallest detectable patina was a heavy silver content antoninian from the reign of Postumus, it was the only coin in this study that had the distinct appearance of silver. The coins with a high volume of corrosion product were those having a significant heavy metal content. This usually limited diffraction to the top 1–2 µm of the coin. The diffraction patterns had multiple corrosion phases and low total scattering intensity consistent with the reduced sampling volume caused by absorption. It should be mentioned that the coins had variable height surfaces because of the images on the faces of the coin and that this height variation was significantly greater than the penetration depth. This is probably the reason why several references recommend removing the top 60–100 µm of the coin surface to obtain reliable bulk assays via destructive methods.
However, because of the currency reforms, the authors suspect that many of the bronzes analyzed were produced between the reigns of Claudius II to Constantine II (268–361 AD) and contained 4–5% bulk silver when freshly minted. Several references mention that the silver was often applied as a surface “washing” and most experts believe that various washing methods (both chemical and electrochemical) may have been used at different mints. It is also mentioned that these coatings often wore off. In this regard, it is interesting to compare the silver analyses by both XRF and XRD. While both methods are surface sensitive, the XRD method used in these analyses were definitely limited to the top few microns of the coin. Microstructure examination in the literature occasionally shows a continuous Ag layer and at other times shows “islands” of silver within a copper matrix. Several coins exhibited significant (>10 weight %) concentrations of silver metal by XRD and lower concentration by XRF that would be consistent with a layered microstructure and the varied volume and depth penetration sampled by the XRD and XRF experiments.
Figure 1, shows the diffraction pattern from several coins with varying silver content as well as two of the major phases, copper and cuprite, found in nearly all the coins. In this figure, the authors applied a zero point shift to compensate for specimen displacement and deliberately aligned the silver phases. Through this exercise one can see that the patterns for cuprite (Cu2O) nicely align when using silver as a position calibrant, however, the major peak of copper covers a range of 2θ positions. The copper is alloyed with varying amount of tin, typically between 5 and 10 weight %. Depending on the coin, XRD phase identification would identify copper, as in the case of the top pattern in Figure 1, or bronze alloy for most of the other coins.
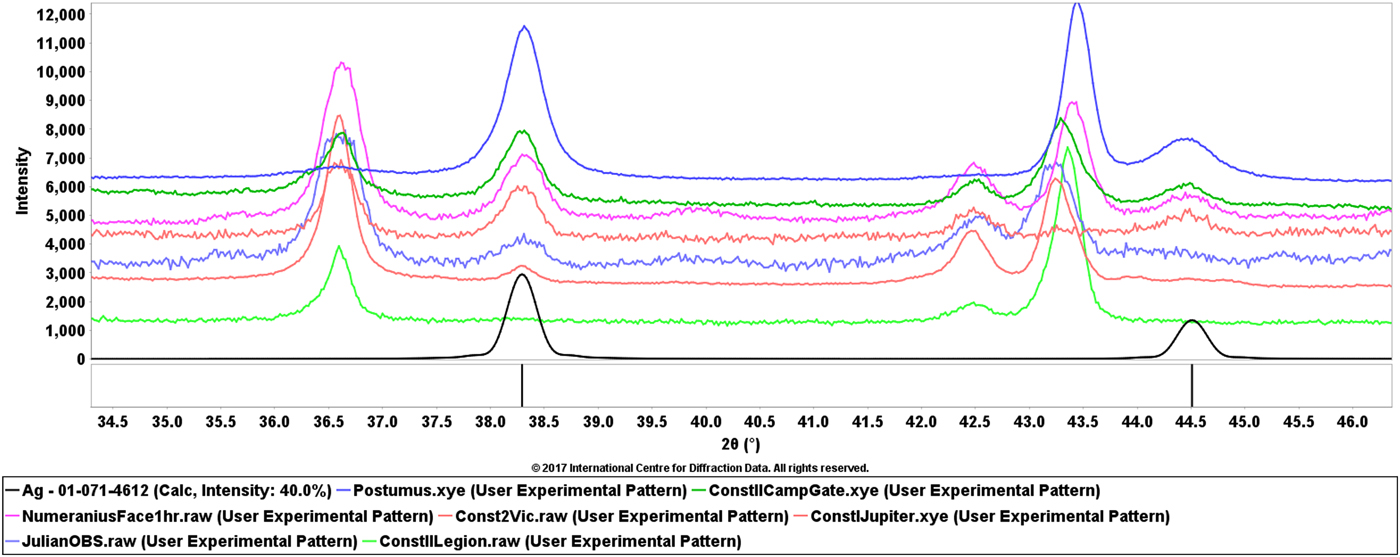
Figure 1. (Color online) XRD patterns of seven Roman coins of varying silver content. The top pattern corresponds to antoninian coins of Postumus (18% silver), the next three patterns are from silver washed coins (13–14%) then two silvered coins (2–3%) and finally a bronze coin without silver. They are compared with a reference pattern for silver at the bottom in black.
The PDF-4 + software used in these analyses has an easy to apply crystallite size analysis module. The base metals, Cu and Ag, had the largest crystallite sizes (400–500 Å), common oxides such as cuprite and cassiterite were also highly crystalline as well as copper chloride. Most of the lead oxidation products, copper hydroxychlorides, and copper hydroxycarbonates while crystalline had smaller crystallite sizes (~100–200 Å).
C. Roman bronzes
The largest cluster in the cluster analysis dendrogram contained ~50% of the coins in the study. The authors have XRF analyses of three of the 13 coins in the group and XRD analyses on all 13. The summed heavy metal content (Ag, Sn, Pb) was <10% in these coins. The coins are predominately from the late 2nd and early 3rd century and also from the late 4th century. These were periods in the Roman empire when the heavy metal content was regulated and their concentrations were either low or absent.
Figure 2 above shows three bronze coins from the 2nd and 3rd centuries. The patinas range from the typical reddish-brown of old copper coins to black. All three of these coins are primarily composed of copper and the reddish brown is typical of Cu2O that was identified as a major phase in all the three coins. The difference with the “black” coin, Antoninus Pius with seated Concordia (Figure 2, far left and Figure 3), is that there is strong evidence of chlorine-based corrosion with phases of copper chloride and copper hydroxychloride. In ancient coins and bronze vessels, these corrosion deposits are often referred to as bronze disease since they deteriorate the coin features destructively, as shown in Figure 4. Typical references to bronze disease often cite the green patina, however, some divalent copper oxychlorides and hydroxychlorides are black or blue-black. In this study, the authors identified chloride-based corrosion products with both green and black patinas. The source of chlorine can be either exposure to salt water or salt from perspiration and cumulative handling. The bronze disease can be progressive if the coin is exposed to water (high humidity), causing continuing chloride attack. While the authors did not have an XRF analysis with this particular coin, they did have three similar coins exhibiting the identical phases with chlorine content of 7.7, 12.4, and 12.7 weight % by XRF. The phases observed here have been observed in other studies of Roman coin patinas (Bertolotti et al., Reference Bertolotti, Bersani, Lottici, Alesiani, Malcherek and Schluter2012).
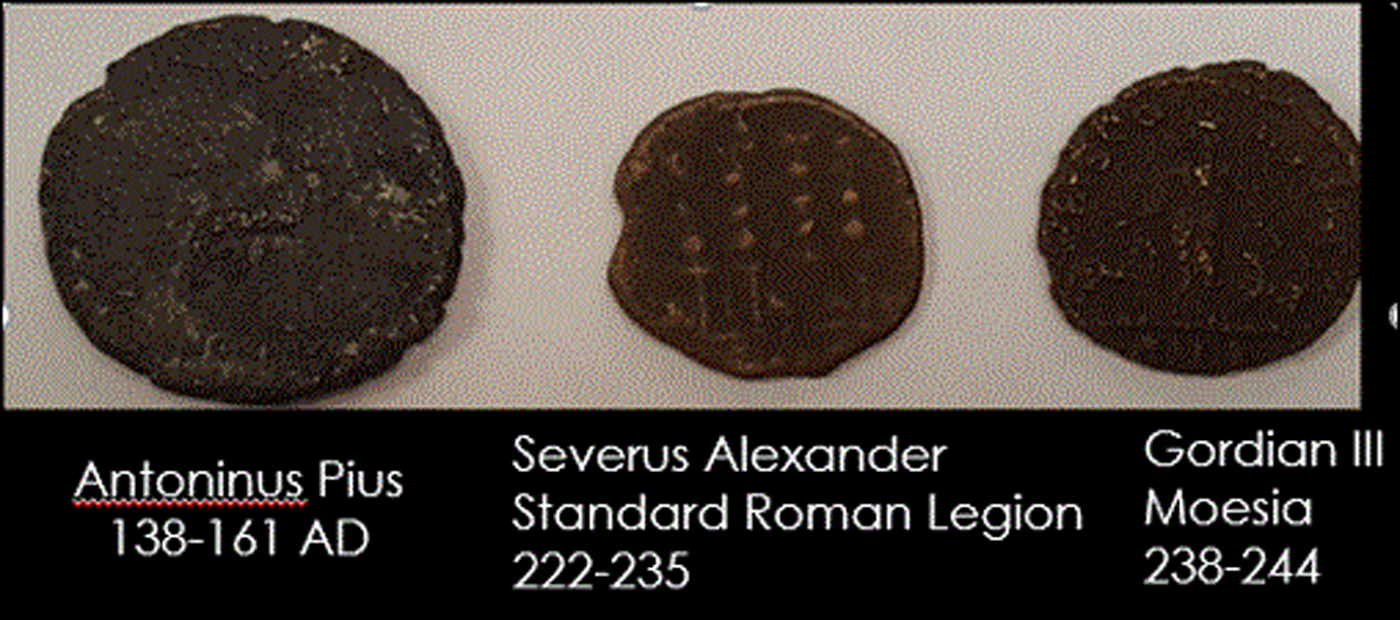
Figure 2. (Color online) Roman bronzes from the 2nd and 3rd century. These three coins have copper and cuprite (Cu2O) as the dominate phases. The coin on the far left has additional phases characteristic of the bronze disease and is badly deteriorated and underweight.

Figure 3. (Color online) Comparison of seated Concordia on the reverse side of coin #1 (right) in comparison with the same image in a silver coin (left).

Figure 4. (Color online) Four Roman coins exhibiting bronze disease. All four have high concentrations of CuCl. These coins correspond to #1, #6, #8 and #9 in Table I.
Table I. Description of Roman coins studied by NDE methods. The diameter and weight were used to identify the coins by known coinage types.

Bronze disease is usually described by a combination of several different reactions whose product regenerates the attacking chemical, in this case, hydrochloric acid. The copper chlorides mix with water vapor releasing HCl which is then available to attack the copper metal.
2 CuCl + H2O = 2 HCl + Cu2O
2 HCl + 2 Cu = 2 CuCl + H2
4 CuCl + 4 H2O + O2 → CuCl2·3 Cu(OH)2 + 2 HCl
2Cu + 2HCl → 2CuCl + H2
These reactions produce CuCl and HCl which creates a sustaining reaction in the presence of water. Many of the bronze coins that were analyzed in the study contained CuCl, Cu2O, copper hydroxychloride and Cu. In fact, this primary cluster can be subdivided into two groups in the dendrogram, seven coins exhibiting bronze disease and six coins that did not. Using the RIR method for phase quantitation the authors found between 14 and 42 weight % CuCl by XRD in the seven coins exhibiting bronze disease which is very consistent with the XRF chlorine analyses. CuCl by weight is 35.8% chlorine.
Figure 5 shows examples of XRD patterns from coins with the bronze disease. The diffraction patterns of Cu2O and CuCl are easily visible and represent the bulk of the sampled surface volume. Many of the peaks at lower angles are attributed to Cu(OH)Cl and Cu2Cl(OH)3. The seven coins exhibiting bronze disease were all severely deteriorated and underweight. The group included an As, Semi, 2 Denarii, 2 A3/A4 and an Antoninius coin, each being 10–20% underweight, another signature of the destructive effect of the bronze disease. The predominant patina color of these coins was black (Figure 4).
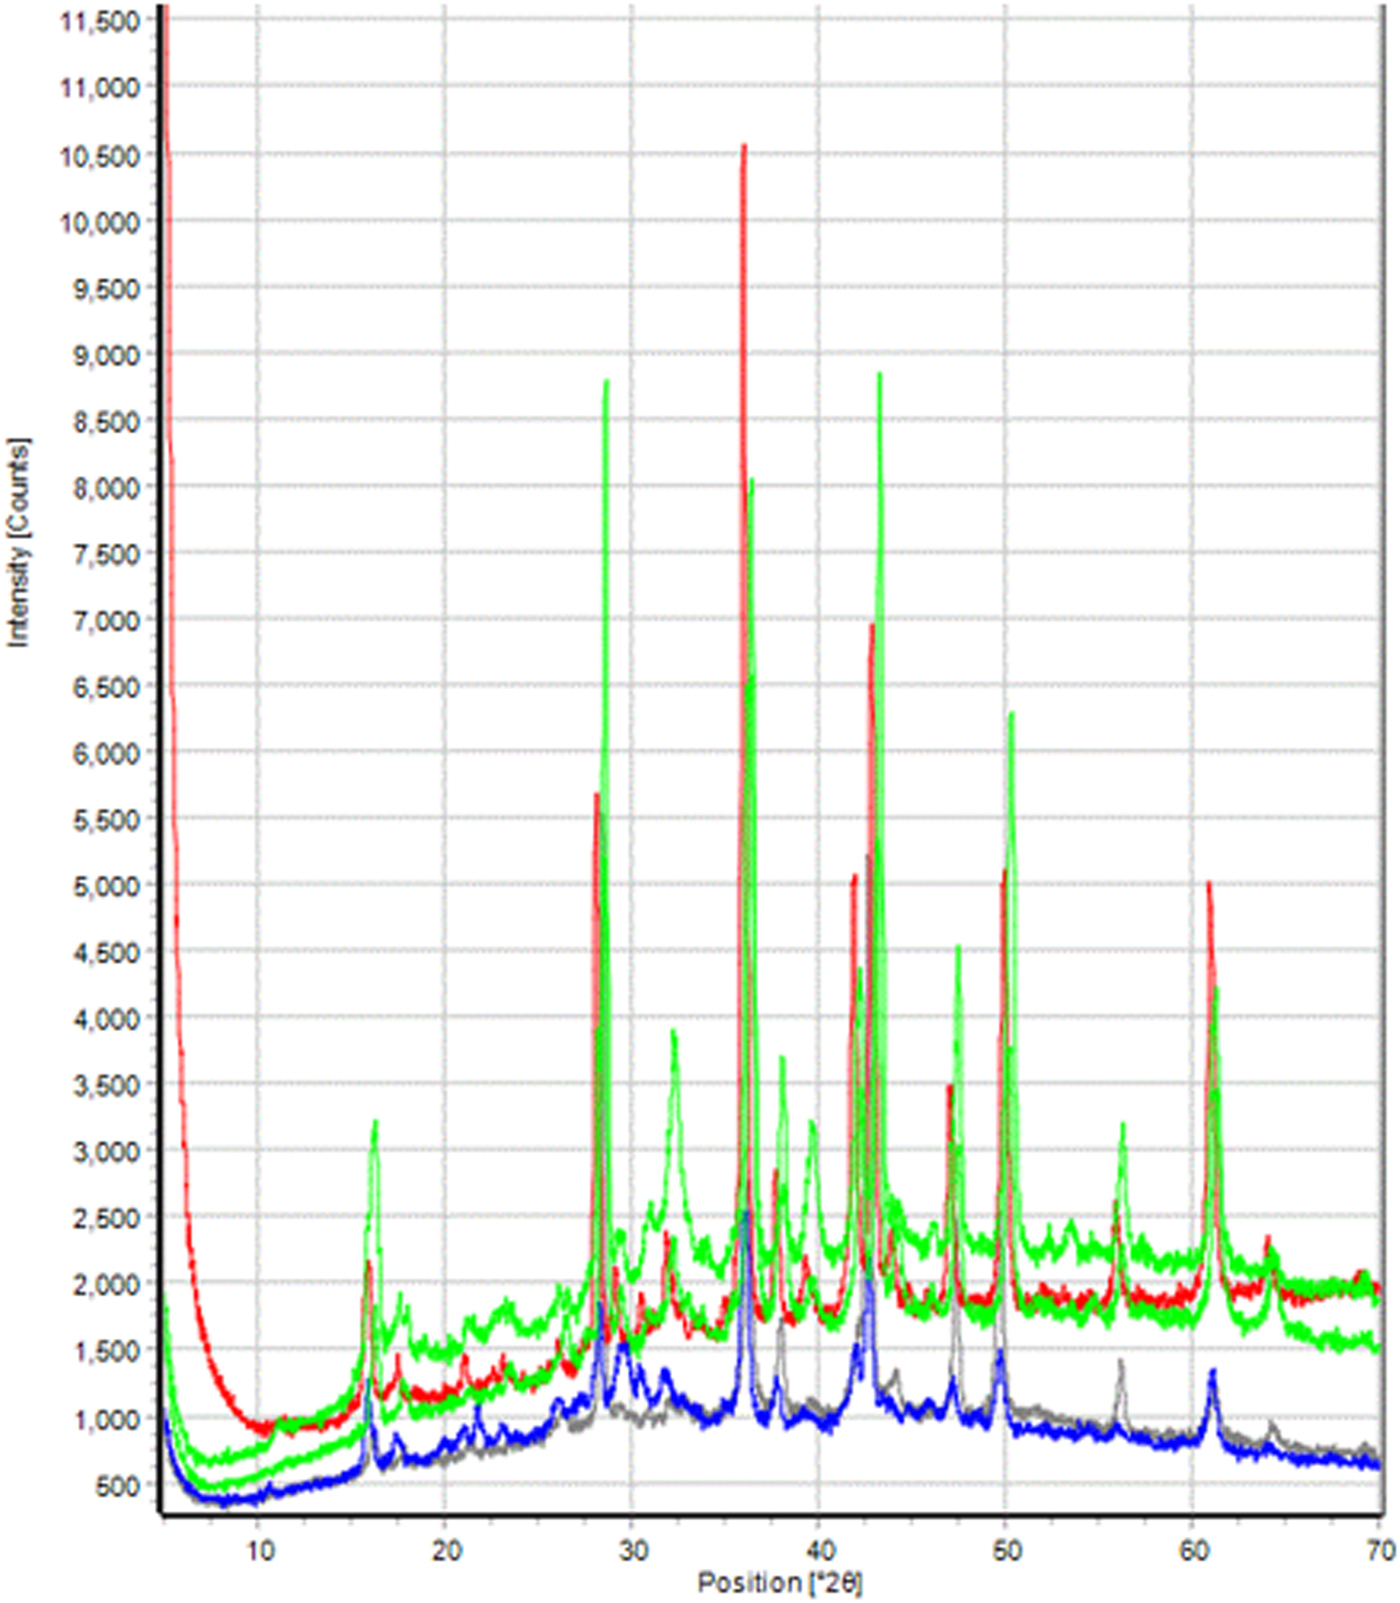
Figure 5. (Color online) Clustered XRD data sets of five coins exhibiting bronze disease. All patterns exhibit phases of copper, cuprite, copper chloride, and copper hydroxychloride. Differences in the patterns are because of variations in the oxidation phases of Sn and variable quantities of silver.
D. Late 3rd Century and early 4th Century bronzes
The patinas from late 3rd and early 4th-century Roman coins are very colorful, some examples are shown in Figure 6. The colors are generally lighter and large coin collections, many of which can be viewed on the internet, demonstrate a variety of appearances.
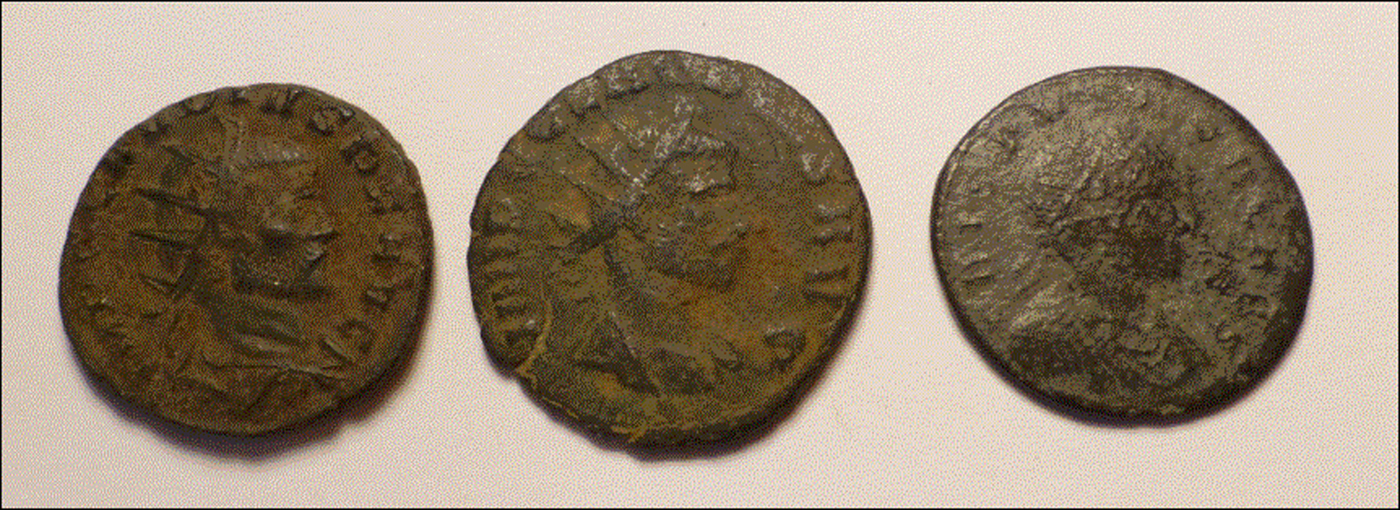
Figure 6. (Color online) High lead and tin containing bronze coins. The patinas are lighter in color because of the oxidation phases of the heavy metals on the coin surface. These coins correspond to #7, #5 and #22 in Table I.
The 3rd and 4th centuries AD of the Roman empire were a period of turmoil. The empire was constantly expanding and the expansion was being actively resisted by neighboring countries and tribes. Constant war required increased coinage to pay the far-flung legions, and additional mints were established to feed the demand. Periodic military and political setbacks put financial stress on the empire and there were periodic shortage of key mint metals such as Cu, Ag, and Au. During the mid to late 3rd century, there was a severe devaluation of Roman silver coinage as the silver content was reduced, silver washed bronze coins were also introduced. From 250 to 300 AD the silver content of the Roman denarius was reduced from approximately 50% to <4% by weight. Silver and silver-washed bronzes from this period were analyzed by XRD and the decrease in silver content is easily observed, as shown in Figure 1. XRF results also document the devaluation. The silver content of a Postumus antoninian from early in the devaluation period was 23%, while subsequent bronze coins ranged from 0.9 to 5.4%. An Aurelian antoninian, coin #8, large coin in Figure 4, contains 2% silver and is dramatically different in appearance from the Postumus antoninian, coin #4, Figure 8. While it should be remembered that the content is being measured on surface volumes of less than pristine coins, the data are fully consistent in historic records and known trends. Approximately 16 coins in this study contained silver by XRD analysis, nine of which were analyzed and confirmed by XRF analysis as shown in Figure 7.
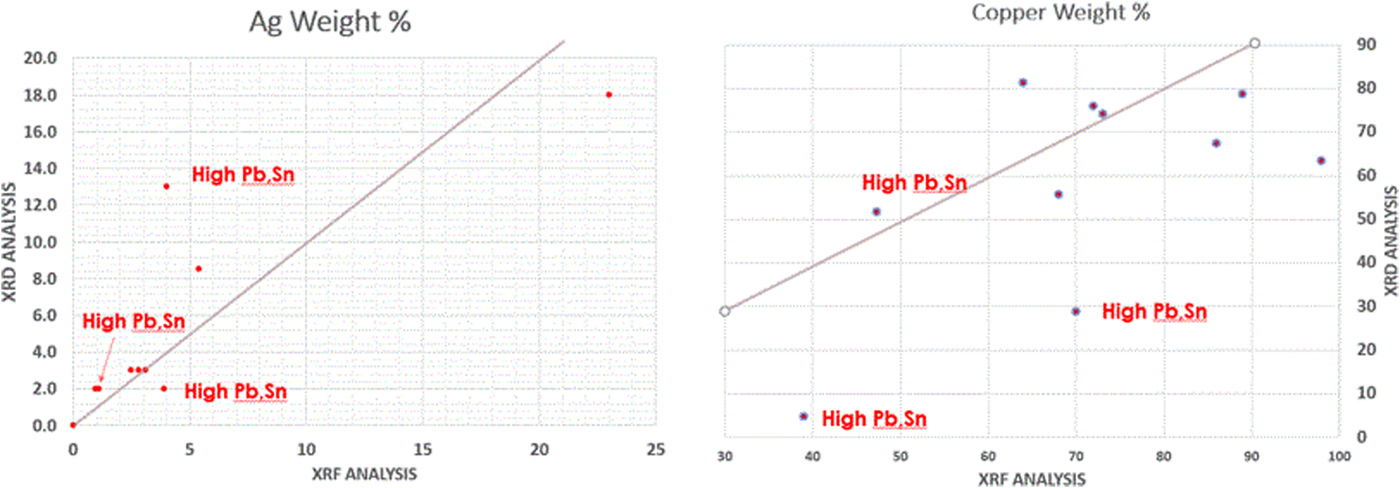
Figure 7. (Color online) Comparison of the silver (left) and copper (right) quantitative analyses by XRD (y-axis) and XRF (x-Axis) methods. However, because of the method and radiation sources used, the XRD method is sampling more surface volume so one would not expect agreement in layered microstructures.
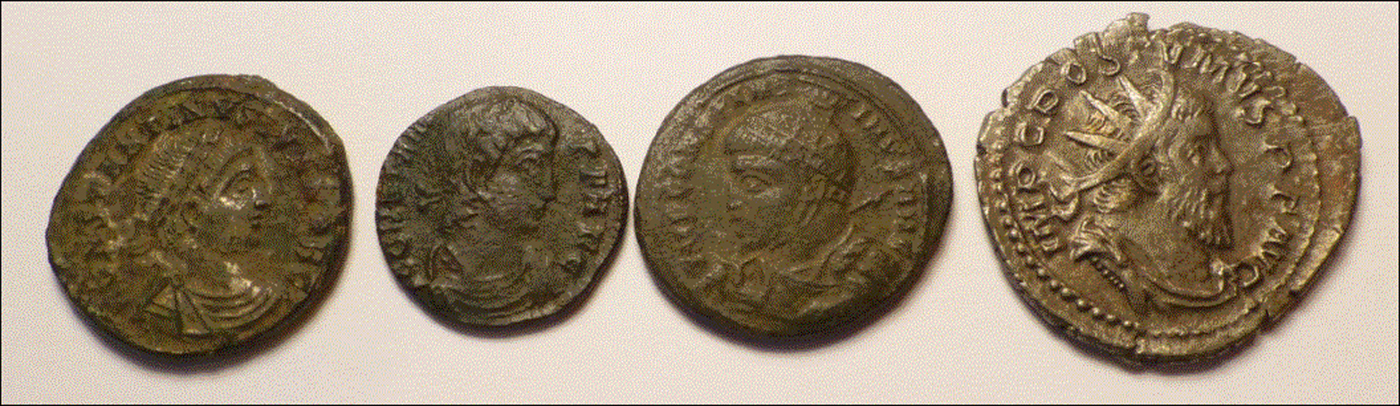
Figure 8. (Color online) Silver-washed (far left) and silver coated (far right) coins. The middle two coins have nearly identical phases and silver content to the silver-washed coin. These coins correspond to #17, #15, #12 and #4 in Table I.
A review of the currency changes during this period are described by Pense, in “The Decline and Fall of the Roman Denarii”, (Pense, Reference Pense1992) as well as cited reference books edited by Metcalf (Reference Metcalf2012), Carlson (Reference Carlson1990) and authored by Cribb, Cook and Caradice (Cribb et al., Reference Cribb, Cook and Carradice1990). In this study, the authors had both semi-quantitative XRD and XRF analyses of nine coins. Phase quantitation by XRD was performed by the RIR method and the results from fundamental parameters XRF are described as semi-quantitative since a silver tube was used and the data were corrected for tube effects.
The XRD and XRF data for silver are in general agreement with the exception of one coin, #17, Constantine II, that had 13 weight % silver by XRD and 4 weight % silver by XRF. This coin was the only coin in the collection that a dealer labeled silver wash coating and the XRD data are influenced by the absorption controlled depth of penetration using copper radiation, enhancing the silver content in the XRD analysis. Many of the coins in the lower left quadrant are dated between the reigns of Claudius II and Constantine the Great when Ag content was regulated at ~4 to 5 weight %. Coin data set #12, Constantine I, had 14 weight % silver by RIR analysis but the authors do not have corresponding XRF data. The patina is grey and the authors suspect that this coin was also silver washed, since the bulk silver content was regulated by currency reforms of the period. Coin #9, Numeranius, also exhibited higher XRD silver content but had the significant bronze disease as well, masking any visible appearance of silver. The four highest silver content coins by XRD are shown in Figure 8, and their corresponding XRD patterns are shown in Figure 1. The XRD and XRF semi-quantitative analyses are also in general agreement with three exceptions. Quantitative results are significantly different in two coins having high heavy metal content. In these two specimens, the authors know that the sampling volume was significantly different, and the XRD data tell that the Sn and Pb are fully oxidized, thus likely concentrated on the coin surface. This would lead to conclude that these differences are real and based on different sampling volumes with a segregated microstructure. In the third difference, the XRF data were calculated as elements using fundamental parameters while the XRD data show significant oxidation with both Cu2O and CuCl.
In summarizing the quantitative analyses, there was generally good agreement in coins without heavy metals, as expected, because of similar sampling volumes. The XRD and XRF quantitative analyses differed with high Pb, Sn, and Ag coins since the oxidation products concentrate on the surface, silver coating methods were used, and the sampling volumes were significantly different. XRD analyses using Cu radiation was more surface sensitive.
The bronzes of this period exhibit a wide range of chemistries. Silvering of bronze coins was a common mint practice to increase the apparent value of the coin. The silvering process was designed to coat the surface of the coin with silver. However, because of the age and extensive corrosion of the coins, this layering is not visible in most of the silver-containing bronzes. The XRD and XRF analyses clearly pick up the silver content, and XRD confirmed elemental silver, in 16 coins in this study. The high silver content coin was minted during the reign of “usurper” emperor Postumus. This coin is the only one that appears to be silver and has minimal corrosion. This antoninian contained higher silver to satisfy Postumus's revolting legions in Gaul during a time of devaluation of the antonianian coins from Rome. Lead, tin, and zinc were also mint metals and they were typically used to enhance physical strength and appearance. Pb especially was used when there were shortages of Ag and Cu. The Camp Gate coin #17, shown on the left in Figure 8, also contains 18 weight % lead by XRF analysis.
Three additional data clusters, containing eight coins, relate to the use of Pb and Sn in the bronze coins and the clusters are differentiated by a high Pb + Sn concentration group and a lower Pb + Sn concentration. XRD data from the high Pb + Sn group are shown in Figure 9. The patinas of these coins, as shown in Figure 6, are dominated by the oxides of the heavy metals, their carbonates, and mixed carbonates. In the XRD data sets, Figure 9, the copper and cuprite phases are less visible and the overall pattern intensity is much lower in comparison with data sets shown in Figures 1 and 5. In these XRD data sets the X-ray absorption caused by the heavy atom high density and mass absorption coefficients, limits the sampling volume to approximately the top micron of the coin. In these coins, the authors also observe quartz, calcite, dolomite some phosphate phases that might be associated with soil contamination on the surface. The high lead and tin coins are a group of six coins and the authors have XRF analyses on three coins, supporting the phase identifications. The total Pb and Sn concentration ranged from 15 weight % to 32 weight %. The other three coins with lower Pb and Sn content formed a separate cluster and in these coins the copper and cuprite phases were more dominant.
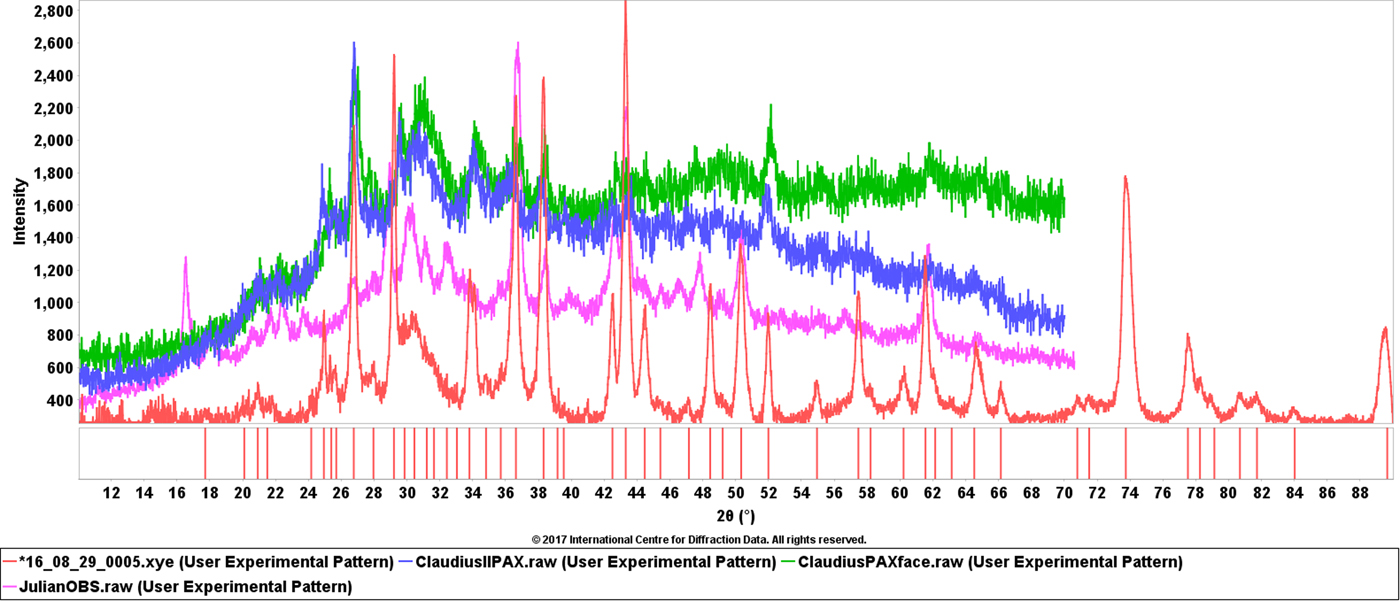
Figure 9. (Color online) Examples of XRD data sets from coins #5, #7, #22 that contain significant concentrations of lead and tin and their corrosion products. The difference in the top and bottom data sets is that the bottom data set also contains phases from the underlying coinage metals. The coin from the bottom data set contains 26% heavy metals while the top data set has 36% heavy metals by XRF analysis (Pb, Sn, Ag).
Dendrograms, correlation matrices, and PCA, Figure 11, can all be used to demonstrate the relationships between the clusters. Since the majority of coins contained major phases of copper and cuprite, as shown by RIR semi-quantitative analyses, the clusters are generally associated as shown by the four clusters on the right in the PCA diagram. The large red sphere contains oxidized bronze coins with smaller spheres for the coins with bronze disease and lower Sn + Pb concentrations. The more isolated group on the left, the blue cluster, are the heavy metal coins that are dominated by the oxidation products of tin and lead. Representative examples of various XRD clusters are shown in Figures 1, 5 and 9.
E. Patina appearance
As one would expect, the XRD data clustered on phase chemistry. Similar groups of phases cluster together because the XRD patterns are similar and cluster analyses use similarity algorithms. The patina appearance generally aligned with these grouping as various colored patinas corresponded to certain phases, as shown in Table II.
Table II. The relationships between appearance and composition.

This association is a generalization, for example, some coins exhibited both black and green patinas with copper hydroxychloride and copper hydroxycarbonate, malachite. One of the high lead and tin content coins also contained copper chlorides and other characteristics phases of bronze disease and the overall patina appearance of this coin was dominated by the light colors of oxidized tin and lead. Coin #9 also had a complex corrosion chemistry, as shown in the XRD analysis in Figure 10, but had the dark patina associated with bronze disease (far right, Figure 4). Characteristic phases were common to several members in each group. Individual coins had additional corrosion phases such as copper oxychloride, copper chloride hydrate, lead oxycarbonate, lead carbonate phosphate, lead arsenic sulfide, and sodium copper carbonate hydrate. On four coins these additional single patina phases resulted in the pattern not being clustered.
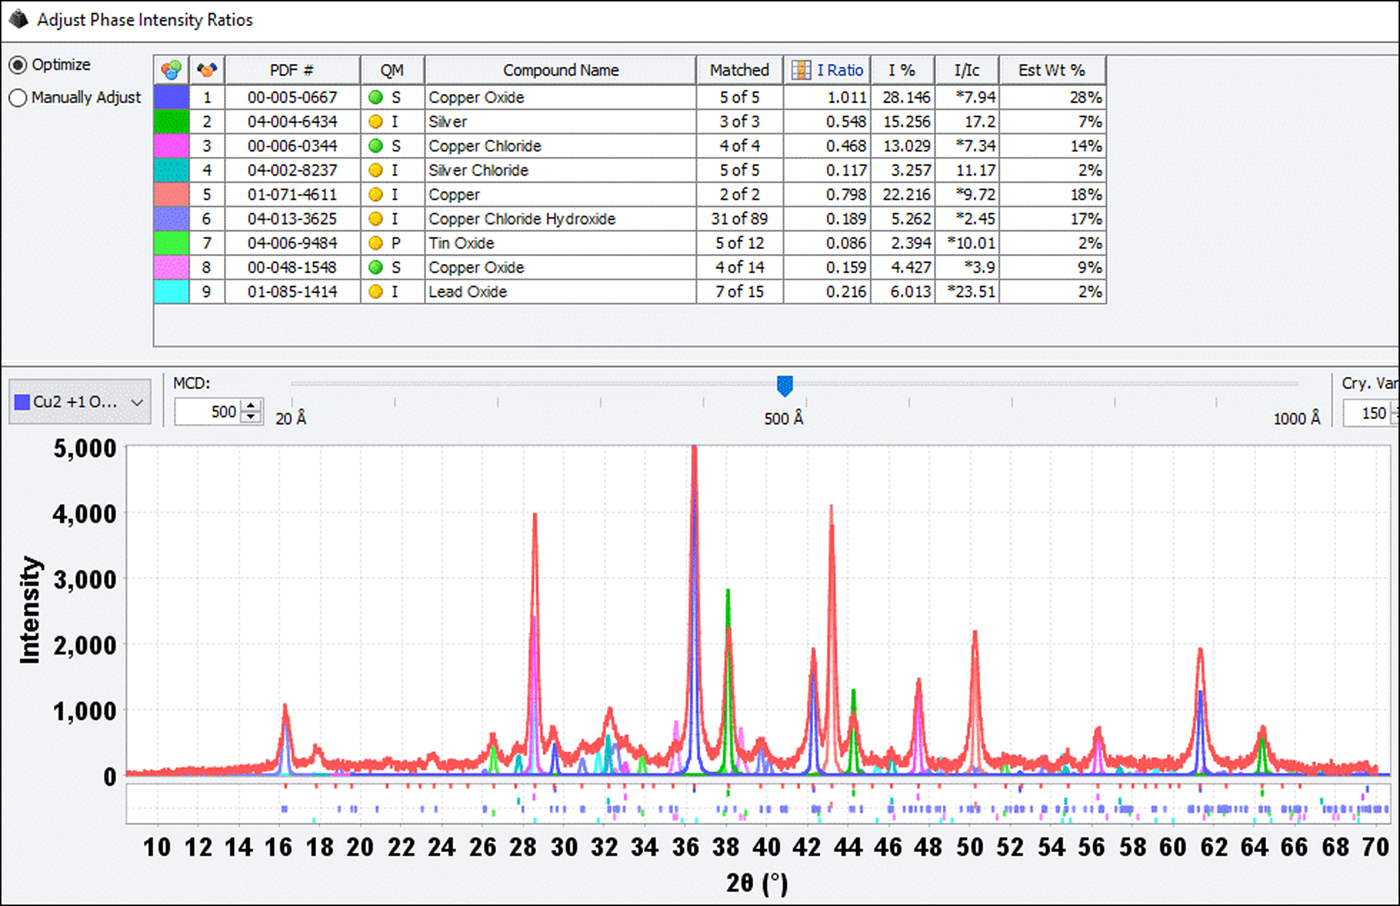
Figure 10. (Color online) Complex phase chemistry exhibited by coin #9. The diffraction pattern shows the silver and copper coinage metals, the oxides of copper, tin, and lead, copper chloride, and copper chloride hydroxide. This coin had a dark patina, similar to the coins shown in Figure 4.
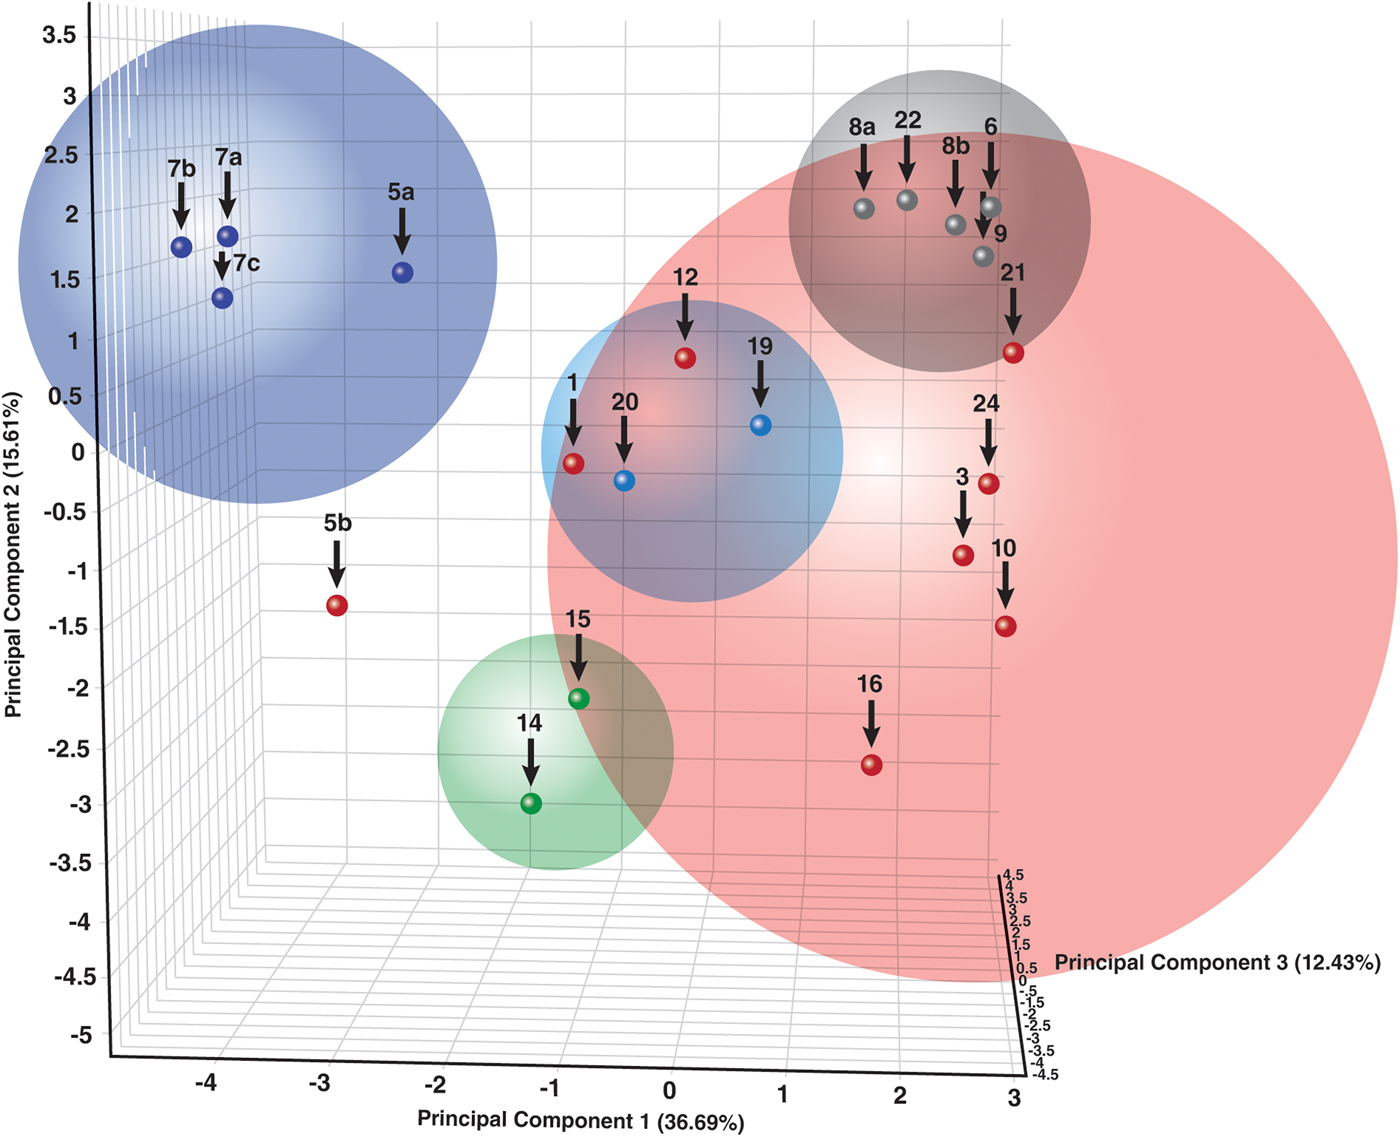
Figure 11. (Color online) Principal component analysis of various XRD data clusters. The largest cluster (red) corresponds to combined phases of copper and cuprite in high concentration. The other clusters contain various characteristic surface chemistries.
In the reference literature, the bronze disease is often characterized by green or blue-green patinas, which correspond to various copper chlorides and carbonates (i.e. azurite and malachite). The patinas were distinctly black, more characteristic of oxidized divalent copper. The authors did find CuO, tenorite, in a couple of coins but in low concentrations. Coins #11, #17 and #21, not shown in any of the figures, did have small localized green spots with XRD identification of malachite.
IV. CONCLUSIONS
This project began out of curiosity as to why Roman bronze coins exhibited a wide range of patina colors. The authors found that the coin compositions are a reflection of historical events that occurred during the growth of the Roman empire and that the various colored patinas were a result of changes in mint coinage metals and their subsequent corrosion products. Through NDE XRD and XRF methods, the authors showed corrosion types that relate to the appearance of the coins and their characteristic coinage metals. The analyses showed how XRF and XRD data can be combined to provide details on the patina chemistry as a function of coin types and surface depth.
ACKNOWLEDGEMENTS
Several internet sites were used for coin identification and history. They are summarized below. The sites were active in 2017, during the period of research for the publication. In most cases, an exact match was found to the coins listed in Table I to both the obverse and reverse images on the coin.
http://www.forumancientcoins.com/dougsmith/index.html. Doug Smith's, ancient coin forum, formerly ancient Greek and Roman coins. “An Educational Site on Roman Coins, Greek Coins and other Ancient Coins”
Contains an excellent discussion on coinage reforms and the “common” falling horseman coins.
“The thirteen years that were spanned by the Falling Horseman type saw many changes (up and down, mostly down!) in size and weight standards. The early coins were what collectors term AE2 measuring 21 to 23mm diameter; the final issues were down to about 16mm not really qualified to be called AE3. Often these later, tiny coins are called AE3/4 recognizing that they are still a bit large to term AE4. All were silvered when first issued but relatively few retain more than a trace of the very thin coating”
http://www.romancoins.info/ “Roman Numismatic Gallery” described as an on-line museum. This site describes various coin denominations
http://vcrc.austincollege.edu/ “The Virtual Catalog of Roman Coins”, The entries and web materials are edited by Robert W. Cape, Jr., Associate Professor of Classics, Austin College, Texas. The catalog was used extensively to identify obverse and reverse images on the coins.
http://www.roman-emperors.org/ “De Imperatoribus Romanis: An Online Encyclopedia of Roman Rulers and Their Families” This site is edited by Richard D. Weigel and maintained by the Academic Computer Services of Loyola University Chicago.


