I. INTRODUCTION
Recently, complex perovskites fluorides have attracted considerable attention because of their various important properties, such as piezoelectric characteristics, ferromagnetic, non-magnetic insulator behavior, and photoluminescence (Alcala et al., Reference Alcala, Sardar and Sibley1982; Heaton and Lin, Reference Heaton and Lin1982; Mortier et al., Reference Mortier, Gesland and Rousseau1994; Tan and Shi, Reference Tan and Shi2000; Manivannan et al., Reference Manivannan, Parhi and Kramer2008). The typical compound KMF3 (M: transition metal) shows that the magnetic property and spin configuration can be changed by the crystal structure itself and external conditions (Dovesi et al., Reference Dovesi, Fava, Roetti and Saunders1997). The cubic room temperature perovskite structure of KMnF3 transforms to an orthorhombic phase at 184 K (Beckman and Knox, Reference Beckman and Knox1961; Kizhaev and Markova, Reference Kizhaev and Markova2011), and transition into the tetragonal phase with the space group –P4/mbm at 91.5 K (Du et al., Reference Du, Zuo and Yang2005; Salje et al., Reference Salje, Zhang and Zhang2009). The change of structure causes a transition to uniaxial antiferromagnetism below 88.3 K (Heeger et al., Reference Heeger, Beckman and Portis1961). For the perovskite-type cobalt fluoride of KCoF3, the crystal structure is slightly distorted and its spin state is changed with the temperature shift (Onishi and Yoshioka, Reference Onishi and Yoshioka2007). Although the magnetic property of KMF3 has been widely investigated, the electrical transport properties were seldom reported.
In this work, KMF3 (M = Mn, Co, and Ni) was synthesized through a simple solution route. The crystal structure of KMF3 was refined by the Rietveld method (Rietveld, Reference Rietveld1967) and the temperature-dependent electrical transport property was investigated.
II. EXPERIMENTAL
Te complex fluorides KMF3 (M = Mn, Co, and Ni) were synthesized by the solution method from a stoichiometric mixture of KF, MnCl2·4H2O, CoCl2·6H2O and NiCl2·4H2O. The purity of all chemical reagents is of analytical grade. For synthesis of KMF3, KF and MCl2 (M = Mn, Co, and Ni), were added in a 3:1 molar ratio into a water-bath along with 100 mL of deionized water. The reaction in this system may occur as follows:
 $${\rm 3KF}+{\rm MnCl}_ 2 \cdot {\rm 4H}_ 2 {\rm O} \to {\rm KMnF}_ 3+{\rm 2KCl}+{\rm 4H}_ 2 {\rm O}$$
 $${\rm 3KF}+{\rm CoCl}_ 2 \cdot {\rm 6H}_ 2 {\rm O} \to {\rm KCoF}_ 3+{\rm 2KCl}+{\rm 6H}_ 2 {\rm O}$$
 $$\hskip-1pc{\rm 3KF}+{\rm NiCl}_ 2 \cdot {\rm 4H}_ 2 {\rm O} \to {\rm KNiF}_ 3+{\rm 2KCl}+{\rm 4H}_ 2 {\rm O}$$
The crystallographic information of prepared samples were analyzed by the powder X-ray diffraction (XRD) method using a Bruker AXS D8 DISCOVER X-ray diffractometer with CuKα radiation (λ = 1.5406 Å). The accelerating voltage and applied current were 40 kV and 40 mA, respectively. The diffraction data were collected in the 10–120°2θ range by a dynamic scintillation detector using an integrated slit (1 × 0.6 mm2 slit, 2.5° solar slit), and a 0.6 × 0.2 mm2 receiving slit, with steps of 0.02°2θ and 10 s per step. The crystal structures of the synthesized products were refined by the Rietveld method using MAUD software (Lutterotti et al., Reference Lutterotti, Matthies, Wenk, Schultz and Richardson1997). The morphology of the as-prepared products was characterized by field emission scanning electron microscope (FESEM, S-4800) with acceleration voltage of 5 kV. Temperature dependence of resistance was measured on the electrical transport properties measurement system (SHI-4S-1) in a four-probe configuration.
III. RESULTS AND DISCUSSION
XRD analysis was adopted to analyze the crystal structure and phase composition of synthesized products. Figure 1 shows the XRD pattern of KMF3 (M = Mn, Co, and Ni). All the diffraction peaks in each pattern can be indexed to cubic perovskite structure KMnF3 (PDF no. 17-0116), KCoF3 (PDF no. 18-1006), and KNiF3 (PDF no. 21-1002) with space group Pm-3m, respectively. No other diffraction peaks are detected, indicating that all the as-prepared products are pure KMF3. The Rietveld method was used to refine the crystal structure of KMF3 (M = Mn, Co, and Ni) compound. The final values of the agreement factors were: R P = 3.57%, R WP = 4.14%, R exp = 3.02%, R B = 6.61% for KMnF3, R P = 3.65%, R WP = 3.92%, R exp = 2.71%, R B = 7.12% for KCoF3, and R P = 5.84%, R WP = 5.91%, R exp = 4.23%, R B = 8.56% for KNiF3. Unit-cell parameters were refined to be a = 4.189 46(4) Å for KMnF3, a = 4.075 58(4) Å for KCoF3, and a = 4.025 70(2) Å for KNiF3. As an example of the Rietveld results, the final refinement pattern of KCoF3 was given in Figure 2. The main results of Rietveld structural refinement are presented in Table I, and the atomic parameters of KMF3 are listed in Table II.

Figure 1. XRD patterns of KMnF3, KCoF3, and KNiF3.
Figure 2. Final Rietveld refinement plots of the compound KMnF3. The small cross (+) and continuous line correspond to the experimental data and calculated pattern, respectively. The vertical bar (I) indicates the position of Bragg peaks. The bottom trace depicts the difference curve between the experimental and the calculated patterns.
Table I. Crystallographic data, experimental details of X-ray powder diffraction and Rietveld refinement data for KMnF3, KCoF3, and KNiF3.
 $R_{\rm B}=\displaystyle{{\sum {\left\vert {I_{\rm o} - I_{\rm c} } \right\vert } } \over {\sum {I_{\rm o} } }},$
 $R_{\rm P}=\displaystyle{{\sum {\left\vert {Y_{{\rm io}} - Y_{{\rm ic}} } \right\vert } } \over {\sum {Y_{{\rm io}} } }},$
 $R_{{\rm WP}}=\left\{{\displaystyle{{\sum {W_{\rm i} \lpar Y_{{\rm io}} - Y_{{\rm ic}} \rpar ^2 } } \over {\sum {W_{\rm i} Y_{{\rm io}} ^2 } }}} \right\}^{1/2}, $
 $R_{\exp }=\left\{{\displaystyle{{\lpar N - P\rpar } \over {\sum {W_{\rm i} Y_{{\rm io}} ^2 } }}} \right\}^{1/2} .$
Table II. Fractional atomic coordinates and isotropic thermal parameters for KMnF3, KCoF3, and KNiF3.

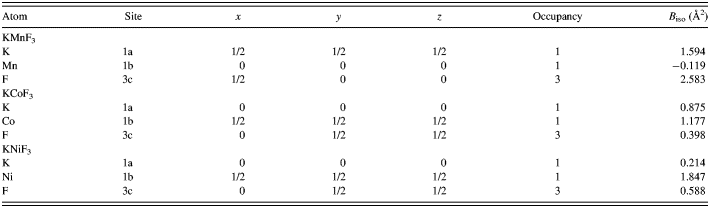
Figure 3 depicts the crystal structure of KMF3 (M = Mn, Co, and Ni). The complex fluoride KMF3 has a cubic perovskite structure. The center M2+ ion is octahedrally surrounded by fluorines. FESEM was used to observe the morphology of the synthesized complex fluorides. Figures 4(a–c) show FESEM images of KMnF3, KCoF3, and KNiF3, respectively. As shown in these images, the complex fluorides formed in cubic-shaped particles. These particles have regular morphology and this implies that the products are a pure and single phase.
Figure 3. Crystal structure of KMF3 (M = Mn, Co, Ni).
Figure 4. SEM images of KMF3: (a) KMnF3, (b) KCoF3, and (c) KNiF3.
The temperature dependence of resistance (R–T) for KMF3 (M = Mn, Co, and Ni) was measured in the temperature range from 100 to 320 K (shown in Figure 5). The R–T curves of KMnF3, KCoF3, and KNiF3 are similar. Above 262 K (275 K for KCoF3 and 250 K for KNiF3), the resistance of KMnF3 decreased with the increase of temperature. Below 262 K, the resistance starts to decrease, and after a minimum value around 175 K (212 K for KCoF3 and 160 K for KNiF3), it eventually goes up along with decreasing temperature. It can be seen clearly that there is an abnormal transition in the temperature range from 250 K to room temperature. For these compounds, the electron transport depends on the spin-exchange between adjacent transition metal ions significantly. Crystal parameters and magnetic properties are two important factors affecting spin-exchange. With the decrease of temperature, abnormal transitions in R–T curves should be caused by weakening of spin-exchange. For KMnF3, there is cubic to tetragonal transition at ~185 K in a single crystal, but the tetragonal short range order extends to T > 215 K (Salje et al., Reference Salje, Zhang and Zhang2009). For KNiF3, a ~250 K Neel temperature was reported (Nouet et al., Reference Nouet, Zarembowitch, Pisarev, Ferre and Lecomte1972; Newman, Reference Newman1973). For KCoF3, there is a transition from cubic to tetragonal at ~110 K, accompanied with a magnetic transition from paramagnetic to anti-ferromagnetic (Holedn et al., Reference Holedn, Buyers, Svensson, Cowley, Hutchings, Hukin and Stevenson1971). It is reasonable for KMnF3 and KNiF3 to have abnormal transition of resistance caused by crystal structure changing and magnetic phase changing, respectively. For KCoF3, we supposed that there was a tiny tetragonal phase existing at temperature up to ~275 K because of the strain in polycrystalline sample. The magnetic order is much related to the crystal phase. Not like magnetic properties, the electrical transport property is quite sensitive to local state. The sharp increase of resistance is possibly attributed to the occurrence of anti-ferromagnetic order which is related to the tetragonal phase. The upturn of resistance at low temperature is possibly because of the existence of grain boundary in KMF3 polycrystalline compounds.
Figure 5. The temperature-dependent resistance of KMnF3, KCoF3, and KNiF3.
IV. CONCLUSION
KMF3 (M = Mn, Co, and Ni) was synthesized through a simple solution route. The compound KMF3 crystallizes in a cubic perovskite structure with space group Pm-3m. The crystal structure of KMF3 was refined by the Rietveld method on the basis of the X-ray powder diffraction data. An abnormal electrical transport behavior was observed in the temperature range between 250 and 280 K. Such a phenomenon was considered to be related to the spin-exchange behavior which occurred in the temperature range mentioned above.
ACKNOWLEDGEMENTS
This work was supported by the National Natural Science Foundation of China (Grant Nos. 51072182, 51172208, 51202218, 61274009, 61274017, and 61264007), Science and Technology Department of Zhejiang Province Foundation (Grant No. 2012C23037), and the Natural Science Foundation of Zhejiang Province (Grant No. Y1110519).