


1. Introduction
In order to ensure that respondents pay attention on self-administered surveys, researchers frequently use “Screener” questions to identify inattentive respondents (Oppenheimer et al., Reference Oppenheimer, Meyvis and Davidenko2009; Meade and Craig, Reference Meade and Craig2012; Berinsky et al., Reference Berinsky, Margolis and Sances2014). By instructing respondents to select a specific, otherwise atypical response to demonstrate their attention, these questions effectively reveal the proportion of respondents who do not read questions carefully. Using this method, Berinsky et al. (Reference Berinsky, Margolis and Sances2014) show that as many as 40 percent of respondents will fail Screener questions, and that attentive and inattentive individuals respond to the same stimuli in very different ways.Footnote 1
While Screeners hold great potential for identifying inattentive respondents, questions remain regarding their implementation. First, what is the optimal number of Screeners for identifying inattentive respondents? Berinsky et al. (Reference Berinsky, Margolis and Sances2014) present evidence that a single Screener measures attention with error and ultimately argue for an “additive scale based on multiple measures” (747). Thus, multiple questions are needed. However, it is currently unclear just how many questions are necessary—and thus how much survey time researchers should allocate—for a useful scale.
Second, what types of Screener questions best capture inattention? Existing work offers a plethora of potential Screeners that vary both in content—for instance, questions about a respondent's favorite color, current mood, or interest in politics—and form—such as stand-alone questions that instruct respondents to choose a given option or perform a specific task (Oppenheimer et al., Reference Oppenheimer, Meyvis and Davidenko2009; Berinsky et al., Reference Berinsky, Margolis and Sances2016) or attention checks that appear within a grid or among a battery of questions (Kung et al., Reference Kung, Kwok and Brown2018). The dozens of political science articles that have been published since 2014 that use Screeners have employed them in an ad hoc way, raising concerns about generalizability and replicability.
In this paper, we examine how to best capture survey attentiveness using a relatively small set of survey questions. We provide general guidance for the kinds of 10–20 min self-administered Internet surveys now common in political science research. We show it is possible to accurately capture survey attentiveness using only two stand-alone multiple choice Screener questions and two simpler true/false questions within a grid. Moreover, our results highlight that while stand-alone Screeners are well equipped to distinguish between respondents at the top of the attentiveness spectrum, grid Screeners are better able to do so among respondents with low levels of attention. Finally, we make general recommendations for applied researchers interested in using a standard attentiveness scale. Though this advice is primarily aimed at scholars using a 10–20 min online survey, these guidelines can be adapted to other surveys as well. Our purpose here is to advance a measurement approach to gauge attentiveness reliably in as short a scale as is feasible.
2. Data and methods
We use the two-parameter item response theory (IRT) model (Clinton et al., Reference Clinton, Jackman and Rivers2004; Van der Linden, Reference Van der Linden2005) to measure respondents' latent attentiveness on surveys.Footnote 2 This model characterizes each Screener response y ij ∈ {0, 1} as a function of subject i's latent attentiveness (θi), the difficulty (αj), and discrimination (βj) of item j, where
where Φ is the standard normal CDF (Jackman, Reference Jackman2009; Fox, Reference Fox2010).Footnote 3 We estimate the IRT model using the ideal function in the pscl R package (Jackman, Reference Jackman2010). We identify the attentiveness estimates by post-processing them to have a standard normal distribution.
While a greater number of screener items facilitate more accurate measures of attentiveness (Berinsky et al., Reference Berinsky, Margolis and Sances2014), researchers are rarely able to include a large number of screeners in their surveys. In order to evaluate an optimal set of screener items to measure attentiveness, we draw from optimal test theory (van der Linden, Reference van der Linden1998; Tausanovitch and Warshaw, Reference Tausanovitch and Warshaw2012; Montgomery and Cutler, Reference Montgomery and Cutler2013). Specifically, we seek to maximize Fisher's Information for a given scale. Under this framework, the contribution of a given item to our level of certainty at a particular value of attentiveness, θi, can be determined by evaluating Fisher's Information for the item at that value (Bimbaum, Reference Bimbaum, Lord, Novick and Birnbaum1968; Van der Linden, Reference Van der Linden2005):
where p = Φ(βjθ − αj) and q = 1−p. This is referred to as the Item Information Function (IIF). The Test Information Function (TIF) for a set of items is simply the sum of the individual IIFs (Van der Linden, Reference Van der Linden2005, 16–17). We use the IIF as means of selecting items and the TIF as a way of comparing sets of items.
Scholars may want to maximize information across the entire range of attentiveness. Van der Linden (Reference Van der Linden2005) shows that this can be done by maximizing the TIF for a small set of uniformly distributed points in the range of attentiveness, θ. Since the TIF is an additive function of the IIFs, this requires only that we calculate the values of the IIF at each of these points, and choose the items with the highest sum of these values.
Alternatively, we may also want to discriminate between low and medium/high attention respondents—that is, between shirkers and workers (see Van der Linden, Reference Van der Linden2005, 22–22). For example, we might want to just separate respondents in the bottom quartile of the range of attentiveness from the rest of the respondents. To do this, we can maximize the TIF at a value in the lower end of the attentiveness spectrum. This gives the optimal set of items to separate low attentiveness respondents—aka, shirkers—from the rest of the respondents.
To examine how to best capture attentiveness using a small set of survey questions, we conducted a nationally diverse online survey of 2,526 Americans via Survey Sampling International (SSI) in August 2016. The survey included eight Screeners. Following Berinsky et al. (Reference Berinsky, Margolis and Sances2014), four of these items were Screeners asking about favorite colors, the most important problems facing the country, news web sites, and newspaper sections. Each of these Screeners is stand-alone—the Screener question is the only question to appear on the page—which has been the traditional way of asking Screener questions to date. We show screenshots of these questions in the online Appendix A.
We embedded the four remaining Screeners in question grids alongside other questions. The purpose of these grid Screeners was to explore the feasibility of increasing the total number of Screeners asked while taking up less space. We presented subjects with two grids of questions over the course of the survey. For each row in the grid, a respondent was presented with a (randomly ordered) statement with which they could agree strongly, agree, neither agree nor disagree, disagree, or disagree strongly. Along with sincere attitudinal questions such as whether the federal government should guarantee health insurance and whether gays and lesbians should have the right to marry, the first grid included two Screener statements that have a single right answer: that World War I came after World War II; and an instruction to “Please check ‘neither agree nor disagree”’. The second grid similarly contained two Screener statements—“Obama was the first president” and “Two is greater than one”—amid the sincere attitudinal statements.
3. Results
As a benchmark, we first measure attentiveness using all eight items. Table 1 shows the results. First, it shows the percentage of people that got each item right. It also shows the “discrimination” parameter for each item, βj, which captures the degree to which respondents' latent attentiveness affects the probability of a correct answer on each question. If βj is 0, then questionj tells us nothing about attentiveness. In addition, it shows the difficulty parameter for each item, αj, which indicates how hard an item is to get right. Finally, it shows how much information each individual Screener item provides about the full attentiveness scale, as well as for high and low attentiveness respondents.Footnote 4
Table 1. Item parameters
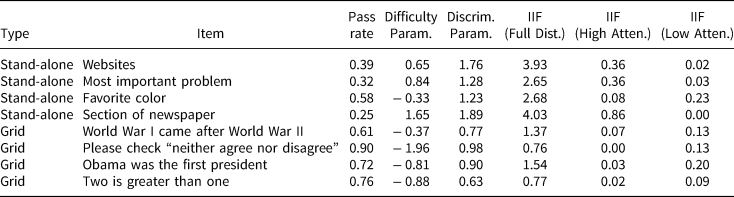
The top four survey items in Table 1 are traditional, stand-alone Screeners. These items have relatively low passage rates, ranging from 25 to 58 percent, and the high difficulty parameter values for these questions suggest even relatively attentive respondents failed some of these Screeners. That said, these questions all discriminate well on the latent scale, and they each contribute a good deal of information to the full scale. The high difficulty of stand-alone Screeners means they do a good job of discriminating between those with moderate and high levels of attention but are unable to distinguish among respondents at the bottom range of attentiveness (see online Appendix D).
In contrast, the four grid items all have relatively high passage rates—ranging from 61 to 90 percent. The low difficulty parameters confirm that only inattentive people failed many of these Screeners. While these items do not contribute as much information to the full attentiveness scale (or at the top end of the range of attentiveness) as the stand-alone Screeners, they do discriminate very well between people at the low end of the scale (since these are the people that tend to fail the grid items). Examining the IIF for the low-attentiveness respondents in the last column, we see that all four grid Screeners contribute more information at the low end of the scale than the website, most important problem, and section of the newspaper stand-alone Screeners.Footnote 5
Next we evaluate the validity of various scales that combine multiple screener items. First, we evaluate the full scale with all eight Screener items. Next, we evaluate scales that use the four traditional Screeners or the four grid Screeners. The scale with only the four stand-alone Screeners is likely to do a good job discriminating among high attention respondents, but a poor job at discriminating among low attention respondents. Conversely, the scale with only the four grid Screeners is likely to do a good job discriminating among low attention respondents, but a poor job at discriminating among high attention respondents. Finally, we evaluate a mixed attention scale that combines two grid Screeners that provide information about the attentiveness of low attention respondents and two stand-alone Screeners that provide information about the attentiveness of high attention respondents.Footnote 6
In Figure 1, we follow the model of Berinsky et al. (Reference Berinsky, Margolis and Sances2014) and evaluate how each of four attentiveness scales fares at predicting respondents' performance on Tversky and Kahneman's (Reference Tversky and Kahneman1981) unusual disease framing experiment (see online Appendix B). The y-axis represents the framing treatment effect and the x-axis is the attentiveness scale with larger numbers indicating greater levels of attention. Each figure includes points that represent quintiles along the attentiveness scale as well as a loess line and 95 percent confidence bands, which use 40 binned groups. Following Berinsky et al. (Reference Berinsky, Margolis and Sances2014), we expect the treatment effects will be larger among more attentive respondents.

Figure 1. Attentiveness plays a role in detecting experimental treatmenteffects.
In the top-left panel of Figure 1, we find the full scale with eight items clearly discriminates the most inattentive from everyone else. Indeed, there is essentially no treatment effect among respondents in the lowest quintile of attentiveness (treatment effect = 0.09, SE = 0.04). In contrast, there are clear effects among the remaining 80 percent of the attentiveness scale. To put these results in context, the magnitude of the experimental treatment effect among those who fall in the 20–40th percentile is the same as it is for those who passed any stand-alone Screener.Footnote 7 In other words, the traditional, stand-alone Screeners not only require researchers to drop substantial portions of the sample, but the results look virtually identical to those with only moderate levels of attentiveness.
In contrast, scales that use all traditional Screeners (top-right panel) or all grid Screeners (bottom-left panel) do much worse at discriminating shirkers from workers in this experiment. For the scale that employs only traditional Screeners, there are smaller, but non-null treatment effects in the lowest two quintiles. This result occurs because the stand-alone Screeners do not do a good job distinguishing between those with low and moderate levels of attention. As a result, moderately attentive respondents, who responded to the framing treatment, end up in the bottom quintile of attention. Moreover, only in the top 40 percent of attentiveness on this scale do the treatment effects reach the same strength as using the top 80 percent of attentiveness on the full scale. For the scale with all grid Screeners, the top three quintiles have similar average scores of attentiveness because many respondents answered almost or all the grid screeners correctly. While the grid screener scale can certainly identify true shirkers, it has a more difficult time separating individuals at the higher end of attentiveness. Crucially, however, on both of these scales analysts would have to drop at least 40 percent of the sample in order to clearly separate shirkers from workers, whereas the full eight-item scale can distinguish between shirkers and workers by dropping only the bottom quintile of attentiveness.
While the eight-item scale performs better than using four stand-alone Screeners or four grid Screeners, implementing a survey with eight Screeners is costly. A mixed attention scale with two grid and two stand-alone Screeners performs nearly as well as the full scale (bottom-right panel). The experiment yields small treatment effects among respondents in the lowest quintile of attentiveness (0.11). Once again, however, there is a clear jump in the size of the treatment effects between the bottom and second quintiles, with relatively modest differences across quintiles.Footnote 8 Similar to the full eight-item scale, the four-item mixed scale improves upon the strategy of using a single stand-alone Screener by showing that researchers can improve data quality while maintaining a larger proportion of the sample.
These results further show that the framing experiment is not one that requires extreme levels of attentiveness. Respondents need to pay some attention to the treatment—choosing response options randomly will not suffice. But even those individuals who may have only skimmed the experimental stimulus responded to the difference in language between the conditions.
Next, we examine how well the different attentiveness scales do at reducing noise in a non-experimental setting when question wordings require close reading, again following Berinsky et al. (Reference Berinsky, Margolis and Sances2014). For the last four decades, the ANES has asked a series of three questions on economic liberalism (see online Appendix C). For two of the questions, a low response (1) represents a liberal position while a high response indicates a conservative position (7). On the third question, the scale is reversed.
In Figure 2, we examine the difference in (a) the correlation between the reverse-item scale and the one of the two like-coded scales (which should be negative) and (b) the correlation between the two like-coded scales (which should be positive). If respondents are paying attention, the correlation between the same-coded scales should be around 0.5 and the correlation between the reversed scale should be around − 0.5, producing a difference of − 1. This is exactly what we observe when using the attentiveness scale with all eight items (upper-left panel). Here, we find virtually no difference in the correlations of flipped and non-flipped ANES scales among respondents in the lowest quintile of attentiveness. After a large difference between the bottom and second quintiles of attentiveness (− 0.03 versus − 0.47), the middle 60 percent of the attentiveness range (second, third, and fourth points) looks similar to one another, whereas those in the top 20 percent in the attentiveness range has a difference correlation of − 0.92. Unlike the framing experiment in which respondents in the top 80 percent of the sample all responded similarly to the experimental stimulus, the most attentive people in sample were the most responsive to the relatively long survey questions and subtle change in response options. In other words, for the ANES questions, attentiveness matters at both the top and the bottom of the scale.

Figure 2. Attentiveness plays a role in non-experimental data collection.
Again, the four-item scale made up of only stand-alone Screeners (top right) does a better job distinguishing among people at the top end of the attentiveness range rather than the bottom, while the four-item scale made up of only grid items (bottom left) does a good job identifying the least attentive respondents but has a more difficult time distinguishing respondents at the top end of the attentiveness spectrum.Footnote 9 Again, the four-item mixed attention scale looks quite similar to the eight-item scale, successfully distinguishing between inattentive respondents in the bottom quintile and the rest of the sample. These results indicate that the mixed scale with only four items performs nearly as well as the full scale at detecting inattentive respondents on the ANES scales.
4. Discussion and conclusion
Previous research has already shown that using a single Screener question is problematic. In this paper, we show that researchers should use multiple Screeners that vary in difficulty in order to accurately place respondents on an attentiveness scale.
As a general rule, we recommend using a multi-item scale that includes Screeners with both high and low passage rates, similar to our four-item mixed scale. We recommend that researchers use an IRT model to construct this scale. But a simpler factor-analytic model will often suffice. This scaling strategy allows researchers to classify respondents at both the top and bottom ends of the attentiveness spectrum. Figures 1 and 2 make it clear to readers how respondents with different levels of attentiveness behave in the survey. That said, researchers may want to tailor a set of attention checks specific to their research needs. For example, grid Screeners will suffice if researchers want to identify the least attentive respondents. Alternatively, if one has a particularly subtle treatment or complicated experimental design that requires respondents to pay careful attention, stand-alone Screeners would be the best way to distinguish among people at the top end of the attentiveness spectrum.
Supplementary Material
The supplementary material for this article can be found at https://doi.org/10.1017/psrm.2019.53


