Introduction
The German Antarctic Receiving Station O’Higgins is located very close to the Chilean Antarctic Base General Bernardo O’Higgins, on the island Isabel Riquelme at the northern tip of the Antarctic Peninsula (63.32°S, 57.90°W, Fig. 1, Fig. 2). It is jointly operated by the German Aerospace Centre (DLR) and the Federal Agency for Cartography and Geodesy (BKG) in cooperation with the Chilean Antarctic Institute (INACH).

Fig. 1. Map showing the location of Antarctic base Bernardo O’Higgins at the northern tip of the Antarctic Peninsula with other year-round (red) and seasonal (orange) stations. Screenshot from SCAR Antarctic digital database 6.0 (http://www.add.scar.org).
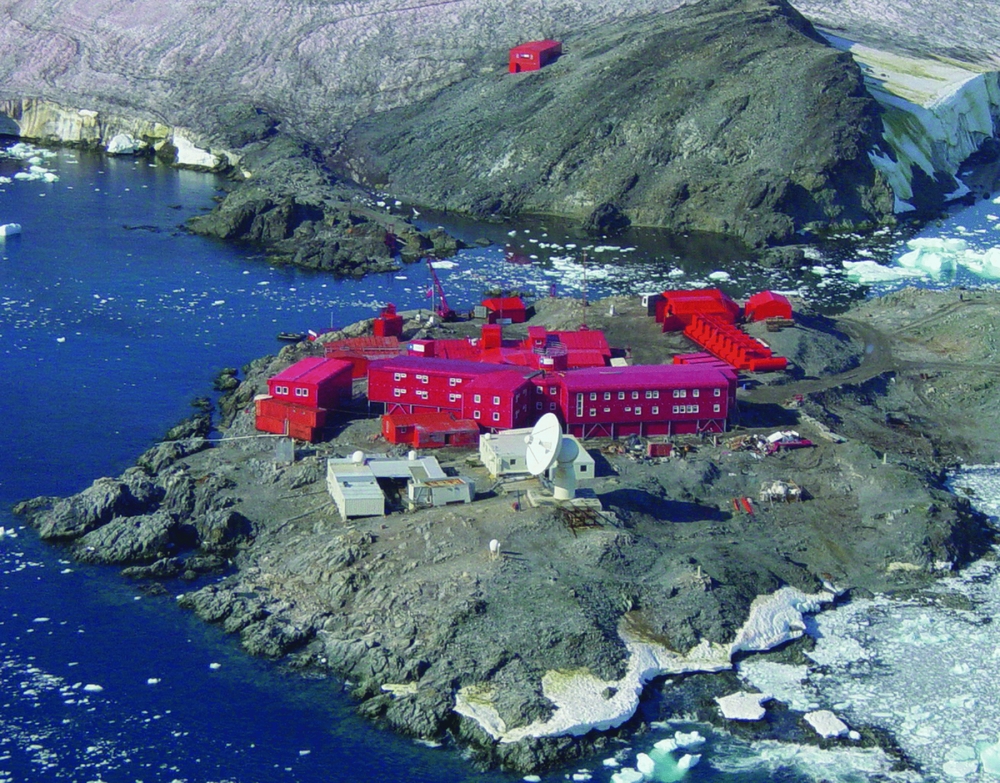
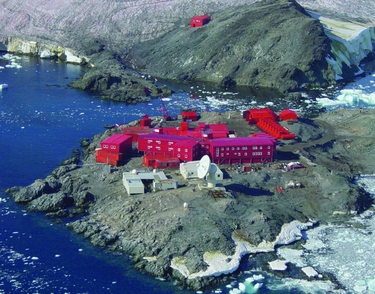
Fig. 2. Aerial view of the Antarctic base Bernardo O’Higgins with the German facilities (white buildings) in front (photo: M. Specht).
GARS O’Higgins was constructed in 1989–1991 as a dual purpose facility planned to act as satellite ground station (international station ID: OHG) for the forthcoming European Remote Sensing satellites ERS-1 and ERS-2, and as the first station on the Antarctic continent supporting Very Long Baseline Interferometry (VLBI) measurements (Schuh and Behrend Reference Schuh and Behrend2012). The station has been continuously upgraded to keep pace with technological progress. For example it was complemented by additional measurement systems like GNSS (Global Navigation Satellite System) receivers, a PRARE (Precise Range And Range Rate Equipment) system, or tide gauges. Additionally, the satellite data receiving chain was upgraded by including more sensitive and more reliable demodulators and further equipment. Today it plays an important role as a satellite ground station supporting mainly earth observation missions, and as fundamental geodetic point in Antarctica for the realisation of global reference systems and monitoring crustal motions. The geodetic VLBI experiments are usually performed during two summer campaigns, while GNSS receivers, the pressure gauge, and the meteorological station yield continuous time series and are under remote control.
From 1991 to 2010, the operation on site has been done campaign-wise during the Antarctic summer. However, the launch of the TanDEM-X satellite in 2010 and the close formation flight of the two satellites TerraSAR-X and TanDEM-X mandated additional satellite contacts as well as year-around operation of the station.
The GARS O’Higgins station is designed to work autarkical, that is it operates its own infrastructure module which includes power and freshwater supply, sewage water conditioning, and data connections as well as a year-around operation of the station. The logistic on-site support is carried out by the Chilean army. Carriage of freight and passenger traffic from Punta Arenas via King George Island to O’Higgins Island is handled by the Chilean air force or the naval forces or the Brazilian air force. The operational tasks and maintenance of the station infrastructure is contracted to a private Chilean service company (Servimet).
Contribution to earth monitoring
Satellite ground station OHG
The Satellite Ground Station O’Higgins (OHG) is part of the global ground station network of DLR's German Remote Sensing Data Centre (DFD) (Fig. 3). In addition to antenna facilities at the DFD sites in Neustrelitz and Oberpfaffenhofen in Germany, DFD is operating two near-polar ground stations within this global network, one in Inuvik in the Canadian Arctic and the other one at O’Higgins. Using these extremely high latitude stations has a major benefit: the number of stations can be kept low because they provide nearly complete daily coverage of all satellite orbits.

Fig. 3. Ground Station Network of the German Remote Sensing Data Center (DFD) of DLR. The blue circles dedicate the visibility circles of the receiving stations.
The core of OHG is a 9 m full motion tracking antenna for reception and transmission of radio-frequency signals. OHG provides receiving capacity in the S-band and X-band and transmitting capability in the S-band. For satellite systems S-band is normally used for dumping housekeeping data and commanding the satellite; also known under the acronym TT&C. High data rate dumps are not possible in the S-band since the available frequency spectrum is limited. Therefore, earth observation data is normally dumped in the X-band which allows data-rates up to 500Mbit/s per channel. It is thus essential for OHG to support X-band as well. Detailed technical specifications of the usable frequency range of OHG can be found in the instrumentation section below.
For the conversion of received radio signals from satellites to real data files a high-sensitive demodulator in combination with a recording system is required. For demodulation of the radio signals state-of-the-art software configurable demodulators are used in OHG. This is necessary to provide the flexibility to support several satellite missions and therefore several downlink transmission schemes. For recording data, so-called direct archive systems and front-end processors are in use. In OHG parallel receiving chains provide the necessary availability.
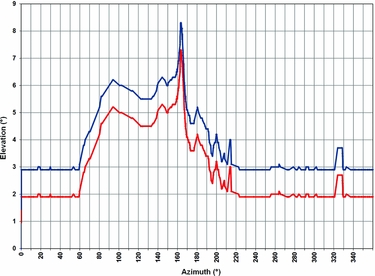
Another important parameter of a tracking antenna which can point in almost any direction in space is the elevation mask. It defines the maximum field of view by providing the minimum possible elevation look angle as a function of azimuth angle: ground obstructions like buildings or hills increase the minimum elevation angle. The antenna field of view is directly related to the maximum possible contact time to a satellite. Based on the location of OHG the elevation mask is very good as demonstrated in Fig. 4.

Fig. 4. Currently used elevation mask of the OHG antenna for S-band (red) and X-band (blue), which guarantees a good receiving quality.
For handling the different mission configurations, storage of received data as well as monitoring of all technical devices necessary for data reception is done by a Station Monitoring and Control System (SMCS) which was developed and is maintained by DLR's International Ground Segment software engineering team in Oberpaffenhofen. The SMCS is responsible for the fully automated operation of the system from antenna control, data reception to tape archiving. Furthermore, SMCS gathers comprehensive log and report information which may be accessed by both system engineers and station operators through HTML-based views.
OHG became operational in October 1991. It was operated on a campaign basis until 2010. During 28 campaigns basically in support of the ERS missions, more than 5000 passes were acquired with a station availability of more than 99%. In 2010 the TanDEM-mission required a yearlong high amount of contacts above Antarctica. Therefore, the operations schedule of OHG was changed to a 24h/7d/365d continuous operation scheme. The development of the number of contacts over the years of operations can be seen in Fig. 5. It reviews the data acquisition showing all contacts from 1991 to 2013 including payload data reception, TT&C support and Launch and Early Orbit Phase (LEOP) support. Table 1 summarises the supported missions at OHG.

Fig. 5. Data acquisition at GARS O’Higgins. Shown are all contacts from 1992 to 2013. The listed contacts include payload data reception, TT&C and LEOP support. ERS-1/-2 contacts were only during defined campaigns in the Antarctic summer time.
Table 1. Supported satellite missions at GARS O’Higgins. Abbrevations: ESA - European Space Agency, GFZ - GeoForschungsZentrum, USGS - U.S. Geological Survey, NASA - National Aeronautics and Space Administration, UTCSR - University of Texas Centre for Space Research, CSA – Canadian Space Agency, DRDC - Defence Research and Development Canada, SSC – Swedish Space Corporation.

In 2012 and 2013 more than 5000 successful contacts of the satellites TerraSAR-X and TanDEM-X were achieved. Even with the higher options load the availability could be managed to stay constant around 98–99%. This consistently high level of performance was achieved through automation (using SMCS) and redundancy and most importantly through the dedicated support from highly experienced system engineers working on site in order to ensure stable operations.
In summary, OHG is an outstanding receiving facility optimised for automated and reliable payload data reception for earth observation missions. OHG also provides satellite contingency and emergency 24h/7d TT&C-support.
The geodetic observatory O’Higgins
The geodetic observations from GARS O’Higgins are a significant contribution to global reference frames. The outstanding location in Antarctica greatly increases the coverage in the southern hemisphere and yields valuable information on the drift of the Antarctic tectonic plate and its vertical deformation.
The 9 m radio telescope deployed for VLBI is the primary geodetic instrument of the station. VLBI is the only technique that allows positioning directly related to the celestial reference frame. By measuring the time delay of microwave radiation coming from utmost distant cosmic objects (quasars), the baseline lengths between different radio telescopes spread over distances of thousands of kms can be measured with cm accuracy or even better. This allows the precise determination of station coordinates, quasar positions, or earth orientation parameters, that is, its orientation in space, polar motion and speed of rotation.
The VLBI station GARS O’Higgins is part of the global station network of the International VLBI Service for Geodesy and Astrometry (IVS; Schlüter and others Reference Schlüter, Himwich, Nothnagel, Vandenberg and Whitney2002). Within this worldwide observation framework, between 8 and 10 VLBI 24h-sessions are recorded every year. Most of these observations are actually T2 sessions and contribute to the terrestrial reference frame on a global scale, and OHIG sessions for the improvement of the southern terrestrial reference frame. Common observations are frequently performed with radio telescopes in Concepcion (Chile), Wettzell (Germany), Hartebeesthoek (South Africa), Kokee Park (Hawaii, USA) and Hobart (Australia). Since the beginning of regular measurements in 1993, a total number of 140 VLBI sessions were recorded.
Other geodetic instruments include various permanent GNSS receivers (since 1995), a pressure tide gauge (since 1995), a radar tide gauge (since 2011), and in the past a PRARE system (1996–2004). In addition absolute gravity measurements were performed in 1997 and 2011. The continuous GNSS time series over an extended period and the repeated absolute gravity measurements are of great value for the determination of crustal motions in Antarctica. Beside O’Higgins there are only 8 stations that yield continuous time series of similar length, all being part of the International GNSS Service (IGS; Dow and others Reference Dow, Neilan and Rizos2009) network and spread over the Antarctic continent. In the context of ice loss and sea level rise the vertical motions are of special interest. A GNSS antenna mounted on top of the radar gauge provides sea level data tied to the GNSS system. Absolute gravity data yield independent information on large scale mass variations and vertical motions. They also provide a data base for validating results from gravity satellite missions like GRACE and GOCE.
The geodetic reference points are linked together by a local survey network. It is build up by six survey pillars and two ground markers. Two of these pillars are currently used as monuments for continuous GNSS observations. The last ground survey was successfully executed in 2013 yielding local coordinates with an average error of 0.6 mm. During that campaign additional GNSS measurements were performed involving different pillars in an ongoing effort to transform the local coordinates into the global geocentric system. This allows a comparison between the global solutions of the space techniques (VLBI and GNSS) with the locally measured tie vector. Both tide gauges operated in O’Higgins are tied to the other geodetic reference points by levelling which allows the determination of the ellipsoidal height of the sea surface and to separate crustal uplift from sea level variations.
Instrumentation
9 m radio telescope
The 9 m radio telescope is of Cassegrain type with the sub-reflector and feed horn in axial arrangement. It is designed to meet the requirements of both operation modes, a high slew rate of 11 deg/s in azimuth and 5 deg/s in elevation for satellite tracking, and a mechanical construction that ensures a high geometric stability for geodetic VLBI. It is constructed to resist wind speeds up to 300 km/h. Table 2 presents more detailed information on the antenna system parameters.
Table 2. Antenna system parameters
For geodetic VLBI the reception of radiation from extragalactic radio sources requires a special receiving system. After entering the feed horn the radiation is separated in different conductors for the S-Band (2.1–2.4 GHz) and the X-Band (8.1–8.9 GHz). The weak signal is amplified by a 20 K helium cooled low noise preamplifier and mixed with the stable frequency of the local oscillator before it is guided to the data acquisition rack in the VLBI container. The local oscillator, the different converters, samplers, and formatters are all phase-locked to the stable 5 MHz frequency derived from a hydrogen maser. The VLBI data are recorded on hard drive disc modules on a Mark5 data recorder unit. A GPS time receiver synchronising the local time epoch to the worldwide valid UTC time scale completes the VLBI receiving and recording system.
GNSS observations
Between 1990 and 1993 the Working Group on Geodesy and Geographic Information of the Scientific Committee on Antarctic Research (SCAR) carried out several projects in order to determine a precise terrrestrial reference frame in the southern hemisphere. GPS observations were repeatedly gained in O’Higgins during specific campaigns. Coordination of the campaigns as well as evaluation and supply of databases were carried out by the Australian Surveying and Land Information Group (AUSLIG).
Since 1995 annual GPS campaigns are organised under the umbrella of SCAR. In the years 1995 and 1998 a GPS network was established and observed along the Antarctic Peninsula by a German project consortium (Dietrich and others Reference Dietrich, Dach, Engelhardt, Ihde, Korth, Kutterer, Lindner, Mayer, Menge, Miller, Müller, Niemeier, Perlt, Pohl, Salbach, Schenke, Schöne, Seeber, Veit and Völksen2001). This project mainly aimed in the improvement of the terrestrial reference frame in Antarctica and the determination of the tectonic regime in the region.
Permanent GNSS observations started in 1995 as site OHIG on pillar K5 using a Rogue SNR-8000 receiver. Due to an extension of the Chilean station, OHIG had to be replaced by site OHI2 on pillar K6 in 2002 to ensure a good visibility (see Fig. 6). Close to OHI2 the site OHI3 was established on pillar K3 in 2003. Both GNSS sites are part of the IGS network and equipped with calibrated antennas and up-to-date Javad and Leica receivers, capable of receiving both GPS and GLONASS signals. In 2009 another site named OHIX was established sharing a common antenna with OHI3. This receiver tracked Giove and Galileo satellites as well and was part of the Cooperative Network for GIOVE Observation (CONGO) network (Montenbruck and others Reference Montenbruck, Hauschild and Hessels2011). OHIX also contributed GNSS tracking data to the Multi-GNSS EXperiment (MGEX) of the IGS. It was shutdown in March 2014 since OHI2 and OHI3 now are both capable of tracking Galileo signals.

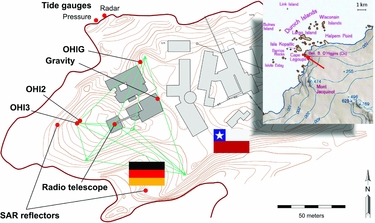
Fig. 6. Map showing the Chilean base Bernardo O’Higgins and the German Antarctic Receiving Station with locations of the geodetic instruments. Local survey network is shown in green. Inset shows surrounding of the station.
The unique capabilities of the GNSS sites include (1) the continuity of observations, (2) the high sampling rate (30 s or real-time stream), (3) the instantaneous availability of data, and (4) the co-location with the radio telescope and tide gauges. GNSS observations and products are available for example at the GNSS data centre at BKG (http://igs.bkg.bund.de/).
Tide gauges
Sea level measurements in O’Higgins started in February 1995 using an underwater tide gauge system from Aanderaa. The height of the water column above the sensor is computed from the water pressure, temperature, and salinity. However, a continuous time series, allowing the determination of an apparent sea level change, is not available, since floating ice shifted or destroyed the installation several times. Unfortunately, each sensor replacement changes the zero point and hence interrupts the time series.
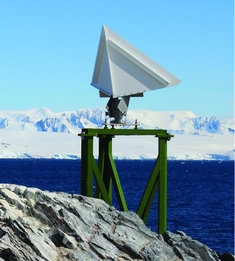
Since February 2011 a multi-parameter tide gauge from hs-engineers is supplemented by a radar tide gauge system installed above water level (Fig. 7). A GNSS antenna mounted on top of the radar gauge connects the measured distance to the sea surface to an external reference allowing the distinction between crustal motions and true sea level changes and the calibration of the continuous recording underwater tide gauge sensor. Thus radar gauge and GNSS replace the time-consuming levelling. The combination of sea level measurements from two different and independent sensor systems additionally improves the error estimation. Although this installation can be operated only campaign-wise, the well-defined reference allows the determination of long term trends.

Fig. 7. Installation of the radar gauge system. Inset shows detail with GNSS antenna on top and radar waveguide below.
While the pressure gauge provides integrated water level measurement over one hour, the radar gauge measures the distance to the water every 5 seconds that the time series are influenced by the water waves. A comparison of the 600 s low pass filtered radar data with the pressure gauge data from the first observation period (21 February–31 March 2011) shows an agreement within 1 cm. The height stability of the GNSS antenna is in the order of a few mms with respect to the GNSS reference stations OHI2 and OHI3.
Corner reflectors
Corner reflectors are used in the geometric and radiometric calibration and verification of Synthetic Aperture Radar (SAR) sensors as their expected position in a focused SAR image and their expected radar cross section are well-defined through the knowledge of the geodetic position of their phase centre (which coincides with the inner corner of the reflector) and their edge length, respectively.
The measurement of the unprecedented localisation accuracy of the German TerraSAR-X satellites TSX-1 and TDX-1, which is at the centimetre level, imposes high demands on the knowledge of a corner reflector's ground position. In order to satisfy these requirements, a test site in the vicinity of an IGS reference station, as it is the case at GARS O’Higgins, allows the position on ground to be measured precisely (< 5 mm) relative to the reference station's coordinates obtained by terrestrial geodetic survey.
In March 2013, two trihedral 0.7 m corner reflectors were installed at GARS O’Higgins (Fig. 8) within the framework of the HGF Munich Aerospace project ‘Hochauflösende geodätische Erdbeobachtung’ (high resolution geodetic earth observation). These corner reflectors are part of a network of far-distributed test sites, the other ones are in Wettzell, Germany and in Metsähovi, Finland, whose objective is to evaluate the localisation accuracy of the TerraSAR-X mission and to verify the world-wide reproducibility of the obtained measurement results. Thus, the far southern GARS O’Higgins test site plays a key role within the project because of its far distance to the other test sites situated in the northern hemisphere.

Fig. 8. Corner reflector at GARS O’Higgins for the ascending satellite orbit.
As the stringent accuracy requirements of the project do not allow any change in the ground position of the corner reflectors’ phase centre, the orientation of the corner reflectors is fixed. One reflector at GARS O’Higgins is oriented for an ascending TerraSAR-X orbit where the satellite sees the reflector under an incidence angle of about 38°, the other reflector is oriented for a descending orbit where the incidence angle amounts about 35°. However, the spatially fixed corner reflectors are also visible from immediately neighboring orbit tracks of the same orbit direction even if the radar cross section is slightly reduced here because of the moderately changed incidence angle and orbit orientation. In this way, the GARS O’Higgins corner reflectors were regularly imaged by TerraSAR-X from 3 ascending (30°, 38°, and 45° incidence angle) and 2 descending orbits (35° and 42° incidence angle), respectively. The data-take acquisition started on 27 March 2013.
Meteorological station
An automated meteorological station type Thies DL 16 providing air pressure, temperature, humidity, and wind data is operated throughout the entire year. The meteo data are supplemental information needed for VLBI, GNSS, and sea level observations, and the wind data are especially required for safety reasons during stormy conditions. Data are available since 1995. Sensor malfunction or data gaps occasionally occur due to the harsh environmental conditions. Salt crusts on the sensor surfaces coming from sea water spray drastically reduce the sensor lifetime. For measuring wind speed and wind direction an ultrasonic sensor with heated electrodes is used rather than an anemometer, which cannot cope with the extreme wind speeds.
Important outcomes
Impact on terrestrial reference frame and earth rotation parameters
The current global geodetic VLBI network was established in the early 1980's and has operated most satisfactorily ever since. The O’Higgins station plays an important role within this network due to its location. The first geodetic VLBI session with O‘Higgins was carried out on 25 January 1993, and since then a total number of 58 radio sources has been observed at O‘Higgins (1993–2010). The declination distribution of observed radio sources is from −80° to 20°.
A Terrestrial Reference Frame (TRF) is a realisation of a Terrestrial Reference System (TRS) allocating a set of coordinates to a set of physical points (for example geodetic markers). The recent VLBI TRF (VTRF2008) is an IVS combined solution computed from normal equation systems provided by seven IVS analysis centres including data from 1979.7 to 2009.0 (Böckmann and others Reference Böckmann, Artz and Nothnagel2010). Here we derived station coordinates of O‘Higgins using the Vienna VLBI Software (VieVS; Böhm and others Reference Böhm, Böhm, Nilsson, Pany, Plank, Spicakova, Teke, Schuh, Kenyon, Pacino and Marti2012) and including all suitable VLBI sessions from 1993 to 2010. Fig. 9 shows O’Higgins position estimates of the Vienna solution using VieVS and formal uncertainties. The average uncertainties of the globally adjusted positions are ±2.84 cm, ±0.96 cm, and ±0.87 cm in radial (R), east (E), and north (N) components. The resulting velocities are 5.6 mm/year, 15.5 mm/year, and 9.0 mm/year, respectively.

Fig. 9. O‘Higgins position estimates of the Vienna solution using VieVS and formal uncertainties.
Next, the impact of station O’Higgins on the accuracy of the geodetic parameters is investigated in Monte Carlo simulations using VieVS (Pany and others Reference Pany, Böhm, MacMillan, Schuh, Nilsson and Wresnik2011). Starting with the original IVS network of session T2074, the idea is to generate two other schedules with slightly different networks. In sub-network 2, station O’Higgins is excluded. In sub-network 3, observations from another station at low-latitude (Fortaleza) are added to the existing schedule of sub-network 2 instead of O’Higgins. The schedules have been determined with the scheduling tool in VieVS (Sun and others Reference Sun, Böhm, Nilsson, Krásná, Böhm and Schuh2014). The network is plotted in Fig. 10. The station index increases with its latitude. (O'Higgins = 1).

Fig. 10. Network used for the simulations. Blue dot denotes station O’Higgins, black dot station Fortaleza.
Simulations are carried out for the three schedules, and the same simulation values (for example for tropospheric turbulence; compare Pany and others Reference Pany, Böhm, MacMillan, Schuh, Nilsson and Wresnik2011) are chosen to determine comparability. The parameters include the station-dependent refractive index structure constant Cn (Nilsson and others 2010), the effective height of the wet troposphere H (2000 m), and the wind velocity vector v (8.0 m/s) towards east. The stochastic variations of station clocks are computed with a power spectral density corresponding to an Allan Standard Deviation (ASD) of 10−14 within an integration time of 50 min. A white noise of 10 ps per baseline observation is added, according to the specifications of the future VLBI2010 technology (see below). Finally, the Earth Rotation Parameters (ERP), that is polar motion (Xp, Yp) and UT1-UTC, and station position repeatabilities are determined. This can be done because the simulation process is repeated 25 times to obtain a sample of output parameters that can be analysed statistically. For the estimation of EOP session-by-session, we estimate a common terrestrial reference frame by stacking all sessions. The repeatabilities and standard deviations of the ERP are provided. The station position repeatabilities are also compared in Table 3.
Table 3. Results from three different networks showing the impact of the network geometry on the estimation of the earth rotation parameters (ERP) and station positions.

The simulations show that the precision of geodetic parameters (in particular Xp) is degraded between 5.3% and 18.1% if the O’Higgins station is removed from the network. If O’Higgins is replaced by another station, this is partly compensated, depending on the station distribution, number of observations, and observation distributions.
In 2003, the IVS initiated a working group to study the requirements of a next generation geodetic VLBI system, called VLBI2010. The goals of the new system are to achieve (on global scales) 1-mm position accuracy over a 24 hour observing session, 0.1-mm/yr velocity accuracy, continuous observations, and delivery of initial results within 24 hours after completion of data acquisition. The challenging nature of these goals requires a completely new technical, operational, and analytical design of VLBI measurements. Based on extensive simulation studies, strategies have been developed to improve IVS product accuracy through the use of a network of small (~12 m) fast-slewing antennas, a new method for generating high precision delay measurements, and a more homogeneous network distribution with emphasis on establishing new sites in the southern hemisphere (Petrachenko and others Reference Petrachenko, Niell, Behrend, Corey, Boehm, Charlot, Collioud, Gipson, Haas, Hobiger, Koyama, MacMillan, Malkin, Nilsson, Pany, Tuccari, Whitney and Wresnik2009). With slewing times that satisfy and/or exceed the VLBI2010 requirements the O’Higgins station is well positioned to maintain its important role in a new global VLBI2010 network if the receiving system is upgraded according to the VLBI2010 specifications.
Crustal motions on the Antarctic Peninsula
Today the observation of temporal gravity variations from space is an important tool for the estimation of recent ice losses in polar regions. However, the obtained ice rates may be biased by vertical crustal motions contributing to the total mass rate. There are two basic approaches to estimate the present day uplift rates. First the use of glacial isostatic adjustment (GIA) models basing on ice load histories and rheological properties of crust and mantle (for example Peltier Reference Peltier2004; Ivins and others Reference Ivins, James, Wahr, Schrama, Landerer and Simon2013), or, second, the measurement of vertical motions using geodetic techniques (for example Bevis and others Reference Bevis, Kendrick, Smalley, Dalziel, Caccamise, Sasgen, Helsen, Taylor, Zhou, Brown, Raleigh, Willis, Wilson and Konfal2009; Thomas and others Reference Thomas, King, Bentley, Whitehouse, Penna, Williams, Riva, Lavallee, Clarke, King, Hindmarsh and Koivula2011). While the different GIA models show major differences due to high uncertainties in ice history and geomechanical parameters, the geodetic observations are limited to a small number of sites and short time spans in many cases. In order to constrain the GIA models, which are required to obtain a complete coverage of uplift data and to understand the processes behind, long GNSS time series allowing a reliable estimation of crustal uplift rates are of great value.
At GARS O’Higgins more than 18 years of continuous GNSS data and 20 years of campaign style VLBI data are available. In the GNSS solutions the height component shows considerable variations in the order of some centimetres, mostly due to snow and ice coverage of the antenna, and annual drifts, underlining the importance of long time series. Both currently operating GNSS sites being only 3 m apart yield average uplift rates of 5 mm/y (Fig. 11). The no longer active site OHIG yields a slightly smaller average of 4.7 mm/y between 1996 and 2002. However, no uplift seems to be present before 1998.
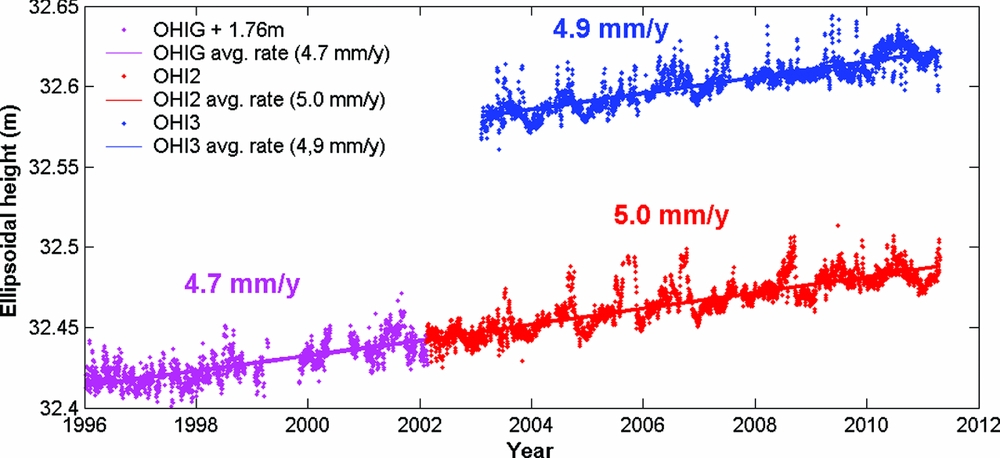
Fig. 11. Height variations of different GNSS sites in O‘Higgins based on three-day solutions from the first reprocessing campaign of the Centre for Orbit Determination in Europe (CODE). The geodetic datum is defined by no-net-rotation and -translation conditions w.r.t. IGS08.
The increase of the uplift rate is more pronounced at Palmer Station, where the uplift abruptly started in 2003. This is interpreted as an elastic rebound due to ice mass losses as consequence of the breakup of Larsen B Ice Shelf in 2002 (Thomas and others Reference Thomas, King, Bentley, Whitehouse, Penna, Williams, Riva, Lavallee, Clarke, King, Hindmarsh and Koivula2011). A similar process could be responsible for the uplift at O’Higgins station first documented in 1998. The ice shelf of the Prince Gustav Channel, located roughly 50 kilometres to the south of O’Higgins at the eastern slope of the Antarctic Peninsula, disintegrated in 1995 and completely disappeared by March 1997 (Rott and others Reference Rott, Rack, Nagler and Skvarca1998).
VLBI yields slightly smaller uplift rates. The station velocities of the VTRF2008, a VLBI-only realisation of the terrestrial reference frame, translate into an uplift rate of 4.2 mm/y.
Gravity measurement is another useful geodetic technique for determining vertical displacements. In December 1997 and January 2011 the absolute gravity value on a pillar at O’Higgins station (see Fig. 6) was measured using the same FG5 absolute gravimeter. The instrumental reference of this instrument with the serial number 101 has been confirmed at the International Absolute Gravimeter Comparisons at BIPM (Jiang and others Reference Jiang, Palinkas, Arias, Liard, Merlet, Wilmes, Vitushkin, Robertsson, Tisserand, Pereira Dos Santos, Bodart, Falk, Baumann, Mizushima, Mäkinen, Bilker-Koivula, Lee, Choi, Karaboce, Ji, Wu, Ruess, Ullrich, Kostelecky, Schmerge, Eckl, Timmen, Le Moigne, Bayer, Olszak, Agren, Del, Greco, Diament, Deroussi, Bonvalot, Krynski, Sekowski, Hu, Wang, Svitlov, Germak, Francis, Becker, Inglis and Robinson2012) and by measurements at the German gravimetric reference station Bad Homburg before and after the Antarctic campaigns. The gravity value decreased significantly by 16.7 ± 3 μGal within thirteen years (Fig. 12).

Fig. 12. The mean absolute gravity in O’Higgins shows a significant decrease between the campaigns in 1997 and 2011.
When assuming a ratio of gravity to height changes of - 0.2 μGal/mm, which is a typical value for recent postglacial rebound processes in Fennoscandia (Ekman and Mäkinen Reference Ekman and Mäkinen1996), this gravity difference would correspond to an uplift of 70–95 mm and accordingly to an uplift rate of 5–7 mm/year. This only holds true if no local or regional mass variation affects the gravity at this site. However, variations in Newtonian attraction by mass losses as observed by glacier retreat on the Antarctic Peninsula will also change the measured gravity difference. Still, this measuring result will be an important quantity to verify the models of mass transport and re-distribution of masses in the Antarctic region and to study the change of the mean sea level.
Sea level observations
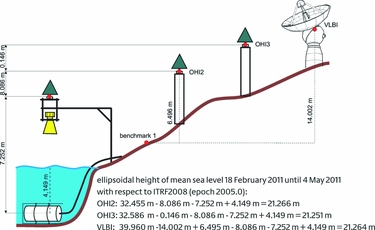
At O’Higgins the local ties between the tide gauges and the reference points of the geodetic space techniques allow the determination of the ellipsoidal height of the mean sea level. Using the height solutions of the GNSS stations OHI2 and OHI3 and the VLBI antenna of the 2011 campaign, the resulting mean sea level varies between 21.251 and 21.266 m above the ellipsoid (Fig. 13), which is considered a good agreement between the different techniques. It should be noted that the local ties were introduced as additional observations for reference system realizations like the ITRF2008.

Fig. 13. Height relations between different benchmarks and resulting ellipsoidal height of the mean sea level
After the magnitude 9.0 earthquake in Japan on 11 March 2011, 05:46 UTC the radar gauge recorded additional non-tidal wave structures. These sea level variations started on 12 March 2011 at 06:30 UTC and reached maximum amplitudes of ±10 cm (Fig. 14). This obviously marked the arrival of the tsunami wave coming from offshore Japan after a travel time of 24 hours and 44 minutes. The recorded waves showed a complex pattern and took roughly 4 days to die down to the normal level. A spectral analysis showed significant signal components around a period of 55 minutes and some weaker components around 45 and 30 minutes. The repeated emergence of waves is interpreted as multiple reflections within the complex geometry of the Bransfield Strait.

Fig. 14. Tide record of the radar gauge after the earthquake in Japan on 11 March 2011. Dashed line indicates arrival time of tsunami wave.
The unique role of O’Higgins in high resolution studies of active galaxies
The O’Higgins telescope is playing a unique role in expanding the frontiers of our knowledge about some of the most mysterious objects in the universe, active galactic nuclei (AGN). Apart from their intrinsic interest, the International Celestial Reference Frame (ICRF; Ma and others Reference Ma, Arias, Eubanks, Fey, Gontier, Jacobs, Sovers, Archinal and Charlot1998) is defined by AGN and maintenance of the ICRF requires monitoring of the morphology of these AGN in order to ensure their continuing suitability. While AGN have been studied for half a century and a considerable amount has been learned about them, many of their most basic physics and energetics is not well understood. As AGN vary copiously at every wave-band, understanding their physics requires quasi-simultaneous observations across the electromagnetic spectrum.
The launch of the Fermi Gamma-ray Space Telescope (Atwood and others Reference Atwood2009) in June 2008 opened a window of opportunity (observation time should be of the order of 5-10 years) to study the high energy (~100 MeV-100 GeV) radiation from AGN. There is very little known about AGN's and their energy budget. This is particularly important for the most variable subset of AGN, namely blazars, which are the most common identified point sources of gamma-ray emission. Furthermore, a number of space and ground based facilities - from radio, submillimeter, optical, NIR, X-ray and TeV wave-bands - have become available to provide the near simultaneous broadband observations. This is an unprecedented opportunity to advance significantly our knowledge (Ojha Reference Ojha2012).
VLBI observations have a very special role in these studies as they are the only way to measure directly parsec scale changes in AGN. These measurements of parameters such as jet speed and Doppler factor are essential inputs to models of AGN physics. In addition, VLBI observations are the only way to associate changes in parsec scale morphology and flux with changes in other wavebands thereby constraining the location and extent of the region from which the high energy radiation originates. This, in turn, constrains the emission process that gives rise to this radiation. Thus there are a number of VLBI observing programmes in existence but almost all of them are restricted to northern hemisphere objects. This is a problem as it is difficult to observe a large fraction of AGN which matters for studying their properties and also for the efficacy of the ICRF (Ojha and others Reference Ojha, Fey, Charlot, Jauncey, Johnston, Reynolds, Tzioumis, Quick, Nicolson, Ellingsen, McCulloch and Koyama2005, Reference Ojha, Fey, Charlot, Johnston, Jauncey, Reynolds, Tzioumis, Lovell, Quick, Nicolson, Ellingsen, McCulloch, Koyama, Tregoning and Rizos2007). Furthermore, some of the most interesting study objects lie in the southern hemisphere for example the centre of our galaxy and the closest AGN, Centaurus A.
The TANAMI (Tracking AGN with Austral Milliarcsecond Interferometry; Ojha and others Reference Ojha, Kadler, Böck, Booth, Dutka, Edwards, Fey, Fuhrmann, Gaume, Hase, Horiuchi, Jauncey, Johnston, Katz, Lister, Lovell, Müller, Plötz, Quick, Ros, Taylor, Thompson, Tingay, Tosti, Tzioumis, Wilms and Zensus2010) programme monitors AGN south of –30° declination at parsec scale resolution using the telescopes of the Australian Long Baseline Array (LBA) and associated telescopes. Because of its location, the O’Higgins telescope provides information that is not available with any other telescope (see Fig 15). Thus it plays an essential role in greatly improving the resolution and quality of images and thereby the usefulness of the science generated by such observations. Fig. 16 demonstrates the spectacular improvement in the image resolution due to the inclusion of O’Higgins data. To sum up, a better image at a higher resolution translates into better science. A good example is the TANAMI image of the nearest radio galaxy Centaurus A (Müller and others Reference Müller, Kadler, Ojha, Wilms, Böck, Edwards, Fromm, Hase, Horiuchi, Katz, Lovell, Plötz, Pursimo, Richers, Ros, Rothschild, Taylor, Tingay and Zensus2011), which is the highest resolution image ever made of an AGN. As discussed in Müller and others (Reference Müller, Kadler, Ojha, Wilms, Böck, Edwards, Fromm, Hase, Horiuchi, Katz, Lovell, Plötz, Pursimo, Richers, Ros, Rothschild, Taylor, Tingay and Zensus2011), this image shows the jet already collimated very close to the central engine and also suggests (in combination with an image at 22 GHz) that there may be multiple possible sites from where the high energy emission could originate. Sub-parsec scale analyses of this kind are made possible by observations from telescopes like O’Higgins.

Fig. 15. Typical uv-coverage for an observation of a TANAMI source (in this case an observation of PKS 0625–354, see Fig. 16). The uv-plane is a representation of how well the interferometer is able to sample information about the target source. It takes into account the location and orientation of each baseline and how both change due to the earth's rotation during the course of the observations. In this figure the inner dots are the baselines provided by the Australian antennas while all of the outer dots are contributed by baselines to O’Higgins. The powerful impact of including O’Higgins is immediately obvious.

Fig. 16. TANAMI image of PKS 0625–35 without (left) and with O’Higgins data (right) (from Trüstedt Reference Trüstedt2013).
The images from the TANAMI programme will also be used to advance our knowledge of the morphology of southern hemisphere ICRF sources. This will go some way to addressing the relative lack of information on sources south of −30° declination that the ICRF suffers from (Fey and others Reference Fey, Gordon and Jacobs2009). From both astrometry and astronomy perspectives, O’Higgins is playing a vital role through its participation in TANAMI observations. It is envisaged that this ‘excellence in research’ will be maintained as the station accepts new challenges and responsibilities.
O’Higgins corner reflectors and the unprecedented pixel localisation accuracy of German SAR satellites
Several studies (for example Schubert and others Reference Schubert, Small, Jehle and Meier2012; Balss and others Reference Balss, Cong, Brcic, Rexer, Minet and Breit2013b) showed the unprecedented localisation accuracy of the German TerraSAR-X radar satellites TSX-1 and TDX-1 which is currently at the cm level. This accuracy results from precise orbit determination and, in SAR processing, from the avoidance of several processor approximations. However, as these aspects solely refer to the generation of SAR products, the image user does not need to care about them. In contrast, when a discerning user is aiming at the cm level, he has to correct his measurements thoroughly for all signal propagation delays and for geodynamic effects like tides, loadings and plate movements. As these effects are likewise relevant for GNSS, the products of the IGS (Meindl and others Reference Meindl, Dach and Jean2012) provide a primary data source for correction values for the signal propagation delay (Gisinger Reference Gisinger2012) while the correction values for the geodynamic effects are based on the International Earth Rotation and Reference Systems Service (IERS) conventions (Petit and Luzum Reference Petit and Luzum2010).
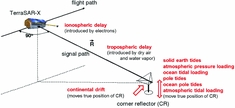
Radar systems indirectly measure geometric distances by means of the two-way travel time of radar pulses from the radar transmitter to ground and back to the radar receiver (see Fig. 17). Usually, the conversion from travel time to geometric distance refers to the vacuum velocity of light. However, electrons in the ionosphere, dry air and water vapour in the troposphere introduce additional signal delays which have to be taken into account (Eineder and others Reference Eineder, Minet, Steigenberger, Cong and Fritz2011; Cong and others Reference Cong, Balss, Eineder and Fritz2012). While the amount of the tropospheric delay in TerraSAR-X range measurements lies between 2.5 and 4 m, the ionospheric delay amounts several cms up to a few dms. Moreover, geodynamic effects shift the true position of a ground target. The most prominent effects are solid earth tides and continental drift. While the former causes a shift up to a few dms over the course of a day, the latter continuously increases over years. The load of atmospheric pressure and ocean tides weigh on the tectonic plate and their variation shifts the target position by several mms up to some cms each. Pole tides are due to the precession of the axis of the earth. Their amount varies also at the mm level. Even weaker effects are caused by ocean pole tides and atmospheric tidal loading.

Fig. 17. Influence of signal propagation delays and geodynamic effects on the pixel localisation SAR
In order to verify the pixel localisation accuracy of a SAR system, the range and azimuth times of corner reflectors in the focused SAR images corrected for the estimated signal propagation delays and geodynamic effects are compared with the expected values obtained from precise on-ground measurements of their positions. The conversion of the spatial geodetic coordinates into expected radar time coordinates, that is azimuth and range, is based on the zero-Doppler equation (Cumming and Wong Reference Cumming and Wong2005: 114–129), and the interpolation of the satellite's position.
Within the framework of the HGF Munich Aerospace project ‘Hochauflösende geodätische Erdbeobachtung’ (High Resolution Geodetic Earth Observation), the localisation accuracy of TSX-1 and TDX-1 was initially evaluated on the base of a corner reflector with very precisely (<5 mm) known ground position at Wettzell, Germany. These measurements revealed a pixel localisation accuracy (1 σ) for both satellites of 15 mms in azimuth and 12 mms in range. The world-wide reproducibility of the results obtained to date shall be verified in on-going investigations on the base of a network of far-distributed test sites including the GARS O’Higgins corner reflectors. As at 14 November 2013, 64 data-takes of this test site were acquired, and the data-take acquisition still proceeds.
The ground-based measurement of the geodetic reference coordinates for the corner reflectors is scheduled to coincide with the renewal of the ties at the local IGS reference station (beginning of 2014). The first analyses of the GARS O’Higgins measurement series currently refer to an intermediate work-around. Based on a subset of the hitherto acquired SAR data-takes, preliminary corner reflector coordinates were determined by stereo SAR following the procedure described in Balss and others (Reference Balss, Gisinger, Cong, Eineder and Brcic2013a) and Gisinger and others (Reference Gisinger, Balss, Pail, Zhu, Montazeri, Gernhardt and Eineder2014). Even if this approach provides no information on the absolute bias between the Wettzell and the GARS O’Higgins measurement series since in GARS O’Higgins the SAR measured corner reflector positions are taken for both coordinate determination and verification, one already gets evidence on the spread of the measurement results. The distribution of the position offset between measured and expected corner reflector positions at GARS O’Higgins is plotted in Fig. 18. On the basis of this preliminary analysis, the obtained standard deviation amounts 22 mms in azimuth and 16 mms in range, determined with data-takes from both satellites and for all acquisition geometries.

Fig. 18. Preliminary results for the difference between SAR coordinates computed in this work and those determined by stereo SAR of the corner reflectors at the GARS O’Higgins test site in radar geometry.
SAR missions: ERS
Since 1991 much earth observation data from European and German satellite missions has been received using OHG. Data of the European Remote Sensing Satellites ERS-1 and ERS-2 provide valuable insights into the changes of the Antarctic ice shield over the past 22 years. Therefore, the operation of OHG contributed to a better understanding of changes in the Antarctic ice shelf dynamics, the collapse of the ice shelves at the Antarctic Peninsula, the ice loss in Western Antarctica, the position of the margins between the continental ice sheet and floating ice shelves and last but not least the Antarctic ozone hole.
The changing amount of contacts from year to year (see Fig. 5) is caused by restrictions related to the limited campaigns during the Antarctic summer period. Due to the failure of the on-board tape recorder in middle of 2003, ERS-2 could only be operated thereafter in pass-through mode. Consequently, there were no on-board storage capacities available and the instrument data had to be downloaded directly to the ground. Back then, data could have only been acquired for regions within the visibility circles of an available ground station. For the purpose of monitoring the Antarctic ice sheet, ice shelves and glaciers OHG collected a maximum amount of possible data from ERS. This resulted in an increased number of contacts during the summer campaigns in 2003–2004 and the following years.
Other receiving activities supported by OHG included the ‘ERS-2 Ice Phase’ in 2011. This mission explains the higher number of contacts in 2011 (Fig. 5). With the help of OHG the revisit cycle for ERS-2 was reduced from 35 days to 3 days.
TerraSAR-X background mission Antarctica
Motivated by the 2007–2008 International Polar Year (IPY) and the support from the IPY ‘Space Task Group Synthetic Aperture Radar (SAR)’, the GARS O’Higgins station was intensely utilised for dedicated, additional TerraSAR-X acquisitions in order to map specific areas of Antarctica and to better achieve the IPY goals. The so-called TerraSAR-X Background Mission Antarctica was initiated by the Alfred-Wegener-Institute, the University of Erlangen and the German Aerospace Centre.
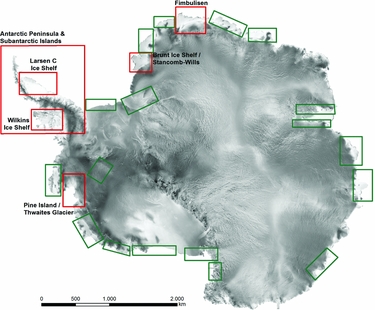
The mission goals for the areas of interest with regard to Antarctic ice shelves are the detection of fine scaled ice shelf structures, the mapping of deformation patterns and ice shelf velocities and the improvement of our understanding of ice mechanics and physics. The identification of changes in ice shelf dynamics and the classification of the underlying causes necessarily are prerequisite activities in order to evaluate and verify empirical flow laws, which allow improving the ability to identify critical parameters and predictions of ice shelf stability. The selected ice shelves are the Wilkins Ice Shelf, Fimbulisen, Brunt Ice Shelf / Stancomb-Wills Ice Tongue System, Larsen-C, Pine Island, and Thwaites Glacier (see Fig. 19).

Fig. 19. Areas of focus of the TerraSAR-X Back Ground Mission Antarctica (green) and the coverage up to May 2010 (red). Background image: (c) USGS mosaic.
Furthermore the Antarctic Peninsula and sub-Antarctic islands are mapped with the goals of improving current estimates of sea level rise as well as gaining a better understanding of the glacier systems. The resulting activities and products cover the temporal variability of ice dynamics, changes in glacier extent and terminal position, detection of surface structures and melt patterns on glaciers, as well as mapping of snow cover extent and dynamics on ice free areas. An extraordinary warming trend has been observed in the region since the 1950's until recent years and considerable changes in the glacial systems have been reported including the break-up and disintegration of ice shelves with subsequent speed-up, surface lowering and sea level contribution of tributary glaciers. Furthermore, tidewater glaciers show considerable retreat, surface lowering as well as respective dynamic adjustments.
Postulated consequences of this warming require frequent and high-resolution monitoring to allow a quantification of the underlying processes. The target areas are South Georgia/South Orkney Islands, King George Island, major outlet glaciers on the west coast of the Antarctic Peninsula, tributaries of already disintegrated ice shelves (Larsen-A, Larsen-B and Wordie), tributaries of Wilkins and George VI ice shelves, and tributaries of Larsen-C/D ice shelf and selected areas on the east coast of the Antarctic Peninsula (see Fig. 19).
During the austral summers 2008–2009 and 2009–2010 major parts of the proposed study areas were mapped with DLR's satellite TerraSAR-X in StripMap mode (resolution 3 m). Additional systematic acquisition has been done during the Wilkins Ice Shelf break-ups in 2008 and 2009 and subsequent monitoring is currently accomplished by TerraSAR-X StripMap mode imagery (Humbert and Braun Reference Humbert and Braun2008; Braun and Humbert Reference Braun and Humbert2009; Braun and others Reference Braun, Humbert and Moll2009; Humbert and others Reference Humbert, Gross, Müller, Braun, van de Wal, van den Broeke, Vaughan and van de Berg2010). For King George Island specific 11-day repeat time series have been acquired from spring to autumn in 2010–2011 and 2011–2012. Similar requests have been placed for 2013–2014. Specific repeat acquisition campaigns have also been carried out for Larsen-C/D tributaries. Tributary glaciers of Larsen-A/B had been covered with time series and are currently implemented in the TanDEM-X super test sites with at least monthly acquisitions. The mapping has been enabled by DLR, which provided additional downlink capacity at GARS O’Higgins. Within the next few years the TerraSAR-X Background Mission Antarctica will be continued depending on the degree of capacity utilisation of GARS O’Higgins, mainly because of TanDEM-X acquisitions. The data form the basis for several science projects in the region covering topics like estimation of fresh water contributions from glaciers and ice caps, improved ice mass contribution to sea level rise or ice dynamics and fracture mechanics of ice shelves.
TanDEM-X mission
The objective of the German satellite mission TanDEM-X is the generation of a high-precision, 3-dimensional global digital elevation model of the earth's surface in uniform quality. Therefore, the TanDEM-X mission is based on two almost identical earth observation satellites: TerraSAR-X and TanDEM-X. Both satellites fly in close formation at 514 kms altitude. The distance between them is slight and variable, sometimes even less than 200 m. The two satellites record in a synchronised mode the land surface with two radar systems, and thus enable simultaneous acquisitions from different angles. This leads to precise elevation information with a horizontal grid of 12 × 12 m and a vertical resolution of better than 2 m in relative view and better than 10 m in absolute view (Metzig and others Reference Metzig, Zink, Krieger, Younis, Fiedler, Steinbrecher, Schulze, Mittermayer, Werner and Moreira2008).
An unprecedented data base for many scientific issues is also made available for the Antarctic. In 2013 the inner parts of the Antarctic continent including the South Pole were recorded using the so-called left-looking mode. At the 9th European Conference on Synthetic Aperture Radar (EUSAR) in 2012 the TanDEM-X Mission received a ‘Certificate of Recognition of TanDEM-X Achievements and Impact’.
The radar instruments on the satellites TerraSAR-X and TanDEM-X, which are both contributing to the TanDEM-X mission, are providing much data. However, storage capacity on the spacecraft is limited and frequent downlink capability is a mandatory requirement. For polar orbiting satellites (for example TerraSAR-X and TanDEM-X) this capability can be provided by satellite receiving stations located in polar regions. Polar stations come with the advantage to provide approximately 15 contacts a day to the polar orbiting spacecraft depending on their location. This is much more than for stations in mid-latitude region. Therefore, OHG perfectly matches the requirements of the TanDEM-X mission by providing a huge amount of downlink capacity.
GRACE mission
The participation of OHG became an essential condition for the continuation of the Gravity Recovery and Climate Experiment (GRACE)-mission. OHG supported GRACE1 and GRACE2 by providing commanding capability as well as possibilities for additional housekeeping data downlinks. In particular, during several emergency situations of the two satellites, the year-around 24h/7d availability of OHG has proved to be essential for the mission. Without the quick reaction of the OHG team, ‘loss of mission’ would have been likely.
The scientific relevance of the continuation of the GRACE-mission is demonstrated for example by Ivins and others (Reference Ivins, Watkins, Yuan, Dietrich, Casassa and Rülke2011) who investigated GRACE data combined with bedrock uplift derived from GPS data to quantify the on-land ice loss during 2003 and 2009 and to simultaneously solve for ice loss and for solid earth glacial isostatic adjustment (GIA) at the Drake Passage.
Conclusions and outlook
Since the beginning of operation in 1991 OHG has provided an overwhelming amount of downlink capacity for earth observation missions. The polar location of OHG and the elevation mask of the antenna system make the station highly attractive for polar orbiting satellite missions for dumping payload data as well as for providing telecommand and telecontrol services. With the uninterrupted operational 24h/7d service available since 2010, the station's services are now recognised as a most valuable asset and an essential resource for numerous missions.
Being located on the Antarctic continent considerably improves the geometry of the international VLBI network, which stabilises terrestrial reference frames and improves the determination of the earth orientation parameters. Both are important products of the services of the International Association of Geodesy.
The southern position of the O’Higgins radio telescope is of great value for astronomic and astrometric purposes. For the observation of active galactic nuclei (AGN) the resolution is significantly improved when O’Higgins is integrated in the complex network-observation chain. As AGNs define the celestial reference frame ICRF, the high resolution monitoring of their structure is required to ensure the long term stability of the ICRF.
The corner reflector measurements at GARS O’Higgins demonstrate the value of synergistic effects between the different local scientific instruments. Because of this advantage and of its far distance to other test sites, GARS O’Higgins can provide a valuable contribution for the verification of the world-wide reproducibility of measurement results (in the present case, the pixel localisation accuracy) in space-borne earth observation.
20 years of VLBI operation, 18 years of continuous GNSS observations and two absolute gravity measurements allow statements of crustal motions of the northern Antarctic Peninsula. The relation between recent ice mass losses, as documented by satellite imagery, satellite altimetry and satellite gravimetry, and elastic rebound processes can be studied using precise geodetic ground observations. The identification of recent load variations and related crustal motions is an important boundary condition for the modelling of glacial isostatic adjustment processes, which is the result of the load and climate history.
The operation of GARS O’Higgins and the successful cooperation between DLR and BKG will be continued in future. New satellite missions and new value added services that require real time acquisition and processing of data on-site underline the need of O’Higgins as an important facility for satellite data receiving and telecommanding. The geodetic use of the radio telescope is planned to be intensified. To this extent, the implementation of full remote control capability must be completed, including the reconstruction of the VLBI receiving system. The adaption of the VLBI schedules with respect to satellite passes and a remote switching between the different operational modes allows a simultaneous use for satellite tracking and geodetic VLBI.
In addition to the envisaged increase of satellite missions in the future, it is planned to significantly expand the mission of GARS O’Higgins in the coming years from a dedicated satellite receiving station to an observatory for environmentally relevant research. That means that the measurement portfolio of the station will be expanded. This demands the development of the infrastructure and the interoperability to foster partnerships with global observatories/stations. The construction and operation of new scientific instruments that will be focused on long-term measurements is an integral task of the added responsibility. Additionally, the GARS O’Higgins station may serve in the future as scientific logistical base for field campaigns in the northern part of the Antarctic Peninsula.
Acknowledgements
The operation of an Antarctic station is a big financial, administrative and logistic effort. We thank all involved persons and institutions for their support, in particular the owner of the station DLR and its partner BKG, the Chilean Antarctic Institute, the Chilean forces, the Brazilian Air Force and the teams from DLR and Servimet that keep the station running.