Introduction
Chrysanthemum (Chrysanthemum × morifolium Ramat.), a commercial flower plant belonging to Asteraceae family, is a native to Asia and Europe; and has been under cultivation for the past 2000 years (Martín and González-Benito, Reference Martín and González-Benito2005). It is the second largest cut flower in world trade owing to its attractive flowers having wide array of colours, shapes and plant types (Spaargaren and van Geest, Reference Spaargaren, van Geest and Van Huylenbroeck2018). Japan is the leading producer followed by Columbia, Netherlands, Italy and United States (Saxena et al., Reference Saxena, Bhattacharya and Malhotra2015). The total flower production of chrysanthemum in India was estimated to be 198.95 Mt (APEDA, 2015). Phenotypic diversity in chrysanthemum cultivars is highest among cultivated ornamental crops worldwide (Dai et al., Reference Dai, Song, Deng, Gao, Li, Ma and Zhang2019). The nature and magnitude of variation present in germplasm and association among the phenotypic traits is a prerequisite to achieve breeding objectives (Kameswari et al., Reference Kameswari, Pratap, Anuradha and Begum2014; Negi et al., Reference Negi, Dhiman and Dhiman2020). Diverse floret colour and shape represent variation in chrysanthemum species and cultivars. Therefore, it becomes imperative to understand the genetic variability and diversity available in germplasm pool to identify a set of genotypes with similar/dissimilar genetic backgrounds for improvement of quantitative and qualitative traits (Kumar et al., Reference Kumar, Prasad, Mehdi, Gupta, Shanker, Singh and Yadav2020). It is also important to select genetically diverse parents with better crossability to breed desirable chrysanthemum cultivars (Chen et al., Reference Chen, Sun, Liang, Xue and Zhang2013).
Morpho-metric characterization of germplasm necessitates large-scale growth experiments, often with fully matured plants under conditions that are as uniform as possible. The use of morphological traits/markers is irreplaceable due to their ubiquity and ease of observation that makes them convenient indicators (Dai et al., Reference Dai, Wang and Huang2002). Various studies have been reported to estimate genetic variability in chrysanthemum germplasm for agronomic traits which are polygenic and influenced by the environments (Telem et al., Reference Telem, Sadhukhan, Sarkar, Akoijam, Haribhushan and Wani2017; Madhumathi et al., Reference Madhumathi, Bhargav, Reddy, Kameshwari, Sreedhar and Lakshmi2018; Negi et al., Reference Negi, Dhiman and Dhiman2020). International Union for the Protection of Plant Varieties (UPOV), Geneva has developed a set of DUS (distinctiveness, uniformity and stability) descriptors which are least influenced by the environments to test the existing and newly developed varieties in order to protect and confer breeder's rights. The current study involves estimation of variability and heritability statistics giving due importance to both quantitative and qualitative DUS characteristics.
Materials and methods
The experimental materials comprised of 54 diverse chrysanthemum genotypes. The experiment was carried out at the experimental farm, Division of Floriculture and Landscaping, IARI, New Delhi in randomized block design with two replications during two consecutive seasons (August–February) of 2017–2018 and 2018–2019. The plot (4.5 m × 1.8 m) comprised of three rows distanced 60 cm apart with plants spaced at 45 cm apart. Standard agronomic practices were followed during crop growth. Data were recorded on 10 randomly selected plants for 22 descriptors including 14 quantitative characters viz., plant height (PH), stem internode length (SIL), stem diameter (SD), peduncle thickness (PT), peduncle length of terminal flower head (PTFL), leaf length (LL), leaf width (LW), ratio of leaf length/width (RLW), leaf thickness (LT), length of lower lobe of leaf (LLL), flower head diameter (FD), length of corolla tube of ray floret (LCT), length of outer ray florets (LOF), width of outer ray florets (WOF) and eight grouping characters viz., plant type, variety class, flower head type, longitudinal axis of majority of ray florets, colour of inner side of majority of ray florets, disc type (single or semi-double varieties only), flower type and economic use as per UPOV guidelines for DUS testing. The year-wise quantitative data were pooled and used for statistical analysis. The chrysanthemum genotypes with respective flower type involved in the study are given in Fig. 1 and qualitative characters studied are presented in online Supplementary Table S1.
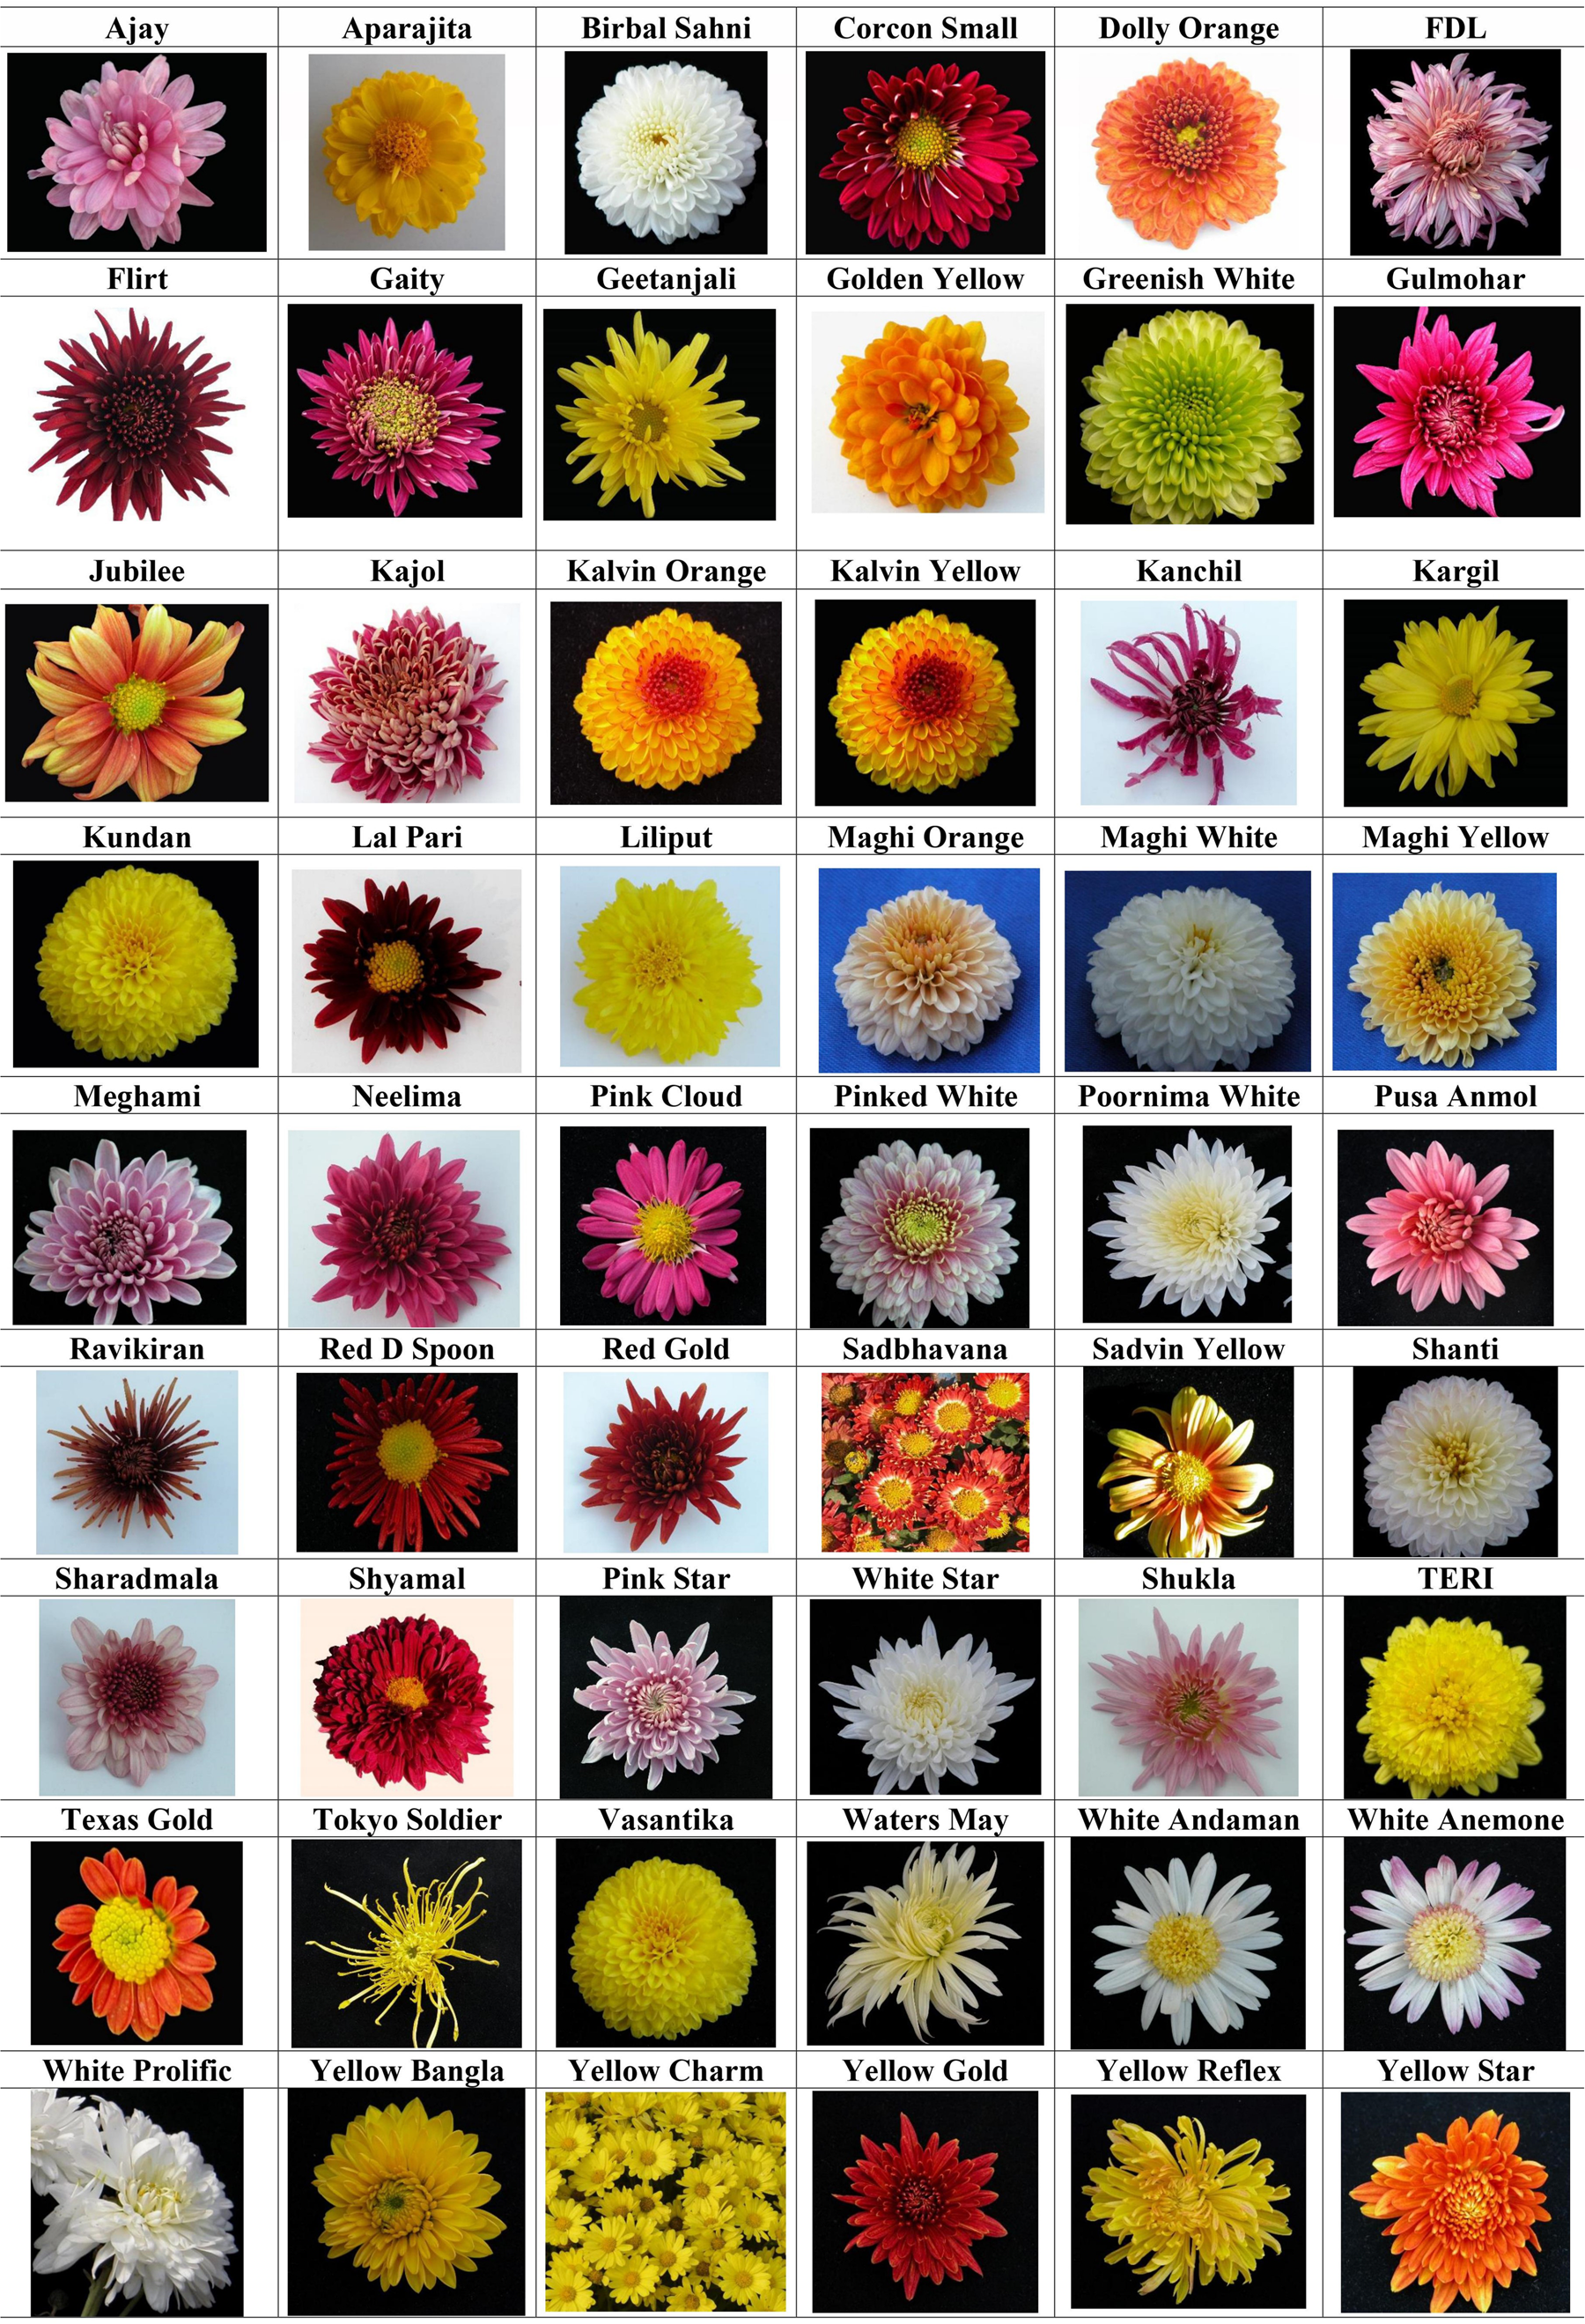
Fig. 1. Flower type of chrysanthemum genotypes selected for the study.
The analysis of variance for quantitative traits was computed as described by Panse and Sukhatme (Reference Panse and Sukhatme1967). Phenotypic (δ 2p) and genotypic (δ 2g) variances were calculated using the method suggested by Baye (Reference Baye2002), as follows:

where MSp, MSg, MSe and r denote mean squares of phenotypes, mean squares of genotypes, mean squares of error and number of replications, respectively. The phenotypic coefficient of variation (PCV) and genotypic coefficient of variation (GCV) were obtained by using the following formulae:

where δ 2p is the phenotypic variance, δ 2g is the genotypic variance and x̅ is the sample mean (Baye, Reference Baye2002). Estimates of broad sense heritability (h 2B) was calculated according to the formulae: h 2B = δ 2g/δ 2p (Allard, Reference Allard1999), whereas genetic advance (GA) was estimated as per the formula described by Fehr (Reference Fehr1987). Phenotypic and genotypic correlation coefficients were determined using INDOSTAT statistical software.
The quantitative data were subjected to the Mahalanobis D 2 statistics analysis (Mahalanobis, Reference Mahalanobis1936) and average intra- and inter-cluster distances were computed. Tocher's method was used for grouping of genotypes (Rao, Reference Rao1952). Cluster analysis was also performed based on standardized squared Euclidean distance using Ward's minimum variance method in SPSS v25 software and principal component analysis (PCA) was carried out.
Results
Characterization
Mean performance, coefficient of variation, range and mean sum of square of genotypes revealed significant differences for most of the quantitative traits among chrysanthemum genotypes (online Supplementary Table S2 and Table 1). Plant height varied from 31.70 cm (Texas Gold) to 107.83 cm (Neelima) with a mean value of 68.54 cm. Stem internode length ranged from 0.51 cm (White Andaman) to 2.79 cm (Pink Cloud), whereas stem diameter varied from 0.55 cm (Liliput) to 1.64 cm (Maghi Yellow) with mean values of 1.29 and 0.91 cm, respectively. Peduncle thickness varied from 0.12 cm (Sadbhavana) to 0.47 cm (Tokyo Soldier) with a mean value of 0.24 cm. Average peduncle length of terminal flower head ranged from 0.93 cm (Tokyo Soldier) to 11.40 cm (Aparajita) with a mean value of 5.01 cm. Leaf length and leaf width ranged between 2.63 cm (Yellow Charm) to 11.10 cm (Tokyo Soldier) and 1.40 cm (Yellow Charm) to 6.82 cm (Red D Spoon) with mean values of 6.18 and 3.83 cm, respectively. Leaf length of Tokyo Soldier was at par with Yellow Reflex. Leaf width of Red D Spoon was found at par with Tokyo Soldier. Mean length/width ratio of leaf ranged from 1.23 cm (Sharad Mala) to 2.11 cm (Pink Cloud) with a mean value of 1.63 cm. Mean leaf length/width ratio of Pink Cloud was at par with Birbal Sahni and Greenish White. Average leaf thickness was 0.31 cm with a range of 0.12 cm in FDL to 0.63 cm in Lal Pari which was at par with Sadbhavana. Length of lower leaf lobe ranged from 0.99 cm (Yellow Charm) to 4.66 cm (Red D Spoon) with an average of 2.48 cm. Average flower head diameter was recorded as 5.70 cm with a range of 2.52 cm (Dolly Orange) to 14.76 cm (Tokyo Soldier). Corolla tube length of ray florets varied from 0.16 cm (Tokyo Soldier) to 7.89 cm (Yellow Gold) with a mean value of 0.93 cm. Length and width of outer row of ray florets measured between 0.95 cm (Liliput) to 7.98 cm (Tokyo Soldier) and 0.17 cm (Neelima) to 1.27 cm (Pink Star and White Star), with mean values of 2.56 and 0.52 cm, respectively.
Table 1. Mean values, coefficients of variation, ranges and mean squares of 14 quantitative traits

**Indicate significant difference at the 0.1% probability level.
Characterization based on eight oligogenic characteristics revealed that 42 genotypes were bushy and with the rest (12) being non-bushy (online Supplementary Table S1). As per cut flower types, 10 varieties were grouped as standard type, whereas remaining (44) were spray type. Based on flower head types, genotypes were categorized into single (6), semi-double (21) and double types (27). Longitudinal axis of majority of ray florets was straight in 28 genotypes followed by incurving in 15, reflexing in 10 and twisted in one genotype. Based on colour of inner side of majority of ray florets recorded as per Royal Horticultural Society, England (RHS) colour chart, genotypes are categorized into bronze (2), green (1), orange (1), pink (10), purple (4), red (10), white (9) and yellow (17). Disc types were mainly daisy (19) and anemone (7) in single- or semi-double genotypes. Based on flower types, the cultivars were classified into anemone (10), ball (2), incurving (10), pompon (26) and reflexing types (6).
Estimates of correlation between quantitative traits
Phenotypic and genotypic correlations exhibited a positive significance for pairs of quantitative characters (Table 2). Highly significant genotypic and phenotypic correlations (r > 0.60**) were observed for plant height with stem diameter; peduncle thickness with flower diameter, and length of outer ray florets; leaf length and leaf width and both of these had highly significant and positive genotypic and phenotypic correlations with flower diameter (r > 0.50**), length of corolla tube of ray florets (r > 0.50**) and length of outer ray florets (r > 0.50**). Leaf length also had positive and significant correlation with length of lower leaf lobe (r > 0.80**). Length of lower leaf lobe, length of outer ray florets and length of corolla tube of ray florets were also positively associated among each other. Flower diameter had significant genotypic and phenotypic correlations with length of corolla tube of ray florets (r ≥ 0.60**) and length of outer ray florets (r > 0.90**). However, genotypic and phenotypic correlations of leaf length/leaf width ratio and leaf thickness were not significant with other characters.
Table 2. Genotypic (G) and phenotypic (P) correlation among 14 quantitative traits in chrysanthemum genotypes

PH, plant height (cm); SIL, stem internode length (cm); SD, stem diameter; PT, peduncle thickness; PTFL, peduncle length of terminal flower head; LL, leaf length; LW, leaf width; RLW, ratio of leaf length/width; LT, leaf thickness; LLL, length of leaf lower lobe; FD, flower head diameter; LCT, length of corolla tube of ray floret; LOF, length of outer ray florets; WOF, width of outer ray florets.
Estimation of genetic variability, heritability and GA
Genotypic, phenotypic and environmental variances, genotypic and phenotypic coefficients of variation, heritability and GA as percentage of mean for the quantitative characters are presented in Table 3. Wide range was observed for genotypic coefficients of variation from 9.41% (RLW) to 105.99% (LCT). PCV ranged from 10.49% (RLW) to 106.38% (LCT). The characters viz., WOF, FD, PTFL, LT, LOF and LCT, showed more PCV and GCV values (>30%). Estimates of broad sense heritability for most of the characters were >96%, whereas it was comparatively low for the traits RLW and PT. Expected GA ranged from low (17.40%) in RLW to high (105.33%) in LCT.
Table 3. Genetic parameters and descriptive statistics of chrysanthemum genotypes

GV (δ 2g), genotypic variance; PV (δ 2p), phenotypic variance; EV (δ 2e), environmental variance; GCV, genotypic coefficient of variation; PCV, phenotypic coefficient of variation; GA, genetic advance; GA% mean, genetic advance as percentage of mean; PH, plant height; SIL, stem internode length; SD, stem diameter; PT, peduncle thickness; PTFL, peduncle length of terminal flower head; LL, leaf length; LW, leaf width; RLW, ratio of leaf length/width; LT, leaf thickness; LLL, length of leaf lower lobe; FD, flower head diameter; LCT, length of corolla tube of ray floret; LOF, length of outer ray florets; WOF, width of outer ray florets.
Genetic diversity based on quantitative characteristics
The D 2 statistics of morphological data based on Euclidian distance grouped the genotypes into eight genetically diverse clusters. Inter- and intra-cluster distances and genotypes representing the respective clusters are presented in Table 4. Inter-cluster distances were wider than intra-cluster distance. The intra-cluster distance was maximum (3.46) in cluster IV and minimum (0.98) in cluster II. The inter-cluster distance ranged between 2.93 (clusters III and VI) and 8.68 (clusters I and IV). Cluster I accommodated maximum genotypes (15), followed by cluster VI (13), cluster V (10), cluster III (5), cluster VIII (5), cluster II (2) and cluster VII (1).
Table 4. Average inter- and intra-cluster distances and grouping of genotypes based on D 2 analysis

The bold values signify within cluster distance.
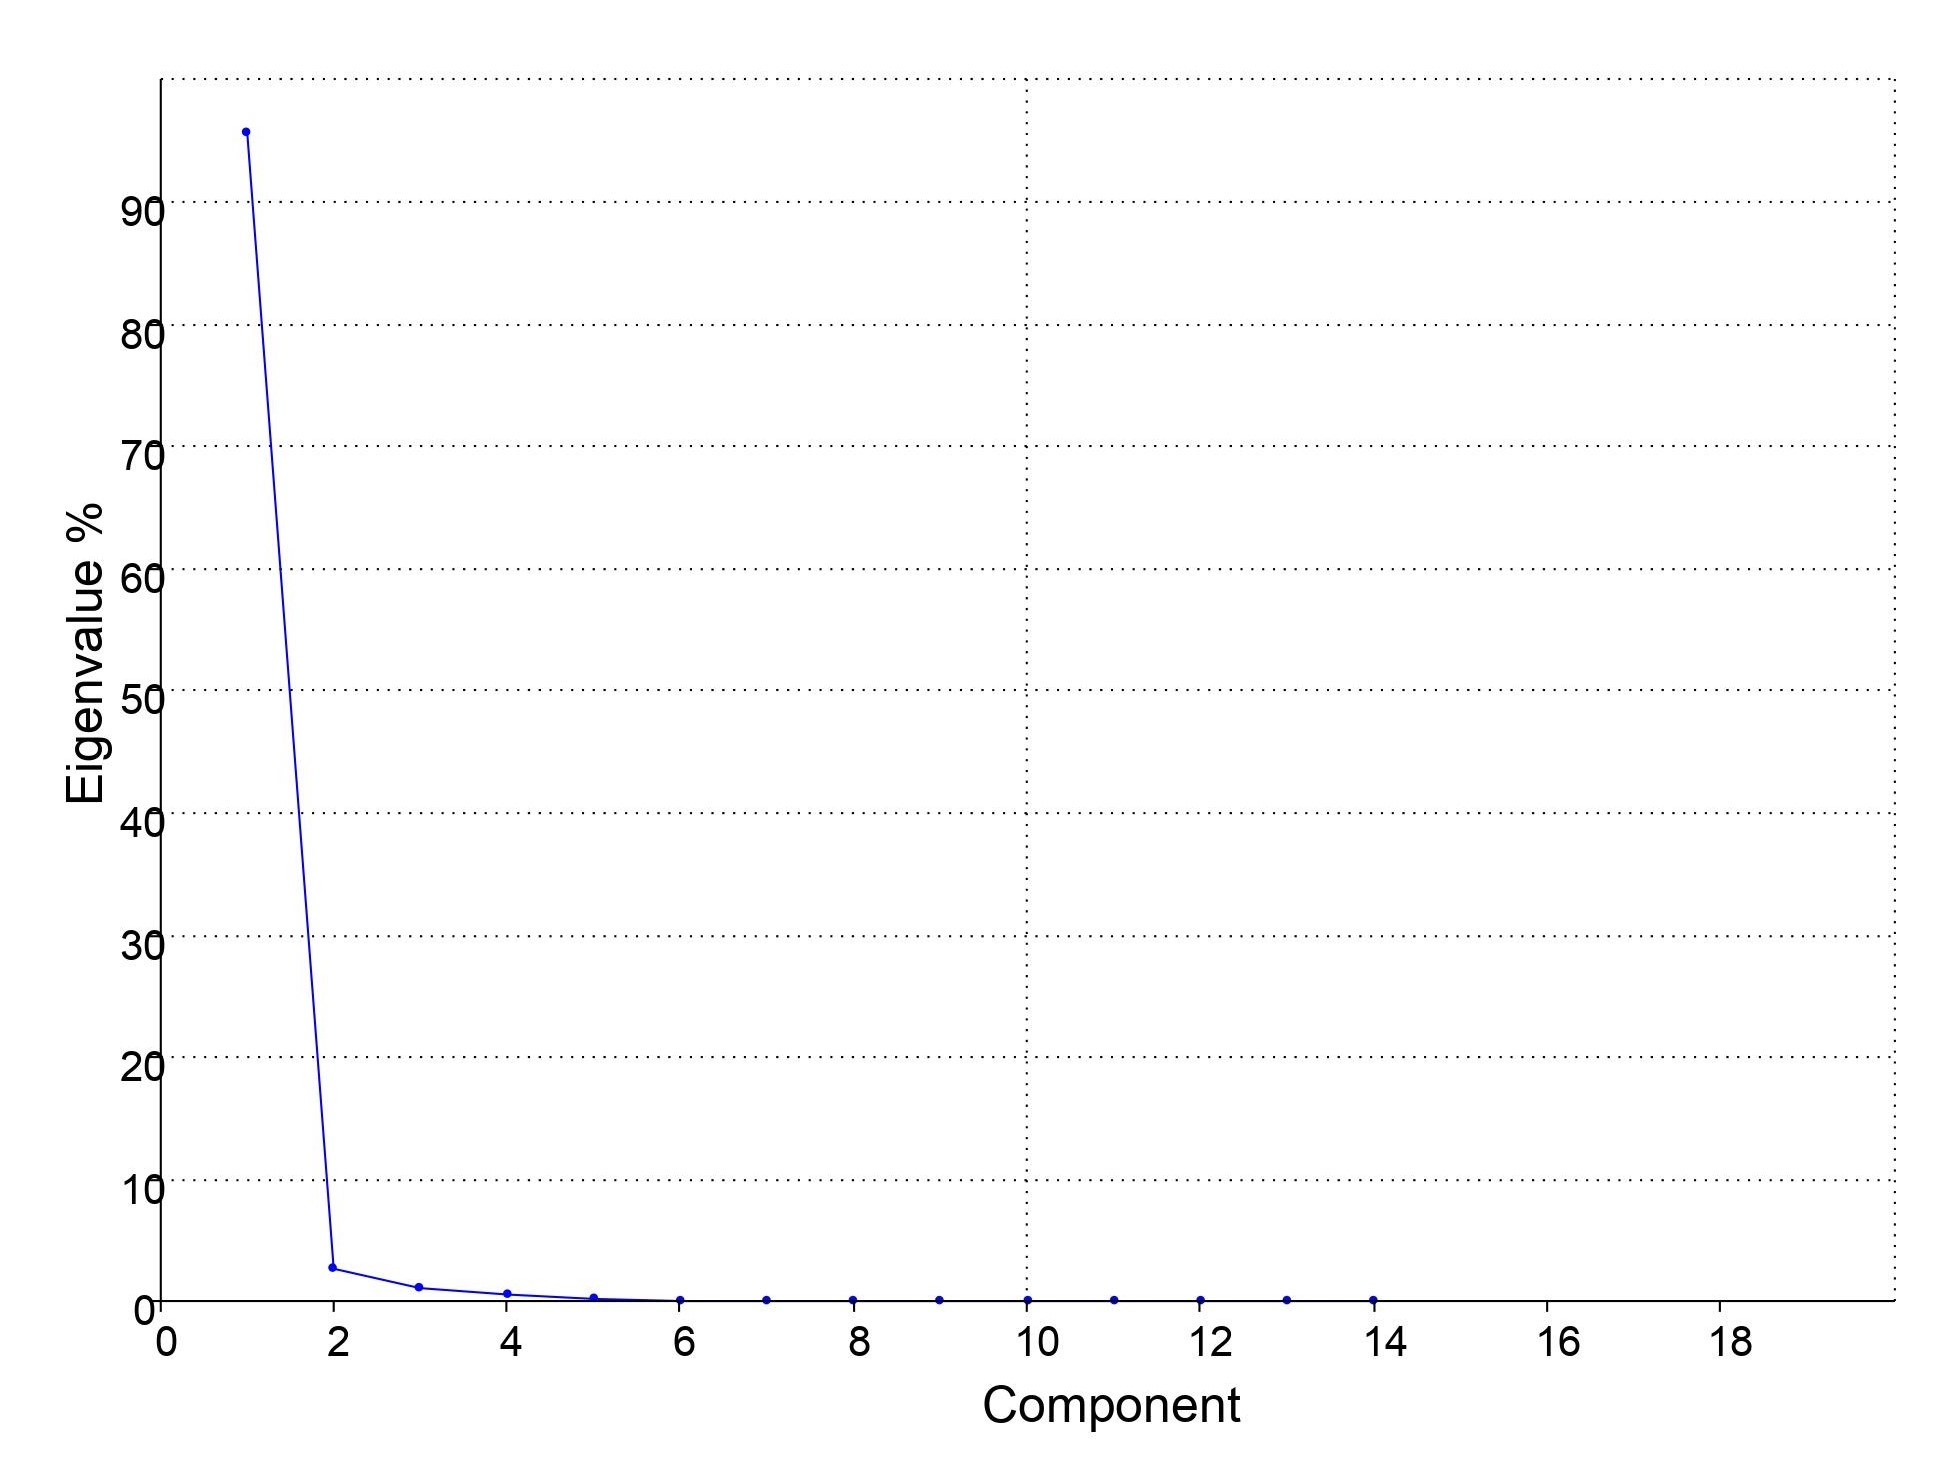
Dendrogram based on standardized squared Euclidean distance was generated using Ward's method for 14 quantitative characters representing 54 genotypes (Fig. 2). Three distinct clusters namely, C-I, C-II and C-III were formed having 29, 7 and 18 genotypes, respectively (online Supplementary Table S3). Cluster I was further subdivided into three sub-clusters C-Ia (22), C-Ib (6) and C-Ic (1). Cluster I was formed by genotypes with more leaf length, leaf width, ratio of leaf length/width, length of leaf lower lobe, flower head diameter, length of corolla tube of ray florets, length and width of outer ray florets as compared to other clusters. Cultivar Tokyo Soldier grouped alone in sub-cluster C-Ic was distinct from the genotypes in other sub-clusters. It had broad peduncles, longer peduncle of terminal flower head, longest leaf, bigger flower head, longer corolla tube and outer ray floret. Cluster II possessed tall varieties with longer stem internode length, broader stems, thicker peduncles and longer peduncles of terminal flower head. Cluster III accommodated genotypes with thicker leaves and higher ratio of leaf length/width. Based on the PCA, the first two components (95.5 and 2.6% respectively) explained most of the existing variation among chrysanthemum cultivars for 14 DUS characteristics (online Supplementary Fig. S1).

Fig. 2. Dendrogram of chrysanthemum cultivars based on squared distance using quantitative data.
Discussion
Phenotypic characterization based on DUS traits
Characterization and evaluation of germplasm is essential to understand the presence of genetic diversity (Roein et al., Reference Roein, Asil, Sabouri and Dadras2014). Chrysanthemum genotypes showed significant differences over two consecutive years for all morphological characters studied. Genotypes such as Neelima, Pink Cloud and Maghi Yellow showed greater mean values for PH, SIL and ST, respectively during both the years. The performance of Tokyo Soldier was significantly different with respect to PT, PTFL, FD, LCT and LOF, as compared to other genotypes. Red D Spoon had highest leaf width and lower leaf lobe length, whereas Lal Pari had maximum leaf thickness. In addition to flower characteristics, leaf characteristics were also observed to be unique to each variety which may be helpful for varietal identification and early selection during breeding chrysanthemum (Gao et al., Reference Gao, Song, Kong and Dai2020). Morphological variations in leaf traits have also been reported in chrysanthemum (Zhen et al., Reference Zhen, Yang and Yu2013).
The analysis of variance permits estimation of phenotypic and genotypic coefficient of variation in polygenic traits. Highest coefficient of variation and broad range values were recorded for the characters viz., length of corolla tube of ray florets, peduncle thickness, leaf thickness, width of outer ray florets and stem internode length. Low coefficient of variation for length of outer ray florets, leaf length and flower head diameter indicated that the genetic uniformity of genotypes for these traits is due to homozygosity. Similar variations have also been documented earlier for the same quantitative characters (Baskaran et al., Reference Baskaran, Jayanthi, Janakiram and Abirami2009; Prakash et al., Reference Prakash, Kumar, Naresh, Malik, Singh and Kumar2017).
Chrysanthemum genotypes were characterized based on eight qualitative, grouping characteristics. Number of descriptor states for trait varied from two (plant type and disc type) to eight (colour of inner side of ray florets). As for DUS test guidelines of UPOV, characters those do not vary or slightly vary within variety are used as grouping characters. Grouping characters are used to assess distinctiveness of a variety according to DUS test guidelines. The germplasm set included standard and spray varieties. Based on flower head types, genotypes were grouped as doubles, semi doubles and single types. Majority of genotypes were having flowers with straight ray florets followed by incurving and reflexing types. Wide colour variations in ray florets were noted among cultivars. Single and semi-double varieties were having anemone and daisy type of disc. Flower types were classified into anemone, ball, incurving, pompon and reflexing types. A large genetic variation was reported in six flower and ray floret traits using a pseudo-testcross population of chrysanthemum (Lim et al., Reference Lim, Shim, Sim, Oh and Seo2014). It was observed that high discrimination ability lies with characteristics such as colour of inner side of majority of ray florets, flower type and longitudinal axis of majority of ray florets, and they may be useful in trait specific crop improvement programme. Similar variability has been documented with respect to plant type, flower head type, disc type and ray floret colour in chrysanthemum (Hodaei et al., Reference Hodaei, Rahimmalek and Arzani2017).
Genetic variability, heritability and GA
Genotypic, phenotypic and environmental variances, genotypic and PCV, heritability and GA as percentage of mean were significant for all the morphological characters. The performance of the genotype varies with the region, season and growing conditions. A close perusal of results revealed that genotypic and phenotypic coefficients of variation was highest for length of corolla tube of ray florets and moderate for length of outer ray florets, leaf thickness and peduncle length of terminal flower heads (>40%) which are important floral attributes. Selection for these characters in progenies would result into genetic gain. PCV was found high corresponding to GCV suggesting variation in selected characters due to both genotypic constitutions, as also influenced by environment. Similarly, highest PCV values for growth and floral characters were observed under two environmental conditions (Ghimiray et al., Reference Ghimiray, Sarkar and Roy2005). Heritability estimates aids in selection during hybridization. In the current study, most of the quantitative characters had high broad sense heritability, values exceeding 96% (except for the traits viz., ratio of leaf length/leaf width and peduncle thickness) indicating least environment influence on expression of the said characteristics. Reliable expression of phenotypes can be well predicted through heritability estimates of quantitative traits in genetics (Falconer and Mackay, Reference Falconer and Mackay1996). Strong heritability of >99% for the characters namely, length of outer ray florets, flower diameter, length of corolla tube of ray florets and peduncle length of terminal flower head implied that these characters greatly assist the breeders in selection and identification of superior genotypes. In a similar study, greater broad sense heritability values were estimated for inflorescence traits of anemone types of chrysanthemum (Yang et al., Reference Yang, Ao, Qu, Wu, Su, Ding, Chen, Jiang, Guan, Chen and Fang2020). Shim et al. (Reference Shim, Lim, Kim, Chung, Kim and Chung2016) reported the highest heritability (99.67%) for leaf area, however, others have reported slightly lower estimates for floral characters (Baskaran et al., Reference Baskaran, Jayanthi, Janakiram and Abirami2009; Roein et al., Reference Roein, Asil, Sabouri and Dadras2014). Greater broad sense heritability (>96%) along with high GA (>75%) for PTFL, LT, FD, LCT and LOF indicated that these characteristics were under additive gene control and simple selection for them would be effective while developing desired cultivars in chrysanthemum. It has been suggested that estimates of heritability and GA of quantitative traits are considered during selection as they are more reliable (Johnson et al., Reference Johnson, Robinson and Comstock1955).
Correlation analysis
Genotypic and phenotypic correlation coefficients for quantitative traits revealed that there was strong and positive association for plant height with stem diameter; peduncle thickness with flower diameter and length of outer ray florets; leaf length with leaf width, length of lower lobe of leaf, flower diameter and length of corolla tube of ray florets and length of outer ray florets; and flower diameter with LCT and LOF. Correlation analysis suggested that there would be co-heritability and simultaneous improvement of the above traits upon selection. Since, flower diameter is an important quality trait, indirect selection for plant height, leaf length and peduncle thickness would result in genotypes with bigger flower having strong stem. In a similar line of study, significant and positive correlation has been documented between plant height and flower diameter in chrysanthemum by Qu et al. (Reference Qu, Zhang, Lv, Chen and Chen2012).
Genetic diversity analysis
The D 2 statistics analysis based on morphological data revealed that the inter cluster distances were comparatively larger than the intra-cluster distances. Maximum inter-cluster distance was computed between clusters I and IV implying that the genotypes within these clusters were more diverse and can be utilized as desirable parental cultivars during hybridization. Genotypes found in cluster IV were more diverse as evident from highest intra-cluster distance. As evident from the quantitative data, genotypes from most divergent clusters have broad variation with respect to most of the DUS traits. Genotypes within the clusters having lower inter-cluster distance were relatively close and less diverse for the selected characteristics. It is pertinent to mention that crossing of genotypes from such cluster considering their quality traits may yield some useful progenies. Therefore, genotypes present in cluster IV (Red D Spoon, Tokyo Soldier and Yellow Reflex) and cluster I (Ajay, Dolly Orange, Golden Yellow, Kargil, Lal Pari, Liliput, Pinked White, Sadbhavana, Shanti, Sharad Mala, TERI, White Andaman, White Anemone, Yellow Bangla and Yellow Charm) were found highly diverse and can be included in crossing programme to obtain better segregants. In a similar study, Baliyan et al. (Reference Baliyan, Sirohi, Kumar, Kumar, Malik, Sharma and Sharma2014) estimated genetic diversity of 24 chrysanthemum varieties for nine agro-morphological characters based on D 2 analysis.
Three genetically distinct clusters (C-I, C-II and C-III) were obtained in cluster analysis based on standardized squared Euclidean distance. Cluster analysis was found in conformity with the D 2 statistics analysis. Genotypes found in cluster I accommodated most of genotypes (>90%) represented in clusters II, IV, V, VI and VII of D 2 analysis. Cluster II accommodated cultivars found in clusters II and VIII and cluster III genotypes in clusters I and III of D 2 analysis. Dendrogram based on cluster analysis showed that Cultivar Tokyo Soldier grouped separately in sub-cluster C-1c and is distinct from the other clusters. Similarly, it was noted in cluster IV and found genetically distinct based on inter and intra-cluster distances. As evident from morphological data, the cultivar Tokyo Soldier was characterized by broad peduncle, longer peduncle of terminal flower head, longer leaf, bigger flower head, longer corolla tube and outer ray floret. Hodaei et al. (Reference Hodaei, Rahimmalek and Arzani2017) opined that hybridization among divergent clusters would result in heterotic effects for flower quality characteristics. PCA also proved that large variation existed for selected DUS characteristics among the chrysanthemum cultivars.
Supplementary material
The supplementary material for this article can be found at https://doi.org/10.1017/S1479262121000629
Acknowledgements
The authors acknowledge ICAR-IARI, New Delhi for providing funds for the research.
Conflict of interest
The authors declare no potential conflict of interest.