INTRODUCTION
Pre-harvest mortalities in marine aquaculture result from the complex interplay of a broad range of factors that include stock source/genotype, developmental defects, predation and cannibalism, impaired nutrition, physical damage, sub-optimal/hostile environmental conditions and disease. Economic losses accrue not only from mortalities but also from impacts on growth and food conversion, post-harvest downgrading or rejection of carcasses and derived products, fish escapes, management decisions that impact on profitability, e.g. protracted decisions to treat, grade or harvest, and the costs and effects of particular husbandry and management practices, e.g. fallowing, grading, vaccination, treatment and stock handling.
Parasitic diseases attributable to obligate or opportunistic eukaryotic pathogens continue to have a major impact on global finfish and shellfish aquaculture, and in many regions they represent a key constraint to production, sustainability and economic viability. Although robust data can often be generated concerning the general patterns of stock loss within a typical production cycle, obtaining accurate figures for the impacts of disease can be more problematic due to a number of considerations, which include production scale, available resources, difficulties in making rapid or accurate parasite identifications at the farm level and poor record keeping. The frequent association of disease with other pre-disposing factors, such as poor water quality and the broad variety of precipitating events that may act to stress the farm population, also means that untangling the impacts of disease from those attributable to other causes may be difficult or impossible. Thus, in many cases, the economic impact of parasitic diseases can only be estimated.
Parasite-induced impacts in marine aquaculture can be divided into two broad categories: unpredictable/sporadic and predictable/regular. For both, there may be costs in treating and managing infections once established, but for predictable infections there will also be costs associated with prophylactic treatment/management. For example, the management costs associated with controlling infections of caligid copepods, e.g. Lepeophtheirus salmonis and Caligus spp. in farmed Atlantic salmon (Salmo salar) can largely be predicted within a production cycle as these parasites pose a perennial threat to captive reared stocks. The infection dynamics of these species are well understood, and they can be controlled through the employment of an integrated pest management strategy (IPMS) involving the use of a broad range of management tools in addition to direct treatment intervention. The global Atlantic salmon production industry is well established (>40 years) and can draw upon the long-term, shared experiences of parasite control and management that have led to the development of effective strategies to minimise mortalities, damage and loss of profit (see Frenzl et al. Reference Frenzl, Migaud, Fjelldal, Shinn, Taylor, Richards, Glover, Cockerill and Bron2013, Reference Frenzl, Stien, Cockerill, Oppedal, Richards, Shinn, Bron and Migaud2014). For many other new or less-established industries, however, particularly those restricted to a small number of production sites, the parasite threats may be largely unknown and emerging, and new infections can have a devastating impact. The impact of Paramoeba perurans (syn. Neoparamoeba perurans), the causative pathogen of amoebic gill disease (AGD), on the early Tasmanian production of rainbow trout, Oncorynchus mykiss, serves as an appropriate example (Munday et al. Reference Munday, Foster, Roubal, Lester, Perkins and Cheng1990).
Many parasite infection events are complicated by the complex interplay of numerous factors making it difficult to calculate the precise costs attributable to the parasite. The Chilean crash in national salmon production from 385 086 tonnes (t) in 2006 to 230 678 t in 2010 (FAO FishStatJ, 2013), for example, appears to have been multifactorial with the key pathogens involved being ISAv (infectious salmon anaemia virus) and the caligid copepod Caligus rogercresseyi. Major contributing factors included a large number of marine farms in production, the high stocking densities employed, a concentration of farms within a small area (~40% of the salmon production around Chiloé Island), a lack of biosecurity measures, weak disease surveillance, poor sanitary control and a failure to employ zone management (Ibieta et al. Reference Ibieta, Tapia, Venegas, Hausdorf, Takle and Sladonja2011). Many farm sites were subject to infection from other disease agents, such as salmonid rickettsial septicaemia (SRS) caused by Piscirickettsia salmonis (see Olivares and Marshall, Reference Olivares and Marshall2010), infectious pancreatic necrosis (IPN) caused by the pancreatic necrosis virus (IPNV) (Ibieta et al. Reference Ibieta, Tapia, Venegas, Hausdorf, Takle and Sladonja2011), P. perurans (see Bustos et al. Reference Bustos, Young, Rozas, Bohle, Ildefonso, Morrison and Nowak2011; Rozas, Reference Rozas2011) and rising C. rogercresseyi infections (Rozas and Asencio, Reference Rozas and Asencio2007), which were suggested to predispose salmon stocks to the ISAv infection. By the end of 2008, 105 Chilean sites were confirmed as ISAv positive with a further 44 suspect sites; a quarter of the positive sites were owned by a single company who declared losses of US$ 81·2 billion for the second half of 2007 (Marine Harvest, 2007). As can be seen from the above, the calculation of the proportion of this loss that could be deemed to be attributable to C. rogercresseyi is not possible.
Although immediate losses to production can often be estimated, it is usually difficult to calculate the full magnitude of the downstream socio-economic effects of major disease events on the livelihoods and associated industries centred around primary producers. While insurance claims may provide some guidance as to losses, these may be overinflated, based on ‘best price’ or on an estimated loss of trade/income. In addition, the costs of remedial action (e.g. treatment, disposal and monitoring) and/or changes to management practices and infrastructure also need to be considered. The resilience of the Chilean salmonid aquaculture industry, which rapidly implemented improved infectious disease control measures and was able to fall back on well-established coho salmon, Oncorynchus kisutch, and rainbow trout industries (24 and 38% of national salmonid production in 2011, respectively), arguably minimised the full potential economic impact of the 2007 crisis (Alvial et al. Reference Alvial, Kibenge, Forster, Burgos, Ibarra and St-Hilaire2012a , Reference Alvial, Kibenge, Forster, Burgos, Ibarra and St-Hilaire b ). Although there are a number of studies that have attempted to estimate the full economic consequences of parasite infections, both through the documentation of a specific disease event (Roberts et al. Reference Roberts, Murrell and Marks1994; Torgerson and MacPherson, Reference Torgerson and MacPherson2011; Charlier et al. Reference Charlier, Voort van der, Hogeveen and Vercruysse2012) and through the estimation of the potential impact of disease introduction (Paisley et al. Reference Paisley, Karlsen, Jarp and Mo1999; Riddington et al. Reference Riddington, Radford, Paffrath, Bostock and Shinn2006; Voort van der et al. Reference Voort van der, Charlier, Lauwers, Vercruysse, Huylenbroeck Van and Van Meensel2013), the data and resources required to undertake such studies generally preclude the accurate estimation of the cost of parasite-associated impacts. For example, teasing out the role and the precise economic impact attributable to parasitic agents, e.g. P. perurans and C. rogercresseyi, from that due to the other contributing factors leading to the Chilean 2007 crisis, is a near-impossible task, and therefore, the costs can only be speculated upon. For this reason, the economic impact of these parasites in the Chilean 2007 crisis, is not included in this summary.
In this review, we provide an overview of the world's major marine and brackish aquaculture production industries and assess the impacts of the major parasite species that affect production or otherwise impose an economic cost. As discussed above, it is not possible to provide a comprehensive review of all parasite-related losses in aquaculture, but we provide estimates for some of the more serious loss-related events and provide brief details relating to each. For each event resulting in a notable loss, i.e. either mortality or deviation from projected revenue, we cite either figures given in the original publication or have applied a simple formula to determine the likely loss to the stock only at the point in the production cycle when the disease event occurred. In the absence of details within the original report, many of the costs provided here are assumption-based and so a degree of caution should be exercised. It is anticipated that this study will prove informative for risk assessment by new aquaculture-based enterprises and will aid an appreciation of the sporadic nature and impact of some parasite-induced infections, and can assist in the development of more robust risk assessments and biosecurity practices, which can help mitigate against and/or minimise the potential impacts of parasite-mediated disease in aquaculture.
MATERIALS AND METHODS
Ranking of aquaculture industries
FAO's FishStatJ has been used as the principal source of data for ranking industries according to their commercial value and tonnage (see Tables 1–6); however, it should be emphasised that some caution needs to be exercised in the interpretation of both the original figures and those provided here given that (1) the species in FishStatJ are listed by common names rather than by a specific Latin binomial nomenclature or by a generic group, e.g. groupers, creating potential errors in correctly identifying and allocating a species to its true class and ascribing an accurate tonnage and value; (2) the values returned for some species are estimated in the absence of precise data and are based on either best knowledge at the time of data submission, the returns submitted for previous years or represent cautious projections based on either national growth trends for each industry or nominal figures intended to demonstrate growth and development; and (3) aquaculture activities in some countries appear to have been omitted, e.g. Australia's production figures for Japanese yellowtail Seriola quinqueradiata. In the case of the latter, the figures may have been included and are listed under another category but are not easily identifiable. We have, therefore, attempted to identify national production figures for some of these industries and provide amended values.
Table 1. Aquaculture production in brackish and marine environments in 2011 presented in tonnes (t) for each broad class of aquatic species. Figures are calculated from the FAO FishStatJ databases (2011)

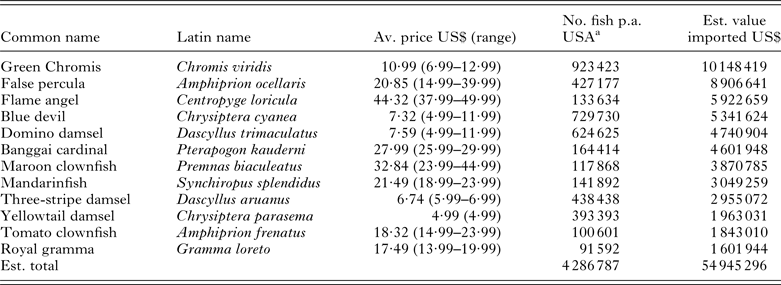
Table 1 provides a breakdown of brackish/marine aquaculture by class. In addition to providing production figures and values for the major marine/brackishwater finfish (Table 2), molluscan (Table 3), crustacean (Table 4), ascidian, cnidarian and echinoderm (Table 5) industries, we also consider farmed marine ornamental species (Table 6). Identifying global figures for the most popular traded ornamental species, however, has proven more difficult, and here we use information presented by Rhyne et al. (Reference Rhyne, Tlusty, Schofield, Kaufman, Morris and Bruckner2012) on the number of fish imported into the USA during the period May 2004–May 2005 as an indicator. The shipment data, which was extracted from the Law Enforcement Management Information Systems (LEMIS) database maintained by the United States Fish and Wildlife Services (USFWS), was used to list the 20 most popular fish entering the USA. The retail value of each ornamental species, for which a commercial aquaculture production unit could be identified, was determined from the average retail price in the USA determined from a minimum of three outlets.
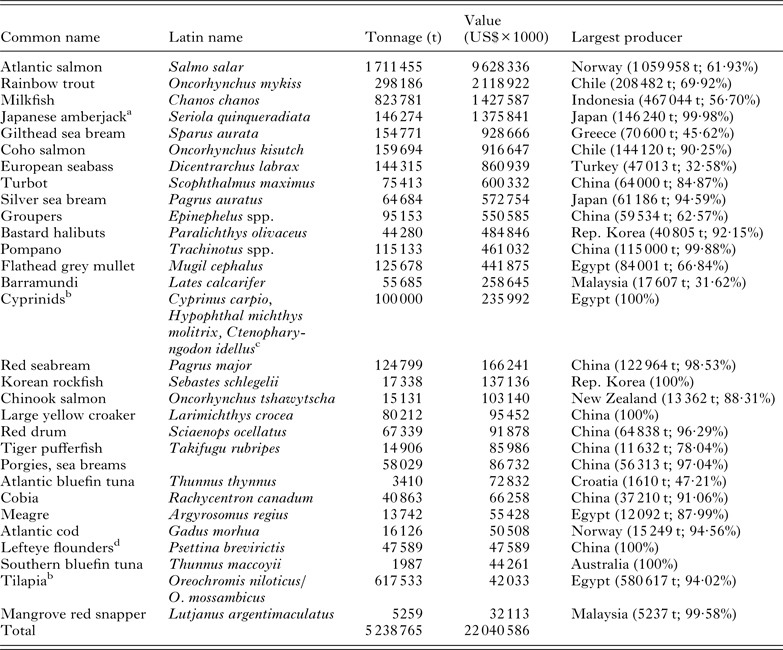
Table 2. The top 30 marine and brackish finfish aquaculture industries ranked by the value of production. Figures are predominantly derived from the FAO Fisheries and Aquaculture FishStatJ databases (2011)
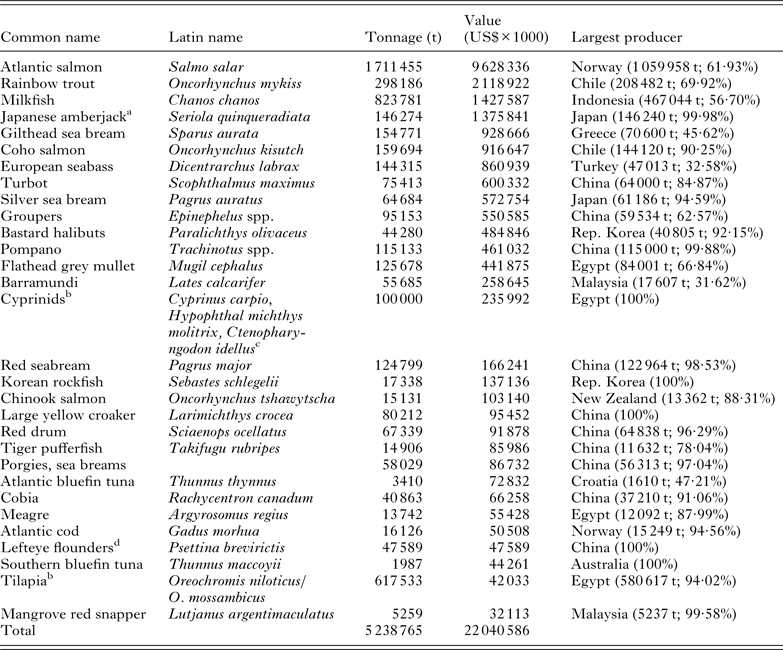
a Australian production figures are missing from FAO FishStatJ databases.
b As this table includes all species cultured in brackish and marine waters, species cultured in inland brackish waters are included for completeness.
c See Sadek (Reference Sadek, Crespi and Vovatelli2011).
d In the absence of a Latin name it is not known whether this generic term refers the culture of Psettina brevirictis or Paralichthys olivaceus, which is known as the bastard halibut, olive or Japanese flounder, given this uncertainty it is listed separately in the table.
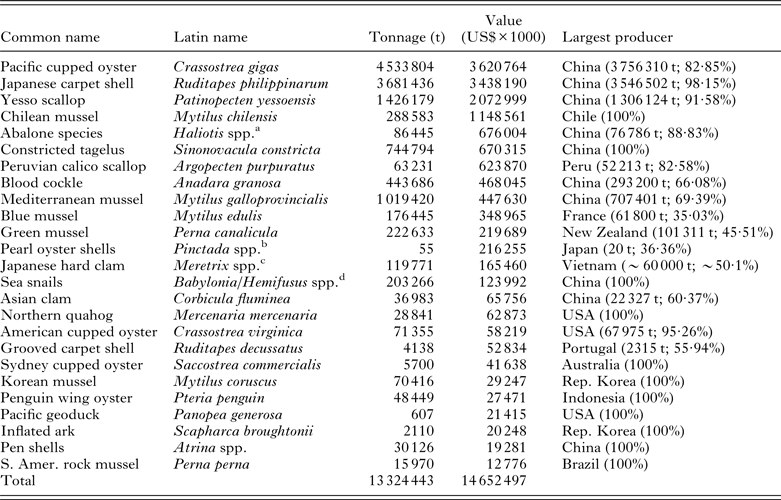
Table 3. The top 25 farmed marine molluscan species ranked by the value of their respective industry. Data are extracted from the FAO FishStatJ database of production figures for 2011 and are based on the identifiable stocks. Although a number of additional high value, general classes of mollusc that are listed by country also appear within the database, the species composition of some of these cannot be determined and so are not included in the listing below
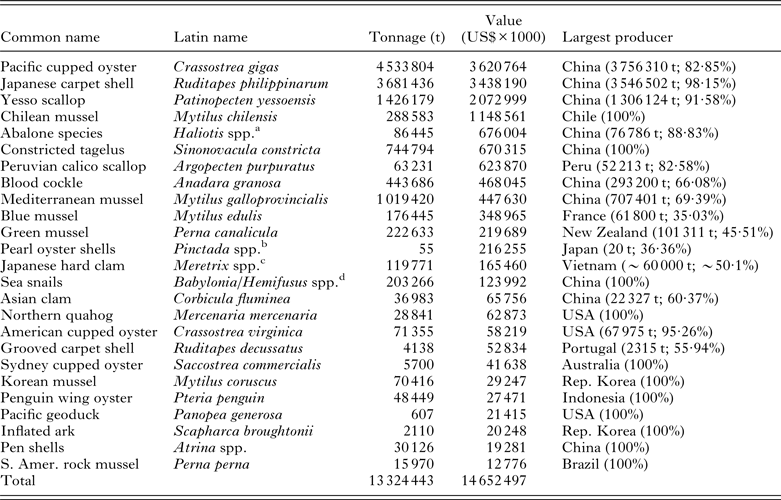
a Consists of a number of species, including Haliotis discus hannai, H. diversicolor, H. midae, H. rubra and H. rufescens.
b Principally Pinctada fucata martensii and P. margaritifera.
c Figures consist of ~50% Taiwanese Meretrix lusoria and the 50% Vietnamese M. lyrata and M. meretrix.
d Consists of a number of species, including Babylonia areolata, B. lutosa, B. formosae and Hemifusus ternatanus and H. tuba.
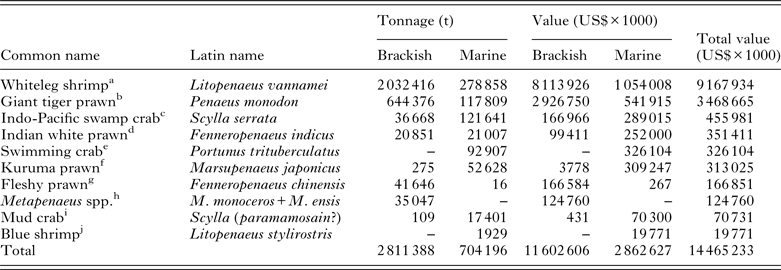
Table 4. The top 10 farmed crustacean species ranked by the value of their respective industry. Figures are generated from the FAO FishStatJ databases and are based on identifiable stocks
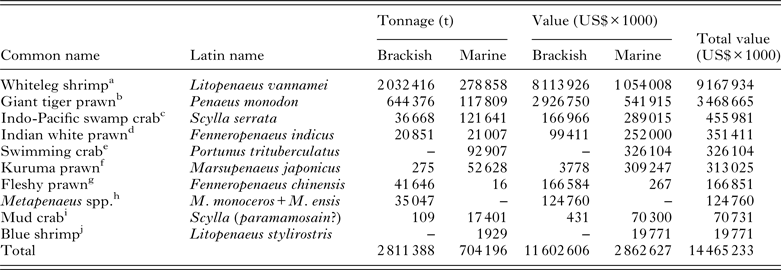
a China is the largest brackish producer at 665 588 t; Mexico the largest marine producer at 106 886 t. FAO FishStatJ allocate 76 507 t of Chinese marine-farmed shrimp to ‘marine Penaeus’, it is believed that this may represent China's L. vannamei production and has been included within the marine figures.
b Vietnam is the largest brackish producer at an estimated 300 000 t; China the largest marine producer at 60 691 t.
c Philippines is the largest producer of crabs in brackish waters at 15 731 t; China the largest marine producer at 121 458 t.
d Bangladesh is the largest brackish producer at 2364 t; Saudia Arabia the largest marine producer at 21 000 t.
e China is the only producer listed.
f Taiwan is the largest brackish producer at 178 t; whilst China the largest marine producer at 50 991 t.
g China is the largest brackish producer at 41 646 t; Korea the largest marine producer at 16 t.
h Bangladesh is the largest producer of identifiable Metapenaeus shrimp at 17 777 t.
i Taiwan is the only brackish producer at 109 t; China the only nation producing mud crabs in marine waters in 2011 with an annual production of 17 401 t.
j Limited information available.
Table 5. Other important cultured marine species. These figures are generated from the FAO FishStatJ databases and are based on identifiable stocks

a Limited information available on species that are being cultured.
Table 6. The top 12 marine ornamental fish species, for which some commercial production units could be identified that were imported into the USA with details on their average retail price and estimated trade value. As numbers for global production are unknown, here we use numbers imported into the USA during the period May 2004–May 2005 as presented by Rhyne et al. (Reference Rhyne, Tlusty, Schofield, Kaufman, Morris and Bruckner2012) as an indication of the potential size of each industry. Species are ranked by their estimated economic value based on their average retail prices (min. n = 3). Common names are taken from the Ornamental Fish International website (http://www.ornamental-fish-int.org/)
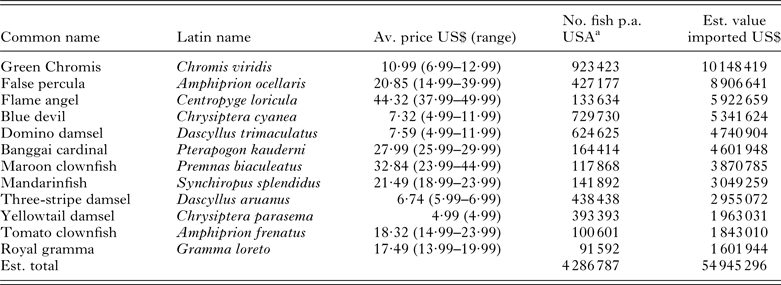
a Figures extrapolated from the graphics presented in Rhyne et al. (Reference Rhyne, Tlusty, Schofield, Kaufman, Morris and Bruckner2012).
Estimates of parasite-induced loss
The species rankings provided in Tables 2–6 were then used as a basis for identifying the principal parasite threats that have been reported to have resulted in economic loss. In addition to reporting the estimates of loss cited in peer-reviewed and grey literature accounts, we also provide estimates of direct fish loss based on the information given in the published record (i.e. number, size or age class of aquatic animals, tonnage, number of net-pens/culture systems affected, etc.) and the value (US$ kg−1) of the mariculture stock using a combination of the FAO FishStatJ statistics (value divided by tonnage) for the corresponding year of the loss. These latter figures, however, are for harvested, unprocessed stock. The age of stock affected is then corrected for using one of the relevant species listed in Table 7 and assuming a linear increment in the value of stock from the cost per juvenile to harvest-sized stock and a 100% probability of survival to harvest. Additional assumptions relevant to the loss, where appropriate, are provided as part of the entry in Tables 8–12.
Table 7. Production details for a range of fish species that are used, in part, for the estimations of loss

Across Eur prod, figures derived from European producers; ad, adult; juv, juvenile.
Table 8. The estimated economic cost of notable protistan and metazoan parasite events on some of the world's leading marine and brackish water finfish production industries. For each industry, protistans and metazoans are grouped separately and are listed alphabetically within each. The order in which the finfish aquaculture industries are listed is based on their global economic value in 2011 according to FAO statistics and the rank order provided in Table 2. For each parasite-induced event, brief details are provided and an estimate of loss, where possible, has been calculated. Although ‘cyprinids’ cultured in brackish water are listed in Table 2, it is not possible to identify all the species that are embraced within this and as such are not considered here


a Encompasses a complex of caligid species.
b There is an ongoing debate as to whether Neobenedenia girellae and N. melleni represent separate discrete species or should be accepted as N. melleni.
c Given the importance of salmonids in global marine aquaculture Chum and pink salmon are included here.
RESULTS
Ranking of aquaculture industries
The world's leading aquaculture industries derived from FishStatJ for 2011 are ranked in Tables 2–6 by their market value. These tables include 69 of the 222 unique aquatic animal categories listed in the database and account for approximately 94% (i.e. 22 305 887 t) of the total weight of marine animals produced (i.e. 23 832 381 t) and 93% (i.e. US$ 51 849·962 M) of their total value (i.e. US$ 55 781·97 M). The database, however, also includes a number of general categories, e.g. ‘aquatic invertebrates nei’, ‘marine fishes nei’, which potentially embrace a large number of species that are produced in small volumes. The total number of aquatic animals that are reared under brackish and marine aquaculture conditions is, therefore, likely to have been substantially underestimated here. Table 6 ranks the 12 most popular marine aquarium species, for which a commercial production unit could be identified, by their estimated retail value based on numbers imported into the USA (see Rhyne et al. Reference Rhyne, Tlusty, Schofield, Kaufman, Morris and Bruckner2012).
Tables 8–12 provide a summary of notable parasite-induced events with estimates of the costs incurred.
Table 9. The estimated economic cost of parasitic infections on the world's leading mollusc production industries. For each parasite-induced event, brief details are provided and an estimate of loss, where possible, has been calculated

In 2011, global aquaculture production was 83 729 313 t (all species) of which 44 734 400 t (i.e. 53·43%) were produced in brackish or marine waters (see Table 1). Global aquaculture has increased at a rate of 6·4% year-on-year over the past five years and by 7·2% over that produced in 2010. By comparison, brackish–marine production has increased by 5·7% (over the past five years) and 6·6%, respectively. Of this, Asia produces 39 542 391 t (i.e. 88·39%), although brackish–marine algae represent over half (i.e. 52·46%, 20 743 150 t) of this. In this study, the top 30 fish species listed in Table 2 account for 89·89% by production tonnage of all brackish/marine aquaculture species that were produced in 2011. Likewise, the top 25 molluscs provided in Table 3 account for 94·04% of what was produced and the top 10 crustacean species given in Table 4 for 99·44%.
DISCUSSION
The data presented in Tables 8–12 provide a basic review of some of the major parasite events experienced by these production industries and, where possible, ascribe an estimate of the resultant loss where not given in the original work. The tables show that there are elements of both predictability and unpredictability in infection events with elements of both certainty and uncertainty in the consequential economic losses. There are, for example, perennial costs associated with the management of and mitigation against salmon lice, L. salmonis, and other caligid species. Despite the apparent rise in the cost of ‘sea lice control’ in Norway, for example, from US$ 33·4 M p.a. in 1996 (Kvenseth, Reference Kvenseth1997) to US$ 206 M p.a. in 2009 (Costello, Reference Costello2009), production over the same period increased by 248% from 297 557 t (1996) to 737 694 t (2008), and yet the price of salmon increased by only 20% (US$ 3·08–3·71 kg−1). During this time, there have also been significant improvements in salmon welfare, and the number of sea lice-related mortalities and the number of fish downgraded as a consequence of sea lice damage has fallen dramatically. To achieve this, the basic costs of sea lice control have increased from 3·64% (1996) of total production costs to 7·53% (2008). As sea lice pose a relatively consistent threat to sea-caged populations of Atlantic salmon, infection can be predicted and, therefore, factored into farm business plans and farm-level treatment strategies. In addition, area management agreements, which form part of national strategies for the control of lice in some countries, e.g. Scotland and Norway, can prompt additional treatments for the area-level management of lice infections. If these are not conducted or the mean lice burden exceeds agreed national threshold levels, then penalties can be imposed in some countries, e.g. Norway (Tallaksen, Reference Tallaksen2013).
An analysis of unpublished data by the current authors suggests that parasites account for an annual loss of 5·8–16·5% (i.e. US$ 62–175 M; assuming £1 = US$ 1·6) of the value of UK aquaculture production (across all species in both freshwater and marine systems). Although the FishStatJ database lists 17 farmed species for the UK in 2012, parasite-associated losses were largely dominated by the impact of AGD and mitigation strategies against sea lice on the Atlantic salmon industry. Although these estimates are only for UK losses and do not include losses due to bacterial and viral pathogens, they can still be considered low when compared with anecdotal reports suggesting that typical disease losses for certain aquaculture industries in Asia range from 30 to 50%. A significant proportion of these latter losses is attributable to the loss of juvenile stock within the hatchery/nursery phases of production, and for many industries, such losses are commonly factored into and accepted as part of typical production cycles. As a consequence of such fatalistic acceptance of their inevitability, the ubiquity of low-specificity pathogens in some warm-water aquaculture systems and the small-scale nature/lack of diagnostic capacity of some production enterprises, losses are typically underreported, hiding the severity and true impact of certain parasites, e.g. Amyloodinium, Cryptocaryon and Trichodina spp.
Some parasitic diseases, whose continuous or predictably repeated infection levels and difficulty of treatment have caused major economic impacts, have driven particular industries to the point of near collapse. The impact that a kinetoplastid protist responsible for soft tunic syndrome has had on the ascidian Halocynthia roretzi industry throughout South Korea and Japan is an appropriate example (Kumagai et al. Reference Kumagai, Suto, Ito, Tanabe, Song, Kitamura, Hirose, Kamaishi and Miwa2011). In Korea, infections have resulted in a serious decline in the industry from 42 800 t (valued at US$ 34·17 M) in 1994 to just 4500 t (worth US$ 8·92 M) in 2004 (Kumagai et al. Reference Kumagai, Suto, Ito, Tanabe, Takahashi, Kamaishi and Miwa2010; FAO FishStatJ, 2013). Assuming that the 1994 levels of production could have been maintained in the absence of the flagellate, then it can be estimated that infections have cost the Korean industry approximately US$ 764 M between 1994 and 2011 (Table 10). Infections at three Japanese farms were subsequently reported in 2007, which rose to 14 farms in 2009 (Kumagai et al. Reference Kumagai, Suto, Ito, Tanabe, Takahashi, Kamaishi and Miwa2010).
Table 10. The estimated economic cost of notable protistan and metazoan parasite events on the 10 leading crustacean marine and brackish water-based aquaculture industries

Many of the instances of parasite infection provided in Tables 8–12 are derived from case reports for unexpected mortality events. These represent sporadic parasite infection events that have resulted in significant economic losses at a single or small number of sites or within a single season. For example, a Uronema nigricans infection of ranched southern bluefin tuna, Thunnus maccoyii, in Australia resulted in the loss of between 5 and 10% of stock, worth an estimated US$ 0·5–1 M (Munday et al. Reference Munday, O'Donoghue, Watts, Rough and Hawkesford1997). This illustrates that it is impossible to control parasite exposure in the wild phase, with stock typically belonging to mixed age classes and sizes and ranging over a wide area. As there is no standard crop, disease events are, thus, extremely unpredictable.
Many of the smaller magnitude, sporadic mortality events can be attributed to some of the less specific diseases, which can result from low water quality or poor fish handling and welfare and that might, therefore, be ameliorated simply through improved husbandry practices. Although most of these disease events go unreported, either because of the smaller scale of the losses incurred or the general acceptance that they fall within the typical, accepted margins of loss in production, their collective impact on global mariculture production is significant, and the value of fish lost may arguably exceed the economic impact of many of the major parasite pathogens listed in Tables 8–12. Deterioration in water quality can occur through overstocking, inappropriate feeding regimes, low water current speeds/poor flushing or generally poor site hygiene practices. For example, net fouling can result in organic enrichment within culture systems, facilitating the increase of many opportunistic species, which, if unregulated and unmanaged, can result in health impacts due to infection by low-specificity pathogens, e.g. Trichodina spp., Zoothamnium spp. Heavily biofouled cage nets can cause reduced flow-through rates resulting in increased retention times of infective stages, net deformation and welfare impacts for caged stock (Lader et al. Reference Lader, Dempster, Fredheim and Jensen2008). Decreased flow rates can also result in lower dissolved oxygen and increased ammonia levels and in extreme events, the asphyxiation of stock (Douglas-Helders et al. Reference Douglas-Helders, Tan, Carson and Nowak2003; Madin et al. Reference Madin, Chong and Hartstein2010). Fouled nets may also serve as a reservoir for pathogenic agents such as Paramoeba (syn. Neoparamoeba) pemaquidensis (see Tan et al. Reference Tan, Nowak and Hodson2002) and the polyopisthocotylean monogenean Heterobothrium okamotoi, which infects the gills of the tiger puffer, Takifugu rubripes, reared in floating cages. These flukes are extremely fecund with up to 1500 eggs in utero producing 50–360 spindle-shaped eggs per day that are extruded in strings of up to 2·8 m in length (Ogawa, Reference Ogawa1997; Ogawa and Inouye, Reference Ogawa and Inouye1997; Ogawa et al. Reference Ogawa, Yamabata and Yoshinaga2005a ). These egg strings readily become entangled within the nets representing a source of reinfection that requires regular net changes to minimise the infection of stock (Ogawa and Inouye, Reference Ogawa and Inouye1997; Ogawa and Yokoyama, Reference Ogawa and Yokoyama1998; Ogawa, Reference Ogawa1999; Ogawa et al. Reference Ogawa, Yamabata and Yoshinaga2005a ).
Looking through the timeline of parasite episodes, notably those detailed in Table 8, it is interesting to examine some of the underlying husbandry practices that were either directly responsible for or facilitated disease events and to consider whether the magnitude of the subsequent losses may have provided an impetus for change. Some of the earlier reports allude to the use of trash fish feed, e.g. Kudoa amamiensis in Japanese amberjack, S. quinqueradiata (see Egusa and Nakajima, Reference Egusa and Nakajima1978); the lack of health screening prior to the movement of stocks to new sites, e.g. the establishment of Neobenedenia girellae and Paradeontacylix infections on Japanese populations of farmed greater amberjack, Seriola dumerili (Ogawa and Egusa, Reference Ogawa and Egusa1986; Ogawa and Fukudome; Reference Ogawa and Fukudome1994; Ogawa et al. Reference Ogawa, Bondad-Reantaso, Fukudome and Wakabayashi1995); improvements following the implementation of fallowing and site rotation, e.g. resulting in improved management of L. salmonis including a lower number of treatment interventions (Bron et al. Reference Bron, Sommerville, Wootten and Rae1993; Grant and Treasurer, Reference Grant, Treasurer, Boxshall and Defaye1993); a shift away from the use of multi-year class sites to an ‘all in, all out’ single-year class approach (Bron et al. Reference Bron, Sommerville, Wootten and Rae1993); and evident improvements in fish welfare practices, e.g. lower morbidity and mortality rates from U. nigricans in ranched tuna (Munday et al. Reference Munday, Sawada, Cribb and Hayward2003). The risks of infection from mixed-species sites have also been previously commented upon (Vagianou et al. Reference Vagianou, Athanassopoulou, Ragias, Di Cave, Leontides and Golomazou2006).
There are, however, a number of concerns associated with the expansion of global aquaculture, much of which is concentrated within the coastal zone, and the potential for an increased incidence of disease events. The human population is set to reach 9·55 billion by 2050 (United Nations, 2012) and there is a general migration towards coastal zones resulting in increasing population density (e.g. in 2000, 53% of the US population resided in 17% of the land area designated as coastal with an expected 24·4% increase in the size of the population residing in the US coastal states between 2000 and 2025 (Boesch et al. Reference Boesch, Field and Scavia2000)), and as a consequence of increased anthropogenic activity along the coastal zone, there will be increase in the levels of nutrients passing into local marine ecosystems and the impacts that these have upon the general marine environment and aquaculture in particular (Halpern et al. Reference Halpern, Walbridge, Selkoe, Kappel, Micheli, D'Agrosa, Bruno, Casey, Ebert, Fox, Fujita, Heinemann, Lenihan, Madin, Perry, Selig, Spalding, Steneck and Watson2008; Callaway et al. Reference Callaway, Shinn, Grenfell, Bron, Burnwell, Cook, Crumlish, Culloty, Davidson, Ellis, Flynn, Fox, Green, Hays, Hughes, Johnston, Lowe, Lupatsch, Malham, Mendzil, Nickell, Pickerel, Rowley, Stanley, Tocher, Turnbull, Webb, Wootton and Shields2012). Likewise, the greater globalisation of the trade in aquatic animals and their products, reviewed in Bondad-Reantaso et al. (Reference Bondad-Reantaso, Subasinghe, Arthur, Ogawa, Chinabut, Adlard, Tan and Shariff2005), may facilitate the spread of pathogens into new environments. At the same time, in an era of changing climatic conditions, there will be alterations to land run-off, coastal water chemistry/temperature and changes in sea levels and oceanic/coastal currents all of which will have anticipated impacts on current aquaculture production practices, aquaculture systems, the interactions between wild and farmed aquatic stocks, parasite life cycles, transmission pathways and the prevalence and severity of disease events (Overstreet, Reference Overstreet2007; Callaway et al. Reference Callaway, Shinn, Grenfell, Bron, Burnwell, Cook, Crumlish, Culloty, Davidson, Ellis, Flynn, Fox, Green, Hays, Hughes, Johnston, Lowe, Lupatsch, Malham, Mendzil, Nickell, Pickerel, Rowley, Stanley, Tocher, Turnbull, Webb, Wootton and Shields2012). Cook et al. (Reference Cook, Folli, Klinck, Ford and Miller1998) and Hofmann et al. (Reference Hofmann, Ford, Powell and Klinck2001), for example, demonstrate links between increasing sea temperatures and the spread of Perkinsus marinus and Haplosporidium nelsoni, respectively, in the eastern oyster, Crassostrea virginica, as do Bermingham and Mulcahy (Reference Bermingham and Mulcahy2004) who indicate that temperature is also an important risk factor in the incidence of amoebic gill disease. Although raised temperature profiles may accelerate the life cycle of some aquatic pathogens, it may also lead to the decreased prevalence of others as certain parasite species move out of their temperature optima. At the same time, increased water temperatures may preclude the use of certain drug treatment regimes requiring the development of novel strategies for the management and control of parasite pathogens (see Shinn and Bron, Reference Shinn, Bron and Austin2012).
This study provides a review of the top 69 aquatic species cultured in brackish and marine waters, which accounted for ~94% of the total tonnage derived from mariculture in 2011 and then provides estimates for losses incurred as a consequence of key parasite-associated disease events reported worldwide. Although it has not been possible to provide a single resolved value for the economic impact of parasites on global mariculture, this study clearly demonstrates that parasitic infections remain an important source of economic loss. Without a step-change in management priorities and a concerted move towards more IPMS, it is evident that as the global aquaculture industry grows and intensifies, the level of parasite infections will similarly rise as will the attendant economic costs of parasitism.
Table 11. The estimated economic cost of notable protistan and metazoan parasite events on other large-scale commercial aquaculture industries.
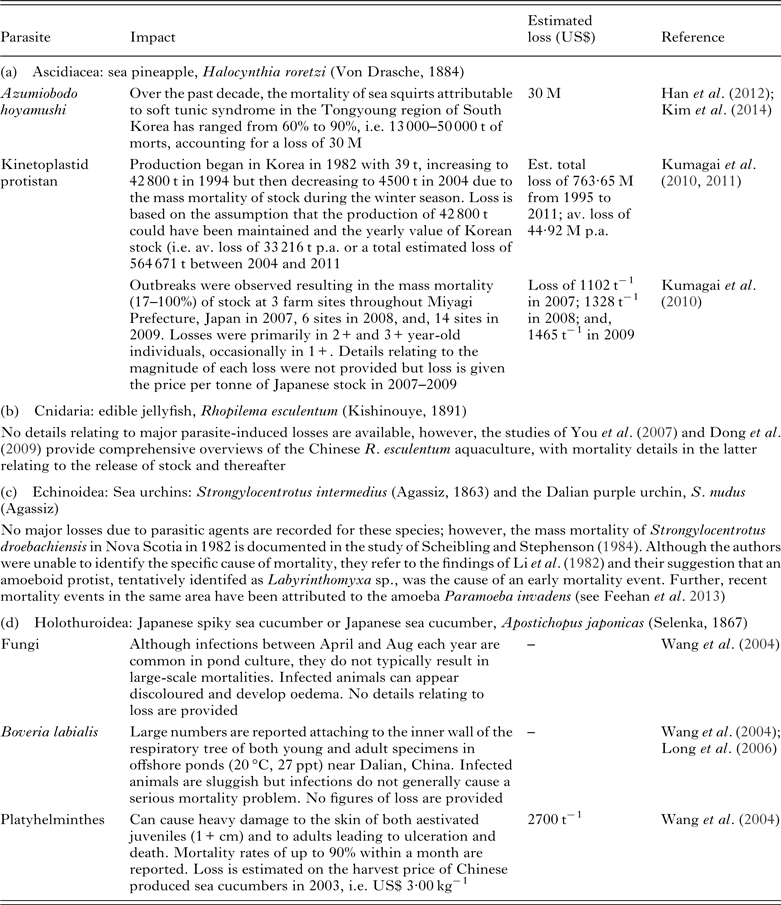
Table 12. The estimated economic cost of notable protistan and metazoan parasite events on some of the world's leading marine and brackish water ornamental fish production industries

ACKNOWLEDGEMENTS
The authors would like to thank Mr Wenbo Zhang from the Institute of Aquaculture, University of Stirling, UK for his kind assistance in providing additional information on Chinese production; Mr Kevin Erickson, the Vice President of the Marine Aquarium Societies of North America (MASNA) for useful discussions on commercially reared ornamental species; and, Ms Jocyntha Joseph from the Asian Fisheries Society (http://www.asianfisheriessociety.org/) for providing scientific articles. The views expressed in this article are those of the authors and do not necessarily represent the views of, and should not be attributed to, the Fish Vet Group/Benchmark Holdings PLC, the Institute of Aquaculture, University of Stirling, UK or the Institute of Marine Science, Burapha University, Thailand. There was no funding received to support this study. It was an invited paper and worked on in free time.


