


Introduction
The course that an infection takes – in terms of its within-host dynamics, disease severity and the likelihood of onward transmission – can vary dramatically across hosts infected with the same parasite species. This variation is the consequence of potentially many factors, including influences of the environment (e.g. Nacher et al., Reference Nacher, Singhasivanon and Vannaphan2001; Lazzaro and Little, Reference Lazzaro and Little2009; Bichet et al., Reference Bichet, Larcombe, Faivre and Sorci2014), the genetics of the host and/or parasite (e.g. Abel and Desseint, Reference Abel and Desseint1997; Miller et al., Reference Miller, Baruch, Marsh and Doumbo2002) and of general host health (e.g. Laishram et al., Reference Laishram, Sutton, Nanda, Sharma, Sobti and Carlton2012; Aparecida et al., Reference Aparecida, Neto, De Paula, Tolardo and Yokosawa2014). Two such factors that have received considerable attention are the initial infectious dose and the presence of co-infecting parasites.
Initial infectious dose plays a role in determining the likelihood of an infection establishing. When an individual is exposed to the infectious stages of a parasite, the parasite will deploy mechanisms to invade and establish within host tissues, whereas the host's immune system will work to combat these invasion mechanisms. Only some of the invading infectious stages will successfully establish. If the individual infectious stages act independently, then the likelihood of infection will increase linearly with infectious dose, but if infectious stages work synergistically (e.g. by secreting immunomodulatory molecules that act systemically to weaken host defenses), the relationship between infectious dose and infection may be non-linear (Brunner et al., Reference Brunner, Richards and Collins2005; Schmid-Hempel and Frank, Reference Schmid-Hempel and Frank2007; Zwart et al., Reference Zwart, Daròs and Elena2011). Infectious dose may also influence the virulence (or disease-induced damage) of the infection. For many diseases, damage is related to the number of parasite stages using host resources: the higher the infectious dose, the more parasite stages that are exploiting those host resources (McKenney et al., Reference McKenney, Kurath and Wargo2016). Higher numbers of parasites can also impact the time it takes for a host to mount an immune response, the type of immune response generated and the effectiveness of that immune response (Marois et al., Reference Marois, Cloutier, Garneau and Richter2012). In combination, these impacts of infectious dose can affect if – and how rapidly – the host is able to clear and recover from an infection.
Similarly, the presence of co-infecting parasites can alter the course of an infection in multiple ways. For example, co-infections may influence within-host dynamics via competition for resources, or by changing the host immune response to infection (bottom-up and top-down effects of co-infection, respectively; Pedersen and Fenton, Reference Pedersen and Fenton2007). These within-host changes can in turn impact the health consequences of infection for the individual host, since host morbidity and mortality are tied closely to the way and extent to which parasites use host resources, the effectiveness of host immunity and the duration of infection (Cox, Reference Cox2001). Finally, these within-host consequences of co-infection can scale up to change between-host parasite transmission by altering the number of infectious transmission stages produced by an infected host and the duration of infectiousness (Ezenwa et al., Reference Ezenwa, Etienne, Luikart, Beja-Pereira and Jolles2010).
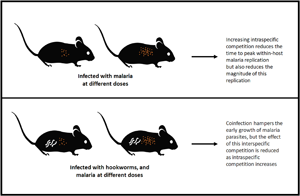
The impacts of infectious dose and co-infection are unlikely to work in isolation: the effects of dose on infection establishment, virulence and host immune response may all be modulated by the presence of a co-infecting parasite, with implications for individual host health and onward transmission. We investigated the within-host consequences of the interaction between initial infectious dose and co-infection in a mouse malaria system. Specifically, we looked at interactions between malaria parasites and Nippostrongylus brasiliensis, a blood-feeding nematode of rodents that limits host red blood cells (RBCs) at every stage of its within-host life cycle (Bouchery et al., Reference Bouchery, Filbey, Shepherd, Chandler, Patel, Schmidt, Camberis, Peignier, Smith, Johnston, Painter, Pearson, Giacomin, Loukas, Bottazzi, Hotez and LeGros2018), and thus competes with malaria parasites (Plasmodium chabaudi chabaudi) for resources. These two parasites also interact via the immune system, since qualitatively different adaptive immune responses (especially T-helper subsets) are required to combat helminths compared with malaria parasites, and these immune responses are mutually inhibitory (Cox, Reference Cox2001; Peron et al., Reference Peron, de Thomaz, Camargo da Rosa, Thome and Verinaud2018). However, resource-mediated competition is thought to be more important in governing malaria-hookworm dynamics than immunomodulation in both murine and human hosts (Griffiths et al., Reference Griffiths, Fairlie-Clarke, Allen, Metcalf and Graham2015; Budischak et al., Reference Budischak, Wiria, Hamid, Wammes, Kaisar, van Lieshout, Sartono, Supali, Yazdanbakhsh and Graham2018). Indeed, even a small (<5%), transient reduction in RBCs due to helminth infection appears to suppress the growth of malaria parasites, a somewhat surprising inference given that malaria parasites themselves can reduce the host's RBC population by 50% or more (Griffiths et al., Reference Griffiths, Fairlie-Clarke, Allen, Metcalf and Graham2015). Finally, the initial dose of malaria parasites has also been shown to impact within-host malaria dynamics by influencing the duration of infection, the timing of peak parasite density and parasite clearance, and the strength of host immune responses (Timms et al., Reference Timms, Colegrave, Chan and Read2001; Haydon et al., Reference Haydon, Matthews, Timms and Colegrave2003; Metcalf et al., Reference Metcalf, Graham, Huijben, Barclay, Long, Grenfell, Read and Bjørnstad2011).
We analysed RBC count data from a previously published dataset on dose-dependence of immune response during N. brasiliensis–P. chabaudi co-infection (Fairlie-Clarke et al., Reference Fairlie-Clarke, Hansen, Allen and Graham2015) using two different approaches. First, we used a statistical time-series framework (Metcalf et al., Reference Metcalf, Graham, Huijben, Barclay, Long, Grenfell, Read and Bjørnstad2011, Reference Metcalf, Long, Mideo, Forester, Bjørnstad and Graham2012) to estimate several metrics of within-host dynamics over the course of infection, including the cell-to-cell propagation of malaria parasites and host manipulation of RBC numbers. Although this approach is agnostic about underlying mechanisms, it allowed us to test the hypotheses that (1) within-host propagation would increase with increasing infectious dose of malaria parasites, (2) the timing of peak propagation would be expedited with increasing infectious dose and (3) co-infection with anaemia-inducing helminths would dampen the propagation of malaria parasites. Second, we fitted a mathematical model of within-host infection dynamics, which explicitly includes RBC production and immune responses (similar to Kamiya et al., Reference Kamiya, Greischar, Schneider and Mideo2020), to the data in order to reveal the processes that are plausibly governing the patterns observed in the first analysis. The two approaches differ dramatically in model complexity, strength and number of biological assumptions and computational difficulty. Yet, the two approaches uncover similar patterns in the data and offer complementary explanations with different resolutions on the underlying processes that generate those patterns. In addition to elucidating the combined effects of co-infection and initial malaria dose on within-host malaria infection dynamics, we discuss the value and utility of the two approaches used here.
Methods
Data
The data analysed here were previously published as part of a wider immunological investigation, for which the methods are described in full (see Fairlie-Clarke et al., Reference Fairlie-Clarke, Hansen, Allen and Graham2015). Briefly, specific pathogen-free BALB/c mice were infected with P. chabaudi chabaudi malaria parasites (clone AS) at varying doses (103, 104, 105 or 106), in isolation or in combination with hookworms [N. brasiliensis; 200 third stage ‘L3’ larvae administered on the same day (day 0) as malaria]. Daily measurements were then taken over the course of 11 days for RBC density, body mass and proportion of RBCs parasitized by malaria (Fairlie-Clarke et al., Reference Fairlie-Clarke, Hansen, Allen and Graham2015). Antibody titres were also measured on day 11. Since time series of immune responses were not available, here we focus our analyses on the available dynamics of RBCs and infected RBCs. The original experiment included 16 mice per treatment group, with seven mice excluded from the analyses due to unsuccessful infection or substantial deviations in infection dynamics (presumably due to realized doses that differed from intended). We exclude those same time series here, so across doses 103, 104, 105 and 106 the resulting samples sizes are 16, 15, 15 and 16 in single infections and 13, 16, 15 and 15 in co-infections, for a total of 121 individual time series.
Statistical modelling approach
In a first analysis, we made as few assumptions as possible about the processes governing infection dynamics. By focusing on daily counts of RBC and infected cell densities and using a time-series framework (Metcalf et al., Reference Metcalf, Graham, Huijben, Barclay, Long, Grenfell, Read and Bjørnstad2011), we estimated the propagation of infected cells through time. Specifically, the expected density of infected RBCs at time t + 1 is given by

where S t and I t are the susceptible and infected cell densities in the previous time step, and P e,t is the effective propagation number at that time step. P e,t is analogous to the transmission co-efficient in between-host models of infection. Here, it represents within-host transmission of parasites between RBCs and is the product of burst size (i.e. the number of progeny parasites, or merozoites, produced from a given infected cell), contact rates between merozoites and susceptible RBCs and the likelihood of invasion given a contact (Metcalf et al., Reference Metcalf, Graham, Huijben, Barclay, Long, Grenfell, Read and Bjørnstad2011). We note that this discrete-time framework is appropriate for P. chabaudi, which bursts from infected cells roughly synchronously, every 24 h. Log-transforming equation (1) allowed us to use regression techniques to estimate P e,t for each treatment from our time-series measurements of S t and I t, as has been done previously (Metcalf et al., Reference Metcalf, Graham, Huijben, Barclay, Long, Grenfell, Read and Bjørnstad2011).
The maximum value of P e,t (i.e. P e,max) was taken as reflecting peak cell-to-cell propagation of malaria parasites. From this quantity, we could obtain an estimate of how many infected cells we would expect in a given time step if parasites were maximally propagating, given the availability of susceptible RBCs. Because infected cells are lysed by the malaria parasites and are not expected to survive to the next time-step, any deviation in the observed number of infected cells indicates the effects of immunity on malaria parasite population growth, or other changes in parasite population growth rate that cannot be attributed to the availability of target cells at the previous time step. This deviation is captured in a survival term, p t, such that

Rearranging equation (2), the fraction of infected RBCs that fail to survive immune responses can be expressed as 1 − p t, where

and where these responses may include direct immune killing of malaria parasites (both in infected RBCs or free merozoites), and RBC resistance to invasion. Put simply, when 1 − p t is zero, parasites are propagating maximally, while if 1 − p t approaches 1, parasites are failing to propagate due to immune effects. We calculated 1 − p t separately for each host, using individual-level RBC and infected cell densities and the treatment-level P e,max estimates.
Finally, we estimated the change in RBCs that is not due to the action of malaria parasites, b t, as

This metric captures changes in the number of RBCs in circulation – and therefore available to malaria parasites – due to host responses, like splenic retention, changes to RBC production or immune killing of infected and uninfected RBCs (Haydon et al., Reference Haydon, Matthews, Timms and Colegrave2003; Mideo et al., Reference Mideo, Barclay, Chan, Savill, Read and Day2008a, Reference Mideo, Savill, Chadwick, Schneider, Read, Day and Reece2011; Metcalf et al., Reference Metcalf, Long, Mideo, Forester, Bjørnstad and Graham2012; Wale et al., Reference Wale, Jones, Sim, Read and King2019). In the co-infected groups, alterations to b t might also be driven by the helminth reducing the number of susceptible cells available.
These analyses were performed in R version 3.5.0, with R Studio, Version 1.1.456 – © 2009–2018 RStudio, Inc. An annotated copy of our code is available in the Supplementary materials.
Mechanistic modelling approach
In a second analysis, we refined a previously developed mechanistic model of within-host malaria infection dynamics (Kamiya et al., Reference Kamiya, Greischar, Schneider and Mideo2020) and fit it to the data to identify plausible mechanisms for explaining the patterns observed with our statistical approach. We describe the model fully below, but briefly two key features differentiate the version we use here from that which was previously published. First, we track dynamics in discrete, rather than continuous, time for improved computational efficiency. As a result, we assume that immune killing is fast relative to the timescale of RBC demographic turnover. Second, we capture immune killing as rates rather than proportional activity for ease of interpretation.
The model tracks the dynamics of uninfected, R, and infected, I, RBCs. [We retain the nomenclature of the studies from which our work builds (Metcalf et al., Reference Metcalf, Graham, Huijben, Barclay, Long, Grenfell, Read and Bjørnstad2011; Kamiya et al., Reference Kamiya, Greischar, Schneider and Mideo2020), so some variable names differ between approaches despite representing the same measure.] Two additional variables, N 1 and N 2, capture the rate of killing activity of host immune responses that target, respectively, all RBCs indiscriminately or infected RBCs specifically. We use t to track time as fractions of a day, thus immune responses are active from 0 < t ≤ 1, while turnover of RBCs, bursting of infected cells and reinvasion by parasites happens at midnight, t = 1.
The change in the activity of immune responses is governed by

assuming that parasites stimulate immune responses, and that maximum stimulation occurs for the maximum infected cell density observed for any individual in the dataset (I max = 1.223 × 10⁶ cells μL−1 of blood). Immune response activation is determined by a scaling factor, ψ i, and decay occurs with a half-life of ϕ i, similarly to Kochin et al. (Reference Kochin, Yates, De Roode and Antia2010). Here, we employ a separation of timescales, by assuming that I = I t=0 and is constant during the time scale of immune activity. This allows us to solve equation (5), which gives

At midnight (t = 1), RBC turnover and invasion by parasites occurs. Prior to invasion by parasites, the densities of uninfected and infected RBCs are


The first terms in equations (7) and (8) capture losses of RBCs. All cells, regardless of infection status, die at a background rate, $\mu _R^{\prime}$ . The prime captures the fact that while a strong prior on background death of RBCs exists for uninfected mice (μ R; Van Putten and Croon, Reference Van Putten and Croon1958; Foster et al., Reference Foster, Small and Fox2014), we allow this rate to vary – independently of parasite densities – in infections. Indiscriminate killing of RBCs occurs at a daily rate, N 1,t=1, while targeted immune killing of infected cells happens at a daily rate, N 2,t=1. We assume that the strength of targeted killing declines with increasing infected RBC densities and the magnitude of this decline is governed by κ, akin to a handling time. The second and third terms of equation (7) track new RBC production. In the absence of infection, hosts replenish cells lost due to natural mortality, which is captured by the term $R_{\rm c}( {1-{\rm e}^{-\mu_R}} )$
 , where R c is the homoeostatic equilibrium RBC density (set to the RBC density at day 0 for individual mice). Finally, the third term allows for increased production as total RBC density deviates from R c due to infection and immune killing. We assume that the host can replenish a fraction, ρ, of this deviation per day and that new RBCs take two days to mature before entering the bloodstream (hence, the deviation is measured at d − 2; Savill et al., Reference Savill, Chadwick and Reece2009).
Following demographic turnover of RBCs, we assume that parasite bursting out of infected cells and new RBC invasion occur instantaneously. Assuming β new merozoites are produced, on average, by each infected cell (i.e. the burst size), then the density of merozoites, M, released into the bloodstream at midnight is βI t=1. Upon release, each merozoite will either infect an uninfected RBC at per capita rate, v, or die in the bloodstream at per capita rate μ M. Ignoring the possibility of multiple infection of a single RBC, the probability that a merozoite successfully invades an RBC is

and the average number of invading merozoites per uninfected RBC is

where ω = μ M/v. We assume that the probability of invasion by merozoites is Poisson-distributed with parameter λ (Miller et al., Reference Miller, Raberg, Read and Savill2010; Mideo et al., Reference Mideo, Savill, Chadwick, Schneider, Read, Day and Reece2011). An uninfected RBC will therefore escape invasion with a probability e−λ, while invasion with exactly one merozoite occurs with a probability λe−λ. Again ignoring multiple infections of individual cells, the densities of uninfected and infected RBCs following bursting and invasion (denoted by the asterisks) are given by


We allow eight model parameters to be, potentially, dose-dependent: the activation scaling factors (ψ 1, ψ 2) and half-life (ϕ 1, ϕ 2) of the two immune responses, the handling time of the targeted immune response (κ), the background RBC mortality during infections $( \mu _R^{\prime} )$ , the fraction of any RBC deficit that is made up in a day (ρ) and the parasite burst size (β). We refer to this parameter set as θ. We envision dose as an environmental gradient that can be captured by a linear reaction norm (Kamiya et al., Reference Kamiya, Greischar, Schneider and Mideo2020): for each parameter, θ j, we estimate an intercept, $\hat{\theta }_j$
 , and a slope, $\hat{\delta }_j$
 , describing the reaction norm with respect to dose. We allow for individual variation among mice within a dose (and single or co-infection) treatment through partial pooling. Individual-level parameters are, therefore, chosen from a common distribution with a given mean (i.e. $\hat{\theta }_j$
 and $\hat{\delta }_j$
 for the intercept and slope of a given parameter), but with individual deviations from these means given by u j,i and v j,i. These deviations are samples from a normal distribution with standard deviations, σ u,j and σ v,j, that are estimated from the data. In sum, individual-level parameters can be expressed as

We arbitrarily choose 105 as the centre or intercept of our reaction norm, and code Dose as {−2, 1, 0, 1}. Nothing in the above model explicitly captures the activity of the worm, but by allowing the parameters to change across treatments, the model may reveal processes that are influenced by this activity.
We fit our within-host infection model to the corresponding longitudinal data of 121 mice using a Bayesian statistical approach. Initial fits produced poorly behaved residuals – early time points fit well at the expense of capturing later dynamics. Using our estimates of effective propagation, we calculated expected values of effective reproduction (i.e. the average number of new infected cells produced per infected cell; Metcalf et al., Reference Metcalf, Graham, Huijben, Barclay, Long, Grenfell, Read and Bjørnstad2011). Given that the maximum value of this quantity (averaged within a treatment) was around 12, we decided to exclude individual data points from the fitting routine if the infected RBC density one day later increased by more than 12-fold. This resulted in dropping 39 data points (i.e. single days of RBC and infected RBC data; <3% of the total dataset), spread across 37 individual time series. We simultaneously fit the model to single and co-infection data, but allow parameters for each treatment to be estimated independently [while u j,i, v j,i and measurement error terms (below) are estimated jointly]. Our model was written in Stan 2.18.2 and fitted through the RStan interface (Carpenter et al., Reference Carpenter, Gelman, Hoffman, Lee, Goodrich, Betancourt, Brubaker, Li and Riddell2017; Stan Development Team. RStan: the R interface to Stan, Version 2.18.2; 2019; http://mc-stan.org). Estimates for fixed parameters and prior distributions for fitted parameters are provided in Table 1. We adopt a previously developed log-likelihood function, which assumes the measurement error for the total density of RBCs (i.e. sum of uninfected and infected RBCs) and infected RBCs are distributed normally and log10 normally, respectively (Mideo et al., Reference Mideo, Barclay, Chan, Savill, Read and Day2008a, Reference Mideo, Savill, Chadwick, Schneider, Read, Day and Reece2011). We ran four independent chains in parallel, each with 4000 sampled iterations and 1000 warm-up iterations. For diagnostics, we confirmed over 400 effective samples and ensured convergence of independent chains using the $\hat{R}$ metric (values below 1.1 indicate multi-chain convergence) for all parameters (Stan Development Team, Stan Modelling Language User's Guide and Reference Manual, Version 2.18.0; 2018. Available from: http://mc-stan.org/). To assess whether the estimated intercept, $\hat{\theta }_j$
 , and slope, $\hat{\delta }_j$
 , of each parameter differs between co-infection and single infection, we compute a 95% highest posterior interval of the difference, i.e. $\hat{\theta }_{j, {\rm co}\hbox{-}{\rm infection}}-\hat{\theta }_{j, {\rm single}}$
 and $\hat{\delta }_{j, {\rm co}\hbox{-}{\rm infection}}-\hat{\delta }_{j, {\rm single}}$
 . The difference is considered statistically significant where the interval does not cross zero. In most of the plots presented, we thin the posterior parameter distributions to 1000 points for computational ease. These analyses were performed in R version 3.5.3, with R Studio, Version 1.1.463 – © 2009–2018 RStudio, Inc. An annotated copy of our code is available in the Supplementary materials.
Table 1. Descriptions of model parameters and their fixed values or prior distributions used in Bayesian statistical inference

Estimated parameters are denoted by an asterisk in the description. Specific prior information from previous studies exists for erythropoiesis upregulation, ρ, background RBC mortality during infection, $\mu _R^{\prime}$ , burst size, β, and standard deviations of log10 RBC and infected RBC (iRBC) density, σ RBC and σ iRBC; all other estimated parameters were assigned a generic, weakly informative prior.
Results
Inferences from statistical model
The highest peak effective propagation rates (P e) were observed at the lowest doses of malaria (Fig. 1). For both singly and co-infected mice, higher initial doses sped up the pace of infection, resulting in earlier peak P e (Fig. 1) and earlier activation of immune responses (1 − p t; Fig. 2a). Our metric of change in the availability of RBCs, b t, showed decreased RBC numbers two to three days after the peak P e, after which estimates of b t rapidly rebounded (Fig. 2b). For example, for mice singly infected with 106 malaria parasites, peak P e occurred on day 3 and the host-induced trough in RBCs (lowest b t estimate) occurred on days 6 to 7, but hosts had increased circulating RBCs (i.e. b t > 0) again by day 9.

Fig. 1. Mean effective propagation number (P e) over the course of infection for different initial doses of Plasmodium chabaudi chabaudi AS (from left to right: 103, 104, 105, 106) in single infections (orange lines and circles) or in co-infections with Nippostrongylus brasiliensis (blue lines triangles). Displayed as the mean ± the standard error, n = 13–16 mice/group.

Fig. 2. Time profiles of (a) immune effects on malaria population growth (1 − p t), and (b) change in RBCs not directly attributable to malaria (b t) over the course of infection for different initial doses of P. chabaudi chabaudi AS. In each subplot, the top row shows results for single infections (orange lines) and the bottom row shows results when in co-infections with N. brasiliensis (blue lines). Each line represents a different individual host. In (b), values above the dotted line at b t = 0 indicate an increase in RBCs (due to erythropoiesis or release from the spleen); values below the dotted line indicate removal of uninfected RBCs (via splenic retention or immune killing on the part of the host, or haemorrhaging induced by the helminth).
Co-infection with N. brasiliensis had no systematic effect on the magnitude of peak effective propagation of P. chabaudi chabaudi compared with singly infected groups (Fig. 1), but did slow the growth of parasites. Across all doses except for the highest (106), peak P e was reached 1 day later in co-infections (Fig. 1). Figures 2 and 3 reveal considerable variation among individual trajectories within some treatment groups and no striking overall effect of N. brasiliensis co-infection on susceptible RBC availability or immune responses (see also plots of average measures in Fig. S1). This analysis suggests that dose and co-infection interact in subtle ways to alter the timing of within-host dynamics and parasite growth, but only at low doses, and motivate our use of mechanistic models that can account for individual variation and further dissect the subtleties of the processes underlying infection dynamics.

Fig. 3. Model-predicted reaction norms for single (orange) and co-infections (blue). For each parameter, j, lines represent the median $\hat{\theta }_j + \hat{\delta }_j \times {\rm Dose}$ from the full (16 000 points) posterior parameter distributions, while bands represent the 95% predictive intervals. Solid (compared to dashed) lines indicate evidence of significant dose dependence, while the asterisk denotes a significant difference in intercepts $( \hat{\theta }_j)$
 between single and co-infections. At higher doses, immune responses are activated more strongly $( \psi _{N_1}, \;\psi _{N_2})$
 , but indiscriminate responses in particular tend to decay at faster rates (shorter half-lives; $\phi _{N_1}$
 ). Fitting our mechanistic model to data reveals that only background RBC mortality $( \mu _R^{\prime} )$
 differs between single and co-infections, and this difference decreases at higher doses. The dotted line in the top left plot indicates the RBC mortality rate expected in the absence of infection (μ R).
Inferences from mechanistic model
The mechanistic model does a good job of capturing the dynamics of RBC and infected RBC densities over time (Figs S2 and S3; and the residuals are well-behaved, Fig. S4). As with a previous analysis of a different dataset (single infections in a different host genetic background; Kamiya et al., Reference Kamiya, Greischar, Schneider and Mideo2020), we found evidence of dose-dependence in a number of processes governing within-host interactions (Fig. 3). In particular, with increasing doses, immune responses targeting either infected RBCs or all RBCs indiscriminately are activated more strongly (increasing $\psi _{N_1}, \;\psi _{N_2}$ ), but these responses tend to decay more quickly (in particular, indiscriminate responses; $\phi _{N_1}$
 ). There is some evidence for negative dose-dependence in immune system handling time (κ) in single (but not co-) infections, and in the background rate of RBC mortality $( \mu _R^{\prime} ) \;$
 in co- (but not single) infections. In both cases, the non-significant slope trends in the same direction. Importantly, the only difference in parameter intercepts between single and co-infections is observed in $\mu _R^{\prime}$
 , indicating a significantly greater loss of RBCs due to background mortality (i.e. unrelated to malaria parasite density) in co-infections, although this difference is substantially reduced at the highest malaria dose. Posterior parameter distributions (along with their priors) are shown in Figure S5.
Plotting median host responses as a function of time and treatment (Fig. 4), we find that our mechanistic model recapitulates key results of the statistical model. In particular, host immune responses are activated earlier in higher dose infections (Fig. 4a and b). We note that the estimate of immune activity from the statistical model (1 − p t; Fig. 2a) captures the overall outcome of targeted and indiscriminate killing on specifically infected RBCs, so is a composite of all the immune activity plotted in Figure 4b plus a fraction of the activity plotted in Figure 4a. Figure 4c reveals a difference between single and co-infections in the number of new RBCs produced early on in infections, at all doses except for 106. Given the higher background mortality rate (Fig. 3), this increased production would be a natural consequence, in the model, of a greater deviation from homoeostatic equilibrium RBC densities (equation (7)). The net effect, therefore, is not observed change in RBC densities (Fig. 4; compare with Fig. 2b) across many of the days where higher erythropoietic production in co-infections is predicted (e.g. days 3–6; lighter blue in Fig. 4c).

Fig. 4. Median host responses predicted from mechanistic model. Shown are the (a) rate of general RBC clearance, N 1 (equation (6), i = 1), (b) rate of targeted infected RBC clearance, N 2 (equation (6), i = 2) and (c) log10 total number of new RBC produced (the sum of the last two terms in equation (7)) over time (x-axis) for different doses of malaria (y-axis). Top row shows single infections and bottom row shows co-infections with N. brasiliensis. Values are obtained by simulating infection dynamics for individual mice using the thinned posterior parameter distributions (1000 trajectories per mouse) and taking the median across all mice in a given treatment.
Discussion
We used two different approaches to investigate the effects of, and interactions between, inoculum dose and co-infection with an anaemia-inducing helminth on the within-host dynamics of rodent malaria infections. Our statistical analysis revealed two major findings: (1) maximum cell-to-cell propagation generally declined with initial dose, and (2) co-infection with helminths slowed the timing of malaria infection dynamics, but only when interacting with certain doses of malaria parasites. This effect of co-infection is largely in line with previous study indicating that blood-feeding helminths tend to dampen within-host malaria parasite growth (Griffiths et al., Reference Griffiths, Fairlie-Clarke, Allen, Metcalf and Graham2015; Budischak et al., Reference Budischak, Wiria, Hamid, Wammes, Kaisar, van Lieshout, Sartono, Supali, Yazdanbakhsh and Graham2018), although our results suggest the effect is a delay rather than a reduction in magnitude (i.e. peak effective propagation across single and co-infections is similar). Our analysis also suggests that the timing of host responses varies dramatically across initial doses, perhaps underlying the dose-dependent variation in peak propagation, but offers few obvious clues about the processes that govern the differences in timing of dynamics between single and co-infections. Although the level at which those processes are described in this statistical approach may be too coarse to capture underlying changes with conflicting or balancing effects, we contend that the approach offers considerable value since the outcome of those unobserved changes may be still be revealed (e.g. the changes in peak effective propagation seen here) and, for many systems, sufficient understanding to develop more mechanistic models will be lacking.
Rodent malaria is a uniquely well-studied system, both experimentally and theoretically. By capitalizing on mechanistic understanding of infection dynamics, refining an existing mathematical model of those dynamics (Kamiya et al., Reference Kamiya, Greischar, Schneider and Mideo2020), and fitting that model to the available data, our second approach provided a plausible explanation of the differences in dynamics observed between single and co-infections. The only model parameter that systematically varied between these treatments was the background RBC mortality rate $( \mu _R^{\prime} )$ . This parameter allows for the possibility that background RBC death – independent of malaria parasite density – may differ in healthy mice, malaria-infected mice and malaria–helminth co-infected mice. The model also allows for malaria parasite density-dependent background mortality, which is captured by the variable N 1, and did not differ between single and co-infections (see Figs 3 and 4a). Malaria parasite density-independent background RBC death that is higher than expected in a healthy mouse (see Fig. 3) could reflect a constitutive host response to infection, while the even higher estimate for $\mu _R^{\prime}$
 in co-infections suggests that this parameter is capturing key activity of N. brasiliensis. Despite the fact that interactions between the host and the helminth are not explicitly accounted for in our model of malaria infection dynamics, allowing background RBC mortality to differ across treatment groups could, in effect, capture several of the expected impacts of the helminth, including haemorrhaging, direct RBC consumption, globin digestion and haem detoxification (Bouchery et al., Reference Bouchery, Filbey, Shepherd, Chandler, Patel, Schmidt, Camberis, Peignier, Smith, Johnston, Painter, Pearson, Giacomin, Loukas, Bottazzi, Hotez and LeGros2018).
An explanation is required for the fact that estimates of the background RBC mortality rate $( \mu _R^{\prime} )$ decrease with malaria dose, although this effect is only statistically significant in co-infections. We suggest two possibilities. First, if the higher background RBC death rate in co-infections is driven by the action of the helminth, then that action must be diminished in the presence of a higher dose of malaria. This seems plausible since the original study, from which these data came, found that higher doses of malaria led to cross-reactive antibodies having higher avidity (binding strength) to antigens of N. brasiliensis (Fairlie-Clarke et al., Reference Fairlie-Clarke, Hansen, Allen and Graham2015), potentially diminishing the activity and impact of the helminth. More generally, the impact and relevance of interspecific competition may be reduced when intraspecific competition is stronger (i.e. at the highest malaria doses). Second, if higher $\mu _R^{\prime}$
 in co-infections reflects both the action of the worm and greater host responsiveness (e.g. RBC filtering by the spleen), then some of the negative dose-dependence in $\mu _R^{\prime}$
 could be due to host response machinery becoming overwhelmed at higher doses (Schmidt et al., Reference Schmidt, Schneble and Wetzker2014). Since the overall background RBC death rate is higher in co-infections (i.e. there are significant differences in the intercepts of the reaction norms) and the observed negative dose-dependence is stronger in co-infections, relatively little difference between $\mu _R^{\prime}$
 in single and co-infections is observed at a malaria dose of 106. For both of these possible explanations, it would be useful to have information on the precise timing of different immune responses. In this case, however, because antibodies were only measured on day 11, and not on a daily basis, we do not have information on precisely when humoral immunity (or any other type of immunity) was mounted, and so further studies would be required to pinpoint the timing of immunity of the different immune mechanisms that govern the outcome of malaria–helminth co-infections.
Thus, the picture that emerges from the mechanistic model is one of increased turnover of RBCs in co-infections due to, potentially, the combined effect of exploitation by the helminth, increased filtering of RBCs by the host and increased production of new RBCs (Fig. 4c), across all initial doses of malaria parasites except for 106. From the perspective of the host, these processes essentially balance out: prior to the substantial loss of RBCs due to exploitation by malaria parasites, there is no discernable difference between single and co-infections in our estimate of RBC availability using either our statistical approach (Fig. 3 and Fig. S1) or our mechanistic approach (Fig. 5). From the perspective of the malaria parasites, however, these environments may be qualitatively different. Using another modelling approach, Wale et al. (Reference Wale, Jones, Sim, Read and King2019) showed that increasing turnover (or ‘juvenilization’) of RBCs can hamper proliferation of reticulocyte-averse genotypes of malaria parasites, an effect we see as a delay in peak effective propagation in co-infections relative to single infections (Fig. 1). Many species of malaria show a preference for different age-classes of RBCs – P. chabaudi, the species used here, is capable of infecting both young (reticulocytes) and mature (normocytes) RBCs, but has a preference for normocytes (Stephens et al., Reference Stephens, Culleton and Lamb2015), so it makes sense that increased turnover and resultant juvenilization of RBCs would impact within-host malaria proliferation.

Fig. 5. Net change in RBCs predicted by the mechanistic model. Each line represents median outcome for an individual mouse (of 1000 simulations from thinned posterior parameter distributions), taking the difference between new RBC production and all RBCs killed by indiscriminate or targeted immune responses. Top row (orange lines) indicates single infections and bottom row (blue lines) indicate co-infections. Values above the dotted line indicate net gain in RBCs, while values below the dotted line indicate net loss. The qualitative patterns observed here match well with estimates of b t from the experimental data and statistical approach (Fig. 2b).
The approach used by Wale et al. (Reference Wale, Jones, Sim, Read and King2019) was a semi-mechanistic model that, like our statistical approach, estimated the contribution of host and parasite factors to infection dynamics by projecting expected densities of parasites and RBCs one time-step ahead, given the experimentally observed densities each day. Like our mechanistic modelling approach, Wale et al. (Reference Wale, Jones, Sim, Read and King2019) decompose host immune responses into those that kill RBCs indiscriminately and those that target infected cells, although unlike our approach, those responses are not intrinsically tied to within-host cues and are free to account for any deviations from expected densities (with some constraints from trajectory smoothing). Thus, the model of Wale et al. (Reference Wale, Jones, Sim, Read and King2019) offers a third, unique approach to dissecting ecological interactions within malaria infections, from which they infer that the simultaneous increase in supply of new RBCs and increase in indiscriminate killing, post-peak infection, can restrict parasite growth in single infections with malaria. In our analyses, it was only through the mechanistic model that the increased turnover of RBCs early on in co-infections was revealed, since in the statistical model changes in RBCs not due to the malaria parasites are captured by b t, which combines the effects of indiscriminate killing, background RBC mortality and new RBC production. Yet, the consequences of that increased turnover (slowed cell-to-cell parasite propagation) could be inferred from that simpler, statistical model.
The two approaches we used vary dramatically in complexity, requisite knowledge about the system being modelled and computational intensity. Key advantages of the statistical approach are that it offers an extremely flexible model – one that is minimally constrained by biological assumptions – that can be fitted to data with minimal computational effort, while also avoiding risks inherent in fitting more complicated models (e.g. constraints imposed by specifying priors or bounds on parameters, parameter non-identifiability, overfitting; see e.g. Ginzburg and Jensen, Reference Ginzburg and Jensen2004). Depending on the question at hand, such an approach that reveals phenomenological patterns (e.g. the action of immunity, 1 − p t, or availability of RBCs, b t, over time) and their consequences (e.g. impacts on P e) will be sufficient and beneficial. We note that our mechanistic model still side-steps much of the detail of immune responses, e.g. which molecules interact with which cells, and again captures the outcome of these interactions – killing rates over time. In part, this is out of necessity: data to inform these processes were not available. In general, with myriad signalling and effector cells (Stevenson and Riley, Reference Stevenson and Riley2004; Gazzinelli et al., Reference Gazzinelli, Kalantari and Fitzgerald2014) it is non-trivial to measure every relevant component, with fine enough resolution for model fitting, over the course of infections. However, our mechanistic model incorporates another level of biological details with the assumption that immune responses are triggered by pathogen-associated molecular pathways (Gazzinelli et al., Reference Gazzinelli, Kalantari and Fitzgerald2014; Stephens et al., Reference Stephens, Culleton and Lamb2015) and thus are explicitly dependent on the density of infected RBCs. By characterizing the nature of this dependence, and how it varies with infectious dose, the mechanistic model – unlike the statistical model or the semi-mechanistic approach of Wale et al. (Reference Wale, Jones, Sim, Read and King2019) – provides a quantitative framework for predicting the influence of perturbations, outside of those already explored, on disease dynamics and outcomes.
Our mechanistic model did not explicitly capture the action of the helminth, thus we could not, for example, use it to predict the quantitative impacts of different doses of worms. Instead, we used a model of malaria infection dynamics alone to ask the data whether alterations to resource availability or immune responses are likely to explain the interactions between helminths and malaria parasites. Despite the wealth of research seeking to elucidate the mechanisms driving dynamics in single infections, and in particular malaria infections in mice (Mideo et al., Reference Mideo, Day and Read2008b), there is a dearth of mathematical models fitted to data of the within-host dynamics of multi-species infections (although there are abundant within-host co-infection models that are not fitted to data, e.g.; Fenton and Perkins, Reference Fenton and Perkins2010; Eswarappa et al., Reference Eswarappa, Estrela and Brown2012). For malaria and helminth co-infections, specifically, there is considerable variation in the consequences for hosts of within-host interactions across different pairs interacting parasite species (Knowles, Reference Knowles2011), which is ripe for further theoretical exploration. More broadly, there is a growing appreciation in the field of disease ecology that many hosts are simultaneously infected by more than one parasite (e.g. Pedersen and Fenton, Reference Pedersen and Fenton2007), and that their interactions are hard to infer from host population-level data (Fenton et al., Reference Fenton, Knowles, Petchey and Pedersen2014) although new approaches are being developed (e.g. Park and Ezenwa, Reference Park and Ezenwa2020). Combining experimental data with mathematical models of within-host dynamics – regardless of the specific approach taken – offers an opportunity to generate knowledge of co-infection interactions, which is key to understanding disease in natural systems.
Many interacting factors are involved in determining infection dynamics and outcomes, with implications for both individual hosts (disease severity) and populations (transmission). These include host factors (e.g. genetic make-up, physiological and immune status, infection history, behaviour and the presence of co-infections) and parasite factors (e.g. genetic strain and infectious dose). In this study, we investigated the interaction between two of these factors – infectious dose and the presence of a competitive co-infection. We found evidence that these factors affect the timing and magnitude of within-host propagation of mouse malaria, both independently and by way of interactions. The applied significance of this work is that co-infections between malaria parasites and helminths are widespread (e.g. Tshikuka et al., Reference Tshikuka, Scott, Gray-Donald and Kalumba1996; Ravindran et al., Reference Ravindran, Sahool and Dash1998) and treating one of those infections is likely to have knock-on consequences for the dynamics and severity of the other infection (e.g. de-worming resulted in higher within-host loads of malaria parasites in humans; Budischak et al., Reference Budischak, Wiria, Hamid, Wammes, Kaisar, van Lieshout, Sartono, Supali, Yazdanbakhsh and Graham2018). Our results suggest that the off-target consequences of treatment will depend on precisely when, over the course of an infection, that treatment is applied, since dose and hence the timing of dynamics, influence the impact of co-infection. The two modelling frameworks used here provide useful and flexible tools for dissecting, to different resolutions, the ecological interactions between various host and parasite factors underlying within-host disease dynamics.
Supplementary material
The supplementary material for this article can be found at https://doi.org/10.1017/S003118202100072X
Data
Our raw data and code are available as Supplementary materials.
Acknowledgements
We thank Aaron King for fruitful discussion and two anonymous reviewers for helpful feedback.
Financial support
This work was supported by a Fulbright Canada Scholars award, the Natural Sciences Research Council of Canada.
Conflict of interest
The authors declare there are no conflicts of interest.


