


INTRODUCTION
Initially, infectious diseases could spread only as fast and far as people could walk, then as fast and far as horses could gallop and ships could sail. With the advent of truly global travel, the last five centuries have seen more new diseases become potential pandemics (Karlen, Reference Karlen1995), with the rate of diseases that are ‘emerging’ increasing (Jones et al. Reference Jones, Patel, Levy, Storeyguard, Balk, Gittleman and Daszak2008). The current reach, volume and speed of travel are unprecedented, with human spatial mobility increasing in high income countries by over 1000-fold since 1800 (Wilson Reference Wilson1995, Reference Wilson2003). Aviation in particular has expanded rapidly as the World economy has grown, with worries about its potential for spreading disease arising with the establishment of commercial aviation (Massey, Reference Massey1933).
Air travel has changed the epidemiological landscape of the world over the last half century, providing routes from one side of the Earth to the other that can be traversed by an infected person in significantly shorter times than the incubation period of the majority of infectious diseases. This epidemiological impact has prompted a rethinking of global disease management (World Health Organisation, 2007), with pandemic control relying less and less on conventional spatial barriers as the global air network continues to expand. Moreover, the speed of air travel has meant that prompt surveillance and rapid reporting now play a critical role in preventing the spatial spread of a disease, while mathematical models are becoming more central in identifying unusual behaviour in disease trends. Finally, the high cost of surveillance makes sampling design and the development of cost effective monitoring and testing approaches vitally important in effective epidemic early-warning systems (Haggett, Reference Haggett2000). While work on these factors is becoming sophisticated for directly-transmitted infections, our understanding of the role of modern air travel in global vector-borne disease epidemiology remains relatively poor. In this paper, we review existing knowledge, and highlight the potential of interdisciplinary geospatial approaches to fill gaps and provide a basis for adaptive management tools.
AIR TRAVEL EXPANSION
Today, more than two billion passengers take commercial flights every year (IATA, 2010). Passenger numbers have grown at nearly 9% per annum since 1960, with air-freight traffic showing similar changes (Upham et al. Reference Upham, Thomas, Gillingwater and Raper2003). While the recent global economic downturn resulted in a slow-down of growth in many parts of the world, the level of air traffic is still now 4% above the pre-recession peak of early 2008 (IATA, 2010). Moreover, many regions are still showing rapid expansion, such as India and China, as their economies continue to grow. Fig. 1 demonstrates such trends for China, showing the large number of new routes initiated in 2011 as the country continues to expand its influence abroad. Though not shown in Fig. 1, this expansion also includes more frequent and larger capacity flights operating on existing routes. Globally, the interconnectivity brought about by air travel has had a profound impact on epidemiological dynamics, and continued growth will almost certainly result in more significant changes.

Fig. 1. Direct flight connections to and from China in 2010 and 2011. Routes operating in 2010 are shown in blue, while new routes added in 2011 are overlaid on top in red. For clarity, all routes are shown as straight lines, rather than actual great circle routes and trans-Pacific routes to/from China are shown as connecting in the opposite direction to avoid broken lines on the map.
AIR TRAVEL AND DIRECTLY TRANSMITTED DISEASES
The air transportation system is responsible, indirectly, for the global propagation of directly-transmitted diseases such as influenza and severe acute respiratory syndrome (SARS). It plays a role for certain diseases that is analogous to that of the web of human sexual contacts for the propagation of HIV and other sexually transmitted infections (Guimera et al. Reference Guimera, Mossa, Turtschi and Amaral2005). Previous studies have suggested that data on air travel can be used to predict the spread of newly emerged human pathogens and better target public health measures (Colizza et al. Reference Colizza, Barrat, Barthélemy and Vespignani2006).
Numerous approaches have been developed which attempt to capture the possible future movements of newly-emergent communicable diseases through global and local transport networks (Thomas, Reference Thomas1992; Haggett, Reference Haggett2000). While the movements of pandemics are notoriously unpredictable (Thomas, Reference Thomas1992), those models that can be calibrated using data from previous epidemic events are perhaps the ones that stand the best chance of being used to predict the spread of communicable diseases in the future, enabling the construction of early warning systems and forming a basis for the planning of control strategies (Haggett, Reference Haggett2000). Such an approach was demonstrated by Rvachev and Longini (Reference Rvachev and Longini1985) who showed the diffusion of the 1968–9 influenza pandemic to be predictable through a model based on the air travel network of the time. Incidence data from the pandemic origin, Hong Kong, were used to estimate model parameters, such as contact level between susceptible and infectious individuals, time taken in latent and infectious states and fraction of people susceptible to the virus. Annual average daily air passenger numbers between 52 cities were then used to derive probabilities of travel between the cities. Finally, the seasonality of influenza was taken into account by applying a scaling factor to northern and southern hemisphere city contact level parameters to mimic the hemispheric swing of influenza epidemics. This model was later updated to provide the basis for predictive models of the spread of influenza, smallpox, SARS and other infectious agents through the global transportation network (Longini et al. Reference Longini, Fine and Thacker1986; Dye and Gay, Reference Dye and Gay2003; Grais et al. Reference Grais, Ellis and Glass2003; Vogel, Reference Vogel2003; Hufnagel et al. Reference Hufnagel, Brockmann and Geisel2004).
More recently, the H1N1 pandemic, development of network modelling approaches and increasing computing power have prompted both more sophisticated modelling and a better understanding of the role of global air travel in directly transmitted disease spread. Studies have examined the interplay between commuting flows and air travel flows in impacting pandemic influenza (Balcan et al. Reference Balcan, Colizza, Goncalves, Hu, Ramasco and Vespignani2009), the role of air network structure on the predictability of global epidemics (Colizza et al. Reference Colizza, Barrat, Barthelemy and Vespignani2005, Reference Colizza, Barrat, Barthélemy and Vespignani2006), the impacts of vaccination (Kenah et al. Reference Kenah, Chao, Matrajt, Halloran and Longini2011) and the effects of travel restrictions on pandemic spread (Bajardi et al. Reference Bajardi, Poletto, Ramasco, Tizzoni, Colizza and Vespignani2011). Moreover, research has expanded in scope to include examination of the role of trade and health-care resources in addition to air traffic (Hosseini et al. Reference Hosseini, Sokolow, Vandegrift, Kilpatrick and Daszak2010), and the development of publicly available models that draw on a wide range of datasets (Van den Broeck et al. Reference Van den Broeck, Gioannini, Gonçalves, Quaggiotto, Colizza and Vespignani2011). Finally, recent work demonstrated the need for more complete data on air travellers and the handling of such data in mathematical models of disease spread (Johansson et al. Reference Johansson, Arana-Vizcarrondo, Biggerstaff, Staples, Gallagher and Marano2011).
Clearly, the air transport network plays a much more indirect role in the spread of vector-borne diseases, due to the requirements for not only movement of infected passengers or vectors, but also the availability of competent vectors upon arrival to facilitate onward spread. Nevertheless, increases in reported rates of imported vector-borne infections around the world, the establishment of exotic vectors and occasional outbreaks of vector-borne disease sparked by incoming air travellers, are all evidence of the role that air travel is playing in a changing global epidemiology. The size and predictability of this impact remains poorly understood compared to directly-transmitted diseases however, and in the remainder of this article, we discuss current understanding, modelling approaches and knowledge gaps still to be filled regarding the role of air travel in the movement and spread of vector-borne diseases.
MOVEMENTS OF VECTORS VERSUS DISEASE
Substantial evidence exists documenting examples of both vector-borne diseases and the vectors that carry them being transported between distant locations via air travel. The rates of importation of disease vectors (infected or non-infected) versus infected passengers appear to be very different however. While imported vector-borne disease infections in air travellers are common and number tens of thousands each year into non-endemic high income countries (Jelinek et al. Reference Jelinek, Schulte, Behrens, Grobusch, Coulaud, Bisoffi and Matteelli2002; Wichmann and Jelinek, Reference Wichmann and Jelinek2004), disease vectors appear to be relatively rarely imported, and their establishment in a new location is an even rarer event (Lounibos, Reference Lounibos2002).
Aircraft and ships are believed to be directly responsible for rapid expansion in the range of many plants and animals via inadvertent transport (Perrings et al. Reference Perrings, Dehnen-Schmutz, Touza and Williamson2005), including some of the World's principal disease vectors (Lounibos, Reference Lounibos2002). The global air network enables many of the World's most isolated and diverse ecosystems to become connected and aids the movement of organisms, including disease vectors, to new habitats where they can become damaging invasive species, economically and health-wise (Tatem et al. Reference Tatem, Hay and Rogers2006a; Tatem and Hay, Reference Tatem and Hay2007). Aircraft were recognized as a mechanism of transport of undesirable insects, especially mosquitoes, not long after the implementation of commercial, transcontinental flights (Massey, Reference Massey1933; Griffits and Griffits, Reference Griffits and Griffits1931). Fumigation, or ‘disinsection’ of aircraft arriving from the tropics, as well as insect control at receiving airports, were recommended to prevent the establishment of undesirable pests and disease vectors that might hitchhike aboard flights (Williams, Reference Williams1940). Malaria epidemics in northeastern Brazil vectored by Anopheles gambiae, possibly transported on aircraft, though more likely a steamship from Dakar (Killeen, Reference Killeen2003), heightened concerns about the dangerous consequences of vector arrivals aboard international flights. Mosquitoes representing five genera were identified from inspections of aircraft arriving in northeastern Brazil from Africa in 1941–1942 (Soper and Wilson, Reference Soper and Wilson1943), while more recently, inspections of aircraft during a three week period in 1994 produced estimations that 2000–5000 anopheline mosquitoes were imported into France at a rate of 8–20 mosquitoes per flight (Gratz et al. Reference Gratz, Steffen and Cocksedge2000). Given such findings and the ever-increasing volume of air traffic, it is perhaps surprising that very few disease epidemics have been associated with the arrival of vectors via aircraft, though the establishment of West Nile virus in the US has been linked to the possibility of infected mosquito importation by air (Kilpatrick, Reference Kilpatrick2011). Mosquitoes can survive moderately high atmospheric pressures aboard aircraft (Laird, Reference Laird1984) and can be transported alive between international destinations, even in wheel bays (Russell, Reference Russell1987). However, the reason behind the lack of establishment or epidemics is likely a case of sheer numbers. Those disease vectors that make it onto a flight, survive it, then disembark to a new location are likely comprised of very small numbers of adults – this contrasts with examples from cargo shipping of the discoveries of large numbers of eggs, and the long list of cases of mosquito invasion success through ship-borne introductions (Lounibos, Reference Lounibos2002).
Air travel likely plays a much more significant role in moving the vector-borne disease (via infected passengers) than in moving the vector itself. It provides rapid and wide-reaching connections between outbreaks or high levels of endemicity and susceptible vector populations elsewhere in the world. The numbers of reported imported cases of notifiable vector-borne infections in non-endemic countries provide an indication of the rate at which infected travellers are arriving, but this likely involves significant under-reporting in terms of actual case numbers. For malaria, around 10,000 imported cases imported to high-income countries are reported each year, but the true figure may be over 25,000 (Franco-Paredes and Santos-Preciado, Reference Franco-Paredes and Santos-Preciado2006). Up to 8% of travellers to the developing world become ill enough to seek health-care upon returning home, with a relatively substantial proportion of these suffering from vector-borne infections (Freedman et al. Reference Freedman, Weld, Kozarsky, Fisk, Robins, Sonnenburg and Keystone2006). Imported case rates also vary significantly by traveller group, with migrant residents of high income countries who return home to visit friends and relatives being particularly at risk, especially for malaria (Franco-Paredes and Santos-Preciado, Reference Franco-Paredes and Santos-Preciado2006). The expansion of air travel has fuelled many of these trends, with case numbers often mirroring trends in travel to certain high risk locations (see example malaria analysis later in this article), modified only by efforts to promote awareness of risks, as well as prophylaxis, bed-net and insecticide use. With imported vector-borne infections placing a financial and operational burden on health systems in non-endemic countries, as well as the risk of onward transmission and even establishment, as in the case of West Nile virus (Kilpatrick, Reference Kilpatrick2011), the development of tools for assessing the spatiotemporal risks of importation could bring substantial benefits.
VECTOR-BORNE DISEASE DISTRIBUTIONS AND CONNECTIVITY
Defining the extent of infectious diseases as a public health burden and their distribution and dynamics in time and space are critical to disease monitoring, control and decision-making. The epidemiology of many vector-borne diseases makes health system-based surveillance-based methods for estimating populations at risk and disease burden problematic because a large proportion of cases do not seek treatment, and in many resource-poor areas there is significant under-reporting anyway (Gething et al. Reference Gething, Noor, Gikandi, Ogara, Hay, Nixon, Snow and Atkinson2006; Health Metrics Network, 2005; Murray et al. Reference Murray, Lopez and Wibulpolprasert2004). Meanwhile susceptibility and transmissibility of diseases can vary across differing population densities, and demographic and socioeconomic groups due to differences in immunity, mobility, contact patterns and health status (Riley, Reference Riley2007; Kubiak et al. Reference Kubiak, Arinaminpathy and McLean2010). Cartographic and spatial modelling approaches have proven to be effective in tackling these factors, through using community surveys to assess prevalence rates, and geostatistical approaches combined with covariates to predict prevalences at unsampled locations (Brooker et al. Reference Brooker, Hay and Bundy2002; Ferguson et al. Reference Ferguson, Cummings, Cauchemez, Fraser, Riley, Meeyai and Iamsirithaworn2005; Hay et al. Reference Hay, Okiro, Gething, Patil, Tatem, Guerra and Snow2010). Such approaches can help characterize large-scale patterns of disease spread to evaluate intervention impact (Riley, Reference Riley2007) and produce globally consistent measures of morbidity of known fidelity, often the only plausible method in many African countries where surveillance data are incomplete, unreliable and inconsistent (Gething et al. Reference Gething, Noor, Gikandi, Ogara, Hay, Nixon, Snow and Atkinson2006; Cibulskis et al. Reference Cibulskis, Bell, Christophel, Hii, Delacollette, Bakyaita and Aregawi2007; World Health Organization 2008).
The spatial modelling of vector and vector-borne disease distributions is reliant upon the collation of georeferenced samples informing on either the presence of a disease or vector, or its prevalence. Examples of such datasets are those from global surveillance (Brownstein et al. Reference Brownstein, Freifeld, Reis and Mandl2008), or collected from field surveys on vector presence (Moffett et al. Reference Moffett, Strutz, Guda, González, Ferro, Sánchez-Cordero and Sarkar2009), or disease prevalence (Guerra et al. Reference Guerra, Hay, Lucioparedes, Gikandi, Tatem, Noor and Snow2007). Relationships between the presence/prevalence of a disease or vector and environmental, climatic and physical covariates (Hay et al. Reference Hay, Tatem, Graham, Goetz and Rogers2006; Scharlemann et al. Reference Scharlemann, Benz, Hay, Purse, Tatem, Wint and Rogers2008; Tatem et al. Reference Tatem, Guerra, Kabaria, Noor and Hay2008) can then be exploited to build statistical predictive distribution models (Rogers, Reference Rogers2006; Elith et al. Reference Elith, Graham, Anderson, Dudík, Ferrier, Guisan, Hijmans, Huettmann, Leathwick, Lehmann, Li, Lohmann, Loiselle, Manion, Moritz, Nakamura, Nakazawa, Overton, Peterson, Phillips, Richardson, Scachetti-Pereira, Schapire, Soberón, Williams, Wisz and Zimmermann2006). Moreover, by setting these in a Bayesian framework, full predictive posterior distributions can be obtained, facilitating explicit measures of mapping uncertainty (Patil et al. Reference Patil, Gething, Piel and Hay2011). Examples of global distribution maps include P. falciparum malaria (Hay et al. Reference Hay, Guerra, Gething, Patil, Tatem, Noor, Kabaria and Snow2009; Gething et al. Reference Gething, Patil, Smith, Guerra, Elyazar, Johnston, Tatem and Hay2011), dengue and yellow fever (Rogers et al. Reference Rogers, Wilson, Hay and Graham2006) and Anopheles species (Sinka et al. Reference Sinka, Bangs, Manguin, Coetzee, Mbogo, Hemingway, Patil and Hay2010a, Reference Sinka, Rubio-Palis, Manguin, Patil, Temperley, Gething, Van Boeckel and Hayb, 2011). Such predicted global distribution maps, when combined with data on human movements, can then form the basis for models of infection movement risk (Tatem et al. Reference Tatem, Qiu, Smith, Sabot, Ali and Moonen2009; Tatem and Smith, Reference Tatem and Smith2010; Le Menach et al. Reference Le Menach, Tatem, Cohen, Hay, Randell, Patil and Smith2011).
The linkage of disease and vector distribution maps with air travel network data offers great potential for infection importation risk assessment and the modelling of vector-borne disease spread, and this is explored in the remainder of this article. Such distribution maps, however, represent static pictures of relatively long term (>1 year) disease prevalence and vector presence. Ideally, the substantial climate-driven seasonal fluctuations in disease risk and vector densities should be accounted for. Exploiting the richness of spatial climate data now available offers solutions here. The current architecture of the global air network provides links between regions of high climatic similarity, but that are spatially distant (Tatem and Hay, Reference Tatem and Hay2007). These linkages change seasonally, showing greatest overall climatic similarity in June, July and August, when long-haul routes link climatically similar regions around the globe (Tatem and Hay, Reference Tatem and Hay2007). If a vector or an infected individual arrives in a new location via air travel, the risk of the vector establishing or the infection being passed on to local vector populations is often dependent upon the time of year of arrival. The arrival of an individual infected in a chikungunya outbreak occurring in February in Reunion (the time of year climatically suitable for Aedes albopictus activity there) in Milan will present no risk of onward transmission, due to the cold February climate in Italy being not conducive for albopictus activity. However, a similar arrival from India (where climatic conditions are suitable for year-round transmission) in July presents a much greater risk (Charrel et al. Reference Charrel, de Lamballerie and Raoult2008). By utilizing gridded climate data to measure climatic similarity between origin and destination locations with known presence of a suitable vector, and adjusting for flight passenger numbers as an additional measure of risk, these factors can be accounted for (Tatem et al. Reference Tatem, Hay and Rogers2006a, Reference Tatem, Rogers and Hayb). The potential for undertaking such analyses, making use of the range of datasets now available and described briefly above, is explored in the following sections.
SPATIAL APPROACHES TO UNDERSTANDING AND PREDICTING RISK
Given the vast range of complicating factors, no model can be expected to predict the spread of an infectious disease pandemic with complete accuracy. Modelling can, however, improve our understanding of the driving factors behind epidemiological processes, offer quantitative assessments of risk for improved targeting of surveillance and identify possible interventions for a range of scenarios, spanning the range of uncertainties of key parameters. A recent illustration of the potential for combining mathematical modelling with air travel data to assess the risks of spread of a vector-borne disease is provided in Johansson et al. (Reference Johansson, Arana-Vizcarrondo, Biggerstaff, Gallagher, Marano and Staples2012). This, and the previous section here have outlined how new approaches and datasets are providing us with a more complete understanding of the global distributions of vectors and the diseases they carry, and how combining these maps with air traffic and climate data can enable us to better parameterize the risks of vector-borne disease and vector importation and spread risk. In the following sections, we outline two novel examples where the simple combination of data on air travel passengers with spatial data on vector-borne disease risk offers potential for improved risk assessment.
Example 1: The use of global malaria maps for imported malaria origin and case number prediction
Despite over fifty countries having achieved malaria elimination over the past century, the disease remains a problem to many countries that are certified as ‘malaria free’ through cases imported from endemic regions each year. Cases remain expensive to treat and can occasionally spark secondary local transmission (e.g. Zucker, Reference Zucker1996; MacArthur et al. Reference MacArthur, Holtz, Jenkins, Newell, Koehler, Parise and Kachur2001). While the numbers and origins of cases seen in a non-endemic country are a result of a complex interplay of factors, broad patterns are evident, relating to the number and origin of incoming travellers and level of risk at these locations. The recent construction of a global evidence-based map of P. falciparum malaria transmission intensity (Hay et al. Reference Hay, Guerra, Gething, Patil, Tatem, Noor, Kabaria and Snow2009) provides valuable data on the spatial variation in risk of acquiring a P. falciparum infection. Here we examine the potential of combining these maps with data on numbers of people arriving in the US to explore the relationship to numbers and origins of reported imported malaria cases.
Data on the number and country of origin of reported imported P. falciparum malaria cases from 2000–07 were obtained from the CDC's Morbidity and Mortality Weekly Reports (e.g. Solomon et al. Reference Solomon, Daniel, Rutledge and Boyd2009). It should be noted that these numbers may not completely capture the true number of imported cases since there is the potential for long delays to onset and diagnosis, and more importantly, these only represent reported cases, thus a large proportion may be missed. The case numbers were averaged across years to obtain a mean number of imported P. falciparum cases from each country of origin. Next, estimates of P. falciparum malaria prevalence in each endemic country were obtained from the World malaria map recently published by the Malaria Atlas Project (Hay et al. Reference Hay, Guerra, Gething, Patil, Tatem, Noor, Kabaria and Snow2009, www.map.ox.ac.uk). To produce a single measure of malaria risk for each country, enabling comparison with the imported malaria statistics, a gridded population dataset (Balk et al. Reference Balk, Deichmann, Yetman, Pozzi, Hay and Nelson2006) was used to calculate population-weighted mean prevalence for each country. This was undertaken because taking a single mean prevalence value across the country often incorporates large unpopulated areas, so weighting by population density produces a more relevant value of the average level of prevalence that each person is residing under. Ideally, a range of measures should be calculated to exploit the richness of data in the malaria map, but for this simple illustrative analysis, just the population-weighted mean was used. Moreover, the potential exists to use recently developed mathematical transmission models (Smith et al. Reference Smith, Drakeley, Chiyaka and Hay2010) to convert the map to represent force of infection, a more relevant risk measure for the case of non-immune US residents visiting endemic areas. Finally, the numbers of foreign national travellers by country of national origin to the United States from 2000–07, i.e. non-US citizens entering the US for any reason, were obtained from the US Office of Travel and Tourism Industries (http://tinet.ita.doc.gov/outreachpages/inbound.general_information.inbound_overview.html), and an average per year was calculated.
We next explored the simple assumption that numbers of imported P. falciparum cases by origin country to the US were a function of numbers of incoming travellers and the P. falciparum prevalence at their origins. A log-linear model was constructed to investigate this relationship:
 $$\ln (\gamma _i ) = \beta _0 + \beta _1 *\ln (\Lambda _i ) + \beta _2 *\ln (P_i ) + \varepsilon _i $$
Where i denotes the country of origin, γ i is the imported malaria cases from country i, Λi is the number of international arrivals from country i, and P i is the population-weighted mean P. falciparum prevalence in country i. Linear regression was not appropriate here as the approach suffers from the fact that the numbers of imported cases tend to be positively skewed and subject to outliers. Thus, a natural logarithm transformation was applied to both response and predictor variables to alleviate heteroscedasticity. The mean number of imported cases for each origin was adjusted by adding one before logarithmic transform to eradicate zero values and make full use of the imported case dataset.
A total of 84 countries was included in the modelling. The results of the log-linear model estimation (Table 1) showed that the model was statistically significant, with an adjusted R-squared of 0·497, indicating that approximately 50% of the variance of the response variable (imported case numbers) was accounted for by the explanatory variables (arrivals and P. falciparum prevalence at origin). The estimated coefficients of both explanatory variables were significant (P < 0·001) with values of 0·3842 and 0·2745, respectively. Thus, we may expect around a 3·7% increase in the number of imported malaria cases to the US when the P. falciparum Parasite Rate increases by 10% at the origin, or a 2·7% increase in the number of imported P. falciparum malaria cases when the number of incoming arrivals increases by 10% (holding the other predictor constant).
Table 1. Results of a log-linear model for the estimation of imported P. falciparum malaria case numbers to the US by origin country (PR = Parasite Rate)

Results show that the simple scaling of spatial data on malaria transmission by incoming traveller numbers can broadly replicate the patterns of imported P. falciparum case numbers and origins. Such findings offer promise for the construction of a tool for forecasting trends in imported malaria case numbers and origins, as incoming traveller numbers continue to be monitored and global malaria risk maps continue to be updated and refined (www.map.ox.ac.uk). Finally, this example outlines an extremely simple model, and great potential exists to improve and add more sophistication in incorporating known determinants of imported malaria, and in turn explain a greater proportion of the variance in case numbers seen. Information on traveller activities, prophylaxis use and resident/immigrant/visitor status are important factors to include. Moreover, expanding the approach to longer time series, different diseases, other countries and more sophisticated modelling will likely improve reliability and utility further.
Example 2: Predicting the movement of a vector-borne disease: Chikungunya in Italy
In 2006, India and several Indian Ocean states experienced outbreaks of chikungunya virus infection, where the vector was Aedes albopictus in at least some areas (Schuffenecker et al. Reference Schuffenecker, Iteman, Michault, Murri, Frangeul, Vaney and Lavenir2006; Bodenmann and Genton, Reference Bodenmann and Genton2006). At the end of August 2007, Italy notified its EU partners of an outbreak of chikungunya in the Emilio-Romagna region of north-eastern Italy (Rezza et al. Reference Rezza, Nicoletti, Angelini, Romi, Finarelli, Panning and Cordioli2007). The index case of the epidemic was a resident of the region, who travelled to the state of Kerala, India, in June, and presented with two episodes of fever on 15 June and 23 June. Eventually, over 200 cases were recorded during the summer of 2007, mostly in two villages in the Province of Ravenna. The outbreak of chikungunya in northern Italy was the first recorded in a temperate country. The drivers behind its occurrence were many and varied, but were principally related to a confluence of five factors: (1) The global spread from east Asia of Aedes albopictus (the ‘Asian tiger mosquito') during the past 30 years through the global trade in used tires (Tatem et al. Reference Tatem, Hay and Rogers2006a), including widespread establishment of populations in Italy (Rezza et al. Reference Rezza, Nicoletti, Angelini, Romi, Finarelli, Panning and Cordioli2007). (2) The chikungunya virus strains introduced in Italy contained a mutation in the E1 glycoprotein which was responsible for a single amino acid substitution (A226 V) able to increase the infectivity of the virus for Aedes albopictus (Tsetsarkin et al. Reference Tsetsarkin, Vanlandingham, McGee and Higgs2007). (3) The spread of chikungunya outbreaks from Indian Ocean states in the southern hemisphere, where outbreaks were occurring in the warmer months of December to March (asynchronous to the principal vector activity months of June–September in Italy), to India in the northern hemisphere, where vector activity occurred year-round, providing synchrony with northern hemisphere albopictus activity (Charrel et al. Reference Charrel, de Lamballerie and Raoult2007). (4) An unusually prolonged hot spell in the Northern Italy summer that apparently promoted intense Aedes albopictus activity. (5) A traveller taking advantage of recently established air travel connections between India and Italy.
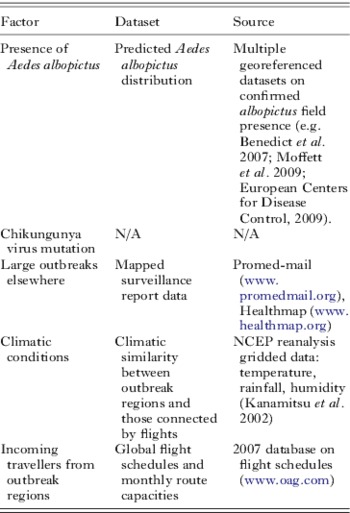
Though the second factor remains difficult to predict, data on the remaining factors were here assembled in a simple framework, following similar previous retrospective analyses (Tatem et al. Reference Tatem, Hay and Rogers2006a, Reference Tatem, Rogers and Hayb), to assess whether the relative risk of an outbreak occurring in northern Italy over other locations could have been predicted at the time using readily available datasets. Table 2 documents these datasets and their sources.
Table 2. Principal factors that determined the occurrence of the 2007 chikungunya outbreak in Italy, the datasets used to represent them in the modeling exercise and the source of the datasets
Firstly, field data on the presence of Aedes albopictus were gathered from a range of sources (Table 2), and used with satellite-derived environmental and climatological covariates (Scharlemann et al. Reference Scharlemann, Benz, Hay, Purse, Tatem, Wint and Rogers2008) within a boosted regression tree species distribution mapping algorithm (Elith et al. Reference Elith, Leathwick and Hastie2008), following similar approaches adopted for Anopheles distribution mapping in Sinka et al (Sinka et al. Reference Sinka, Bangs, Manguin, Coetzee, Mbogo, Hemingway, Patil and Hay2010a, Reference Sinka, Rubio-Palis, Manguin, Patil, Temperley, Gething, Van Boeckel and Hayb, Reference Sinka, Bangs, Manguin, Chareonviriyaphap, Patil, Temperley, Gething and Hay2011). The resulting distribution map, showing predicted suitability for albopictus presence, is shown in Fig. 2. Areas that were predicted as suitable for albopictus, but known to be free of the mosquito (e.g. Australia, New Zealand), were masked from the map for the remainder of the analyses. Following this, reports of outbreaks occurring in the first half of 2007 were collected and mapped, and passenger capacity information for all flight routes originating in outbreak regions were extracted.

Fig. 2. The predicted distribution of climatic and environmental suitability for Aedes albopictus presence based on field survey data combined with satellite-derived environmental covariates within a boosted regression tree species distribution prediction model. The colour scale shows predicted unsuitable to suitable conditions as a continuous scale from yellow to dark blue.
Climatic Euclidean Distances (CEDs) (Tatem and Hay, Reference Tatem and Hay2007) between the nearest international airport to each outbreak region within the predicted distribution of Aedes albopictus (defined by >90% predicted probability of presence), and every other airport within the predicted distribution of Aedes albopictus that was connected by direct flights, were then calculated for each month using the 2007 gridded climate data. CEDs are a measure of similarity in climatic regime between one location and another, and in this case were calculated through obtaining measures of rainfall (r), temperature (t) and humidity (h) for each airport location. The CED between airport i and j is then calculated by  $ \surd ((r _i - r_j )^2 + (t _i - t_j )^2 + (h_i - h_j )^2 )$ (Tatem and Hay, Reference Tatem and Hay2007). The CEDs for each flight route were scaled by the passenger capacities on those routes, following previous approaches (Tatem et al. Reference Tatem, Rogers and Hay2006b; Tatem and Hay, Reference Tatem and Hay2007; Tatem, Reference Tatem2009). Thus for each flight route, this gave a relative measure of the probability of imported chikungunya-infected travellers entering regions with no chikungunya activity, but Aedes albopictus presence and similar climatic conditions to the origin region, where the climate was suitable for sufficient albopictus activity to spark an epidemic. For each month, the routes were ranked by these traffic-scaled CEDs to give a relative assessment of regions most at risk for importation and onward transmission of chikungunya, based on the factors considered (Table 2). The top ten risk routes for June (out of a total of 57 routes), when the Italian outbreak was seeded by a traveller from India, are shown in Table 3. While the highest ranked routes are unsurprisingly the shorter distance, regional flights to Sri Lanka and Bangladesh, the highest ranked longer distance route was Mumbai to Milan. Milan was the nearest international airport to Ravenna Province that had connections to chikungunya outbreak regions, suggesting that at the time, the elevated risk of chikungunya importation and establishment through this route, relative to other routes, was actually predictable using readily available spatial datasets.
Table 3. The top ten predicted risk routes for chikungunya importation and onward transmission in June 2007. Origin airports are chosen from international airports within or near to ongoing chikungunya outbreaks and predicted as suitable for Aedes albopictus presence (Fig. 2). Destination airports are those with direct flights to the origin airports and predicted to have Aedes albopictus present in their vicinity. The routes are ranked by traffic-scaled climatic Euclidean distance (CED) (Tatem and Hay, Reference Tatem and Hay2007) from largest to smallest

The results show that a multi-disciplinary approach, which draws on a variety of spatial data on factors known to influence the spread of vectors and the diseases they carry, offers potential for assessing the risk of disease importation. How to interpret and act upon the kind of relative risks identified is a challenge yet to be overcome. However, the approach presented here is a simple, proof of concept analysis, and clearly would benefit from improvements to datasets and methods, many of which are covered in the future directions section below. Here we have examined only direct flights, and their capacities, rather than actual passenger numbers or stopovers. Moreover, in the distribution modelling we have treated Aedes albopictus as a single homogenous type of mosquito, yet competition, competence, adaptation and preferences can vary widely across its global distribution (Gratz, Reference Gratz2004). Finally, accurate data on outbreak locations and sizes, as with many diseases, are difficult to obtain to be sure of comprehensive assessments of risk, however, improvements in global surveillance and the rapid availability of data are improving (e.g. Brownstein et al. Reference Brownstein, Freifeld, Reis and Mandl2008). Despite these issues, the results of this first-iteration spatial framework show promise in terms of being able to conduct rapid risk assessments and prioritise surveillance for a range of vector-borne diseases in the future. The next section documents the first steps in the construction of an online tool to do this.
THE VECTOR-BORNE DISEASE AIRLINE IMPORTATION RISK (VBD-AIR) TOOL
The two examples in the previous section, as well as previous studies (Tatem et al. Reference Tatem, Hay and Rogers2006a, Reference Tatem, Rogers and Hayb, Reference Tatem, Rogers and Hayc) have demonstrated the potential that exists in combining spatial data on disease distributions and climatic seasonality with routinely collected data on flight traffic within a simple modelling framework. To improve access to such datasets and the benefits of combining them for initial assessments of risk of vector-borne pathogen importation and onward spread, or vector importation and establishment, the Vector-Borne Disease Airline Importation Risk (VBD-Air) tool has been developed by the authors.
The VBD-Air tool aims to help better define the roles of airports and airlines in the transmission and spread of vector-borne human diseases. It represents a flexible tool that combines multiple geospatial datasets to estimate the relative risks between differing airports, flight routes, times of year, diseases and their vectors, in promoting the movement of passengers infected by vector-borne diseases and the vectors that spread these diseases. These datasets include global disease risk maps, vector presence maps, 2010 and 2011 air travel network and capacity information, and global climatic datasets. Airports are considered as nodes in the air travel network, with attributes extracted from these datasets based on the locations of the airports. For disease risk, the maximum risk value within a two hour travel time mask around each airport (defined using methods outlined here: http://bioval.jrc.ec.europa.eu/products/gam/index.htm) is used to reflect local accessibilities for infected passengers. The calculations and outputs of the tool rely on the assumptions that the levels of imported vector and vector-borne disease risk via air travel are related to (1) the presence of flight routes connecting to endemic regions (promoting the movement of people, pathogens and vectors), (2) the level of traffic between origin and destination (increasing the probability of infected passenger and vector carriage), and (3) the monthly climatic similarity between origin and destination (since vector activity is required at both locations to firstly provide infected passengers, and secondly prompt onward transmission or vector establishment at the selected destination). These all represent first-step risk assessments based on available global data, and many additional factors for which data are sparse, or which are locally-specific are not included in the tool. At present, VBD-Air focuses on four vector-borne diseases that are the cause of high burden and imported case numbers globally, or that have been readily spread by air travel previously: malaria, dengue, yellow fever and chikungunya. However, extension to other vector-borne diseases is anticipated.
The VBD-Air tool takes the form of an interactive online interface (Fig. 3), and is targeted to users with interests in specific airports or regions, and the risks to those locations of vector-borne disease importation and onward spread, or exotic vector importation and establishment. Users initially select an airport of interest, then make further selections regarding the disease, month and whether only direct flights should be examined. The selections prompt database queries to return a map of the selected disease distribution with direct (or one-stop) flight routes from endemic regions of the selected disease to the airport in question overlaid. The flight routes are coloured by passenger capacity for the selected month, and each route and airport can be selected to examine various statistics on its predicted disease prevalence, climate and traffic in the selected month. The top ten routes ranked by incoming traffic in the selected month from disease endemic regions are also listed to provide an initial assessment of risk, and users can click on any listed airport to view its location on the map. Following this, options for further calculations are available, categorized by (1) imported disease risk, (2) onward transmission risk and (3) imported vector risk. Each section provides more detailed metrics and the option to produce a report in PDF format that summarises differing risk metrics throughout the year for the airport in question.

Fig. 3. Example output screen from the VBD-Air tool. Here the user has chosen to examine direct flight routes into Miami airport originating in regions that have previously seen dengue transmission or are predicted to be suitable for transmission. The routes are coloured by high/low 2011 passenger capacities, and the top ten routes by traffic from endemic areas are listed in the top-right window.
The imported disease section enables users to explore further statistical summarizations for their airport of interest, including air traffic levels from endemic regions, and traffic levels rescaled by disease prevalence or risk at the origin. This section follows similar assumptions to the imported malaria example above – that rates and origins of imported cases are likely a function of numbers incoming and disease risk at the origin. The onward transmission section enables similar calculations to be undertaken, but extends analyses to include vector distributions and climatic similarity between origin and destination regions, in a similar fashion to that undertaken for the chikungunya example above. Finally, the imported vector section makes use of the predicted vector distribution maps and climatic similarity indices to undertake calculations on flight routes and climatic similarity between origins and destinations at different times through the year, following metrics outlined and applied in previous studies (Tatem et al. Reference Tatem, Hay and Rogers2006a; Tatem and Hay, Reference Tatem and Hay2007; Tatem Reference Tatem2009).
The tool is currently in its final stages of development at the time of writing, and anyone wishing to test it or obtain further details should contact Dr Tatem (Andy.Tatem@gmail.com).
MITIGATION
The data and approaches presented so far highlight how far we have come in understanding the role of air travel in the spread of vector-borne diseases, and how spatial information on a variety of factors can be combined to assess the risks of disease and vector importation and spread. Such approaches are valuable for allocating sparse surveillance resources or for strategic planning, but once these risks have been characterized, the question remains on how to mitigate them. A range of options exist, and each have been applied in a variety of settings and to varying degrees of intensity and expense. Here we highlight briefly some of the more widely used air travel-specific approaches:
Disinsection
Disinsection (in-cabin spraying with insecticide at take-off or landing (Gratz et al. Reference Gratz, Steffen and Cocksedge2000)) used to be widely recommended and practised (World Health Organisation, 1998; Aitio, Reference Aitio2002). Studies have suggested that, where used, routine disinsection can prove effective in reducing ‘airport malaria’ (Tatem et al. Reference Tatem, Rogers and Hay2006b) risk (Hutchinson et al. Reference Hutchinson, Bayoh and Lindsay2005), although the number of countries implementing such procedures is in decline (Russell and Paton, Reference Russell and Paton1989; Woodyard, Reference Woodyard2001). The practice is likely to make more economic and logistical sense on certain routes and at certain times of the year in terms of reducing risk from the import of disease-carrying insects. Alternative approaches that avoid the application of insecticides have been developed, such as the use of air curtain barriers (Carlson et al. Reference Carlson, Hogsette, Kline, Geden and Vandermeer2006). These approaches are likely to be of little impact in terms of reducing numbers of imported cases in infected travellers though.
Vector control
Vector control through larviciding and larval habitat management around airports (Guillet et al. Reference Guillet, Germain, Giacomini, Chandre, Akogbeto, Faye and Kone1998) at specific times of year likely represents a relatively cheap option, should a particular gateway airport be considered a risk for the establishment of invasive, non-native insect vectors. The technique is again likely to be of little use in reducing numbers of imported cases in infected travellers, and only of use in limiting onward transmission in the vicinity of the airport.
Screening and treatment
If a particular route is identified as a likely source of imported insect-borne disease cases, then the implementation of targeted, random or full screening (followed by treatment if infections are found) of arriving passengers represents a costly and often inconvenient option, but potentially an effective one. Such an approach has been implemented by the malaria control programme in Mauritius as a tool for maintaining the island's malaria-free status, whereby blood samples were taken and tested for parasites from incoming air travellers, though questions about its cost effectiveness remain (Tatarsky et al. Reference Tatarsky, Aboobakar, Cohen, Gopee, Bheecarry, Moonasar, Phillips, Smith and Sabot2011). A less intrusive approach uses infrared thermometers (Maurice, Reference Maurice2009) to screen for passengers with fever, and has been implemented at some airports during the SARS and influenza epidemics and occasionally for vector-borne diseases, such as dengue (Shu et al. Reference Shu, Chien, Chang, Su, Kuo, Liao and Ho2005) and chikungunya (Shu et al. Reference Shu, Yang, Su, Chen, Chang, Tsai and Cheng2008). Such an approach may only be cost-effective for specific routes and at times when a known large outbreak is occurring at origin regions. Moreover, passengers who are infected, but at latent stages of infection, or are asymptomatic, will not be captured by such approaches.
Awareness and education
Potentially the most cost-effective approaches to reducing numbers of imported vector-borne disease cases and mitigating the potential impacts are targeted education and awareness campaigns. These can involve focusing on a range of groups: (1) Informing airport staff, cabin crew and particularly medical staff about specific routes and times of year where the risks of passengers harbouring vector-borne infections may be relatively high. By making them aware of symptoms and treatments, and raising vigilance, the possibility for identifying and rapidly treating sick passengers is higher. (2) Similarly, informing local physicians and clinical practices in terms of vigilance for specific illnesses in those with certain travel histories can enable rapid diagnosis and reduce the risk of local secondary transmission. (3) Informing passengers returning from specific destinations at certain times of year of the potential elevated risks of contracting vector-borne diseases. This can improve treatment seeking behaviour and facilitate rapid diagnosis, should travellers become sick upon return home. (4) Informing outgoing passengers to specific destinations of elevated risk for vector-borne disease. This can include advance warning when tickets are purchased to prompt prophylaxis acquisition, and onboard the flight to increase awareness of bednet usage and insecticide application, for example.
FUTURE DIRECTIONS
Compared to our understanding of the role of air travel in the spread of directly transmitted infections such as influenza, much is still to be discovered, explored and analysed in terms of vector-borne diseases. A set of possible future research directions exist as clear extensions to the work outlined in this paper, and these are discussed below.
Real time risk assessment
Ultimately, being able to map rapidly vector-borne disease risks as they change, then link these contemporary risks to actual air travel ticket purchase records and occupancy rates will take the types of analyses presented here a step further towards near real-time assessments of disease importation risk. Projects such as Bio.diapsora (www.biodiaspora.com) and GLEAM (www.gleamviz.org) aim to provide frameworks for integrating air travel data with disease surveillance data and mathematical modelling, respectively, to better quantify risks for directly-transmitted infections. The increasing availability of rapidly reported and georeferenced data on disease outbreaks through projects such as Healthmap (Brownstein et al. Reference Brownstein, Freifeld, Reis and Mandl2008) and the development of statistical disease and vector distribution mapping techniques make the possibility of near real-time vector-borne disease risk mapping within reach, however. Through combining these with information on human movement, for (1) air travel through actual ticket sales, passenger logs or modelled data (see below) and (2) land-based and travel through a variety of datasources and models (e.g. www.thummp.org), and linking these movement data to disease-specific stochastic models (see below), the goal of real-time adaptive management and surveillance for vector-borne disease importation and spread could become a reality.
Flight passenger modelling
The analyses here and prior studies (Tatem et al. Reference Tatem, Hay and Rogers2006a, Reference Tatem, Rogers and Hayb, Reference Tatem, Rogers and Hayc) have focused solely on scheduled direct flights and relied on flight capacities as a surrogate for actual passenger traffic. In reality, stopovers are common, flights rarely operate at full capacity and chartered flights still carry large numbers of people. Aside from obtaining full records of all passenger itineraries, which generally remain confidential and expensive to obtain, a number of steps can be explored to rectify this, firstly focused on deriving models based on widely available and reliable US data. These likely include the processing of DB1B data and T-100 data (http://www.transtats.bts.gov) to compare purchased tickets (which include full routes including stopovers) and flight occupancy on routes against flight capacity. Moreover, analysis of T-100 data and its cross-referencing against enhanced traffic management system operator codes can enable the inclusion of chartered flights. Finally, approaches to model the potential area of dispersal of any VBD brought in by an infected human could be developed through spatial quantification of airport accessibility by overland travel in combination with vector-borne disease and vector distribution datasets. Previously developed approaches for quantifying spatially the ease of access of differing locations globally have shown application in describing the movement of directly transmitted infections (Gray et al. Reference Gray, Tatem, Lamers, Hou, Laeyendecker, Serwadda, Sewankambo and Salemi2009; Talbi et al. Reference Talbi, Lemey, Suchard, Abdelatif, Elharrak, Nourlil, Tatem and Jalal2010), and could be extended to provide estimates of airport catchment areas and potential routes of onward transmission.
Vector-borne disease and vector-specific parameters
The risks of long-distance spread for differing vector-borne diseases are partially dependent upon their respective epidemiological features. For instance, the differing incubation times and prevalence of asymptomatic carriers means that some vector-borne diseases have greater opportunities to be carried beyond their region of entry to a country than others, before symptoms appear, treatment is sought and the disease presence is alerted to control authorities. Moreover, the length of parasite lifecycle stages (Guerra et al. Reference Guerra, Gikandi, Tatem, Noor, Smith, Hay and Snow2008), vector development times (Sinka et al. Reference Sinka, Bangs, Manguin, Coetzee, Mbogo, Hemingway, Patil and Hay2010a, Reference Sinka, Rubio-Palis, Manguin, Patil, Temperley, Gething, Van Boeckel and Hayb, 2011) and diapause (Hawley et al. Reference Hawley, Reiter, Copeland, Pumpuni and Craig1987) all impact upon the timings of risk, while larval site preferences and human population densities (Tatem et al. Reference Tatem, Guerra, Kabaria, Noor and Hay2008) affect locations of risk. Incorporation of these factors into existing air network model frameworks, including VBD-Air, should be a priority.
Stochastic models
The simple model frameworks presented in this paper and previously (Tatem et al. Reference Tatem, Hay and Rogers2006a, Reference Tatem, Rogers and Hayb, Reference Tatem, Rogers and Hayc) use single mean estimates of monthly traffic per route, environmental suitability, disease endemicity/presence and vector presence to estimate long-distance vector-borne disease spread risk. In reality, this spread is a stochastic process, and each of these variables can (1) exhibit substantial variations from the mean and (2) include uncertainty in the way they are measured. These encompass, for example, interannual climatic variability, monthly variations in traffic on flight routes, the uncertainties inherent in mapping vector-borne disease transmission (Patil et al. Reference Patil, Gething, Piel and Hay2011) and vector suitability from species distribution models (Sinka et al. Reference Sinka, Bangs, Manguin, Coetzee, Mbogo, Hemingway, Patil and Hay2010a ,Reference Sinka, Rubio-Palis, Manguin, Patil, Temperley, Gething, Van Boeckel and Hayb, Reference Sinka, Bangs, Manguin, Chareonviriyaphap, Patil, Temperley, Gething and Hay2011), and past histories of outbreaks. Future work should focus on deriving probability distributions for each model parameter. By simulating risks of importation from these probability distributions, improved and more informative model outputs can be produced that will provide a better understanding of the uncertainties inherent in forecasts and more realistic scenarios for guiding management decisions.
Validation
The testing and validation of any models designed to assess vector-borne disease importation and establishment risk against detailed and reliable data on previous vector-borne disease-spread events should represent an important component of future research. The imported malaria and chikungunya outbreak examples presented here, as well as previous work on airport malaria (Tatem et al. Reference Tatem, Rogers and Hay2006b) and Aedes albopictus (Tatem et al. Reference Tatem, Hay and Rogers2006a) represent first steps towards achieving this, but more detailed and rigorous assessments will increase confidence in the forecasting abilities of such models.
Phylogeography
The analysis of phylogenetic data is increasingly uncovering patterns and information on the timing and global spread routes of pathogens (Lemey et al. Reference Lemey, Rambaut, Drummond and Suchard2009). While such analyses offer valuable insights into global epidemiological dynamics, the driving factors behind them remain unquantified. Recent work, however, is focused on building in candidate driving factors (including air traffic data) into Bayesian phylodynamic frameworks to quantify the possible role of each one in describing spread patterns seen (Lemey et al. Reference Lemey, Rambaut, Drummond and Suchard2009; Talbi et al. Reference Talbi, Lemey, Suchard, Abdelatif, Elharrak, Nourlil, Tatem and Jalal2010; Gray et al. Reference Gray, Tatem, Johnson, Alekseyenko, Pybus, Suchard and Salemi2011). This multidisciplinary approach offers a potentially powerful framework for understanding, modelling and forecasting the dynamics of pathogens spread through air travel.
CONCLUSIONS
Increases in global travel are happening simultaneously with many other processes that favour the emergence of disease (Wilson Reference Wilson1995, Reference Wilson2003). Air travel is a potent force in disease emergence and spread, and the speed and complexity of modern aviation makes both geographical space and the traditional ‘drawbridge’ strategy of disease control and quarantine increasingly irrelevant (Haggett, Reference Haggett2000). With no apparent end in sight to the continued growth in global air travel, we must expect the continued appearance of communicable disease pandemics, disease vector invasions and vector-borne disease movement. Approaches that can model, predict and explain such events can be used to focus surveillance and control efforts more efficiently. This paper has shown that the risk of movement of vector-borne diseases through the global air network can be predicted to a certain degree to provide such information. Future challenges include incorporating information on temporal variations in passenger numbers, stopover risks, intra-species competition, human populations at risk, breeding site availability, climate change, disinsection and onward land transport, as well as quantifying the relative importance of all types of transport for vector and disease movement. The development and application of statistical and mathematical models based on spatially explicit data, with a particular focus on air transport connectivity have the potential to aid in reaching an ultimate goal of real-time adaptive management and surveillance.
ACKNOWLEDGMENTS
The authors thank Dr Simon Hay, Prof David Rogers, Dr Peter Gething and Dr Anand Patil for sharing global disease risk datasets used in the construction of the VBD-Air tool.
FINANCIAL SUPPORT
AJT, ZH, AD and YQ acknowledge support from the Transportation Research Board of the National Academy of Sciences, through contract #ACRP02-20. AJT also acknowledges funding support from the RAPIDD program of the Science & Technology Directorate, Department of Homeland Security, and the Fogarty International Center, National Institutes of Health, and is also supported by grants from the Bill and Melinda Gates Foundation (#49446 and #1032350).


