INTRODUCTION
The dynamics of Plasmodium falciparum malaria infections in endemic areas are crucial determinants of the effects of preventative interventions but are difficult to study because of the challenge of distinguishing persisting infections from new ones, and because parasite densities are often transiently below the limit of detection.
Where infectious agents are endemic, levels of immunity generally increase with age, and it is therefore to be expected that the duration of infections will be lower in older hosts than in younger ones. While this pattern has been assumed in many models of malaria transmission (Dietz, Molineaux and Thomas, 1974; Aron, 1988), the empirical evidence for it is weak (Walton, 1947; Kitua et al. 1996; Smith et al. 1999a,b; Smith and Vounatsou, 2003; Sama, Killeen and Smith, 2004).
We recently reported a model (Sama et al. 2005) to estimate infection and recovery rates (and hence the duration of infections) from repeated observations of the presence or absence of P. falciparum genotypes in the same group of individuals in the Kassena-Nankana district (KND) in Northern Ghana. In developing this approach we treated the infection and recovery rates as constant. It was assumed that the laboratory test used to detect the infectious agent has imperfect detectability, but the detectability was assumed to be constant across the whole population. We also assumed that these parameters are the same for all genotypes.
We now extend our previous model (Sama et al. 2005) by explicitly parameterizing the detectability as well as the infection and recovery processes as functions of age. We also extend our model to allow for seasonal variation in infection rates.
MATERIALS AND METHODS
Field surveys
The KND, is a highly endemic malarious area showing a peak in transmission during the short wet season between May and September and corresponding seasonality in prevalence and clinical incidence (Binka et al. 1994; Baird et al. 2002; Koram et al. 2003). We analysed P. falciparum genotype data of 69 individuals (Sama et al. 2005), ranging in age from 1 month to 84 years. Each individual contributed 6 blood samples, with the first survey carried out in July 2000 and the remaining surveys at regular intervals of 2 months subsequently, each survey lasting for 8 or 9 days. Samples were analysed for the presence or absence of P. falciparum merozoite surface protein 2 genotypes using a PCR-RFLP (Polymerase Chain Reaction-Restriction Fragment Length Polymorphism) technique (Felger et al. 1999). There were a total of 70 msp2 genotypes observed, 33 belonging to the FC27 and 37 to the 3D7 allelic family.
As an example of the structure of the dataset analysed, consider an individual observed with 4 genotypes during the entire 6 surveys, whose data was represented by the following 4 sequences: (001001), (010000), (001110), (111100), corresponding to the 4 genotypes observed and indicating that the first genotype was observed during the third and sixth survey, while the second genotype was observed only during the second survey, and so on. The complete dataset consisted of 827 observed sequences of this nature.
Model of parasite dynamics
We previously used the immigration-death model corresponding to that originally proposed by Macdonald (1950) to describe n(a), the expected number of distinct genotypes (or the expected true multiplicity of infections) within an individual of age a by the following equation.

where λ is the infection rate, that is the rate at which new infections are acquired, and μ is the clearance rate, that is the rate at which infections are cleared, both assumed to be homogeneous across the population. We now allow these parameters λ, μ, to vary by age and season, t, so that equation 1 takes the form.

The general solution of this equation is given by:

where K is the constant of integration obtained by substituting the initial condition n(0, t)=0.
(a) Infection process
We evaluate 3 alternative forms for λ(a, t)
- λ(a, t)=λ, i.e. we treat the infection rate as constant.
- , i.e. we assume that the infection rate is a monotonic function of age, where β0 is the infection rate at birth while β1 is the change in infection rate (on the logarithmic scale) for a unit increase in age.

- λ(a, t)=λi, i.e. seasonal variation in infection rates. i=1, 2, …, 6 indexes the two month period of the year at time t, corresponding to the inter-survey interval and the parameters λ1, λ2, …, λ6 account for seasonal variation in the infection rate, with the rates treated as constant within each inter-survey period. In this model λ(a, t) is assumed to follow a recurring annual cycle and the same vector of parameters, λi, is applied for each year of life of the individual preceding the observation period.

(b) Clearance process
We evaluate 2 alternative forms for μ(a)
- μ(a)=μ

μ0 is the clearance rate at birth while μ1 is the change in clearance rate (on the logarithmic scale) for a unit increase in age.
(c) Observation process
The observed sequences may differ from true sequences because the observation process is imperfect. We assume one of the following forms for the detectability, s, the probability of detecting an infection in a blood sample conditional on it being present in the host.
- Constant detectability, s(a)=s;
- Age-dependent detectability, logit[s(a)]=s0+s1(a−ā), where ā is the mean age (20·12) and s0 and s1 are parameters to be estimated.
The prediction for the observed mean multiplicity (or simply the expected multiplicity) is obtained by multiplying equation 3 by s(a), that is:

The expected (net) true number of infections acquired during the interval t to t+τ in an individual of initial age a is then m(a+τ, t+τ) where:

and the initial condition is m(a, t)=0 (Sama et al. 2005). In this paper, all units of measurement for time and age are years and for rates are year−1.
We assumed that re-infection with a genetically identical parasite clone is a rare event, and thus that observed sequences containing negative samples between 2 positive samples (for example as in the third sample of the sequence 010100 and as in the third and fourth samples of the sequence 110010) invariably result from failure to detect the infection. We also assumed that our test had perfect specificity. By maintaining these two assumptions, the derivation of the Poisson-likelihood for the frequency of each observed sequence is the same as previously described (Sama et al. 2005). The solutions of equations 2 and 5 are important components in this Poisson likelihood function. The models considered here are thus fitted to the whole genotype histories through time of the individual patients as in Sama et al. (2005).
The models with the specifications a(i), b(i), and c(i) above have been discussed by Sama et al. (2005). We now consider all the remaining possible combinations of (a), (b) and (c) (see Table 1). The models are fitted using maximum likelihood, employing a fixed order Runge Kutta method (Shampine, 1994) for the numerical integration of equation 3 and the quasi-Newton algorithm (Gill and Murray, 1976) for the maximization process. Confidence intervals were obtained by inverting the observed information matrix (Davison, 2003). The programming was implemented in Fortran 95 (Compaq Visual Fortran Version 6.6. Compaq Computer Corporation, Houston, Texas, 2001).

The improvement of the fit gained by considering the likelihood of a fuller model L2 containing p+q parameters with respect to the likelihood of a reduced nested model L1 containing only p parameters was compared using the likelihood ratio test. Comparison of non-nested models was done using the Akaike Information Criterion (AIC).
RESULTS
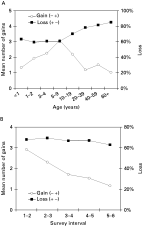
An exploratory analysis was done to assess the number of new infections gained and the proportion of existing infections that were lost. An infection present in survey X but absent in the consecutive survey X+1 was considered as ‘Loss’ (+, −), while ‘Gain’ (−, +) was noted when an infection was present in survey X but absent in the previous survey X−1. The total number of infections gained was calculated over all possible consecutive surveys. The total number of infections lost at survey X+1 among those initially infected at survey X was also calculated over all possible consecutive surveys. The results were summarized by age group and by survey intervals. The number of new infections acquired increased to the age of 5-9 years and then dropped for older age groups. An increase in age of the proportion of infections lost was also observed (Fig. 1A). However, when these quantities were assessed by season, the proportion of infections lost remained fairly constant throughout the year, while there was a seasonal effect on the number of infections gained with the maximum values observed during the first 2 surveys, reflecting the high transmission rate during the wet season (Fig. 1B).

Fig. 1. (A) Mean number of newly acquired infections (Gains), and proportion of infections lost (Loss) among those initially infected, per person-interval by age group. (B) Mean number of newly acquired infections (Gains), and proportion of infections lost (Loss) among those initially infected, per person by survey interval.
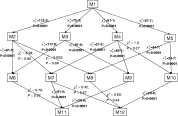
We considered a total of 12 models (Table 1). M1 is the model we reported previously (Sama et al. 2005) in which it was assumed that there was no age or seasonal variation in the parameters. Likelihood ratio tests indicated that all four of the extended models M2, M3, M4 and M5 in which age or seasonal effects were added, demonstrated better fits than M1 indicating that both age and seasonal variation are important (Fig. 2).

Fig. 2. Flow-chart of nested models with likelihood ratio statistics (and P-values) comparing the models. M1→M2: M2 is nested within M1.
All models where detectability was expressed as a function of age (M2, M6, M7, M8, M11, M12), estimated a significant age effect, and all the estimates of s1 from these models are similar, indicating decreases in the detectability with age (Table 2). The likelihood ratio tests comparing each of these models with the corresponding reduced models with age- independent detectability all showed statistically significant differences (Fig. 2).
Table 2. Parameter estimates from the different models in Table 1 (95% Confidence Intervals in parentheses.)

When the infection rate, λ, was assumed constant, its value (of about 17 infections gained per annum) was rather insensitive to the other parameters in the model and somewhat higher than the rate of acquisition of apparent new infections in the raw data (Fig. 1). Although model M5 suggested that there was a strong decrease of infection rate with age, adjustment for age dependence in detectability gave an improvement in fit, and the best model (by Akaike's criterion) among those where the infection rate was allowed to vary with age was M8 (Table 1), in which there is a slight tendency for the infection rate to decrease with age (Table 2). This reflects a rather strong correlation of −0·78 between the estimates of the parameters λ1 and s1 in model M8, indicative of moderate colinearity.
Among models where the clearance rate varies by age, the best fit was M11 (Table 1), in which there is a slight increase in clearance rate with age (Table 2). This increase was much less than that in model M4 in which both infection rate and detectability were assumed constant. The lower estimate of μ1 in M11 reflects a rather strong positive correlation of 0·87 between the estimates of μ1 and s1 in this model.
Neither the age trend in infection nor clearance rates were statistically significant (as measured by likelihood ratio tests comparing models M8 and M11 with their reduced models, Fig. 2). This is because, when age-dependence in the detectability was allowed for, no significant improvement in fit could be achieved by including age effects in either λ or μ (compare M2 with M7 and M8 in Fig. 2; or M6 with M11) or in both of these parameters (compare M12 with M2, M7 or M8). Similarly, including age dependence in both λ and μ (M10) did not improve the fit significantly compared with a model with age dependence in only μ (M4).
The overall best fitting model by Akaike's criterion is M6, which included seasonal variation in λ as well as age dependence in s. Indeed, all models with seasonal patterns in the infection rate fitted better than reduced models with constant λ. The highest 2-month specific infection rate estimated from model M6 was 31 new infections per year, during the period June to August. The rates gradually reduce as we move towards the dry season (the low transmission period) and peaks again as we enter the wet season. This pattern is the same for all the models (M3, M6, M9, and M11) where the infection rates were allowed to vary seasonally with similar values estimated for each of the 6 different infection rates λi in the different models (Table 2).
The estimates of the parameters describing the detection process, and those measuring seasonality in infection rates were insensitive to the other variables in the model (Table 2).
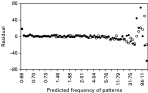
The graphical fits are consistent with the results of formal evaluation of the 12 models by AIC. The frequency of the 63 observed sequences are closer to predictions when the overall best model, M6, is used than when M1 is used (Fig. 3). This is closely followed by the fits from model M11 (which is not significantly different from M6), and the fits from M3 and M9. The largest residual using M6 corresponded to sequence (010000) which occurred 147 times (expected frequency 107·8). Three other sequences had residual frequencies >20 or <−20. All of these four sequences represented infections that were observed at only one survey, thus suggesting that the model fits least well for infections that persist for only a short time. When we assessed the ratio between the observed and expected frequencies, sequence (111111) which occurred 19 times, but with an expected frequency of only 0·9, gave a very poor fit. A possible explanation for these discrepancies is that the true distribution of the durations of infections has a greater variance than is assumed by the exponential model.

Fig. 3. Plot of the difference between the observed and predicted frequency of the 63 patterns against the predicted frequency. [bull ]: model M1, (identical to the model of Sama et al. (2005)); ○: model M6, (best fit).
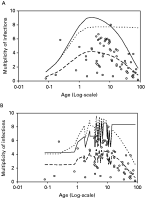
Though the models are fitted to the frequency of the observed sequences and not to the observed mean multiplicity, equations 3 and 4 nevertheless predict the true numbers of distinct genotypes, as well as the numbers of distinct genotypes observed in each sample (observed mean multiplicity). There is a tendency for the observed mean multiplicity of infection to rise and then fall again as age increases. The plots of the expected multiplicity (equation 4) against age are indistinguishable for models M4, M5, M8, and M10, while that of M6 is also similar to M9, and these plots tend to follow the pattern in the observed data. The plots for the expected true multiplicity (equation 3) for models M4, M5, and M10 are indistinguishable, but differ from that of M8, while that of M6 differs from that of M9. There is a greater tendency to follow the pattern in the observed data with the plots of the expected true multiplicity using models M4, M5, M9 and M10, than for M8 and M6 that were reported as the best models above (see Fig. 4). Because of this discrepancy, we were concerned that the conclusion obtained for the clearance rate may be an artifact of the type of function considered for the clearance rate. We attempted a more flexible function by assuming that

This, however, gave no significant improvement of fit compared with any of models M4, M7, M10, M9, M11, and M12.

Fig. 4. (A) Mean multiplicity of infections at baseline. ○: observed mean multiplicity; – –: fit to the observed mean multiplicity (ñ(a, 0)) using model M5; —: predicted true mean multiplicity (n(a, 0)) using model M5; ---: predicted true mean multiplicity (n(a, 0)) using model M8. (B) Mean multiplicity of infections at baseline. ○: observed mean multiplicity; – –: fit to the observed mean multiplicity (ñ(a, 0)) using model M6; —: predicted true mean multiplicity (n(a, 0)) using model M6; - --: predicted true mean multiplicity (n(a, 0)) using model M9.
We also attempted the following 2 logistic functions for the clearance rate.


However, the parameters in all the models fitted by substituting the clearance rate in models (M4, M7, M9, M10, M11, and M12) with the above two functional forms were not identifiable.
Similarly, we attempted the following flexible functional form for the infection rate in models M5, M8, M10, and M12;

The results were also not significantly different from the initial models.
We also attempted the following form for the infection rate where it is allowed to vary both by age and season,

and evaluated models M1, M2, M4, M7 with this expression substituted for the infection rate. The model obtained from M1 by replacing the infection rate with the above expression gave better results (AIC=2572·0) than M3 and M5 where the infection rates were allowed to vary only by age or by season. Similarly, the model obtained from M4 (AIC=2547·4) also gave a better fit than M10 where the infection rate was allowed to vary only by age; and gave a similar fit to M9 where the infection rate was allowed to vary only by season. However, the parameters in the models obtained from M2 and M7 (which represents the most interesting case since the detectability is allowed to vary by age) were not identifiable. The models obtained from M1 and M4 indicated a seasonal variation in infection rates with a slow decrease with age and that obtained from M4 also indicated a significant increase in clearance rate with age.
The best model by the AIC criterion remained M6.
As in our previous work (Sama et al. 2005) our analysis assumed that re-infection with a given genotype is a rare event. In order to assess the impact of this assumption, we excluded the most frequent genotype from the dataset, and repeated the analysis of models M1–M12. The infection and clearance rates obtained from this modification were very similar to those from the complete dataset, while detectability estimates were rather lower, (e.g. reduced to s=0·38 in model M1). The AIC results were similar to those in the full dataset.
DISCUSSION
An important gap in knowledge of the epidemiology of malaria is in the effect of acquired immunity on the duration of infection. The rate at which Plasmodium falciparum infections are cleared is often thought to be highly affected by acquired immunity but the empirical evidence for this is weak. Most studies on this are based on data obtained from light microscopy, a technique which cannot distinguish between persisting and new infections. The failure to detect low-density infections and the inability to distinguish the concurrent infections within a host at a given time also potentially lead to bias in estimates of infection and recovery rates from light microscopy data (for instance as in the studies of Bekessy, Molineaux and Storey, 1976; Kitua et al. 1996; Sama et al. 2004). A single continuously infected individual, appears by microscopy neither to contribute to the pool of new infections nor to that of infections that have been cleared. Durations estimated from microscopy data will also highly depend on whether the data were derived from repeated cross-sectional studies or from longitudinal studies (Sama et al. 2004).
With the availability of PCR genotype specific transition data, it is now apparent that continuously infected individuals are experiencing repeated super-infection and clearance of specific genotypes, and PCR analyses can therefore give more reliable estimates of infection and recovery rates. The estimate of the overall infection rate in our study, as might have been expected, is much higher than in studies using microscopy data. Estimates of duration of infection from PCR, which are for a single monoclonal infections (Smith et al. 1999b; Smith and Vounatsou, 2003; Sama et al. 2005), tend to be shorter than those from microscopy data (Macdonald and Göckel, 1964; Bekessy et al. 1976; Kitua et al. 1996; Sama et al. 2004) which are for polyclonal combinations of old and new infections.
Our previous model for P. falciparum genotype data from a study in Northern Ghana (Sama et al. 2005) assumed that the transition rates and the detection process were homogeneous. The present analysis extends this to allow different age dependences in the clearance rate, infection rate, and detectability and thus for age dependence in multiplicity of infection. Some of the models also allow for seasonal variation in the infection rates. Age dependence in multiplicity is generally found in highly endemic areas (Ntoumi et al. 1995; Smith et al. 1999c) but its relationship to acquired immunity has been unclear. No other PCR study has analysed transition rates with a complete age representation of the population.
We find that there is a decrease in detectability with increasing age. Since the parasite densities decrease with age and it is expected that a genotype is less likely to be detected if the density is low, the decrease with age in detectability was anticipated. Detectability varied from about 60% in younger individuals to 10% in adults.
Immunity is known to increase with age and it has often been assumed that duration of infection must decrease as immunity is acquired. Some studies have found that infections are of very short duration in infants (Walton, 1947; Kitua et al. 1996; Smith et al. 1999b) and one study in young children estimated that duration increases with age (Smith et al. 2003). In our analysis, the models that did not include age dependence in detectability estimated significant increases in the clearance rate with age. However, our best fitting models allow for age dependence in detectability and found no residual effect of age on clearance rates, but we have to treat this conclusion with caution because the parameter estimates for the age effect on clearance are rather strongly correlated with those for age dependence in detectability.
The estimated duration of infection was not greatly modified by allowing for seasonal variation in the infection process, although infections were found to be highly seasonal. The use of 6 different parameters for the infection rates allowed us to obtain season-specific estimates for the infection rates with the highest infection rate estimated from our best model, M6, is 31 new infections per year, during the period June to August which is the peak transmission season in this area (Binka et al. 1994; Baird et al. 2002). This implies that individuals may acquire as many as 5 new infections during this period.
In separate models (M5, M8, M10, M12) we allowed the infection rate to vary only by age, the best model among these was M8 that indicated a decrease in infection rate with age, but this was not statistically significant (see Fig. 2 for comparison of M8 and M2). Some studies have suggested that infection rates in children are higher than in older people (Rogier and Trape, 1995), as would be expected if immunity to infection is acquired. However, the attractiveness of the human host to mosquitoes in general increases with host size (Port, Boreham and Bryan, 1980), which should lead to an increase in infection rates with age (Smith et al. 2004). The overall best model among the 12 models we considered was M6 that included season- but not age dependence in infection rates.
Our results should be interpreted cautiously because none of our models allows simultaneously for seasonal variation in infection rates or detectability, variation of infection rates with age, or variation of clearance rate with age. Further work needs to be done to capture all these variations and this will need a substantial amount of information, covering a wide range of age groups, from different endemic, geographical, and cultural settings. The present models also ignore heterogeneity between genotypes, which may also be important.
We assumed age to be the only factor leading to heterogeneity in infection rates across the population. However, on 26% of visits respondents indicated that they slept under bednets. It is likely that these nets moderated the infection rate but had little effect on the clearance rate. Patterns of treatment for febrile illness in the KND are complex (Owusu et al. manuscript submitted) often involving ineffective medications or inappropriate dosing. We did not record treatments used by the participants during the study or attempt to model effects of treatment but it is clear that the use of anti-malarial treatments will increase the clearance rate and so may have biased downwards our estimates of duration.
A further improvement would be to directly incorporate information about parasite densities. The clearest effect of acquired immunity is in reducing the mean parasite density, and this must account for a large element of the decrease in detectability with age. The question of how to incorporate the extra information contributed by the parasite density while avoiding identifiability problems deserves further attention. There is likely to be a change in both detectability and clearance rate if this information is well accounted for.
We thank the staff of the Navrongo Research Health Centre involved in the field work and the villagers for their co-operation. We also thank Beatrice Glinz for her contribution to the genotyping. Wilson Sama was in receipt of stipends from the Stipendiumkommission of the Amt für Ausbildungsbeiträge of the Canton of Basel, and from the Swiss National Science Foundation (Project no. 3300CO–105994/1).