Introduction
Chalcopyrite is the principal ore mineral of copper (Geoscience Australia, 2015). Concentrates produced from chalcopyrite-rich ores may also be enriched significantly in other elements. Silver is one such element and is commonly extracted as an economic by-product during copper smelting and refining (Ayres et al., Reference Ayres, Ayres and Råde2013). Other elements, including As, Sb, Hg, Bi and Se, may become enriched in copper concentrates during ore processing and can, if present at high enough concentrations, result in substantial financial penalties when sold on the world market (e.g. Fountain, Reference Fountain2013). Yet, regardless of the importance of chalcopyrite in the minerals industry, there is a relative lack of understanding as to the different trace elements chalcopyrite can accommodate into its structure, as well as the ranges of concentration of these elements.
Detailed studies addressing trace-element concentrations in chalcopyrite are relatively scarce when compared to other common sulfide minerals, notably pyrite (e.g. Huston et al., Reference Huston, Sie, Suter, Cooke and Both1995; Large et al., Reference Large, Danyushevsky, Hollit, Maslennikov, Meffre, Gilbert, Bull, Scott, Emsbo, Thomas, Singh and Foster2009; Winderbaum et al., Reference Winderbaum, Ciobanu, Cook, Paul, Metcalfe and Gilbert2012; Belousov et al., Reference Belousov, Large, Meffre, Danyushevsky, Steadman and Beardsmore2016), or sphalerite and galena (e.g. Bethke and Barton, Reference Bethke and Barton1971; Blackburn and Schwendeman, Reference Blackburn and Schwendeman1977; Johan, Reference Johan1988; Foord and Shawe, Reference Foord and Shawe1989; Cook et al., Reference Cook, Ciobanu, Pring, Skinner, Shimizu, Danyushevsky, Saini-Eidukat and Melcher2009; George et al., Reference George, Cook, Ciobanu and Wade2015). Much of the published data for chalcopyrite (e.g. Harris et al., Reference Harris, Cabri and Nobiling1984; Cabri et al., Reference Cabri, Campbell, Laflamme, Leigh, Maxwell and Scott1985; Kase, Reference Kase1987; Brill, Reference Brill1989; Huston et al., Reference Huston, Jablonski and Sie1996; Scott et al., Reference Scott, Ashley and Lawie2001; Moggi-Cecchi et al., Reference Moggi-Cecchi, Cipriani, Rossi, Ceccato, Rudello and Somacal2002; Serranti et al., Reference Serranti, Ferrini, Masi, Nicoletti and Conde2002; Shalaby et al., Reference Shalaby, Stumpfl, Helmy, El Mahallawi and Kamel2004; Demir et al., Reference Demir, Uysal, Burhan Sadiklar and Sipahi2008; Layton-Matthews et al., Reference Layton-Matthews, Peter, Scott and Leybourne2008; Monteiro et al., Reference Monteiro, Xavier, Hitzman, Juliani, de Souza Filho and Carvalho2008; Demir et al., Reference Demir, Uysal and Sadıklar2013; Gena et al., Reference Gena, Chiba, Kase, Nakashima and Ishiyama2013; Reich et al., Reference Reich, Palacios, Barra and Chryssoulis2013; Cioacă et al., Reference Cioacă, Munteanu, Qi and Costin2014; Helmy et al., Reference Helmy, Shalaby and Rahman2014; Wang et al., Reference Wang, Wang, Shi, Zhang and Wang2015a; Wohlgemuth-Ueberwasser et al., Reference Wohlgemuth-Ueberwasser, Viljoen, Petersen and Vorster2015; Sadati et al., Reference Sadati, Yazdi, Mao, Behzadi, Adabi, Lingang, Zhenyu and Mokhtari2016) is focused on a limited suite of trace elements, and commonly the minimum detection limits of the microanalytical techniques used are too high to actually establish trace-element diversity and concentration levels.
More work is thus necessary to establish the ability of chalcopyrite to host trace elements in a wide range of environments and settings. With this objective in mind, we used laser-ablation inductively-coupled plasma mass spectrometry (LA-ICP-MS) to determine the concentration ranges of 18 trace elements (elements typically present at concentrations < 1 wt.%) in natural hydrothermal chalcopyrite from a diverse suite of 53 samples from different ore types, settings and environments, and physiochemical conditions of ore formation. The trace-element chemistry of chalcopyrite in deposits of magmatic origin is not part of this study. A number of studies on the topic have been published, enabling a sound understanding of trace-element partitioning in chalcopyrite-bearing magmatic ores (e.g. Barnes et al., Reference Barnes, Cox and Zientek2006; Holwell and McDonald, Reference Holwell and McDonald2007; Godel and Barnes, Reference Godel and Barnes2008; Dare et al., Reference Dare, Barnes, Prichard and Fisher2010; Djon and Barnes, Reference Djon and Barnes2012; Piña et al., Reference Piña, Gervilla, Barnes, Ortega and Lunar2012; Prichard et al., Reference Prichard, Knight, Fisher, McDonald, Zhou and Wang2013; Chen et al., Reference Chen, Song, Danyushevsky, Wang, Tian and Xiao2014; Duran et al., Reference Duran, Barnes and Corkery2015; Barnes and Ripley, Reference Barnes, Ripley, Harvey and Day2016; Smith et al., Reference Smith, Holwell, McDonald and Boyce2016). The LA-ICP-MS technique offers both sub-part-per-million-level precision for many heavier elements and micrometre-scale spatial resolution. Laser-ablation ICP-MS may also reveal the presence of micro-inclusions within the analysed spot because if they are large enough and distributed heterogeneously, they are recognizable on time-resolved downhole spectra (e.g. George et al., Reference George, Cook, Ciobanu and Wade2015). The dataset reveals chalcopyrite to be an important trace-element carrier in many ore deposits. Our data carries implications for both ore genesis and mineral processing. We also show that the Cd:Zn ratio in chalcopyrite (and co-existing sphalerite) may assist in determining if physiochemical conditions remained constant during base-metal sulfide crystallization.
Background
Chalcopyrite crystal structure
Chalcopyrite crystallizes in a body-centred tetragonal lattice system with tetrahedrally-coordinated Cu, Fe and S atoms. Both Cu and Fe are ordered into the cation sites. Pauling and Brockway (Reference Pauling and Brockway1932) regarded the bonding between atoms in the chalcopyrite structure as effectively covalent with valencies of Cu and Fe atoms fluctuating between monovalent-divalent, and divalent-trivalent, respectively. The strong covalent nature of chalcopyrite was also affirmed by Donnay et al. (Reference Donnay, Corliss, Donnay, Elliott and Hastings1958). Similarly, Hall and Stewart (Reference Hall and Stewart1973) argued for a strong covalent configuration with an effective ionic state between Cu+Fe3+S22- and Cu2+Fe2+S22- Nevertheless, for the sake of convenience, chalcopyrite is generally represented with ions of specific valencies, i.e. Cu+Fe3+S22-.
Regardless, Todd and Sherman (Reference Todd and Sherman2003), Todd et al. (Reference Todd, Sherman and Purton2003) and Mikhlin et al. (Reference Mikhlin, Tomashevich, Tauson, Vyalikh, Molodtsov and Szargan2005) have argued, on the basis of X-ray absorption spectroscopy (XAS) and X-ray absorption near-edge structure (XANES) spectra, that the nominal valencies in chalcopyrite should be Cu2+Fe2+S22-. This was rejected by Pearce et al. (Reference Pearce, Pattrick, Vaughan, Henderson and Van der Laan2006), who affirmed that Cu in chalcopyrite is nominally monovalent, and that Fe is nominally trivalent. Nominally divalent character in copper sulfides is very rare, and energy peaks associated with Cu2+ can be explained by contamination by Cu2+ species. Li et al. (Reference Li, Kawashima, Li, Chandra and Gerson2013) confirmed that evidence for the presence of Cu2+ and Fe2+ has been largely discredited, but emphasizes that the actual valence state of chalcopyrite should be understood as intermediate between Cu+Fe3+S22- and Cu2+Fe2+S22- due to covalent bonding.
Previous trace-element data
A number of previous studies addressed the composition of natural chalcopyrite, yet most of these had purposes other than to establish if chalcopyrite is a good host for trace elements. Chalcopyrite from various locations has been described by Kase (Reference Kase1987), Brill (Reference Brill1989), Scott et al. (Reference Scott, Ashley and Lawie2001), Serranti et al. (Reference Serranti, Ferrini, Masi, Nicoletti and Conde2002), Shalaby et al. (Reference Shalaby, Stumpfl, Helmy, El Mahallawi and Kamel2004), Demir et al. (Reference Demir, Uysal, Burhan Sadiklar and Sipahi2008), Layton-Matthews et al. (Reference Layton-Matthews, Peter, Scott and Leybourne2008), Monteiro et al. (Reference Monteiro, Xavier, Hitzman, Juliani, de Souza Filho and Carvalho2008), Demir et al. (Reference Demir, Uysal and Sadıklar2013), Gena et al. (Reference Gena, Chiba, Kase, Nakashima and Ishiyama2013), Cioacă et al. (Reference Cioacă, Munteanu, Qi and Costin2014), Helmy et al. (Reference Helmy, Shalaby and Rahman2014), Wang et al. (Reference Wang, Wang, Shi, Zhang and Wang2015a) and Sadati et al. (Reference Sadati, Yazdi, Mao, Behzadi, Adabi, Lingang, Zhenyu and Mokhtari2016). However, in each case, only electron probe microanalysis (EPMA) is used to determine chalcopyrite composition. With minimum detection limits in the order of hundreds of ppm unless exceptionally long count times are used, EPMA is not an adequate technique for determining many trace-element abundances. Harris et al. (Reference Harris, Cabri and Nobiling1984), Cabri et al. (Reference Cabri, Campbell, Laflamme, Leigh, Maxwell and Scott1985), Huston et al. (Reference Huston, Jablonski and Sie1996) and Moggi-Cecchi et al. (Reference Moggi-Cecchi, Cipriani, Rossi, Ceccato, Rudello and Somacal2002) used a proton microprobe, Reich et al. (Reference Reich, Palacios, Barra and Chryssoulis2013) used secondary ion mass spectrometry (SIMS) and Wohlgemuth-Ueberwasser et al. (Reference Wohlgemuth-Ueberwasser, Viljoen, Petersen and Vorster2015) used LA-ICP-MS to investigate chalcopyrite from different localities. While these analytical techniques boast minimum detection limits significantly lower than EPMA, none of these studies reported data for more than six elements. The elements reported are typically common trace constituents, so few inferences about the presence of other trace elements could be drawn. Chalcopyrite compositions were determined by Bajwah et al. (Reference Bajwah, Seccombe and Offler1987), Butler and Nesbitt (Reference Butler and Nesbitt1999) and Ulrich et al. (Reference Ulrich, Golding, Kamber, Zaw and Taube2002) by atomic absorption spectroscopy (AAS), solution ICP-MS and ICP optical emission spectrometry (OES), respectively. These techniques remain bulk methods and so are limited in their ability to determine lattice bound trace constituents with confidence. Other studies such as Subba Rao and Naqvi (Reference Subba Rao and Naqvi1997), McClenaghan et al. (Reference McClenaghan, Lentz, Martin and Diegor2009), Cook et al. (Reference Cook, Ciobanu, Danyushevsky and Gilbert2011) and Maydagán et al. (Reference Maydagán, Franchini, Lentz, Pons and McFarlane2013) only measured chalcopyrite in a limited number of samples (maximum of four), as they primarily focused on characterizing the chemistry of complex phase assemblages. The different emphasis of such studies highlights the need for a more detailed investigation of a larger, more diverse sample suite, considering a wider range of potential trace elements, and utilizing an analytical technique with low minimum detection limits. We acknowledge that the spectrum of elements analysed in chalcopyrite has been somewhat restricted by the availability of appropriate matrix-matched standards, particularly with respect to some chalcophile semi-metals, and thus data quality remains, to this day, better for some elements than for others (e.g. Se, As, Au).
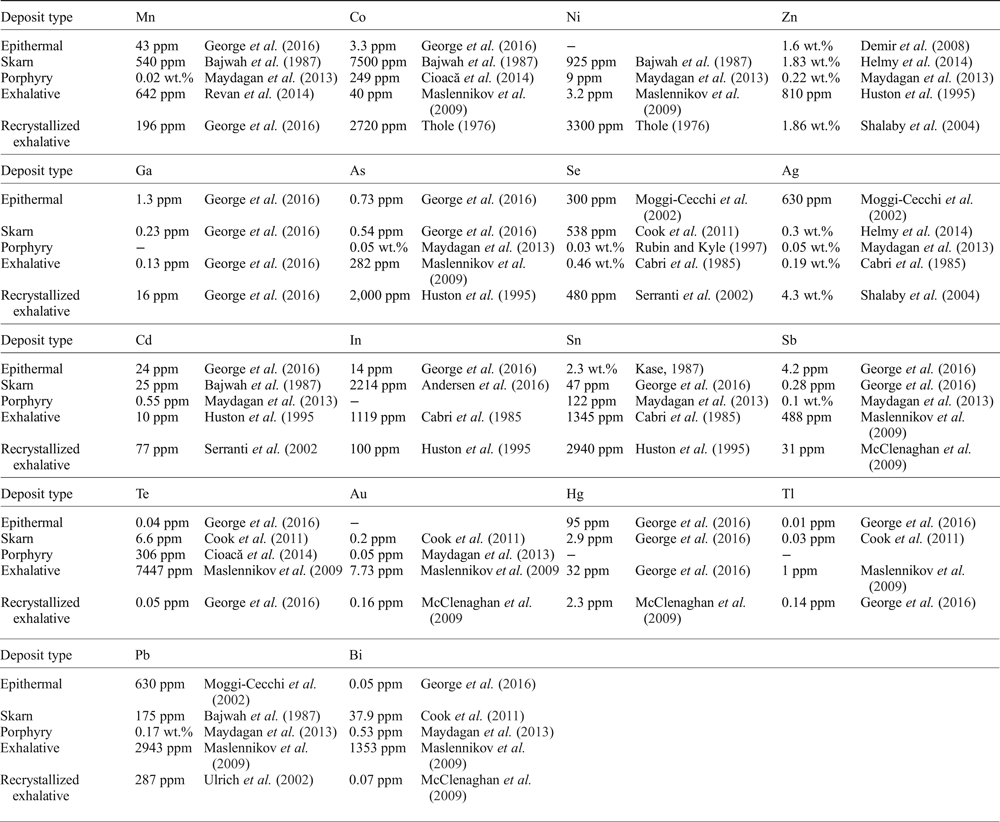
Regardless of their limitations, the prior studies cited above, and indeed other more thorough investigations of chalcopyrite composition (e.g. Huston et al., Reference Huston, Sie, Suter, Cooke and Both1995; Maslennikov et al., Reference Maslennikov, Maslennikova, Large and Danyushevsky2009; Revan et al., Reference Revan, Genç, Maslennikov, Maslennikova, Large and Danyushevsky2014; Wang et al., Reference Wang, Xu, Zhang, Zou, Wang, Yu and Hu2015b; George et al., Reference George, Cook and Ciobanu2016), provide a valuable background for understanding chalcopyrite as a trace-element carrier and serve as a broad foundation for the present study. The maximum reported concentrations of various trace elements in chalcopyrite from different deposit types is summarized in Table 1.
Table 1. Maximum reported trace-element contents of chalcopyrite by deposit type as reported in the literature.
Only anomalous reports that have obviously been influenced by micro-inclusions are excluded. Other reports may still be influenced by micro-inclusions. The literature review was thorough, though not exhaustive.
Silver is the trace element most commonly reported in chalcopyrite. Shalaby et al. (Reference Shalaby, Stumpfl, Helmy, El Mahallawi and Kamel2004) described unusual green chalcopyrite from the Um Samiuki volcanogenic massive sulfide (VMS) deposit, Egypt, hosting up to 4.3 wt.% Ag. More typically, concentrations are in the tens to hundreds of ppm range, although sometimes reaching into the thousands, for example from the Izok Lake Zn-Cu-Pb deposit, Northwest Territories, Canada (Harris et al., Reference Harris, Cabri and Nobiling1984), the Kidd Creek mine, Ontario, Canada (Cabri et al., Reference Cabri, Campbell, Laflamme, Leigh, Maxwell and Scott1985), the Bottino Mine, Italy (Moggi-Cecchi et al., Reference Moggi-Cecchi, Cipriani, Rossi, Ceccato, Rudello and Somacal2002), and Mantos Blancos, northern Chile (Reich et al., Reference Reich, Palacios, Barra and Chryssoulis2013).
Experiments in the Cu-Fe-Zn-S system have revealed that chalcopyrite may dissolve up to 0.9 at.% zinc at 500°C, 0.8 at.% at 400°C and 0.6 at.% at 300°C (Kojima and Sugaki, Reference Kojima and Sugaki1985). Indeed Huston et al. (Reference Huston, Sie, Suter, Cooke and Both1995) measured Zn in chalcopyrite from Australian volcanic-hosted massive sulfide (VHMS) deposits at concentrations from below the minimum detection limit up to as much as 5 wt.%. They concluded that concentrations up to 2000 ppm probably reflect Zn in solid solution (substituted for Fe), but that concentrations exceeding 2000 ppm Zn are probably the result of micro-inclusions of sphalerite. Moggi-Cecchi et al. (Reference Moggi-Cecchi, Cipriani, Rossi, Ceccato, Rudello and Somacal2002) also concluded that high distributions of Zn in chalcopyrite from Italian and Slovak deposits are related predominantly to micro-scale inclusions of Zn-bearing phases. Nevertheless, large Zn values of 1.86 wt.%, 1.83 wt.%, 1.73 wt.% and 1.64 wt.% have been measured in chalcopyrite by Shalaby et al. (Reference Shalaby, Stumpfl, Helmy, El Mahallawi and Kamel2004), Helmy et al. (Reference Helmy, Shalaby and Rahman2014), Serranti et al. (Reference Serranti, Ferrini, Masi, Nicoletti and Conde2002) and Wang et al. (Reference Wang, Wang, Shi, Zhang and Wang2015a), respectively, and have not been attributed, in any of these cases, to inclusion-related Zn.
Huston et al. (Reference Huston, Sie, Suter, Cooke and Both1995) measured arsenic in chalcopyrite from Australian VHMS deposits into the thousands of ppm. These high concentrations of As could not readily be attributed to micro-inclusions of distinct As-bearing phases and it was concluded that As can substitute into the chalcopyrite lattice up to ~2000 ppm. Scott et al. (Reference Scott, Ashley and Lawie2001) and Wang et al. (Reference Wang, Wang, Shi, Zhang and Wang2015a) reported chalcopyrite containing up to 1600 ppm As from Woodlawn, New South Wales, Australia, and the Xiaozhen Cu deposit, Shaanxi Province, China, respectively.
Bethke and Barton (Reference Bethke and Barton1971) showed that chalcopyrite could accommodate as much as 0.5 mol.% eskebornite (CuFeSe2) at 390°C, and thus may be a significant host of selenium. Cabri et al. (Reference Cabri, Campbell, Laflamme, Leigh, Maxwell and Scott1985) reported as much as 0.46 wt.% Se in chalcopyrite from Kidd Creek, Ontario, Canada, while Monteiro et al. (Reference Monteiro, Xavier, Hitzman, Juliani, de Souza Filho and Carvalho2008) and Wang et al. (Reference Wang, Wang, Shi, Zhang and Wang2015a) each recorded over 2000 ppm Se in chalcopyrite from Xiaozhen, China, and Sossego, Brazil, respectively.
Exceptional reports of cobalt and nickel in chalcopyrite suggest that the Cu-sulfide may, on rare occasions, be a good host for Co and Ni. Bajwah et al. (Reference Bajwah, Seccombe and Offler1987) documented chalcopyrite from Big Cadia, New South Wales, Australia, which hosted up to 7500 ppm Co and 925 ppm Ni. Thole (Reference Thole1976) recorded up to 2700 ppm Co and 3300 ppm Ni in chalcopyrite from the Shamrocke mine, Zimbabwe. Wang et al. (Reference Wang, Wang, Shi, Zhang and Wang2015a) measured up to 1700 ppm Co and 4100 ppm Ni in chalcopyrite from the Xiaozhen Cu deposit, Shaanxi Province, China, while Wang et al. (Reference Wang, Xu, Zhang, Zou, Wang, Yu and Hu2015b) also reported chalcopyrite containing 6178 ppm Co and 2496 ppm Ni from the Shilu Fe-Co-Cu ore district in the Hainan Province of South China.
Lead concentrations in chalcopyrite are uncommonly reported in the thousands of ppm, though such high concentrations are probably the result of micro-inclusions of Pb-bearing phases, commonly galena. Among such anomalous reports are 7054 ppm Pb in chalcopyrite from Yaman-Kasy, Russia (Maslennikov et al., Reference Maslennikov, Maslennikova, Large and Danyushevsky2009), and 0.34 wt.% Pb in chalcopyrite from the Xiaozhen Cu deposit, Shaanxi Province, China (Wang et al., Reference Wang, Wang, Shi, Zhang and Wang2015a). Maximum reported Pb concentrations in chalcopyrite are ordinarily in the hundreds of ppm (e.g. Bajwah et al., Reference Bajwah, Seccombe and Offler1987; Moggi-Cecchi et al., Reference Moggi-Cecchi, Cipriani, Rossi, Ceccato, Rudello and Somacal2002).
High levels of bismuth and tellurium are measured in chalcopyrite from active seafloor hydrothermal systems. Gena et al. (Reference Gena, Chiba, Kase, Nakashima and Ishiyama2013) recorded up to 0.32 wt.% Bi in chalcopyrite associated with bismuthinite from the Tiger sulfide chimney, Southern okinawa Trough, Japan, while 45 ppm Te was measured in chalcopyrite from the Broken Spur vent field by Butler and Nesbitt (Reference Butler and Nesbitt1999). Nevertheless, chalcopyrite is generally a poor host of both elements with reported concentrations from ore deposits rarely exceeding 10 ppm (e.g. Maydagán et al., Reference Maydagán, Franchini, Lentz, Pons and McFarlane2013; George et al., Reference George, Cook and Ciobanu2016).
Chalcopyrite may contain at most up to a few ppm gold. Synthetic experiments carried out by Simon et al. (Reference Simon, Kesler, Essene and Chryssoulis2000) showed that up to 16 ppm Au is soluble in chalcopyrite at 500°C, decreasing to 4 ppm at 400°C. Reports of chalcopyrite hosting hundreds of even thousands of ppm Au are almost certainly related to Au-bearing mineral inclusions (e.g. Maslennikov et al., Reference Maslennikov, Maslennikova, Large and Danyushevsky2009). Nevertheless some studies have reported tens of ppm Au in chalcopyrite (e.g. Revan et al., Reference Revan, Genç, Maslennikov, Maslennikova, Large and Danyushevsky2014).
Although there are some rare reports of thousands of ppm antimony and cadmium in chalcopyrite (e.g. Revan et al., Reference Revan, Genç, Maslennikov, Maslennikova, Large and Danyushevsky2014), concentrations rarely reach into the hundreds of ppm. Monteiro et al. (Reference Monteiro, Xavier, Hitzman, Juliani, de Souza Filho and Carvalho2008) measured up to 330 ppm Sb in chalcopyrite from the Sossego IOCG deposit, Brazil, and up to 77 ppm Cd have been reported from Arinteiro, Galicia, Spain (Serranti et al., Reference Serranti, Ferrini, Masi, Nicoletti and Conde2002).
Over 2.3 wt.% tin has been measured in chalcopyrite from the Izumo vein, Toyoha mine, Japan (Kase, Reference Kase1987), and from a sulfide chimney in an active seafloor hydrothermal system (Gena et al., Reference Gena, Chiba, Kase, Nakashima and Ishiyama2013). Both studies attributed the Sn to solid solution. Huston et al. (Reference Huston, Sie, Suter, Cooke and Both1995) measured up to 2940 ppm Sn in chalcopyrite from the Dry River South VHMS deposit, Eastern Australia, and inferred that Sn substitutes for Fe. They noted that the highest Sn concentrations occur in the more reduced and highly metamorphosed deposits, which is a reflection of the tendency of Sn to only be transported in significant quantities at reduced, high-temperature conditions (Eugster, Reference Eugster1986). George et al. (Reference George, Cook and Ciobanu2016) confirmed that in deposits that have recrystallized at amphibolite facies and above, chalcopyrite will typically host more Sn than co-crystallizing sphalerite or galena.
Reports of high levels of manganese in chalcopyrite originate from VMS deposits. Revan et al. (Reference Revan, Genç, Maslennikov, Maslennikova, Large and Danyushevsky2014) reported chalcopyrite containing up to 958 ppm Mn from VMS deposits of the eastern Pontide orogenic belt, NE Turkey, while Maslennikov et al. (Reference Maslennikov, Maslennikova, Large and Danyushevsky2009) measured up to 771 ppm Mn in chalcopyrite from the Yaman-Kasy VMS deposit, Southern Urals, Russia.
Chalcopyrite is isostructural with roquesite (CuInS2) and thus significant concentrations of indium can be hosted in chalcopyrite, most probably in the Fe site (Wittmann, Reference Wittmann and Wedepohl1974). In the SW England ore region, chalcopyrite accounts for the majority of the In budget (locally containing up to 2200 ppm) despite sphalerite and stannite-group minerals typically hosting higher concentrations (Andersen et al., Reference Andersen, Stickland, Rollinson and Shail2016). Cabri et al. (Reference Cabri, Campbell, Laflamme, Leigh, Maxwell and Scott1985) reported chalcopyrite from the Kidd Creek deposit, Canada, carrying as much as 1119 ppm In, while Kieft and Damman (Reference Kieft and Damman1990) measured up to 0.9 wt.% In in chalcopyrite from the Gåsborn area, West Bergslagen, Sweden.
Reports of gallium, mercury and thallium in chalcopyrite are rare and concentrations are almost exclusively in the order of a few ppm (e.g. Maslennikov et al., Reference Maslennikov, Maslennikova, Large and Danyushevsky2009; McClenaghan et al., Reference McClenaghan, Lentz, Martin and Diegor2009; Cook et al., Reference Cook, Ciobanu, Danyushevsky and Gilbert2011). Revan et al. (Reference Revan, Genç, Maslennikov, Maslennikova, Large and Danyushevsky2014) did, however, report chalcopyrite containing up to hundreds of ppm Tl.
Sample suite
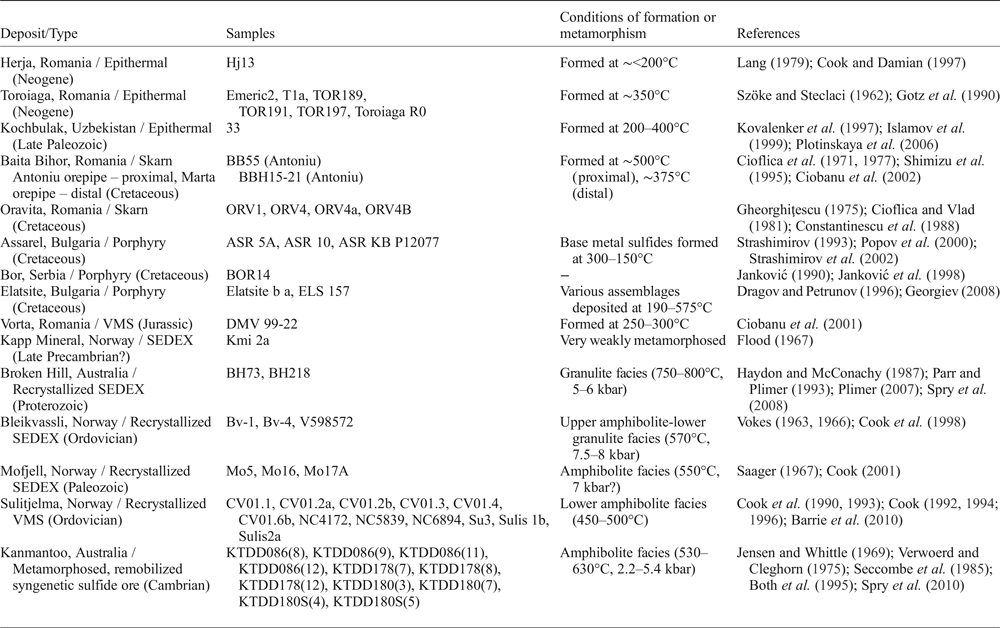
Fifty-three samples were analysed from 15 different deposits in Australia, Bulgaria, Norway, Romania, Serbia and Uzbekistan (Table 2). The selected deposits are from a variety of different ore types including epithermal, skarn, porphyry, VMS, and sedimentary exhalative (SEDEX) systems. Some VMS and SEDEX sulfide ores have been recrystallized due to regional metamorphism and deformation.
Table 2. Summary of deposits and samples used in this study.
Abbreviations: VMS = volcanogenic massive sulfide, SEDEX = sedimentary exhalative.
Seven samples originated from the Romanian epithermal systems Herja and Toroiaga; and an additional sample was added from the Kochbulak epithermal deposit in Uzbekistan. Six samples originated from the Romanian skarn deposits, Baita Bihor and Oravita. The Bulgarian porphyry deposits of Assarel and Elatsite contributed five samples, and another porphyry sample was from Bor (Serbia). The undeformed Vorta VMS deposit, Romania, and SEDEX Kapp Mineral prospect, Norway, contributed one sample each. SEDEX deposits in which the sulfide assemblages recrystallized during regional metamorphism and deformation (recrystallized SEDEX) contributed eight samples; two from Broken Hill, Australia, and six from Bleikvassli and Mofjell in Norway. Twelve samples came from the Norwegian VMS deposit Sulitjelma, in which the sulfide assemblages also recrystallized during metamorphism and deformation (recrystallized VMS). Finally, eleven samples were added from the Kanmantoo deposit, South Australia, interpreted as a metamorphosed, remobilized syngenetic sulfide ore. Brief descriptions of these deposits are provided as Supplementary Appendix A, together with key references for each.
Experimental methods
Each sample was prepared as a polished block and characterized by reflected light microscopy and back-scattered electron (BSE) imaging prior to LA-ICP-MS analysis. Only areas of chalcopyrite grains free of noticeable inclusions were selected for LA-ICP-MS analysis.
Laser-ablation ICP-MS analysis was carried out using a Resonetics M-50-LR 193 nm Excimer laser attached to an Agilent 7700cx Quadrupole ICP mass spectrometer (Adelaide Microscopy, The University of Adelaide). The Resonetics laser, designed by Laurin Technic Pty., uses a two-volume ablation cell for outstanding trace-element sensitivity, washout and stability (Müller et al., Reference Müller, Shelley, Miller and Broude2009). The ablation cell was filled with UHP He (0.7 L/min) that was mixed with Ar (0.93 L/min) after leaving the cell, and was introduced directly to the torch through a ‘squid’ (pulse homogenizing device). The ICP-MS was calibrated regularly in order to maximize sensitivity, whilst keeping production of molecular oxide species (i.e. 232Th16O/232Th) and doubly-charged ion species (i.e. 140Ce2+/140Ce+) as low as possible, and typically <0.2%.
The laser beam energy output was set at 100 mJ at a 26 µm spot size using a repetition rate of 10 Hz. Each analysis comprised a 30 s background measurement followed by 30 s of sample ablation, while a 40 s delay was allowed after each spot analysis to ensure adequate cell wash-out, gas stabilization, and computer processing time. Analysed isotopes include 34S, 55Mn, 57Fe, 59Co, 60Ni, 65Cu, 66Zn, 69Ga, 75As, 82Se, 95Mo, 107Ag, 111Cd, 115In, 118Sn, 121Sb, 125Te, 182W, 197Au, 202Hg, 205Tl, 206Pb, 207Pb, 208Pb and 209Bi. Dwell times for In, Au and Tl were set to 0.05 s, while all other elements were set to 0.01 s. Mean errors and the minimum detection limits for common trace elements in each sample are provided as Supplementary Appendix B. Typically 10 analyses were made on chalcopyrite in a given sample and as many multiple grains were analysed as possible. Multiple analyses of the MASS-1 sulfide reference material (formerly PS-1; Wilson et al., Reference Wilson, Ridley and Koenig2002) bracketed batches of up to 10 unknown analyses. This allowed monitoring of instrument drift, and a linear correction based on the bracketed MASS-1 analyses was applied to all unknown analyses. The latest MASS-1 certificate of analysis (United States Geological Survey, 2014) was used. The stoichiometric nature of chalcopyrite was checked and confirmed by electron probe microanalysis, which also indicated that trace elements were typically present at concentrations below minimum detection limits for that method. Thus, a value of 34.63 wt.% Cu (stoichiometric chalcopyrite) was used as an internal standard. GLITTER data reduction software (Van Achterbergh et al., Reference Van Achterbergh, Ryan, Jackson and Griffin2001) was used to carry out data calculations. Given poorly constrained sulfur isotopic interference on 66Zn measurements (e.g. Danyushevsky et al., Reference Danyushevsky, Robinson, Gilbert, Norman, Large, McGoldrick and Shelley2011), we accept that the concentration data for Zn reported here may be less accurate than for some other elements. We also acknowledge that there exist a number of other polyatomic interferences that may necessitate, in cases where concentrations of the interfered element are sufficiently high, correction to derive precise abundance data using LA-ICP-MS. Examples include direct mass interference from 115Sn when measuring the content of In (Jenner and O'Neill, Reference Jenner and O'Neill2012), or 59Co16O interference when measuring 75As (Patten et al., Reference Patten, Barnes, Mathez and Jenner2013). We have not made such corrections to the dataset, as, although such interferences can impact on data quality when the elements concerned are present at wt.% concentration = s, we are confident that they are negligible (well within instrumental error) for low ppm values of the order reported here. An exhaustive treatment of all potential interferences for all trace elements would be well beyond the scope of the present manuscript.
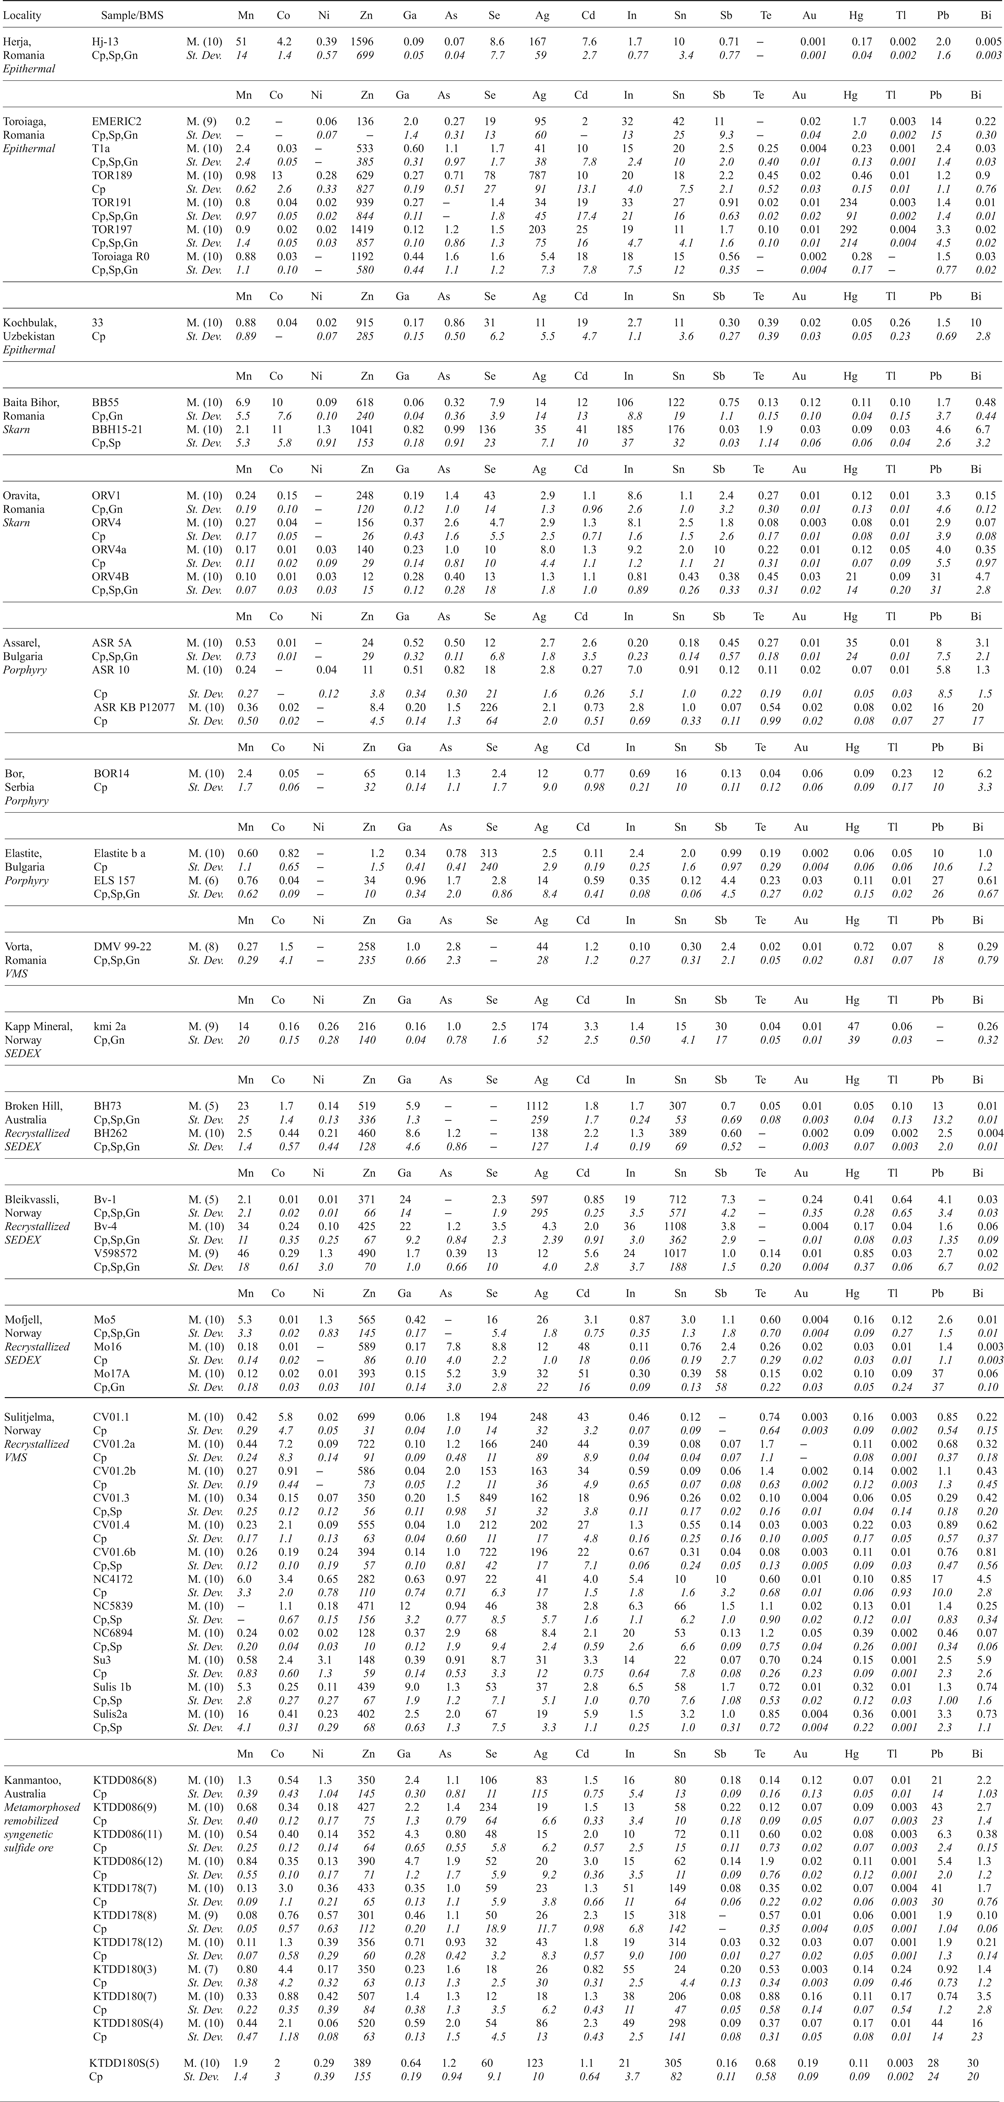
Table 3. Summary of trace-element concentrations in chalcopyrite determined by LA-ICP-MS (data in ppm).
Abbreviations – BMS: base metal sulfides, Cp: chalcopyrite, Sp: sphalerite, Gn: galena, M.: mean, St. Dev.: standard deviation.
(X) = number of individual spot analyses in that sample. Dash = insufficient data to perform calculation (all analyses < mdl). Other < mdl values were treated as mdl/2.
The 18 elements displayed are commonly present at measurable concentrations. Mo and W were measured but are rarely present above minimum levels of detection.
Results
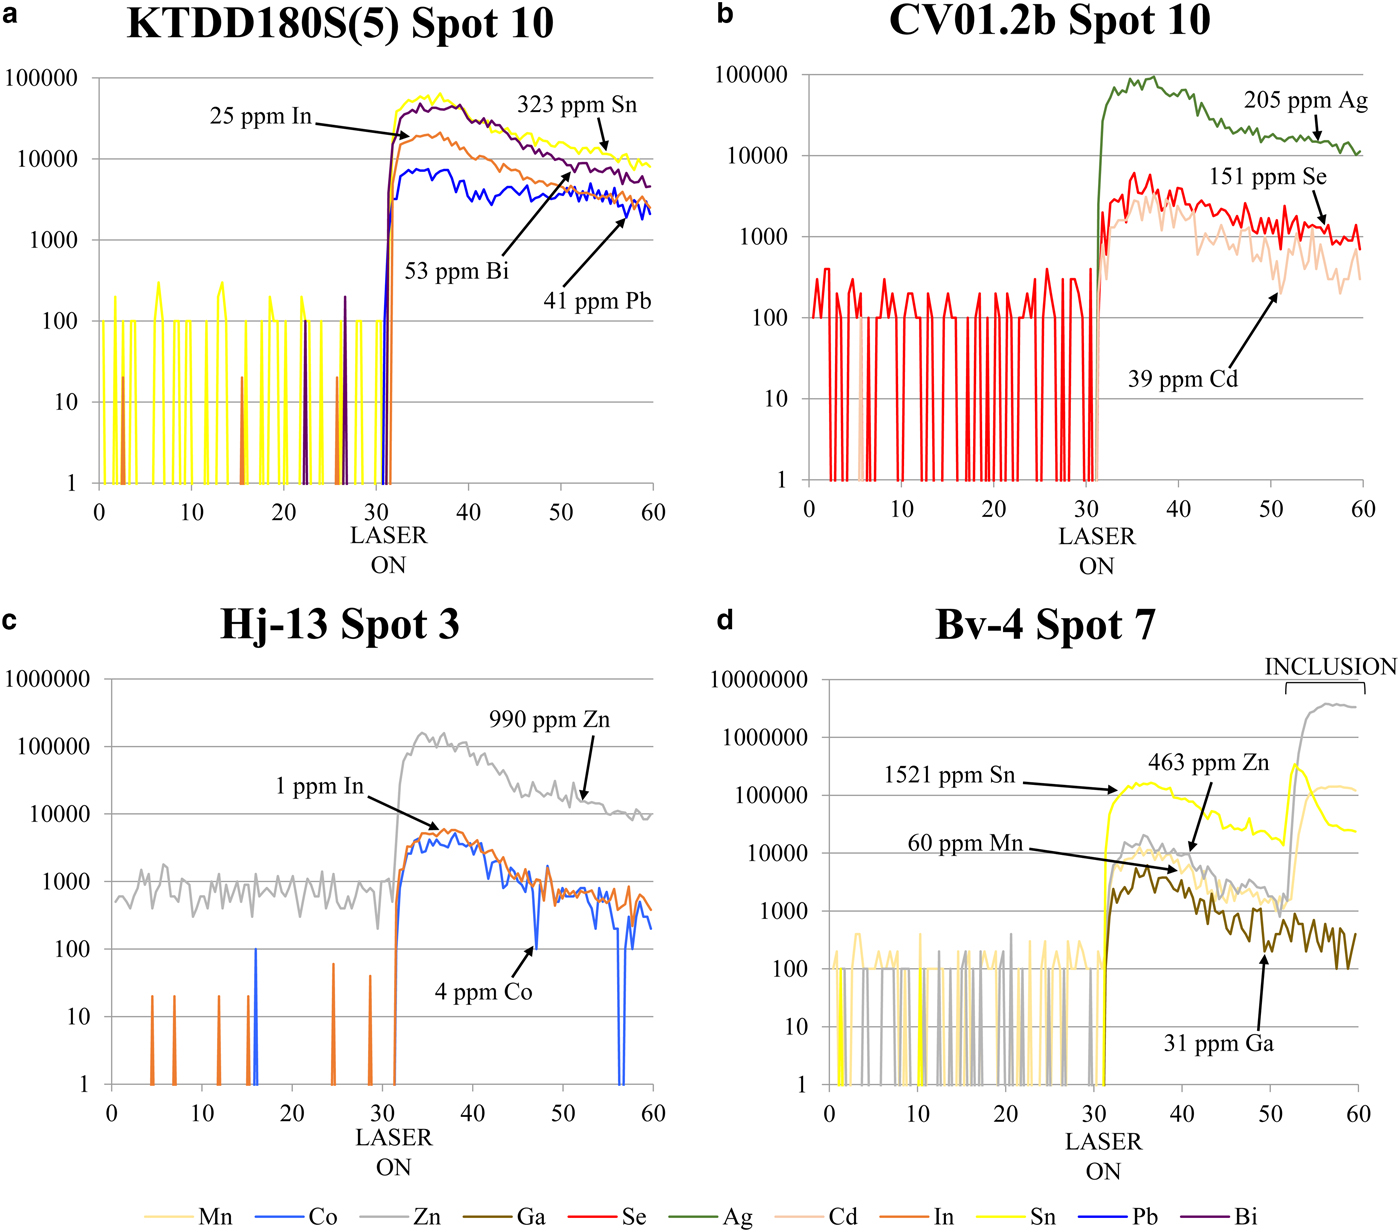
Distinguishing whether a trace element is present in solid solution as opposed to microscale mineral inclusions within a given mineral is an ongoing difficulty for microanalytical research (e.g. Cook et al., Reference Cook, Ciobanu, George, Zhu, Wade and Ehrig2016). In order to produce a reliable dataset, it is integral that all data is properly evaluated and great care is taken to monitor information that may suggest the presence of inclusions (for example LA-ICP-MS downhole spectra; e.g. George et al., Reference George, Cook, Ciobanu and Wade2015, assessing all element combinations that may indicate inclusions; e.g. proton microprobe work of Cabri et al., Reference Cabri, Campbell, Laflamme, Leigh, Maxwell and Scott1985 or Huston et al., Reference Huston, Sie, Suter, Cooke and Both1995). If not, doubt may be placed on the reliability of any anomalous trace-element report from the literature, especially those where wt.% levels have been measured for trace elements typically present at ppm levels. Nevertheless, one must also be cautious in attributing an anomalous trace-element report from the literature to micro-inclusions of a distinct phase, simply because it is uncharacteristic. Given the right conditions, many minerals may host anomalous concentrations of trace elements not easily attributed to micro-inclusions. We have endeavoured to only analyse areas of chalcopyrite that were free of any noticeable inclusions. Nevertheless, some analyses showed anomalous results, and corresponding LA-ICP-MS downhole spectra revealed irregular profiles implying the presence of micro-inclusions beneath the chalcopyrite surface. Such analyses were discarded. The remaining LA-ICP-MS downhole spectra were relatively smooth indicating measurement of trace-element concentrations in solid solution (Fig. 1). In some cases, where inclusions were only present at the end of an individual downhole spectrum (e.g. Fig. 1d), concentrations were still calculated by only integrating the signal before the inclusion-related peak. Table 3 summarizes the trace-element data, showing 18 trace elements measured in chalcopyrite. The full dataset is provided as Supplementary Appendix C. Individual spot analyses were plotted as cumulative plots (Fig. 2) allowing visualization of the trace-element variation within each deposit as well as within deposit types. Although the concentrations of some elements in chalcopyrite varied significantly across sample suites from individual deposits, variance was generally limited within any given sample. There was certainly no evidence of systematic grain-scale zonation as has been reported for other base metal sulfides (e.g. galena and sphalerite in low-temperature epithermal ores from Herja; George et al., Reference George, Cook, Ciobanu and Wade2015). Chondrite-normalized distribution plots (Fig. 3) were used to depict the mean trace-element compositions of chalcopyrite (as well as the range of concentrations) in each different deposit type. Molybdenum and W were seldom present in chalcopyrite at concentrations above minimum levels of detection (see footnote to Table 3).
Fig. 1. Representative time-resolved LA-ICP-MS downhole spectra for chalcopyrite. Y axis = counts per second, X axis = time (s). On each figure the point the laser was fired is indicated on the X axis. (a–c) Relatively flat spectra reflecting solid solution for Sn, In, Bi, Pb, Ag, Se, Cd, Zn and Co in chalcopyrite from Kanmantoo, Sulitjelma and Herja, respectively. The slight downward trajectory of the spectra indicates a lessening of ablated material over time due to gradual deepening of the ablation hole. (d) Relatively flat spectra for Ga (Bleikvassli). Peaks at the end of the Zn, Sn and Mn spectra (as marked on the figure) are suggestive of an inclusion of sphalerite. Concentrations are calculated by selecting and integrating only the signal before the peak.
Fig. 2. Cumulative plots showing individual spot concentrations of Mn, Co, Zn, Ga, Se, Ag, Cd, In, Sn, Sb, Hg, Tl, Pb and Bi in chalcopyrite from each deposit. Chalcopyrite concentration data for each deposit is sorted in ascending order and plotted in succession along the X axis. Y axis = concentration (parts per million). Red points are from epithermal deposits, green are from skarn deposits, yellow are from porphyry deposits, purple are from the Vorta VMS deposit, light blue are from the Kapp Mineral SEDEX prospect, orange are from recrystallized SEDEX deposits, dark blue are from the Sulitjelma recrystallized VMS deposit and grey are from the Kanmantoo deposit, interpreted as a metamorphosed, remobilized syngenetic sulfide ore. The average composition for each deposit type is given as a horizontal coloured line.
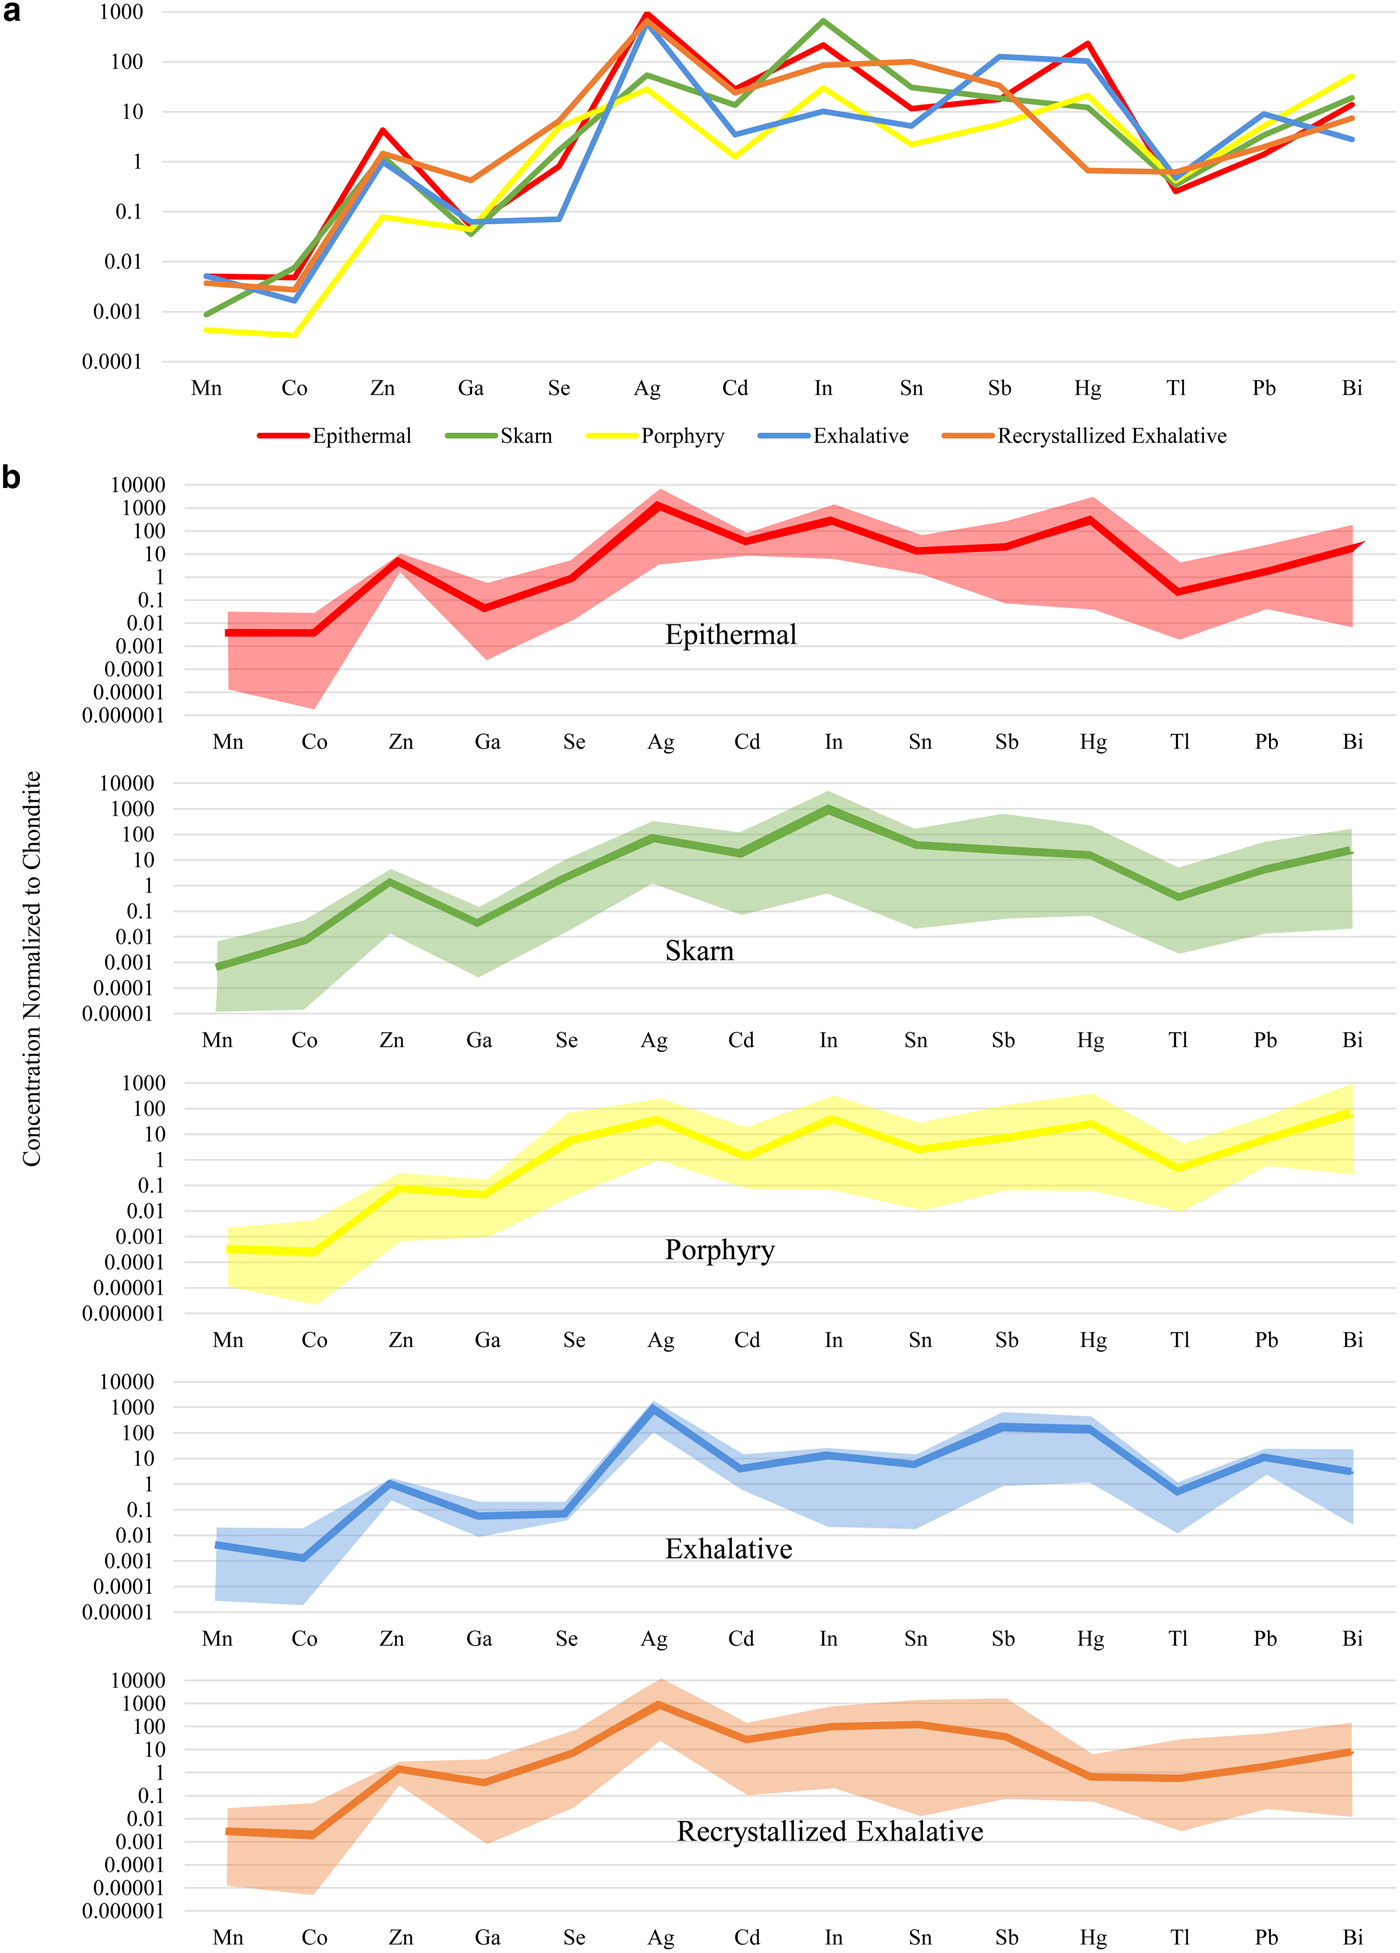
Fig. 3. Chondrite-normalized distribution plots for 14 common trace elements in chalcopyrite from different deposit types. Data normalized with values from McDonough and Sun (Reference McDonough and Sun1995). (a) Comparison of the mean concentration of each trace element in chalcopyrite from different deposit types. (b) Mean concentration and range of each trace element in chalcopyrite from epithermal, skarn, porphyry, exhalative and recrystallized exhalative deposits. Epithermal deposits consist of Herja, Toroiaga and Kochbulak, skarn deposits consist of Baita Bihor and Oravita, Porphyry deposits consist of Assarel, Bor and Elatsite, exhalative deposits consist of Vorta and Kapp Mineral and recrystallized exhalative deposits consist of Broken Hill, Bleikvassli, Mofjell and Sulitjelma.
Zinc was the trace element most highly concentrated in chalcopyrite – sample Hj-13 from Herja (epithermal) contained chalcopyrite that hosted as much as 1596 ppm Zn. Smooth LA-ICP-MS downhole spectra from Hj-13 indicated the Zn was present in solid solution (Fig. 1c). All chalcopyrite in samples from the epithermal deposits contained high levels of Zn; chalcopyrite from porphyry deposits hosted small amounts of Zn. Variation within samples from individual deposits was extremely low, usually only over a single order of magnitude. Chalcopyrite from the epithermal, exhalative and recrystallized exhalative deposit types all had remarkably uniform Zn compositions.
The highest silver concentration in chalcopyrite from any sample analysed here was 1112 ppm (BH73, from the Broken Hill recrystallized SEDEX deposit). High concentrations of Ag appeared typical of chalcopyrite from un-recrystallized and recrystallized exhalative deposits as well as epithermal systems. Chalcopyrite in these deposit types was all similarly enriched in Ag by ~1000 times chondritic concentrations. Chalcopyrite from the skarn at Oravita and the porphyry deposits had the lowest Ag concentrations, usually <10 ppm. Sample variation over one or two orders of magnitude appeared normal within individual deposits (e.g. Toroiaga – epithermal; Baita Bihor – skarn; Mofjell – recrystallized SEDEX etc.).
Tin was highly concentrated in chalcopyrite from the recrystallized SEDEX deposits Broken Hill and Bleikvassli, and also at both Baita Bihor (skarn) and Kanmantoo (metamorphosed, remobilized syngenetic sulfide ore). The most Sn-rich chalcopyrite here was from sample Bv-4 (Bleikvassli; recrystallized SEDEX), which hosted an average of 1108 ppm Sn. Smooth LA-ICP-MS downhole spectra from Bv-4 suggested the Sn was present in solid solution (Fig. 1d). Chalcopyrite from Oravita (skarn), Assarel (porphyry), Elatsite (porphyry) and Vorta (VMS) all hosted low levels of Sn. Variation appeared to be considerable within samples from a single deposit, for example, in the case of the Sulitjelma (recrystallized VMS) samples, Sn concentrations in chalcopyrite fluctuated over four orders of magnitude.
The highest concentration of selenium in chalcopyrite here was 849 ppm (from sample CV01.3, Sulitjelma; recrystallized VMS). Sample concentrations varied over three orders of magnitude at Sulitjelma, as well as in the Assarel (porphyry), Elatsite (porphyry) and Toroiaga (epithermal) samples. Typically, however, variation over two orders of magnitude was observed in samples from any deposit. Chalcopyrite from Kapp Mineral (SEDEX) and Bor (porphyry) hosted the least Se. Selenium concentrations in chalcopyrite from exhalative deposits were very uniform, although depleted relative to other deposit types. Overall, mean Se concentrations in chalcopyrite from different deposit types varied by two orders of magnitude.
Chalcopyrite in sample BBH15-21 from Baita Bihor (skarn) hosted 185 ppm In, the most of any sample. Relative to other deposits, In was highly enriched in chalcopyrite at Baita Bihor, as well as Toroiaga (epithermal), Bleikvassli (recrystallized SEDEX) and, to a lesser extent, also at Kanmantoo (metamorphosed, remobilized syngenetic sulfide ore). Indium concentrations in chalcopyrite varied over one or two orders of magnitude within samples from the same deposit, although at Assarel (porphyry), sample concentrations fluctuated over no less than four orders of magnitude. The chalcopyrite in the Vorta (VMS) sample contained the least In. Chalcopyrite from the different deposit types varied in its In content over two orders of magnitude.
We did not record more than 1 ppm mercury and thallium in chalcopyrite across the sample suite, although in a few individual samples chalcopyrite hosted high levels of Hg: samples TOR197 and TOR191 (Toroiaga; epithermal) both contained chalcopyrite hosting over 200 ppm Hg, while tens of ppm were present in chalcopyrite from kmi 2a (Kapp Mineral; SEDEX) and ASR 5A (Assarel; porphyry). Mean Tl concentrations in chalcopyrite from different deposit types varied very little, all approximately uniform with chondritic compositions. Mercury concentrations in chalcopyrite, on the other hand, varied over five orders of magnitude; the most of any element here. Chalcopyrite from recrystallized exhalative deposits was grossly depleted in Hg compared to other deposit types.
Manganese, cadmium and lead were all commonly present in chalcopyrite at concentrations between 0.1 and 50 ppm. Concentrations of Mn and Cd in chalcopyrite samples from any single deposit varied up to two orders of magnitude, although Cd concentrations varied less than that for many deposits. Lead concentrations in chalcopyrite on the other hand fluctuated over three orders of magnitude in samples from a given deposit. The highest mean concentrations in chalcopyrite for each element in any given sample were 51 ppm Mn (V598572; Bleikvassli; recrystallized SEDEX), 51 ppm Cd (Mo17A; Mofjell; recrystallized SEDEX) and 44 ppm Pb (KTDD180S(4); Kanmantoo; metamorphosed, remobilized syngenetic sulfide ore). All epithermal chalcopyrite analysed here was uniformly enriched in Cd relative to other deposit types. While Cd concentrations in recrystallized exhalative chalcopyrite were sometimes also high, the range of concentrations measured was large and extended quite low.
Concentrations of antimony and bismuth in chalcopyrite reached 58 ppm (Mo17A, Mofjell, recrystallized SEDEX) and 30 ppm (KTDD180S(5), Kanmantoo, metamorphosed, remobilized syngenetic sulfide ore), respectively. Concentrations of both elements in chalcopyrite from samples of individual deposits usually varied across two and four orders of magnitude. Kochbulak (epithermal), Baita Bihor (skarn), Assarel (porphyry) and Kanmantoo (metamorphosed, remobilized syngenetic sulfide ore) all hosted chalcopyrite containing high levels of Bi but low levels of Sb, whereas Mofjell (recrystallized SEDEX) chalcopyrite contained high levels of Sb but low levels of Bi. Overall, Sb was most enriched in chalcopyrite from exhalative deposits compared to other deposit types.
Concentrations of cobalt and gallium in chalcopyrite across the sample suite were typically between 0.001 and 10 ppm. Relative to other deposit types, chalcopyrite from the recrystallized exhalative deposits was enriched in Ga, specifically, Bleikvassli (recrystallized SEDEX) and Broken Hill (recrystallized SEDEX). Chalcopyrite concentrations in sample Bv-1 (Bleikvassli) reached 24 ppm Ga. Cobalt concentrations in chalcopyrite were highest in sample TOR189 (Toroiaga; epithermal) where 13 ppm Co was measured. Porphyry chalcopyrite was depleted in Co relative to other deposit types.
Arsenic, nickel, tellurium and gold were all sometimes present at measurable concentrations in chalcopyrite, however individual analyses were frequently below the minimum limit of detection. The highest concentrations of these elements in chalcopyrite was 7.8 ppm As (Mo16; Mofjell; recrystallized SEDEX), 3.1 ppm Ni (Su3; Sulitjelma; recrystallized VMS), 1.9 ppm Te (in both BBH15-21; Baita Bihor; epithermal, and KTDD086(12); Kanmantoo; metamorphosed, remobilized syngenetic sulfide ore) and 0.24 ppm Au (in both Bv-1; Bleikvassli; recrystallized SEDEX, and Su3; Sulitjelma; recrystallized VMS).
Discussion
Chalcopyrite as a trace-element host
Chalcopyrite is generally considered to be a relatively poor host for trace elements, at least if compared to other common Cu-(Fe)-sulfides (e.g. bornite and chalcocite; Cook et al., Reference Cook, Ciobanu, Danyushevsky and Gilbert2011), sphalerite (Cook et al., Reference Cook, Ciobanu, Pring, Skinner, Shimizu, Danyushevsky, Saini-Eidukat and Melcher2009) or galena (George et al., Reference George, Cook, Ciobanu and Wade2015). Indeed, LA-ICP-MS element distribution maps in George et al. (Reference George, Cook and Ciobanu2016) demonstrated that chalcopyrite is generally the ‘least preferred’ host for a range of trace elements when chalcopyrite, sphalerite and galena are inferred to co-crystallize.
A summary of relevant literature reveals that only Ag, Zn, As, Se, Co and Pb are usually reported as trace components in solid solution within chalcopyrite, whereas Mn, In, Tl, Ga and Hg are seldom referred to, if at all. There is also a relative scarcity of empirical concentration data for natural chalcopyrite compared to other sulfides, and in cases where data are reported, often the full range of elements were not checked, or the minimum levels of detection for many trace elements were too high to gain a proper appreciation of concentration ranges (e.g. Harris et al., Reference Harris, Cabri and Nobiling1984; Cabri et al., Reference Cabri, Campbell, Laflamme, Leigh, Maxwell and Scott1985; Kase, Reference Kase1987; Brill, Reference Brill1989; Huston et al., Reference Huston, Jablonski and Sie1996; Scott et al., Reference Scott, Ashley and Lawie2001; Moggi-Cecchi et al., Reference Moggi-Cecchi, Cipriani, Rossi, Ceccato, Rudello and Somacal2002; Serranti et al., Reference Serranti, Ferrini, Masi, Nicoletti and Conde2002; Shalaby et al., Reference Shalaby, Stumpfl, Helmy, El Mahallawi and Kamel2004; Demir et al., Reference Demir, Uysal, Burhan Sadiklar and Sipahi2008; Layton-Matthews et al., Reference Layton-Matthews, Peter, Scott and Leybourne2008; Monteiro et al., Reference Monteiro, Xavier, Hitzman, Juliani, de Souza Filho and Carvalho2008; Demir et al., Reference Demir, Uysal and Sadıklar2013; Gena et al., Reference Gena, Chiba, Kase, Nakashima and Ishiyama2013; Reich et al., Reference Reich, Palacios, Barra and Chryssoulis2013; Cioacă et al., Reference Cioacă, Munteanu, Qi and Costin2014; Helmy et al., Reference Helmy, Shalaby and Rahman2014; Wang et al., Reference Wang, Wang, Shi, Zhang and Wang2015a; Wohlgemuth-Ueberwasser et al., Reference Wohlgemuth-Ueberwasser, Viljoen, Petersen and Vorster2015; Sadati et al., Reference Sadati, Yazdi, Mao, Behzadi, Adabi, Lingang, Zhenyu and Mokhtari2016). The dataset presented in this study, encompassing a wider range of trace elements, and with the generally lower minimum detection limits afforded by LA-ICP-MS, thus allow for a new evaluation of chalcopyrite as a trace-element carrier.
Zinc was the most abundant trace element present in the chalcopyrite analysed here with individual spot concentrations exceeding 2000 ppm in the Herja and Toroiaga epithermal systems. The only other trace elements commonly present at >100 ppm were Se, Ag and Sn. As such, the trace-element budget for chalcopyrite was generally lower than in other co-existing base-metal sulfides for which data are available (e.g. Cook et al., Reference Cook, Ciobanu, Danyushevsky and Gilbert2011; George et al., Reference George, Cook and Ciobanu2016). Yet regardless of the lower overall concentrations compared to other common sulfides, particularly when they co-crystallize with chalcopyrite, it is apparent that the latter is able to incorporate a wide range of trace elements. Manganese, Co, Zn, Ga, Se, Ag, Cd, In, Sn, Sb, Hg, Tl, Pb and Bi were all commonly present at measurable levels in chalcopyrite. Generally, trace-element concentrations showed little variation at the sample scale, yet most elements showed significant variation of four to five orders of magnitude across the sample suite and even from samples within individual deposits. Significantly, Mn, In, Tl, Ga and Hg were all commonly present at measurable concentrations in chalcopyrite despite rarely being reported in most previous studies. Other trace elements that were occasionally present in chalcopyrite include Ni, As, Te and Au. Thus, considering the greater abundance of chalcopyrite relative to other sulfides in many Cu-ores, in a given deposit chalcopyrite may be the main sulfide host for many of the elements listed above.
Trace-element incorporation
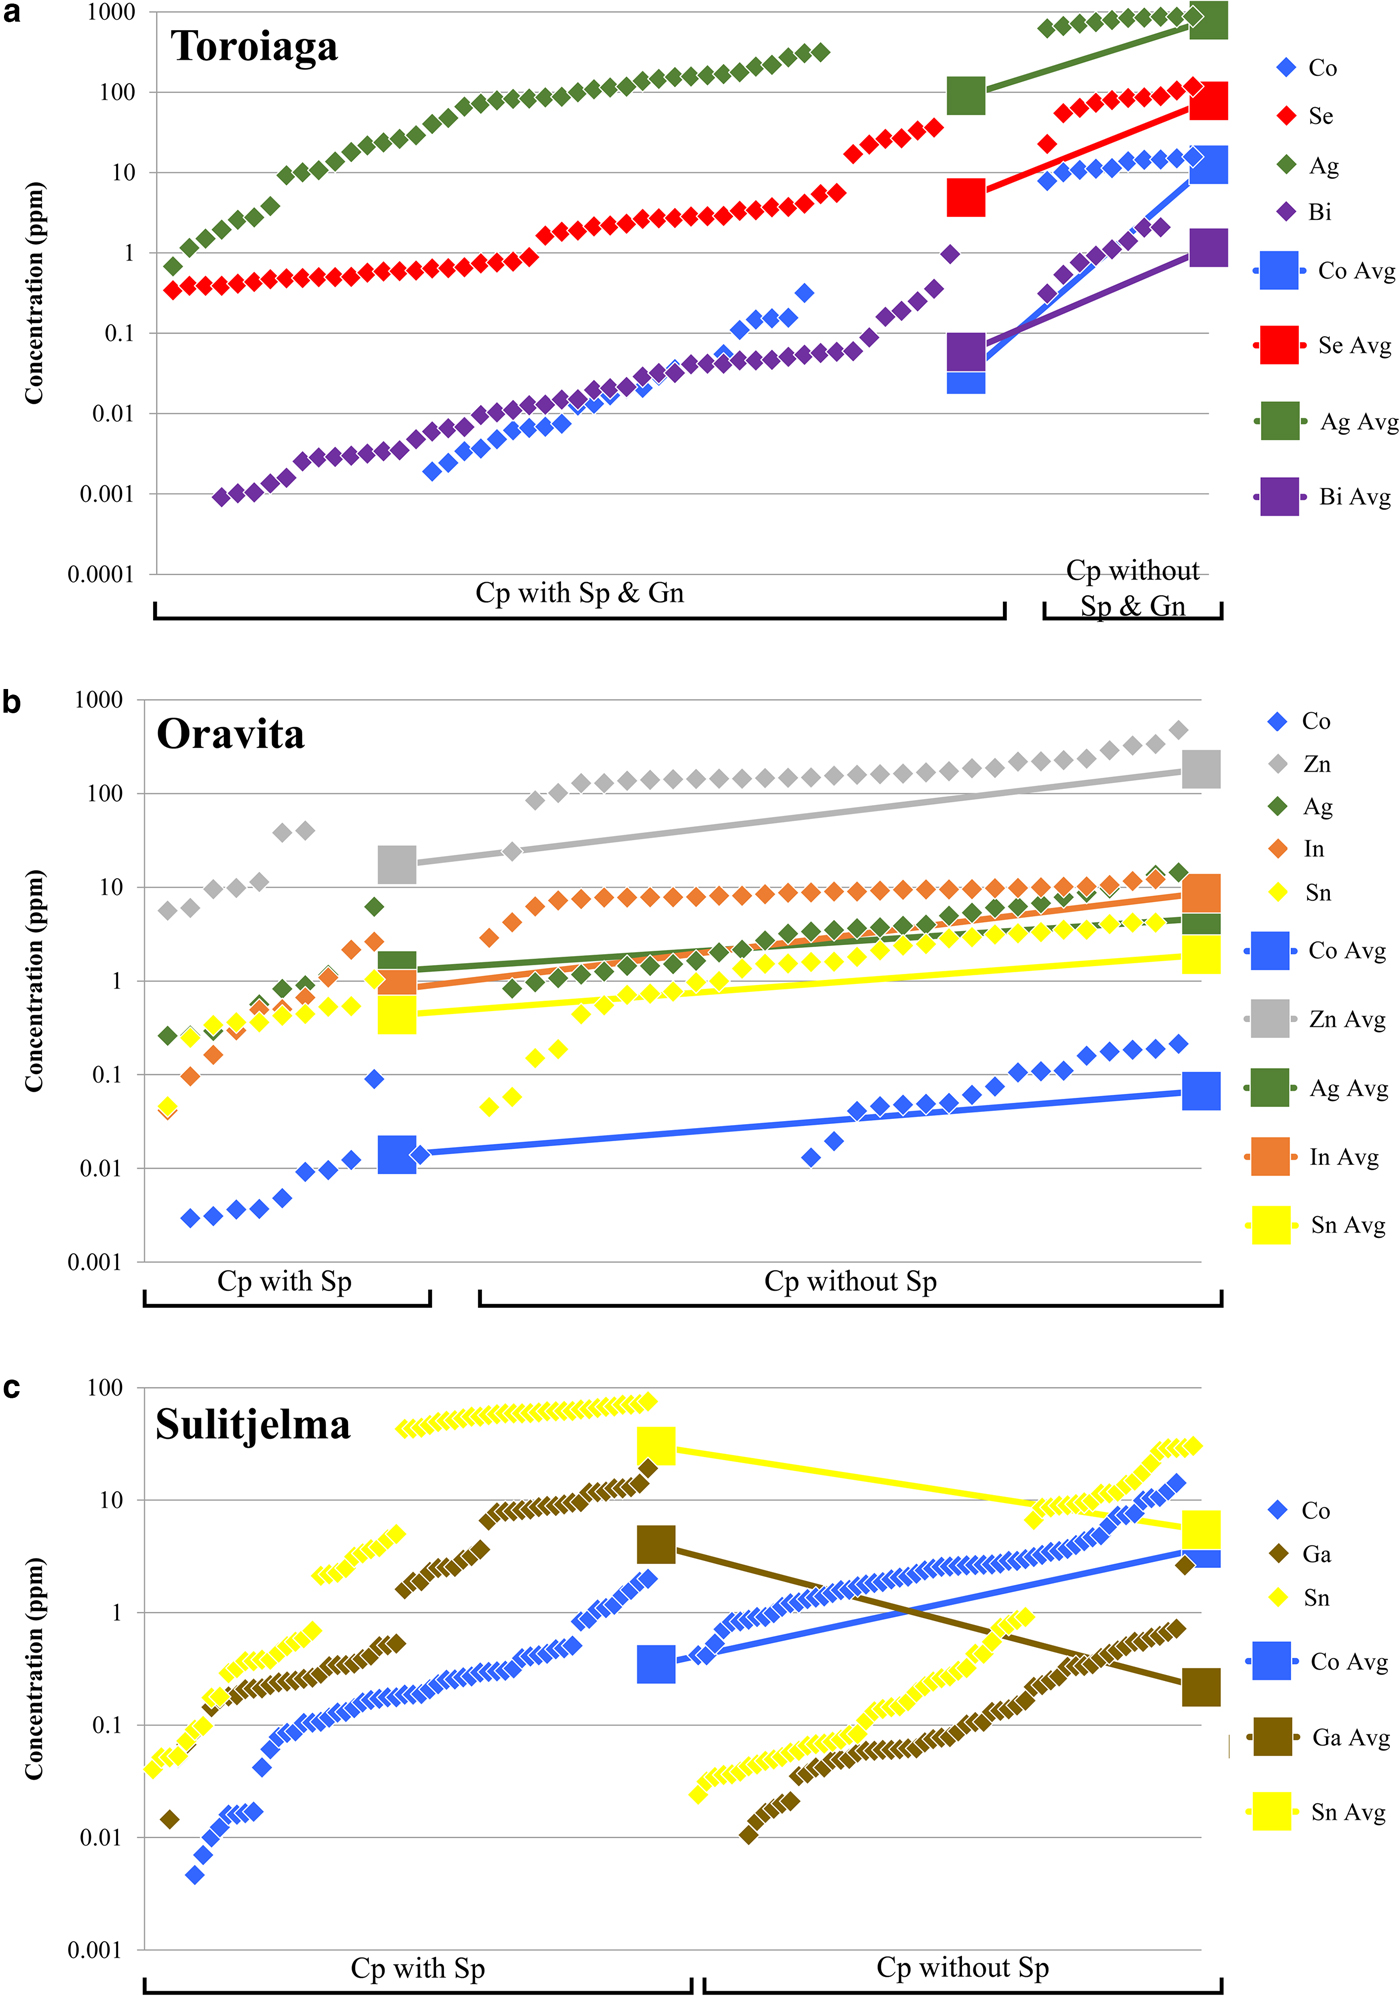
The incorporation of trace elements into the chalcopyrite structure is more complex than in other common base-metal sulfides, particularly sphalerite or galena. Covalent bonding in chalcopyrite means that Goldschmidt's rules (Goldschmidt, Reference Goldschmidt1954) cannot be used to predict partitioning trends as for purely ionic structures (e.g. George et al., Reference George, Cook and Ciobanu2016). Instead, in any given ore system, the trace-element content of chalcopyrite will depend principally on the presence or absence of other co-crystallizing sulfides, particularly sphalerite and galena. All trace elements analysed here (except for Zn in the absence of sphalerite) preferentially partition into co-crystallizing sphalerite or galena if those phases are present (George et al., Reference George, Cook and Ciobanu2016). This is demonstrated in Figs 4a and b, which show the concentration of different trace elements in chalcopyrite from Toroiaga and Oravita, respectively. In the first case, Co, Se, Ag and Bi concentrations are all significantly lower in hydrothermal chalcopyrite that co-crystallized with sphalerite and galena than in chalcopyrite from assemblages in which the other base-metal sulfides are absent (Fig. 4a). This supports observations (George et al., Reference George, Cook and Ciobanu2016) that Co will preferentially partition into sphalerite, and Se, Ag and Bi into galena, when those base-metal sulfides co-crystallize with chalcopyrite in hydrothermal settings. At Oravita, Co, Zn, Ag, In and Sn concentrations are all significantly lower in chalcopyrite associated with sphalerite compared to chalcopyrite that has crystallized without any sphalerite in the polished section (Fig. 4b). Again the sphalerite has incorporated a significant proportion of the trace-element budget. We thus conclude that hydrothermal chalcopyrite crystallizing without sphalerite and/or galena, is likely to host greater concentrations of Co, Zn, Se, Ag, In, Sn and Bi, whereas the concentration of these elements will be reduced when sphalerite and/or galena co-crystallize. Consequently, chalcopyrite may be thought of as a sink that will incorporate much of the ‘leftover trace-element budget’ not taken up into other co-crystallizing sulfides (sphalerite and galena in the cases above), and explains efficiently why chalcopyrite is able to host a wide range of trace elements while measured concentrations are generally low. A similar relationship exists between chalcopyrite and pyrite, the latter well known to incorporate high levels of As, Co and Ni, and possibly also others (e.g. Large et al., Reference Large, Danyushevsky, Hollit, Maslennikov, Meffre, Gilbert, Bull, Scott, Emsbo, Thomas, Singh and Foster2009; Winderbaum et al., Reference Winderbaum, Ciobanu, Cook, Paul, Metcalfe and Gilbert2012). Similarly, in ores containing bornite and/or chalcocite, such as Olympic Dam, South Australia, these minerals are likely to host, and control the distribution of Ag and Bi, with chalcopyrite only an important Ag-Bi-host when bornite and chalcocite are absent (Cook et al., Reference Cook, Ciobanu and Ehrig2015).
Fig. 4. Plots showing the dependency of the trace-element composition of chalcopyrite on co-crystallizing base-metal sulfides (BMS). Chalcopyrite concentration data for each BMS assemblage in each deposit is sorted in ascending order and plotted in succession along the X axis. (a) Chalcopyrite in samples from Toroiaga. Data to the left of plot is from chalcopyrite co-crystallizing with sphalerite and galena. Data to the right of plot is from chalcopyrite crystallizing without other BMS nearby. (b) Chalcopyrite in samples from Oravita. Data to the left of plot is from chalcopyrite co-crystallizing with sphalerite. Data to the right of plot is from chalcopyrite crystallizing without other BMS nearby. (c) Chalcopyrite at Sulitjelma. Data to the left of plot is from chalcopyrite co-crystallizing with sphalerite. Data to the right of plot is from chalcopyrite without other BMS crystallized nearby.
In the case of those deposits in which the sulfides recrystallized during syn-metamorphic deformation (Broken Hill, Bleikvassli, Mofjell and Sulitjelma), the presence or absence of other co-crystallizing base-metal sulfides influences trace-element incorporation into chalcopyrite in a different way. Under metamorphic conditions of amphibolite facies or above, both Ga and Sn will partition typically into chalcopyrite over co-crystallizing sphalerite, distinct from the preferred host of these trace elements at lower temperatures (sphalerite in the case of Ga; George et al., Reference George, Cook and Ciobanu2016). This is illustrated by Fig. 4c, which shows the concentration of different trace elements in chalcopyrite from recrystallized samples from the Sulitjelma VMS deposit. Concentrations of Co are significantly lower in chalcopyrite that has recrystallized together with sphalerite if compared to chalcopyrite-only assemblages. This is the same trend depicted in Figs 4a and b, showing that Co is preferentially partitioned into sphalerite over chalcopyrite at all temperatures and pressures (George et al., Reference George, Cook and Ciobanu2016). The trends for Ga and Sn contrast, however, with those shown by Co, in that the concentrations of both Ga and Sn are significantly higher in chalcopyrite that has recrystallized with sphalerite. Our interpretation is that, during recrystallization associated with sub-solidus deformation, Ga and Sn present in pre-existing sphalerite has been remobilized and re-partitioned into chalcopyrite thus increasing the concentration of these elements in the latter, more so than if it had recrystallized alone.
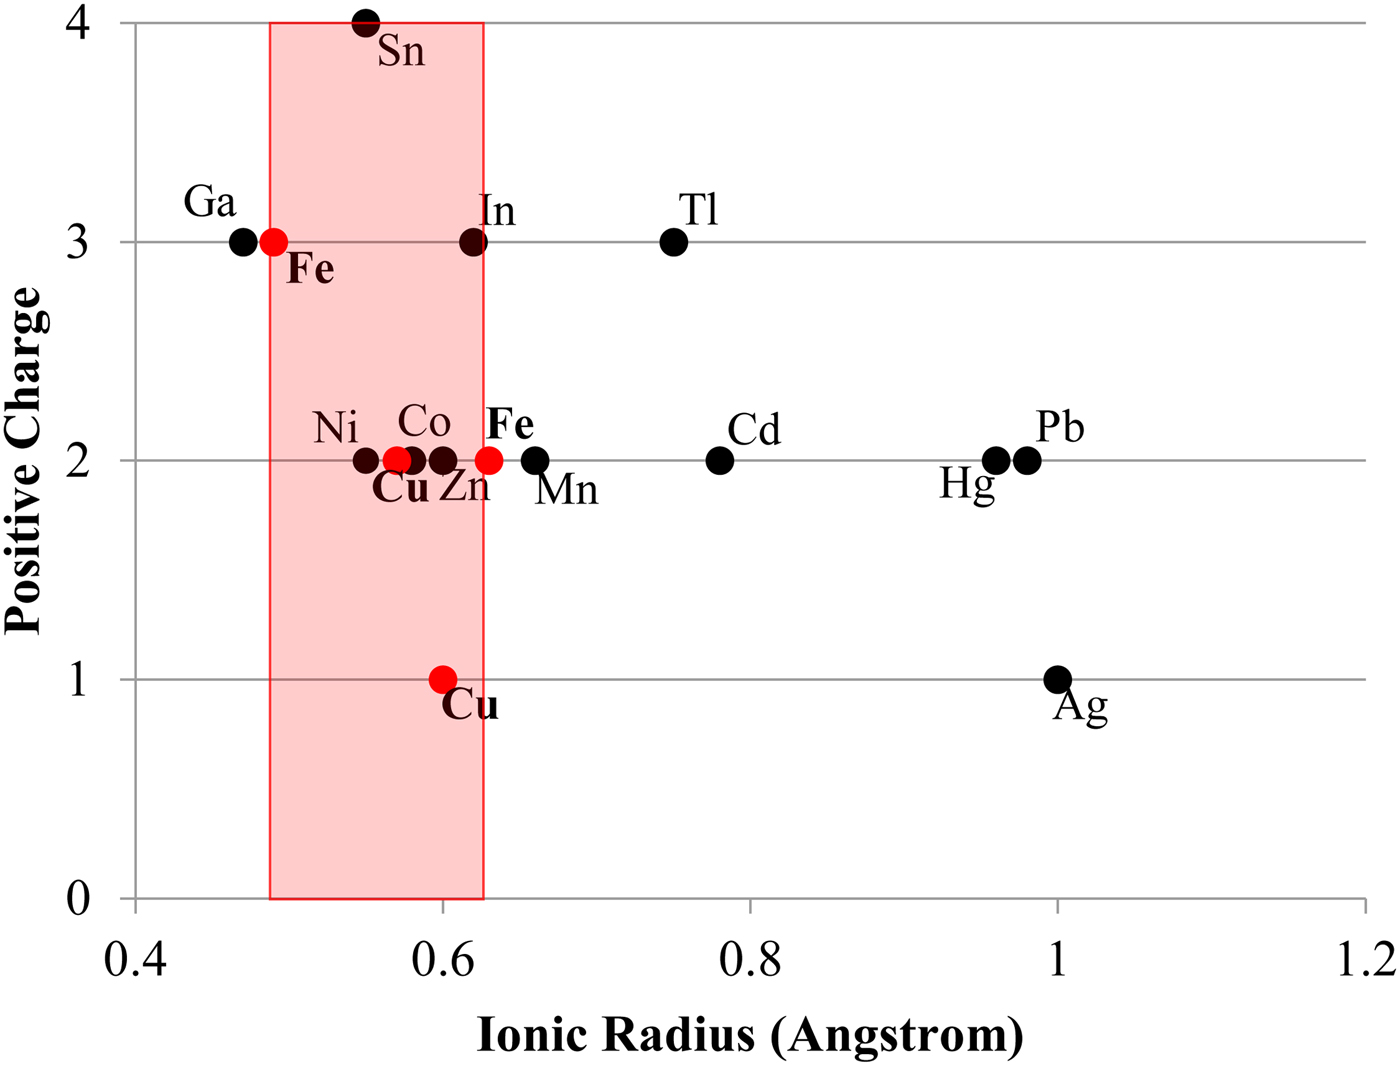
Other factors certainly also play a contributing role in trace-element incorporation into chalcopyrite. For example, Tl is incorporated preferentially into galena over either chalcopyrite or sphalerite (George et al., Reference George, Cook and Ciobanu2016). However, in the absence of galena and/or sphalerite, chalcopyrite will still not host more than negligible concentrations of Tl (never more than a few ppm in the sample suite analysed here). There must therefore be factors intrinsic to the chalcopyrite crystal structure that influence trace-element incorporation. Bonding in the chalcopyrite structure is strongly covalent with an effective ionic state between Cu+Fe3+S22- and Cu2+Fe2+S22- (Li et al., Reference Li, Kawashima, Li, Chandra and Gerson2013). Yet Goldschmidt's rules for trace-element incorporation into ionic structures (Goldschmidt, Reference Goldschmidt1954) may still be helpful in understanding the observed trace-element trends in chalcopyrite. As per Goldschmidt's rules, the ionic radius of a substituting trace element is a major control on trace-element incorporation. The ionic radii of Zn2+, Sn4+ and In3+ in tetrahedral coordination all fall within a ‘window’ between the ionic radii of Fe3+ and Fe2+ (Fig. 5). Although Ag+ is significantly outside this ‘window’, it is still the monovalent ion closest in size to Cu+ in tetrahedral coordination. These elements (plus Se which can be assumed to substitute for S) were the highest concentration trace constituents measured in chalcopyrite here. Ni2+ and Co2+ also fall within the Fe3+ and Fe2+ ‘window’ but were never significantly concentrated in chalcopyrite here, possibly due to their incorporation into nearly ubiquitous pyrite. Occasional studies have, however, measured high concentrations of Co and Ni in chalcopyrite (e.g. Bajwah et al., Reference Bajwah, Seccombe and Offler1987; Thole, Reference Thole1976; Wang et al., Reference Wang, Wang, Shi, Zhang and Wang2015a; Wang et al., Reference Wang, Xu, Zhang, Zou, Wang, Yu and Hu2015b). Despite the above observations, mechanisms of trace-element incorporation into covalent structures represents a significant research gap and further study is needed to understand partitioning controls.
Fig. 5. Plot showing the ionic radius of various trace-element ions in tetrahedral coordination – as in chalcopyrite (data from Shannon, Reference Shannon1976). Red dots represent Fe3+, Cu2+, Cu+ and Fe2+. The red area represents the zone in which trace elements have ideal ionic radii for incorporation into chalcopyrite.
Correlation between Cd and Zn
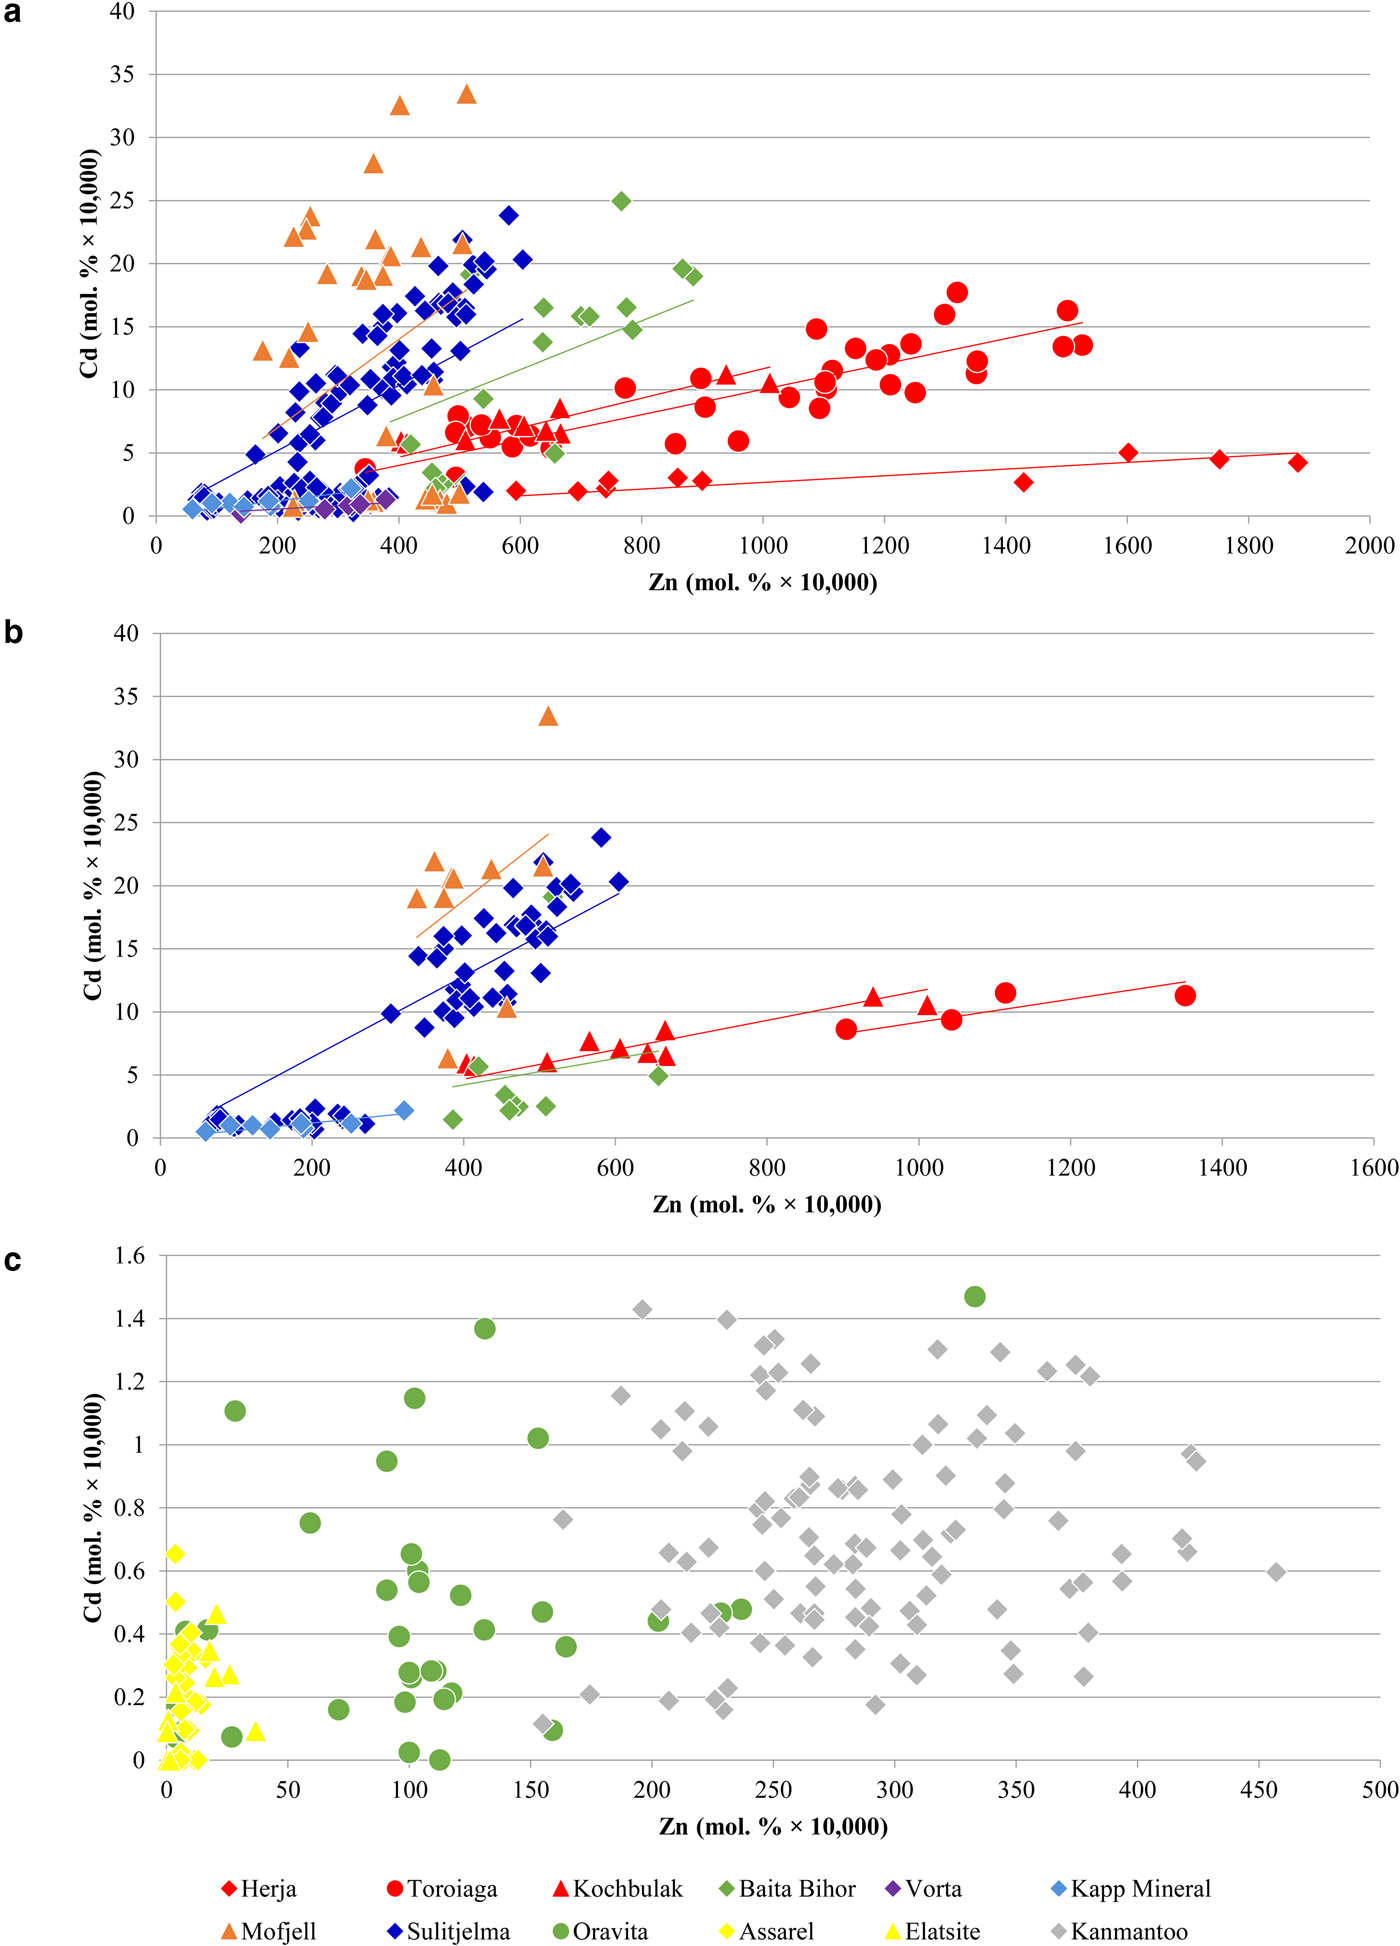
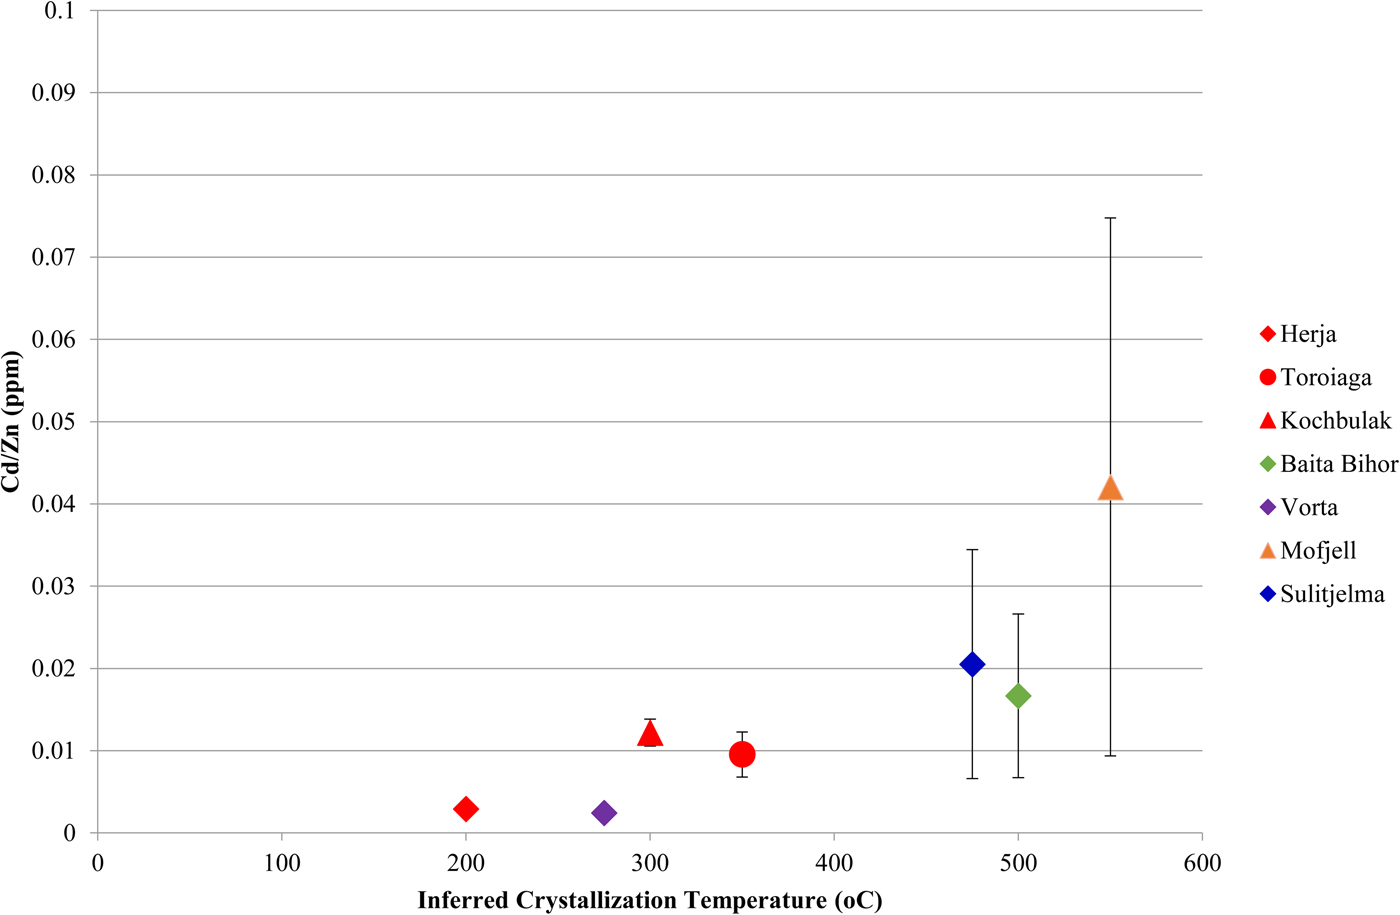
A noteworthy correlation between Cd and Zn concentrations in chalcopyrite is observed across the dataset. This strong correlation is unique as all other trace-element pairs show little to no correlation. In general, higher Zn concentrations in chalcopyrite are associated with higher Cd concentrations. Concentration data from a number of individual deposits fit well to lines of differing positive slope that pass through the origin (Fig. 6a), such that chalcopyrite from individual deposits display relatively constant Cd:Zn ratios. This ratio increases from the VMS Vorta deposit (0.002), to the Herja epithermal system (0.003), to the SEDEX Kapp Mineral deposit (0.007), to the Toroiaga (0.010) and Kochbulak (0.012) epithermal systems, to the Baita Bihor skarn (0.017) and finally to the recrystallized VMS and SEDEX deposits Sulitjelma (0.021) and Mofjell (0.042), respectively. The Cd:Zn ratio in chalcopyrite (Cd/Zncp) increases with the inferred temperature of crystallization, thus strongly suggesting that temperature is a significant factor influencing Cd/Zncp, as illustrated by Fig. 7. We note that this same trend is observed when chalcopyrite data are plotted for samples without any coexisting sphalerite (Fig. 6b). The data are thus unlikely to be influenced by sphalerite inclusions accidently (co)-analysed in the chalcopyrite, except perhaps in one population of chalcopyrite from Mofjell with low Cd but relatively high Zn.
Fig. 6. Binary plots showing the correlation between Cd and Zn in chalcopyrite. (a) Data for Herja, Toroiaga, Kochbulak, Baita Bihor, Vorta, Kapp Mineral, Mofjell and Sulitjelma fit well to lines of positive slope that pass through the origin. (b) Only data from samples with no coexisting sphalerite are plotted. As general trends remain, the data are unlikely to be influenced by sphalerite inclusions accidently (co)-analysed in the chalcopyrite. (c) Data from Oravita, Assarel, Elatsite and Kanmantoo do not fit to lines of positive slope. See text for explanation.
Fig. 7. Plot showing the correlation between the Cd:Zn ratio in chalcopyrite and inferred chalcopyrite crystallization temperature. Inferred crystallization temperatures are only estimates. Deposits with no known crystallization temperatures have not been plotted, nor have those deposits for which chalcopyrite Cd vs. Zn plots do not correlate well along a line of positive slope. Error bars represent one standard deviation.
Although crystallization temperature clearly influences Cd/Zncp, it is unlikely to be the sole factor controlling incorporation of the two elements. For instance, the Cd/Zncp for Broken Hill (0.002) and Bleikvassli (0.004) appear anomalous as they are far too low to solely reflect sulfide crystallization temperature in these high-temperature deposits. Schwartz (Reference Schwartz2000) noted similar systematic variation in the Cd:Zn ratio of sphalerite (Cd/Znsp) in different deposit types, particularly among Mississippi Valley-type (MVT) and exhalative (VMS and SEDEX) deposits. Schwartz reasoned that temperature played a role in determining Cd/Znsp but noted that reduced ![]() $f_{{\rm S}_{\rm 2}} $ and pH were also significant. These three factors control the stability of Cd and Zn complexes in an ore fluid, and thus the partitioning coefficients of Cd and Zn. Regardless, these influences alone cannot explain Cd:Zn ratios in natural sphalerites, prompting Schwartz (Reference Schwartz2000) to conclude that the Cd:Zn ratio in the ore-forming fluid is the most important factor in determining Cd/Znsp. A similar conclusion was reached by Gottesmann and Kampe (Reference Gottesmann and Kampe2007).
$f_{{\rm S}_{\rm 2}} $ and pH were also significant. These three factors control the stability of Cd and Zn complexes in an ore fluid, and thus the partitioning coefficients of Cd and Zn. Regardless, these influences alone cannot explain Cd:Zn ratios in natural sphalerites, prompting Schwartz (Reference Schwartz2000) to conclude that the Cd:Zn ratio in the ore-forming fluid is the most important factor in determining Cd/Znsp. A similar conclusion was reached by Gottesmann and Kampe (Reference Gottesmann and Kampe2007).
It is probable that the Cd:Zn ratio in the ore-forming fluid, as well as factors controlling the stability of Cd and Zn complexes in the fluid (e.g. temperature, sulfur activity, pH), would also control Cd/Zncp. Thus specific physiochemical conditions should result in a particular Cd:Zn ratio in either sphalerite or chalcopyrite, and this ratio should remain constant if the physiochemical conditions do not change. Consequently, chalcopyrite from an individual deposit that has a relatively constant Cd:Zn ratio probably crystallized in a system during which the physiochemical conditions remained constant. In deposits such as Oravita, Assarel, Elatsite and Kanmantoo, where the Cd vs. Zn plots for chalcopyrite do not correlate well along a line of positive slope (Fig. 6c), chalcopyrite probably crystallized under evolving, and possibly highly localized physiochemical conditions.
The mean Cd:Zn ratios in chalcopyrite and co-crystallizing sphalerite are shown in Fig. 8. In most samples chalcopyrite and sphalerite have very similar Cd:Zn ratios. As the Cd:Zn ratio in the ore-forming fluid is the most important factor in determining Cd/Znsp, the relationship between chalcopyrite and sphalerite is probably a reflection of co-crystallization from a common ore-forming fluid, in which case the ore fluid Cd:Zn ratio is also the most critical factor in controlling Cd/Zncp. Nevertheless, some samples do show differences in the Cd:Zn ratios of the two minerals. Typically, when a difference is present, the Cd:Zn ratio is higher in chalcopyrite than in sphalerite. Samples from Oravita, Assarel and Elatsite reveal mean chalcopyrite Cd:Zn ratios that are an order of magnitude greater than in sphalerite. Interestingly, these are the same deposits for which chalcopyrite Cd vs. Zn plots do not correlate well, and where changing physiochemical conditions were invoked to explain the observed trends (Fig. 6c). It thus seems that evolving physiochemical conditions may affect Cd/Zncp to a greater extent than Cd/Znsp, leading to marked differences in the mean Cd:Zn ratios of the two minerals. This is intuitive as Cd and Zn concentrations in chalcopyrite may vary over three and four orders of magnitude, respectively, allowing Cd/Zncp to change over a possible seven orders of magnitude. In sphalerite, however, Cd concentrations generally vary over only one order of magnitude (Cook et al., Reference Cook, Ciobanu, Pring, Skinner, Shimizu, Danyushevsky, Saini-Eidukat and Melcher2009), and Zn concentrations are fixed, so limiting the Cd/Znsp to vary no more than one order of magnitude.
Fig. 8. Plot showing the similarity between the Cd:Zn ratios in chalcopyrite and co-crystallizing sphalerite from various deposits. Error bars represent one standard deviation.
The Cd:Zn ratios in chalcopyrite and sphalerite may be useful in indicating whether physiochemical conditions remained constant during base-metal sulfide crystallization. A fixed Cd/Zncp approximately equal to Cd/Znsp would indicate co-crystallization of the two sulfides from the same ore-forming fluid under constant physiochemical conditions. If Cd/Zncp is constant yet distinct from Cd/Znsp, the two sulfides probably crystallized at different times and/or from different ore-forming fluids. A non-constant Cd/Zncp, especially if combined with a distinct difference in Cd/Znsp indicates varying physiochemical conditions during sulfide crystallization. A more thorough investigation is required to determine how Cd/Zncp depends on ore-forming fluid chemistry and/or other factors. The temperature-dependant nature of the Cd:Zn ratio in both sphalerite and chalcopyrite may even potentially allow a geothermometer to be defined based on the partitioning of Cd and Zn among sphalerite-chalcopyrite pairs, assuming other factors affecting Cd/Zncp and Cd/Znsp can be accounted for.
Deleterious elements
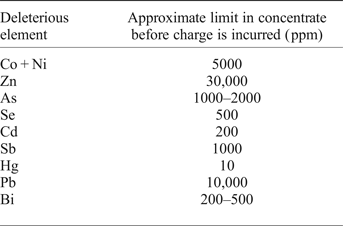
Knowledge of, or the ability to predict, the trace-element chemistry of base-metal sulfides carries critical economic implications. The presence of harmful or unwanted elements (deleterious elements) in sulfide copper ores is a significant concern for many mining operations selling their concentrate on the world market. If bound within the lattice of the common Cu-(Fe)-sulfides (chalcopyrite, bornite, chalcocite) or as inclusions within those minerals, elements including Co, Zn, As, Se, Cd, Sb, Hg, Pb and Bi will move to copper concentrates after froth flotation (Mular et al., Reference Mular, Halbe and Barratt2002). Such elements reduce the overall grade of the copper concentrate and may require further, typically costly treatment to remove them from final copper products. Smelters thus impose financial penalties on concentrates which contain deleterious elements at greater than certain tolerated levels. Different smelters have different lists of deleterious elements and different penalty rates for unwanted elements in a copper concentrate (e.g. Lane et al., Reference Lane, Cook, Grano and Ehrig2016). Table 4 shows approximate maximum concentrations of deleterious elements that may be present in a copper concentrate before a financial penalty is incurred. Many mining operations therefore work hard to separate deleterious elements from their final saleable concentrate or seek to blend ores from different sources.
Table 4. Copper concentrate deleterious elements.
Data from Zanetell (Reference Zanetell2007) and Fountain (Reference Fountain2013).
Integral to any approach to reducing the concentrations of potential penalty elements in a concentrate is an understanding of the mineralogical hosts for each element in primary ore. As the copper minerals collected from a froth flotation circuit are usually the final saleable copper concentrate (Zanetell, Reference Zanetell2007), the concentration of deleterious elements in a concentrate generated from a chalcopyrite-dominant ore will be related directly to the concentration of deleterious elements within chalcopyrite. Ordinarily, chalcopyrite hosts low enough concentrations of most penalty elements as to not be a significant contributor of such elements in a final copper concentrate. On the basis of the data presented here, only in exceptional circumstances could chalcopyrite itself be expected to contribute to excessive Co, Zn, As, Cd, Sb, Pb and Bi in a copper concentrate. Grains of, for example, arsenopyrite, enargite or tennantite (for As), tetrahedrite (for Sb), galena (for Pb) and Bi-chalcogenides (for Bi) could be considered the likely ‘culprits’, and efforts may be made to prevent flotation of these minerals.
Chalcopyrite can, however, potentially host sufficient Se or Hg to be a culpable host. Copper concentrates may incur monetary penalties from the smelter if they contain in excess of 500 ppm Se. We measured Se concentrations in chalcopyrite up to 1000 ppm, which could potentially produce copper concentrates with high Se that is difficult to remove prior to smelting. Mercury may represent an even more serious problem in chalcopyrite-dominant copper concentrates. A number of chalcopyrite samples analysed here contain more Hg than the smelter limit of 10 ppm; we even measured hundreds of ppm Hg in chalcopyrite. Japanese smelters charge additional monetary penalties for every 1 ppm over the 10 ppm Hg limit while the Chinese government has banned the import of copper concentrates that exceed 100 ppm Hg altogether (Fountain, Reference Fountain2013). This renders concentrates produced from a Hg-rich chalcopyrite ore of limited value, or in the worst case, unsaleable.
Conclusions
Chalcopyrite may host a wide range of trace elements including Mn, Co, Zn, Ga, Se, Ag, Cd, In, Sn, Sb, Hg, Tl, Pb and Bi. The readiness of chalcopyrite to host trace elements generally increases in the absence of other co-crystallizing sulfides, particularly sphalerite and galena.
In deposits that have recrystallized sulfide assemblages, the concentration of Sn and Ga in chalcopyrite will generally increase in the presence of co-recrystallizing sphalerite and/or galena.
Trace-element concentrations in chalcopyrite typically show little variation at the sample scale, yet there is potential for significant variation between samples from any individual deposit.
The Zn:Cd ratio in chalcopyrite shows systematic variation that depends, in part, on crystallization temperature.
Under constant physiochemical conditions (e.g. temperature, ![]() $f_{{\rm S}_{\rm 2}} $, pH), the Cd:Zn ratios in co-crystallizing chalcopyrite and sphalerite are typically approximately equal. A distinct difference in the Cd:Zn ratios, and/or a non-constant chalcopyrite Cd:Zn ratio, may indicate varying conditions.
$f_{{\rm S}_{\rm 2}} $, pH), the Cd:Zn ratios in co-crystallizing chalcopyrite and sphalerite are typically approximately equal. A distinct difference in the Cd:Zn ratios, and/or a non-constant chalcopyrite Cd:Zn ratio, may indicate varying conditions.
Chalcopyrite is generally a poor host of most penalty elements, Exceptions are Se and Hg, which can be sufficiently enriched in, and difficult to remove from, chalcopyrite-dominant copper concentrates.
Acknowledgements
Benjamin Wade, Aoife McFadden and Ken Neubauer (Adelaide Microscopy) are thanked for their support with analysis. We are grateful to Dominique Tanner, James Day and an additional anonymous reviewer whose insights helped improve this manuscript.
Supplementary material
To view supplementary material for this article, please visit https://doi.org/10.1180/minmag.2017.081.021