


Introduction
The tourmaline supergroup includes 44 members with complex and variable composition, however only 33 of these are approved by the International Mineralogical Association as individual mineral species (Henry and Dutrow, Reference Henry and Dutrow2018). The general formula can be written as XY3Z6[T6O18][BO3]3V3W, where X = Na, Ca, K and □ (vacancy); Y = Li, Mg, Al, Cr3+, V3+, Fe3+, Fe2+, Mn2+, Ni, (Ti4+); Z = Mg, Fe2+, Al, Fe3+, V3+ and Cr3+; T = Si, Al, (B), (Fe3+); B = B3+; V = OH–, O2–; and W = OH–, F– and O2– (Henry et al., Reference Henry, Novák, Hawthorne, Ertl, Dutrow, Uher and Pezzotta2011, Henry and Dutrow Reference Henry and Dutrow2018).
Tourmaline is stable over a wide range of pressure–temperature conditions, from low-temperature hydrothermal to magmatic and high-pressure metamorphic (Henry and Dutrow Reference Henry, Dutrow, Grew and Anvitz1996; Selway et al., Reference Selway, Novak, Čerńy and Hawthorne1999; Marks et al., Reference Marks, Marschall, Schühle, Guth, Wenzel, Jacob, Barth and Markl2013; Baksheev et al., Reference Baksheev, Vigasina, Yapaskurt, Bryzgalov and Gorelikova2019) and therefore is a good indicator of the mineral-forming environment. Major- and trace-element composition, substitution mechanisms, and spectroscopic features help to understand the fractionation degree and the evolution of a pegmatite melt in general (Čerńy et al., Reference Čerńy, Meintzer and Anderson1985; Jolliff et al., Reference Jolliff, Papike and Shearer1986; Tindle et al., Reference Tindle, Breaks and Selway2002; Roda-Robles et al., Reference Roda-Robles, Pesquera, Gil, Torres-Ruiz and Fontan2004).
Most gem-quality tourmaline deposits are related to granitic pegmatites in Brazil, USA, Madagascar, Mozambique, Namibia, Kenya, Australia, etc (Proctor, Reference Proctor1985; Pezzotta and Jobin, Reference Pezzotta and Jobin2003; Simmons et al., Reference Simmons, Falster and Laurs2011). In Russia, pegmatite tourmaline occurrences are known in the Urals (Lipovka, Shaitanka, Murzinka and Sarapulka), Transbaikal Krai (Adun Chelon, Malkhan, etc.), Irkutsk Oblast (Aleksandrovskoye), Kola Peninsula (Voron'i Tundry), and Karelia (Pitkyaranta) (Kievlenko, Reference Kievlenko2003).
The first mention of tourmaline in the Urals dates back to the 17th century (Fersman, Reference Fersman1962). Various famous Russian geologists and mineralogists such as I. German, G. Rose, O. Irman, G. Shchurovskiy, N. Koksharov and A. Fersman studied the Ural tourmalines at different times (Kanonerov and Chudinova, Reference Kanonerov and Chudinova2000). Recently, tourmalines from this region were reported by Popov and Popova (Reference Popov and Popova1999), Kanonerov and Chudinova (Reference Kanonerov and Chudinova2000), Emlin et al. (Reference Emlin, Vakhrusheva and Kainov2002), Popova et al. (Reference Popova, Popov and Kanonerov2002), Pekov and Memetova (Reference Pekov and Memetova2008) and Ogorodnikov et al. (Reference Ogorodnikov, Polenov, Kisin and Savichev2020). Currently, most local mines are abandoned and tourmaline crystals are relatively rare.
The objective of this investigation is to understand the position of black tourmalines during evolution of seven rare-metal pegmatites (Golodnaya, Kazennitsa, Mokrusha, Kopi Mora, Zheltyye Yamy, Buzheninov Bor and Ministerskaya) related to the Murzinka granite pluton in the Central Urals using electron microprobe analysis (EPMA), laser ablation inductively coupled plasma mass-spectrometry (LA-ICP-MS), and Raman and Mössbauer spectroscopy.
Geological setting
The Late Paleozoic Murzinka Pluton located 100 km north of Ekaterinburg (Russia), intrudes the Murzinka-Adui metamorphic massif composed of Archean and Proterozoic crystalline schists (Ogorodnikov et al., Reference Ogorodnikov, Polenov, Kisin and Savichev2020). This near-meridional pluton extends ~60 km with an average thickness of ~10 km (Fig. 1). According to Fershtater and Borodina (Reference Fershtater and Borodina2018), the pluton is divided on the basis of mineralogy into the smaller granitic units of Vatikha and Murzinka in the west and east, respectively. The Vatikha part is an orthoclase–magnetite–biotite granite, whereas Murzinka is microcline–orthoclase and microcline–two-mica granite. Both parts have radiometric ages of 254 ± 5 Ma using 207Pb/206Pb in zircon and Rb/Sr in bulk-rock samples (Montero et al., Reference Montero, Bea, Gerdes, Fershtater, Zin'kova, Borodina, Osipova and Smirnova2000). Two types of granitic pegmatites are related to the Murzinka Pluton: miarolitic at the pluton base, and rare-metal in its upper part (Fershtater and Borodina, Reference Fershtater and Borodina2018). Tourmalines from the latter are described in this investigation.
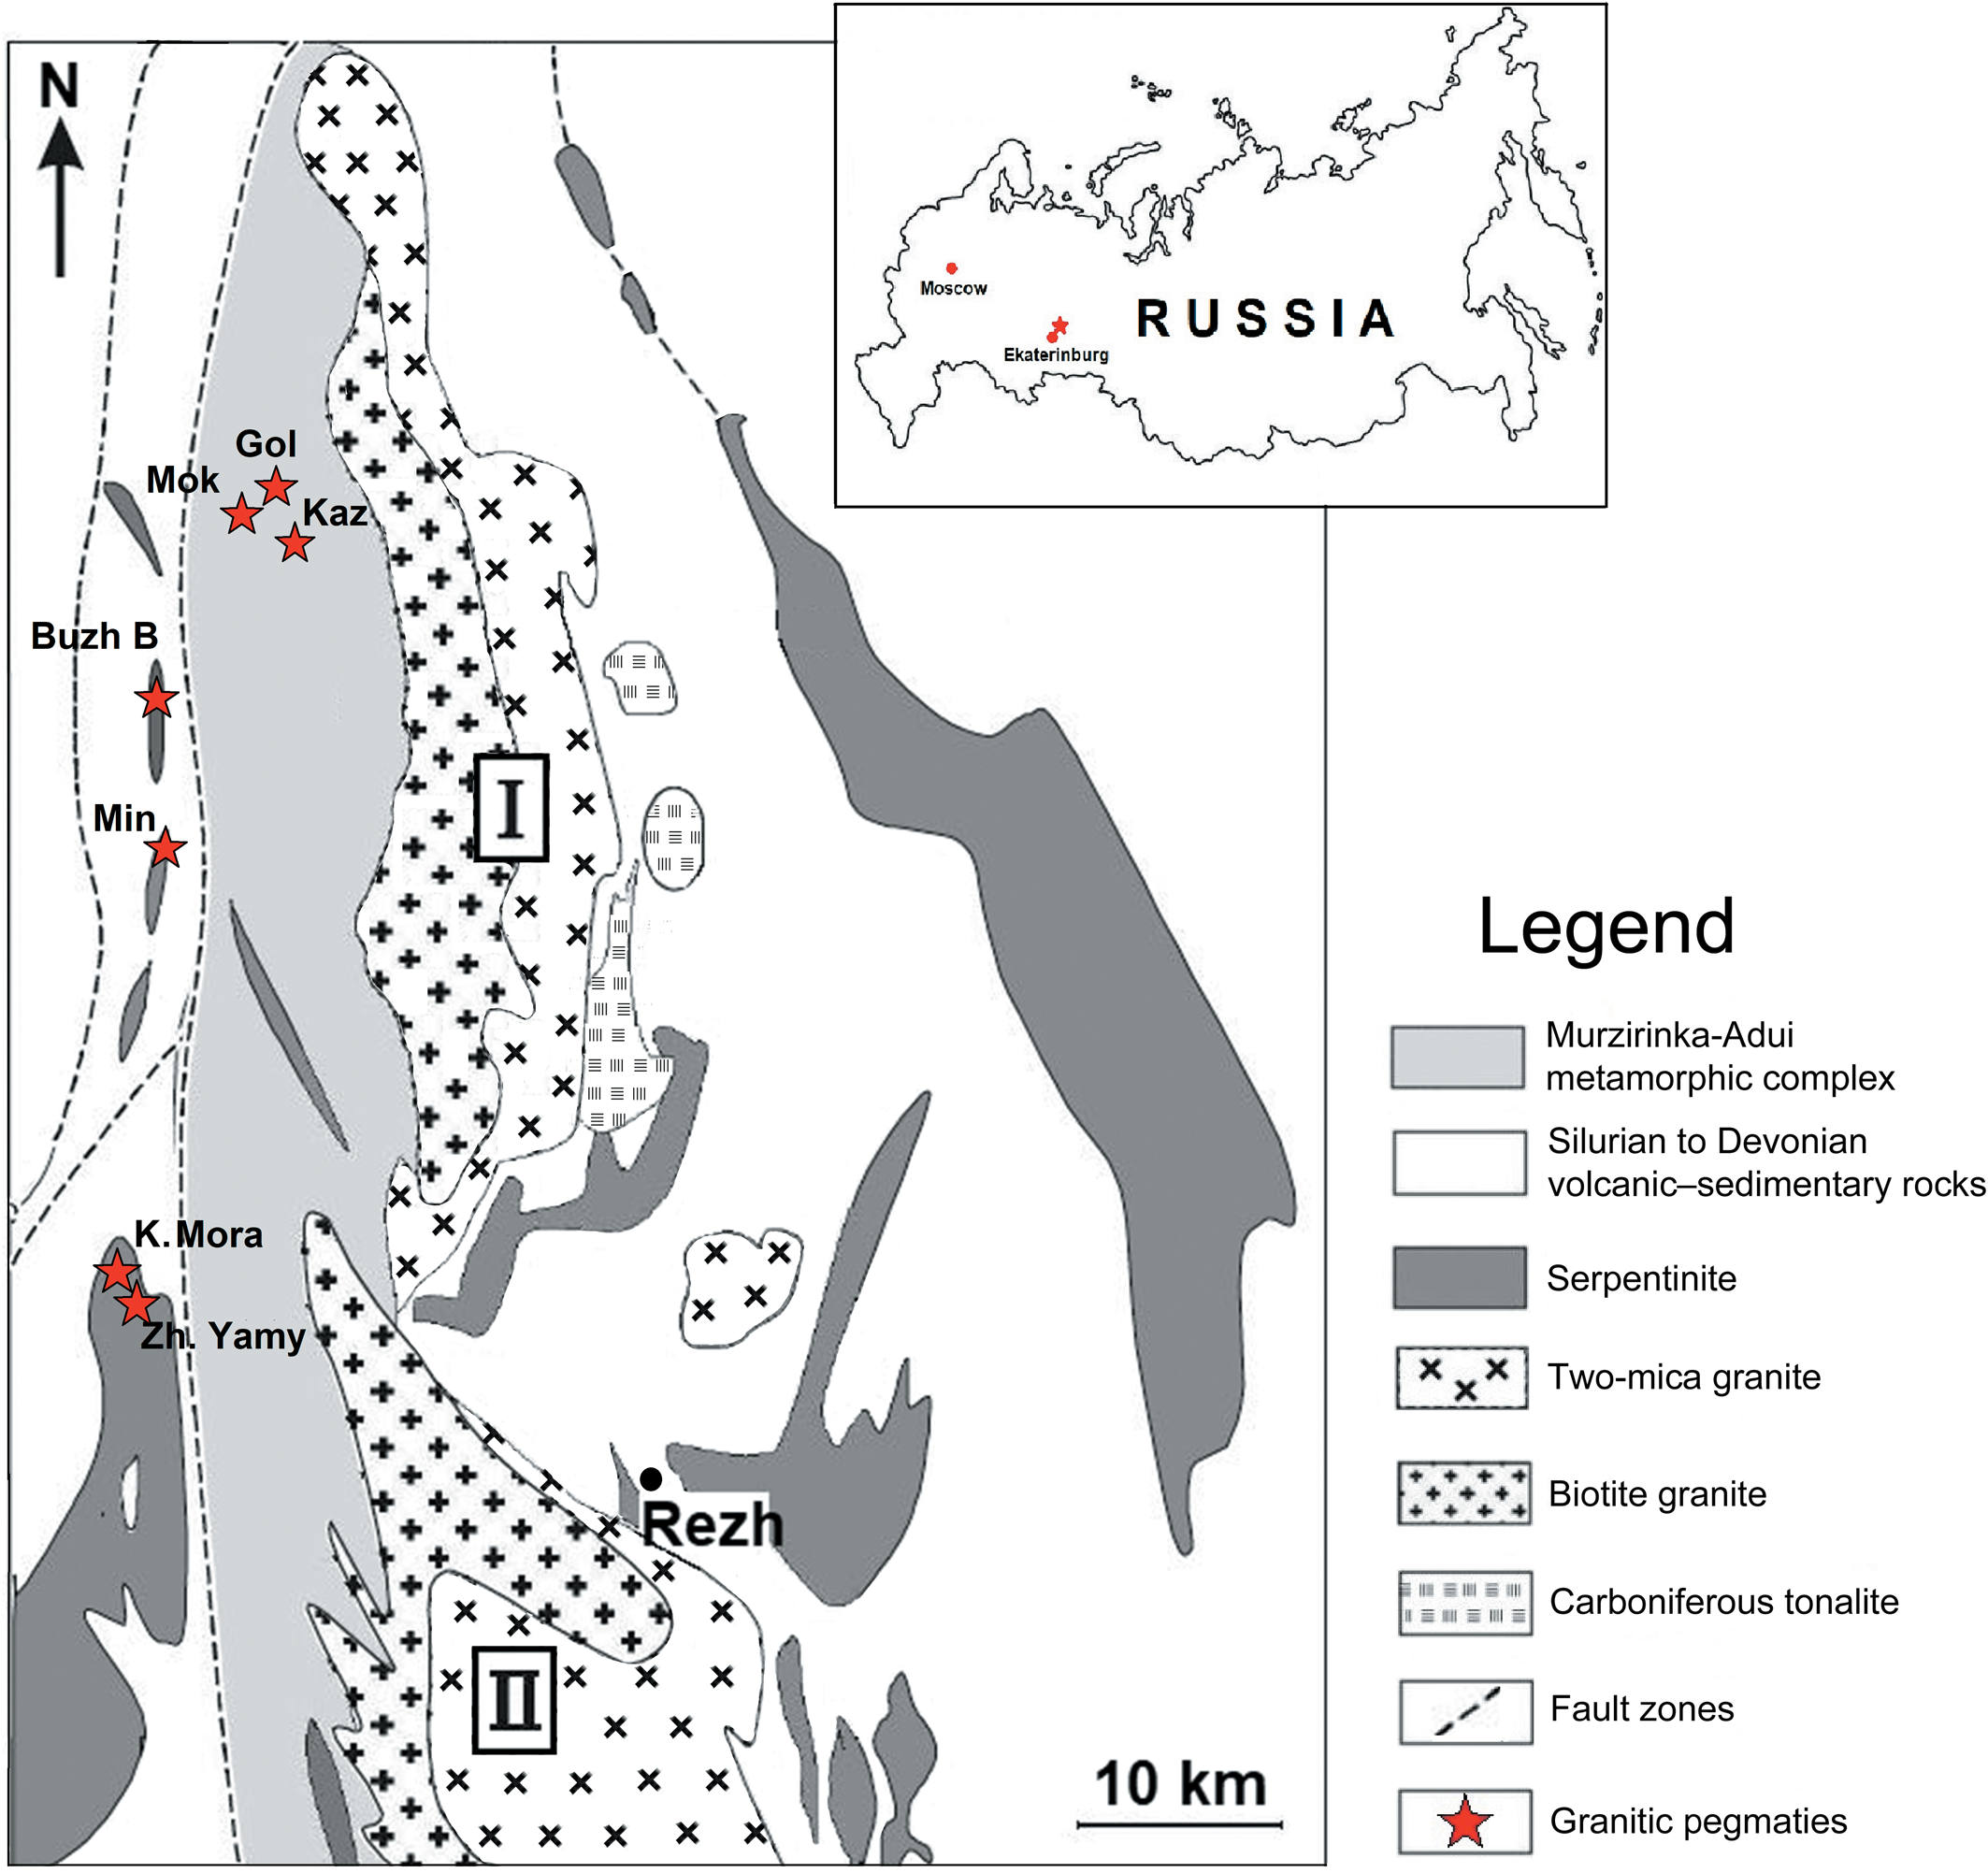
Fig. 1. Geological sketch map of Murzinka granite pluton (I), modified after Fershtater and Borodina (Reference Fershtater and Borodina2018) and (II) Adui granite pluton. Pegmatites: Mokrusha (Mok); Golodnaya (Gol); Kazennitsa (Kaz); Buzheninov Bor (Buzh B); Ministerskaya (Min); Kopi Mora (K. Mora); and Zheltyye Yamy (Zh. Yamy). The Geographical location of the area studied is marked with a star in the inset.
The Murzinka rare-metal pegmatites constitute the Alabashka, Murzinka, Yuzhakovka and Shaitanka pegmatite fields, within which more than 200 pegmatites have been found (Kanonerov and Chudinova, Reference Kanonerov and Chudinova2000). Most pegmatites are poorly documented and the locations of some of them are questionable. Recent publications concerning the Murzinka rare-metal pegmatites include Pekov et al. (Reference Pekov, Yakubovich, Massa, Chukanov, Kononkova, Agakhanov and Karpenko2010), Fershtater and Borodina (Reference Fershtater and Borodina2018), Gvozdenko et al. (Reference Gvozdenko, Baksheev, Gerasimova, Khanin, Chervyakovskaya and Yapaskurt2020) and Ogorodnikov et al. (Reference Ogorodnikov, Polenov, Kisin and Savichev2020).
We collected pegmatite samples from seven rare-metal pegmatites: Golodnaya, Kazennitsa and Mokrusha in the Alabashka field; Kopi Mora and Zheltyye Yamy in the Shaitanka field; Buzheninov Bor in the Murzinka field; and Ministerskaya in the Yuzhakovka field (Figs 1, 2). Unfortunately, we could find no published description of the Buzheninov Bor pegmatites.

Fig. 2. Old mines at some granite pegmatites. (a) Ministerskaya; (b) Golodnaya; (c) Mokrusha; and (d) Kopi Mora. Photo by T. Gvozdenko.
Mokrusha is one of the largest and best documented of the Murzinka mines (Fersman, Reference Fersman1962; Talantsev, Reference Talantsev1988; Popov and Popova, Reference Popov and Popova1999; Gurkov, Reference Gurkov2000; Kanonerov and Chudinova, Reference Kanonerov and Chudinova2000; Popova et al., Reference Popova, Popov and Kanonerov2002). The pegmatite vein is located 8 km north of Murzinka village within the Alabashka field. This near-meridional pegmatite intruded gneisses. The vein length is ~500 m along strike; width and thickness range from 60 to 150 and from 2 to 14 m, respectively. According to Gurkov (Reference Gurkov2000), this manto-type vein is complicated by flexures, twitches, swells and arches pinches out at a depth of 50–80 m. The following zones are identified within the vein inwards: coarse-graphic pegmatite close to the contact with host rock; granite–pegmatite separated by coarse-graphic pegmatite in the footwall (no granite pegmatite is observed in the hanging wall); fine-graphic pegmatite; aplite; spherulitic pegmatite and druse cavities (Popov and Popova, Reference Popov and Popova1999; Gurkov, Reference Gurkov2000). Feldspar, quartz and mica are the major rock-forming constituents, whereas topaz, tourmaline, garnet and beryl are minor. Schorl is the predominant tourmaline; elbaite, olenite and Na-deficient tourmaline, close to foitite are less common. Schorl is reported through all pegmatite zones, including miarolitic cavities, whereas elbaite occurs only in the cavities (Popov and Popova, Reference Popov and Popova1999; Gurkov, Reference Gurkov2000).
Golodnaya and Kazennitsa are considered as a part of the Startseva Yama group of mines. According to Talantsev (Reference Talantsev1988), Kanonerov and Chudinova (Reference Kanonerov and Chudinova2000) and Popova et al. (Reference Popova, Popov and Kanonerov2002), the Golodnaya NNE striking vein of 2–10 m thick located 400 m northwest of Mokrusha contains a few miarolitic cavities with heliodor and topaz. The Kazennitsa pegmatite situated 900 m east of Mokrusha is a plate-like body complicated by rare flexures, and is up to 150 m long with average thickness of 1–2 m. Both pegmatites intrude biotite granitic gneiss and porphyry granites. Schorl, elbaite and foitite were reported among tourmaline minerals (Talantsev Reference Talantsev1988; Kanonerov and Chudinova, Reference Kanonerov and Chudinova2000).
Kopi Mora and Zheltyye Yamy are close to each other and are attributed to the Shaitanka mines. The host rocks are talc-altered serpentinite. Fersman (Reference Fersman1962) reported crystals of black tourmaline up to 5–8 cm in length in the weathered pegmatite. According to Kievlenko (Reference Kievlenko2003), tourmalines are represented by schorl and elbaite in the miarolitic cavities.
Ministerskaya is located in the Yuzhakovka field 5 km south of the Sarapulka village at the left side of the Anabarka River. The pegmatite vein of 100 m long and 3–5 m thick is hosted by serpentinite. Graphic intergrown feldspar and quartz are the major constituents. The mine is well known owing to its druses with elbaite, lepidolite, rhodizite and cordierite (Fersman Reference Fersman1962; Talantsev Reference Talantsev1988; Kanonerov and Chudinova, Reference Kanonerov and Chudinova2000).
Buzheninov Bor consists of ten pegmatites hosted by serpentinite. The mine is famous for its hand specimens and good-quality crystals of moonstone. The tourmaline species reported are represented by schorl (Kanonerov and Chudinova, Reference Kanonerov and Chudinova2000).
Material and methods
Samples
We have investigated 43 tourmaline samples. Approximately half of the samples was collected during 2018–2019 fieldtrips, another part was provided kindly by I.V. Pekov (Lomonosov Moscow State University). All samples were from the dumps. Megascopally, tourmalines are black and brownish black and are columnar prismatic crystals up to 4 cm long and needles in tourmaline–feldspar–quartz–mica aggregates (Fig. 3). Tourmaline grains were selected using a binocular microscope, then some were mounted in epoxy resin and polished for EPMA, LA-ICP-MS and Raman spectroscopy; whereas others were powdered for Mössbauer spectroscopy.

Fig. 3. Tourmaline samples from granitic pegmatites related to Murzinka Pluton, Central Urals, Russia. (a) Sample 75, Ministerskaya; (b) Sample 71, Mokrusha; (c) Sample 79, Golodnaya; (d) Sample 6, Kazennitsa; (e) Sample 90, Kopi Mora; (f) Sample 87, Zheltyye Yamy; (g) Sample 66, Buzheninov Bor; and (h) Sample 42, Ministerskaya.
Electron microprobe analysis
An electron microprobe investigation of tourmalines was carried out using a CamScan MV2300 scanning electron microscope equipped with an INCA Energy 450 EDS with an INCA PentaFET x3 semiconductor Si (Li) detector (Oxford Instruments at the Institute of Experimental Mineralogy Russian Academy of Sciences, Chernogolovka, Russia). The operating conditions were: 15 kV accelerating voltage and 30 nA current intensity with a beam diameter of ~3 μm and detection limit of 0.10 wt.%. Data were corrected using the PAP correction procedure (Pouchou and Pichoir Reference Pouchou, Pichoir and Armstrong1985). The systematic measurement error for major components is estimated as ±1–2% relative and ±10% for minor elements. The following minerals and synthetic compounds were used as reference material: NiO (Ni); MnTiO3 (Mn); FeTiO3 (Fe, Ti); spinel (Cr); vanadinite (V); wollastonite (Ca); adularia (K); chkalovite (Si, Na); schorl (Al); tremolite (Mg); and topaz (F). Back-scattered electron (BSE) images were acquired using a Tescan Vega scanning electron microscope operating at 20 kV accelerating voltage and 130–230× magnification at the Institute of Experimental Mineralogy Russian Academy of Sciences, Chernogolovka, Russia.
Tourmaline formulae were calculated on the basis of 15 cations at the tetrahedral and octahedral sites (T, Z and Y), excluding Na, Ca and K (Henry et al., Reference Henry, Novák, Hawthorne, Ertl, Dutrow, Uher and Pezzotta2011). The Li content measured with LA-ICP-MS was included into the calculations despite low values in most compositions (Roda-Robles et al., Reference Roda-Robles, Simmons, Pesquera, Gil-Crespo, Nizamoff and Torres-Ruiz2015). The proportion of X-site vacancies (□) was calculated as [1 – (Na + Ca + K)]. Charge-balance constraints were used to estimate the amounts of OH– and O2– in the V and W anion sites. The calculated O2– is assigned preferentially to the W site together with F (Henry et al., Reference Henry, Novák, Hawthorne, Ertl, Dutrow, Uher and Pezzotta2011). The concentration of B2O3 was calculated from stoichiometric constraints assuming 3 atoms per formula unit (apfu) of B. The H2O content was calculated from the estimated amount of OH–. Fe is reported as both Fe2+ and Fe3+ when Mössbauer spectra were recorded. In the other data, Fe is reported as Fe2+ because there was not enough material to acquire Mössbauer spectra.
Laser ablation-inductively coupled plasma-mass spectrometry
Trace-element concentrations were measured using a NexION 300S PerkinElmer mass-spectrometer equipped with an NWR213 laser instrument at the Institute of Geology and Geochemistry, Ural Branch, Russian Academy of Sciences, Ekaterinburg, Russia. The equipment was in an ISO 7 cleanliness room. Operation conditions were: 10–11 J/cm2 energy of laser radiation, a laser frequency 10 Hz and 50 μm spot size. The results obtained were processed using the GLITTER V4.4 software (GEMOC, Macquarie University, Australia). The internal standard is SiO2, the external primary standard is glass NIST SRM 610 and the secondary standard is glass NIST SRM 612. The standard was measured after 10–12 measurements. The analytical uncertainty does not exceed 1%. Back-scattered electron images from the microprobe analysis spots were used to determine the positions for the LA-ICP-MS measurements.
Mössbauer spectroscopy
The 57Fe spectra were recorded using an MS1104 Em Mössbauer spectrometer at the Institute of Experimental Mineralogy Russian Academy of Sciences, Chernogolovka, Russia, analyst L.V. Sipavina. The equipment operated with 57Co in a Rh source at room temperature. The α-Fe absorber was used as a standard. The results were processed using the Univem MS program (Rostov-on-Don State University, Rostov-on-Don, Russia). The data from Dyar et al. (Reference Dyar, Taylor, Lutz, Francis, Guidotti and Wise1998) were used as a model for the spectrum decomposition.
Raman spectroscopy
Raman spectroscopy has proved to be one of the most informative, non-destructive techniques in the tourmaline crystal chemistry analyses (Hoang et al., Reference Hoang, Hien, Chen, VanMinha and Yang2011; Fantini et al., Reference Fantini, Tavares, Krambrock, Moreira and Righi2014; Watenphul et al., Reference Watenphul, Burgdorf, Schlüter, Horn, Malcherek and Mihailova2016a,Reference Watenphul, Schlüter, Bosi, Skogby, Malcherek and Mihailovab). Raman spectra were measured using an Enspectr R532 spectrometer excited by the 532 nm laser at the Geological Faculty, Lomonosov Moscow State University, Russia. Nominal range of use is 100–4000 cm–1, spectral resolution is ~6.0 cm–1. The laser power on the sample surface was 30–50 mW. All spectra were collected for 1000 s acquisition time, over 20–30 accumulations. The tourmaline grains were orientated randomly. In this investigation peaks were assigned according to the site-symmetry analysis described in Watenphul et al. (Reference Watenphul, Schlüter, Bosi, Skogby, Malcherek and Mihailova2016b). However, there is also a second short-range arrangement model (Hoang et al., Reference Hoang, Hien, Chen, VanMinha and Yang2011; Skogby et al., Reference Skogby, Bosi and Lazor2012; Fantini et al., Reference Fantini, Tavares, Krambrock, Moreira and Righi2014; Pieczka et al., Reference Pieczka, Gołębiowska, Stachowicz, Nejbert, Kotowski, Jeleń, Ertl and Woźniak2022).
Multivariate statistics
In this study, Principal component analysis (PCA) is applied to help interpret the electron microprobe and LA-ICP-MS dataset. PCA is one of the most popular multivariate explanatory methods used in different areas of geology, including mineralogical research of tourmaline species (Galbraith et al., Reference Galbraith, Clarke, Trumbull and Wiedenbeck2009; Harlaux et al., Reference Harlaux, Kouzmanov, Gialli, Laurent, Rielli, Dini, Chauvet, Menzies, Kalinaj and Fontboté2020; Codeço et al., Reference Codeço, Weis, Trumbull, Hinsberg, Pinto, Lecumberri-Sanchez and Schleicher2021). This technique has been widely used in solving classification problems and reducing the number of possibly correlated variables to a smaller number of principal components that contain significant information on the original dataset (Makvandi et al., Reference Makvandi, Beaudoin, McClenaghan, Quirt and Ledru2019). The original dataset was partly log-transformed (microelements) and values below detection limits substituted by 0.0001; these censored data have only a minor influence on the PCA results. To present the PCA results, two types of diagrams were combined (i.e. factor and score plots).
Results
Major-element variation
Representative EMPA compositions are given in Table 1. Most tourmalines exhibit weak zoning in BSE images; one tourmaline (sample 41) from Ministerskaya contains a tiny inclusion (~5–6 μm in length) identified as Cs-rich mica (Fig. 4).

Fig. 4. Back-scattered electron images of representative tourmalines. (a) Sample 41, with a Cs-mica inclusion magnified in the inset, Ministerskaya; (b) sample 50, Ministerskaya; (c) sample 69, Buzheninov Bor; and (d) sample 79, Golodnaya.
Table 1. Representative EMPA compositions of tourmalines.

Notes: (1) Sample 75, oxy-foitite, Ministerskaya; (2) Sample 42, darrellhenryite, Ministerskaya; (3) Sample 71, oxy-schorl, Mokrusha; (4) Sample 79, oxy-schorl, Golodnaya; (5) Sample 90, oxy-schorl, Kopi Mora; (6) Sample 87, oxy-dravite, Zheltyye Yamy; (7) Sample 84, oxy-schorl, Zheltyye Yamy; (8) Sample 66, dravite, Buzheninov Bor; (9) Sample 6, schorl, Kazennitsa.
* The B2O3 and H2O contents are calculated from stoichiometry. Fe2+ and Fe3+ are calculated and distributed from the Mössbauer data, except for sample 42, where Fe2+ = Fetot.
** The Li2O content was measured with LA-ICP-MS and was included in the formula calculation.
The Y and Z site occupancies were accomplished as recommended by Henry et al. (Reference Henry, Novák, Hawthorne, Ertl, Dutrow, Uher and Pezzotta2011); b.d.l. denotes that the element content is below detection limit; n.a. denotes that the element was not analysed.
On the ternary plot X-site vacancy(□)–Ca–(Na+K), most of 180 compositions determined plot in the alkali field, except for some compositions from Ministerskaya and Zheltyye Yamy, which belong to the vacant X-site group (Fig. 5a). The Ca content of all tourmalines does not exceed 0.12 apfu, therefore a binary plot X-site vacancy/(X-site vacancy + Na) versus Fetot/(Fetot+Mg) is preferred for these tourmalines (Fig. 6a). On this diagram, most compositions plot in the schorlitic field, all compositions from Buzheninov Bor, and some compositions from Zheltyye Yamy and Kopi Mora are in the dravitic field, and a few compositions from Ministerskaya and Zheltyye Yamy are in the foititic field.

Fig. 5. Ternary plots illustrating tourmaline compositions. (a) X-site vacancy–Ca–[Na+K]; (b) F–O–OH; (c) Fe50Al50–Altot–Mg50Al50; and (d) Fe–Mn–Mg. (1) Li-rich granitic pegmatites and aplites; (2) Li-poor granitic rocks and associated pegmatites and aplites; (3) Fe-rich quartz–tourmaline rocks (hydrothermally altered granites); (4) metapelites and metapsammites coexisting with an Al-saturating phase; (5) metapelites and metapsammites not coexisting with an Al-saturating phase; (6) Fe-rich quartz-tourmaline rocks, calc-silicate rocks and metapelites; (7) low-Ca meta-ultramafic and Cr-, V-rich metasedimentary rocks; (8) metacarbonates and metapyroxenites; and (9) contact zones of complex (Li) pegmatites (after Henry and Guidotti, Reference Henry and Guidotti1985).

Fig. 6. Binary plots illustrating tourmaline compositions. (a) X-site vacancy/(X-site vacancy + Na) versus Fetot/(Fetot + Mg); (b) Fe versus Mg; (c) Fe versus Mn; and (d) YAl versus Mn. The arrow in (b) follows the direction of tourmaline evolution. See Fig. 5 for legend.
According to our calculations, the W site might be dominated by OH–, O2– and F-. Many compositions from Ministerskaya and Zheltyye Yamy belong to the oxy-species. Around 50% of the tourmalines contain up to 0.75 F apfu. Therefore, some compositions from Golodnaya, Kopi Mora and Ministerskaya are considered as fluor-species (Fig. 5b). However, most compositions have much lower F (0.10–0.20 apfu) and are classified as hydroxyl-species.
The Fetot content in the tourmalines is highly variable, from 0.23 to 2.36 apfu with the highest value in tourmaline from Mokrusha and Kazennitsa and the lowest, in the Buzheninov Bor tourmalines (Figs 5d, 6b). The Fetot/(Fetot+Mg) ratio and proportion of the X-site vacancy is 0.30–1.00 and 0.05–0.58 apfu, respectively (Table 1). On a ternary plot of Fe50Al50–Altot–Mg50Al50 (Fig. 5c), all compositions lie above the schorl–dravite join, implying enrichment in Al.
Four compositions from Ministerskaya (sample 42) have the highest Al and Mn contents (Figs 5d, 6d). This tourmaline contains 0.73–0.79 apfu Li and 1.03–1.07 apfu YAl (Table 1, anal. 2) and is classified as darrellhenryite (Novák et al., Reference Novák, Ertl, Povondra, Galiová, Rossman, Pristacz, Prem, Giester, Gadas and Škoda2013). The high Mn (0.82 apfu) and Fe (0.29 apfu) contents probably result in the black colour (Fig. 3h). This tourmaline is also F-rich (0.50 apfu).
Thus, in accordance with Henry et al. (Reference Henry, Novák, Hawthorne, Ertl, Dutrow, Uher and Pezzotta2011), the tourmalines investigated in this work are classified as schorl, oxy-schorl, fluor-schorl, dravite, oxy-dravite, foitite, oxy-foitite and darrellhenryite.
To determine possible substitution schemes in tourmalines, a binary plot Fetot versus Mg was used (Fig. 6b). In general, three groups of tourmaline compositions can be distinguished: (1) roughly parallel to the Fe axis; (2) roughly parallel to the Mg axis; and (3) roughly parallel to the schorl–dravite join (Fig. 6b).
The first group comprises some of the compositions from Ministerskaya, Kopi Mora and Zheltyye Yamy and all compositions from Mokrusha and Golodnaya. These compositions are parallel to the FeAl–1, AlO(Fe(OH))–1 and □Al(NaFe)–1 exchange vectors. Considering correlation coefficients between Fe and Al, (Al + O) and (Fe + OH), and (X □+ Al) and (Na + Fe), the dominant vector for the tourmaline compositions from various pegmatites is different. The AlO(Fe(OH))–1 vector is predominant in the Golodnaya tourmalines (corelation coefficient –0.83), whereas the □Al(NaFe)–1 vector is predominant in the Ministerskaya and Kopi Mora tourmalines, correlation coefficient –0.85 and –0.96, respectively; in the compositions of the Mokrusha and Zheltyye Yamy tourmalines, correlation coefficients are similar, therefore, the influence of all vectors are equal.
The second group includes part of the Ministerskaya and Zheltyye Yamy tourmalines and all tourmalines from Buzheninov Bor. The compositions of these tourmalines are parallel to the AlO(Mg(OH))–1 and □Al(NaMg)–1 exchange vectors. In addition, compositions with higher and lower Fe contents are distinguished (Fig. 6b).
In the case of relatively high-Fe tourmalines from Ministerskaya (8 compositions) the correlation coefficient between Altot + WO2– and Mg + WOH– is –0.94, whereas that X-site vacancy + Altot and Na + Mg is –0.90. This indicates roughly equal influence of both vectors. However for the relatively low-Fe tourmalines (6 compositions) correlation coefficients are –0.87 and –0.98 indicating the □Al(NaMg)–1 vector as predominant.
The relatively high-Fe tourmalines from Zheltye Yamy (10 compositions) have correlation coefficients –0.85 and –0.93, respectively. This testifies to the predominance of the □Al(NaMg)–1 exchange vector. The correlation coefficients in the relatively low-Fe tourmalines (12 compositions) are –0.92 and –0.96 indicating a roughly equal influence of both vectors.
At Buzheninov Bor, the relatively high-Fe tourmalines (15 compositions) show that the predominant vector is AlO(Mg(OH))–1 because the correlation coefficient between Altot + WO2– and Mg + WOH– is –0.95, whereas that between X-site vacancy + Altot and Na + Mg is –0.85. The relatively low-Fe tourmalines (4 compositions) are characterised by those correlation coefficients, –0.90 and 0.17, respectively that indicates only one vector AlO(Mg(OH))–1.
Thus, tourmalines of the second group show predominance of one of the two vectors or their roughly equal influence.
Finally, the compositions of third group including all tourmalines from Kazennitsa and partly from Kopi Mora are roughly parallel to the MgFe–1 exchange vector (Fig. 6b).
The following dominant substitutions are suggested for the tourmaline compositions on the basis of the dominant exchange vector: (1) Fe2+ ↔ Mg, (2) Al + WO2– ↔ Fe2+ + WOH–; (3) X-site vacancy + Al ↔ Na + Fe2+; (4) Al + WO2– ↔ Mg + WOH–; and (5) X-site vacancy + Al ↔ Na + Mg. The Fe2+ ↔ Mg substitution is observed in tourmalines from both serpentinite- and metamorphic-hosted pegmatites (Kazennitsa, Kopi Mora). The Golodnaya tourmalines are characterised by the second substitution. The Mokrusha tourmalines combine the second and third substitutions. Tourmalines from Zheltye Yamy are distinguished by the second, third and fifth substitutions. The Kopi Mora tourmalines have the first and third substitutions. The third, fourth and fifth substitutions characterise tourmalines from Ministerskaya. Tourmalines from Kazennitsa and Buzheninov Bor show the first and fourth substitutions, respectively. It is noteworthy that the common feature of tourmalines from pegmatites hosted by serpentinites (Ministerskaya, Zheltye Yamy, Kopi Mora and Bozheninov Bor) is the fourth and second substitutions, whereas that of tourmalines from pegmatites hosted by metamorphic rocks (Golodnaya, Mokrusha) is the second and third substitutions.
The Fe ↔ Mn substitution in tourmaline from pegmatites is quite informative for understanding a pegmatite melt process (Lichtervelde et al., Reference Lichtervelde, Grégoire, Béziat, Linnen and Salvi2008), therefore a binary Fetot versus Mn plot was constructed (Fig. 6c). Four compositions with Mn > 0.80 apfu from Ministerskaya differ dramatically from others. These compositions from sample 42 are classified as darrellhenryite (see above). In general, tourmalines from Ministerskaya have a clear negative correlation between Fe and Mn (–0.81) and a higher Mn concentration than those from other pegmatites. It is noteworthy that four compositions with 0.36–0.43 apfu Mn from Kopi Mora are attributed to the grain rim (sample 93). This indicates increasing Mn activity during crystallisation. Tourmalines from Golodnaya and some tourmalines from Zheltyye Yamy are also characterised by a negative correlation between Fe and Mn (–0.66 and –0.47, respectively). It is interesting that the correlation relationship between YAl and Mn demonstrates the opposite results in comparison with the Fe–Mn pair for compositions from all pegmatites except for Buzheninov Bor and Kazennitsa (Fig. 6d).
In addition, to understand major-element variation in tourmalines, PCA was used. Figure 7a shows а two-dimensional projection of the two first principal components (PC1 versus PC2, the total variability is 44.29%) of the major oxides. Generally, Buzheninov Bor tourmalines are characterised by a high Mg content; compositions from Zheltyye Yamy are diverse, with Mg > Fe and vice versa; tourmalines from Kazennitsa and Kopi Mora are characterised by Fe > Mg. In compositions from Golodnaya and Mokrusha, Fe > Mn, with low Mg content, whereas tourmalines from Ministerskaya are distinguished by high Mn content, with Fe > Mg. Thus, excluding Buzheninov Bor, the following sequence of pegmatites can be suggested according to the degree of differentiation: Zheltyye Yamy → Kopi Mora and Kazennitsa → Golodnaya and Mokrusha → Ministerskaya.

Fig. 7. Principal components analysis (PCA) in PC1 versus PC2 planes of (a) major-element oxides and (b) selected major- and trace-elements in tourmalines. See Fig. 5 for legend.
Trace-element variations
The LA-ICP-MS measurements were conducted on thirty-four samples from all pegmatites except for Kazennitsa (Table 2). In general, concentrations of trace elements in the tourmalines are quite low, except for Ta, U, Zr, Nb and Li in a few samples from Ministerskaya (sample 46.2, 42, 50) and one tourmaline from Kopi Mora (sample 90). These samples were omitted. Overall, total rare earth element (REE) content in all tourmalines is low ranging from 3.06 to 45.07 ppm with HREEs in most compositions being below detection limits by LA-ICP-MS (Table 2).
Table 2. Representative LA-ICP-MS data for tourmalines.

Notes: Numbers correspond to those in Table 1.
b.d.l. denotes that the element content is below detection limit; LREE – light rare earth element; HREE – heavy rare earth element.
Notwithstanding the low trace-element concentrations in tourmalines, PCA was applied to the origin dataset (selected elements) with corresponding plots constructed (Fig. 7b). The projection of the PC1 vs. PC2 planes accounts for 40.6% of the element variability. Three groups of element correlation clusters are discriminated by the PCA. A first group is composed of trace Co, Ni and Pb, and major Ca and Mg. This group includes divalent cations and corresponds to the geochemical affinity of Mg, Ni and Co, the first two elements occupy site Y, whereas Co can enter the Y and Z sites (Rozhdestvenskaya et al., Reference Rozhdestvenskaya, Setkova, Vereshchagin, Shtukenberg and Shapovalov2012); Ca and Pb occupy site X (Vereshchagin et al., Reference Vereshchagin, Wunder, Britvin, Frank-Kamenetskaya, Wilke, Vlasenko and Shilovskikh2020); and a positive correlation between Ca and Mg could reflect the uvite-type substitution in these tourmalines. A second group includes uni-, di- and trivalent trace (Li, Zn and Ga) and di- and trivalent major elements (Al and Mn); Al and Ga, and Zn and Mn are geochemical relatives, Ga can be distributed between both the Y and Z sites (Vereshchagin et al., Reference Vereshchagin, Setkova, Rozhdestvenskaya, Frank-Kamenetskaya, Deyneko and Pokholok2016); Mn and Al show a positive correlation; Li and partly Al occupy site Y. The third group is composed of U, Th, Hf, Ta, Nb, Y, In and Sn, which correspond to tri-, tetra-, and pentavalent high-field-strength elements; U, Th and Hf; Ta and Nb; and Sn and In are geochemical relatives. Due to extremely low content, REEs were excluded from PCA diagrams. According to Vereshchagin et al. (Reference Vereshchagin, Britvin, Wunder, Frank-Kamenetskaya, Wilke, Vlasenko, Shilovskikh, Bocharov and Danilov2021) and van Hinsberg (Reference van Hinsberg2011), REEs may occupy both the X and Y sites.
These data allow tourmalines from Buzheninov Bor to be attributed to the first group; tourmalines from Zheltye Yamy to the second; tourmalines from Mokrusha, Golodnaya, and Kopi Mora to be assigned to the second and the third groups; and tourmalines from Ministerskaya are spread throughout all groups.
Mössbauer spectroscopy
Mössbauer spectroscopy is useful for the examination of site occupancies and valence state of Fe in tourmaline species, thus, allowing the estimation of Fe3+/Fetot and Fe3+/Fe2+ ratios (Dyar et al., Reference Dyar, Taylor, Lutz, Francis, Guidotti and Wise1998; Oliveira et al., Reference Oliveira, Castañeda, Eeckhout, Gilmar, Kwitko, Grave and Botelho2002; Silva et al., Reference Silva, Moura, Queiroz and Ardisson2018). Mössbauer spectra were measured for 14 tourmaline samples and their parameters are given in Table 3 with representative spectra shown in Fig. 8. All Mössbauer spectra can be described as well-defined asymmetric doubled-shaped, fitted with four or five doublets. According to these results, in all tourmalines, Fe2+ occupies only site Y (Y1, Y2 and Y3); tourmalines from all pegmatites contain Fe3+; and the charge transition Fe2+ ↔ Fe3+ is noted in samples from Ministerskaya, Mokrusha, Kopi Mora, Zheltyye Yamy and Buzheninov Bor, whereas this is absent in tourmalines from Golodnay and Kazennitsa (Table 3; Fig. 8). According to the Fe3+/Fetot ratio, which varies from 5 to 39% (Table 3), the tourmalines can be divided into two groups. The first includes Mokrusha, Golodnaya and Kazennitsa with a low Fe3+/Fetot ratio ranging from 5 to 15%; the second comprises tourmalines from Ministerskaya, Zheltyye Yamy, Kopi Mora and Buzheninov Bor with a higher Fe3+/Fetot ratio, ranging from 22 to 39%. Notably, the Fe3+/Fe2+ ratio ranges from 0.05 to 0.18 and from 0.28 to 0.65 in the tourmalines from the first and second groups, respectively.

Fig. 8. Representative Mössbauer spectra of tourmalines.
Table 3. Hyperfine parameters of representative tourmalines.

Notes: (1) Sample 75, oxy-foitite, Ministerskaya mine; (2) Sample 34, oxy-schorl, Ministerskaya mine; (3) Sample 71, oxy-schorl, Mokrusha; (4) Sample 72, schorl, Mokrusha; (5) Sample 79, oxy-schorl, Golodnaya; (6) Sample 80, oxy-schorl, Golodnaya; (7) Sample 6, schorl, Kazennitsa; (8) Sample 5, schorl, Kazennitsa; (9) Sample 90, oxy-schorl, Kopi Mora; (10) Sample 92, oxy-schorl, Kopi Mora; (11) Sample 87, oxy-dravite, Zheltyye Yamy; (12) Sample 84, oxy-schorl, Zheltyye Yamy; (13) Sample 66, dravite, Buzheninov Bor; and (14) Sample 68, oxy-dravite, Buzheninov Bor;
IS – Isomer Shift; QS – Quadrupole Splitting; S – relative area; Г – peak width; IVCT – intervalence charge transfer.
* Fe3+ was calculated as Fe3++(Fe2.5+/2); Fe2+ was calculated as Fe2++(Fe2.5+/2).
Raman spectroscopy
Forty-three tourmaline samples from the pegmatites were investigated by Raman spectroscopy in two frequency ranges: 100–1000 and 3000–4000 cm–1. The low-frequency range is useful for distinguishing Fe- and Mg-rich tourmalines, whereas the high-frequency range is associated with the OH-stretching modes. The Raman frequencies and their assignments for representative samples are given in Table 4. In general, the Raman data are consistent with the electron microprobe data according to which the tourmalines are classified as schorl, oxy-schorl, fluor-schorl, dravite, oxy-dravite, foitite, oxy-foitite, and darrellhenryite.
Table 4. Representative Raman frequencies of tourmaline species.

Notes: (1) Sample 79, oxy-schorl, Golodnaya; (2) Sample 6, schorl, Kazennitsa; (3) Sample 19, oxy-schorl, Zheltyye Yamy; (4) Sample 64.2, dravite, Buzheninov Bor; (5) Sample 89, oxy-dravite, Zheltyye Yamy; (6) Sample 50, oxy-foitite, Ministerskaya; (7) Sample 85, foitite, Zheltyye Yamy; and (8) Sample 42, darrellhenryite, Ministerskaya.
Fe* = (Fe2+ + Mn2+). Assignments are given according to Watenphul et al. (Reference Watenphul, Burgdorf, Schlüter, Horn, Malcherek and Mihailova2016a, Reference Watenphul, Schlüter, Bosi, Skogby, Malcherek and Mihailova2016b).
Low-frequency range
The spectroscopic features of tourmalines in the low-frequency range are shown on the left panel of Fig. 9. Representative tourmaline bands and their assignments are given in Table 4. In most samples, the strongest peak at ~370 ± 5 cm–1 is typical of the ZAl-dominant tourmalines (ZO6). The range ~650–720 cm–1, related to the SiO4 ring vibrations, contains two or three peaks. The Mg-dominant tourmalines from Buzheninov Bor, Kopi Mora and Zheltyye Yamy exhibit a clearly resolved doublet at ~213 ± 1 and ~235 ± 5 cm–1. In contrast, Fe-rich species from all pegmatites display only one well-defined peak at ~236 ± 3 cm–1 with weak shoulders. Most tourmalines exhibit a Raman peak at ~313 ± 3 cm–1, which according to Watenphul et al. (Reference Watenphul, Schlüter, Bosi, Skogby, Malcherek and Mihailova2016b) is assigned to the Y–O–Z bending vibration, which is sensitive to the Fe3+ content at the Y site. The Fe3+ content at both, the Y and Z sites can be calculated as YFe3+ = (314 – ω)/7 and ZFe3+ = $\sqrt {{\rm [ ( 367\;\ndash \;}\rm \omega {\rm ) /6] }} , \;$ respectively (Watenphul et al., Reference Watenphul, Schlüter, Bosi, Skogby, Malcherek and Mihailova2016b). These calculations indicate that Fe3+ in tourmalines from all pegmatites except for Kazennitsa, occupies only the Y site, whereas in tourmaline from Kazennitsa (sample 6) it occupies both the Y and Z sites (Table 4). Raman spectra of some tourmalines from Ministerskaya and Zheltyye Yamy display a peak at ~230 ± 2 cm–1, which corresponds to YO6 in foitite.
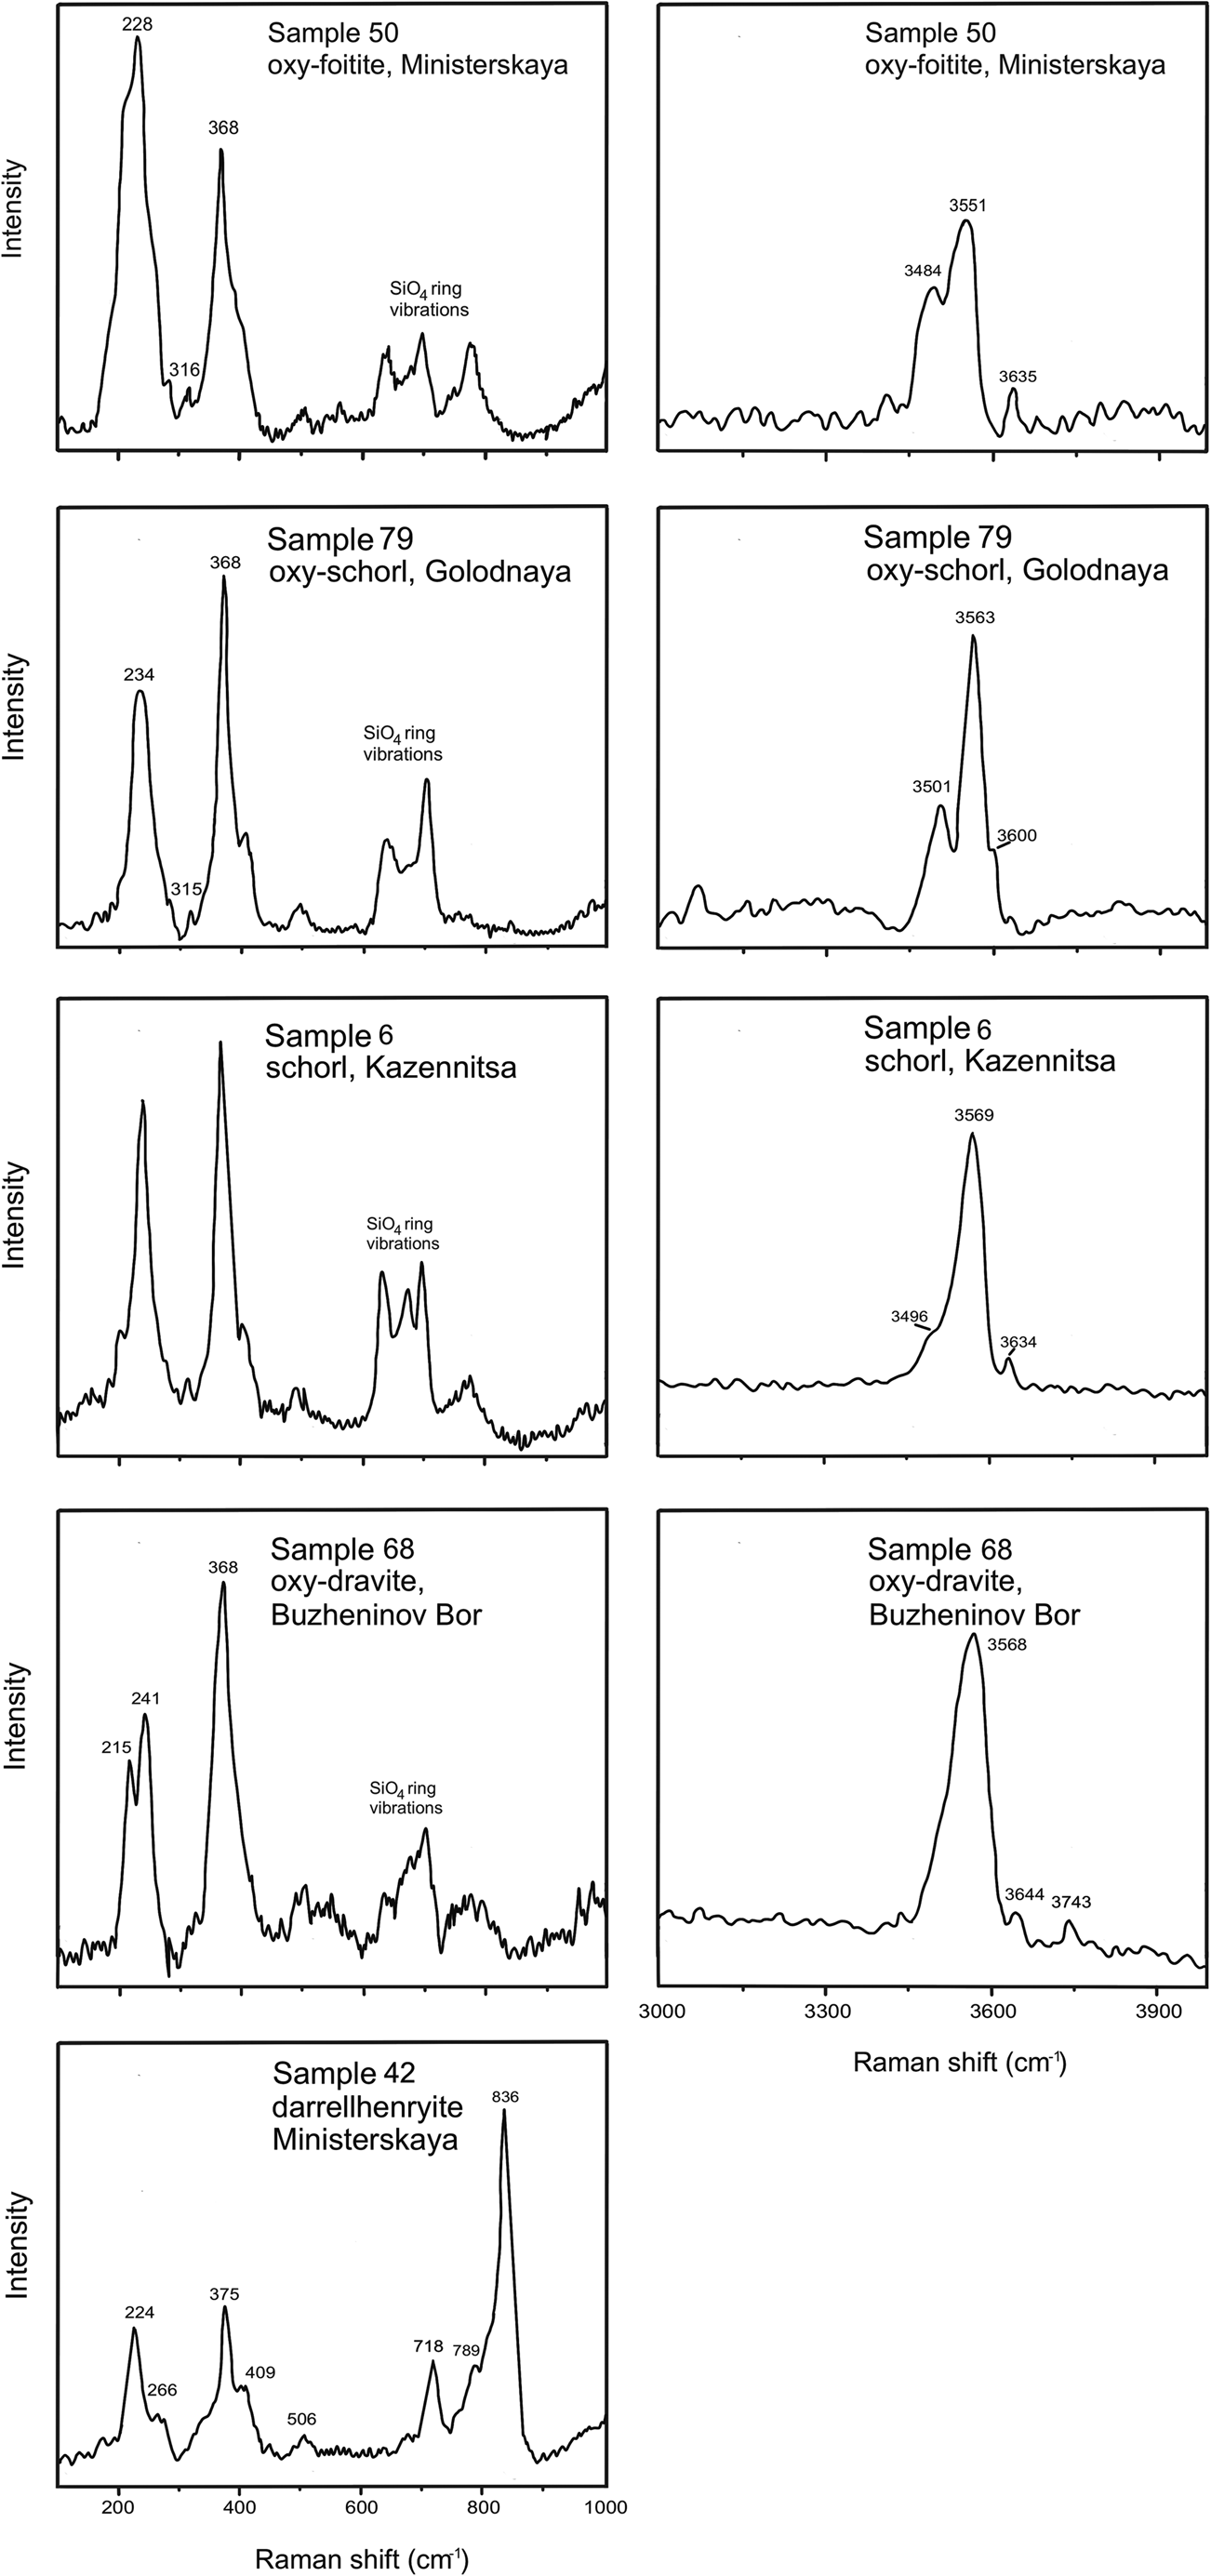
Fig. 9. Raman spectra of tourmalines in the low- (left panel) and high-frequency (right panel) ranges.
Raman spectra of darrellhenryite from Ministerskaya is distinguished from other tourmaline spectra by the presence of two noticeable shoulders that correspond to the YO6 and ZO6 main peaks: ~224 cm–1 with a shoulder at ~266 cm–1 and ~375 cm–1 with ~409 cm–1, respectively. In addition, spectra of this tourmaline display the strongest peak at ~836 cm–1, which might originate from the OH-vibration mode (Fig. 9). In addition, the Raman spectrum of this sample, the very weak OH-stretching Raman scattering, and a strong peak near 836 cm–1, indicates that this grain was oriented with its crystallographic c axis predominantly perpendicular to the polarisation of the incident laser. In contrast, the other samples seem to be oriented with the crystallographic c axis predominantly parallel to the polarisation of the incident laser radiation (Watenphul et al., Reference Watenphul, Burgdorf, Schlüter, Horn, Malcherek and Mihailova2016a).
High-frequency range
Typically the study of hydroxyl groups in tourmalines focuses on infrared spectroscopy of the OH bond stretching modes (Gonzalez-Carreño et al., Reference Gonzalez-Carreño, Fernandez and Sanz1988; Castañeda et al., Reference Castañeda, Oliveira, Gomes and Soares2000; Skogby et al., Reference Skogby, Bosi and Lazor2012; Fantitni et al., 2014). However, Raman spectroscopy in the high-frequency range can also be useful for that purpose (Watenphul et al., Reference Watenphul, Burgdorf, Schlüter, Horn, Malcherek and Mihailova2016a).
All spectra collected in this study are divided into three groups in accordance with the position of the VOH mode. Representative Raman spectra are shown in Fig. 9 (right panel), and peak assignments are given in Table 4. The first group includes tourmalines showing the strongest peak at ~3566 ± 3 corresponding to the most probable triplet YZZ–YZZ–YZZ – 3YFeZAlZAl. This peak is typical of schorl (Watenphul et al., Reference Watenphul, Burgdorf, Schlüter, Horn, Malcherek and Mihailova2016a). The second group comprises tourmalines with the strongest peak at ~3570 ± 2 cm–1, which is assigned to 3YMgZAlZAl, corresponding to dravite. The third group includes tourmalines with the most intense VOH-stretching mode at ~3550 ± 1 cm–1, which is attributed to 2YFeZAlZAl–YAlZAlZAl, typical of foitite (Watenphul et al., Reference Watenphul, Burgdorf, Schlüter, Horn, Malcherek and Mihailova2016a). All but one spectra display distinct WOH-stretching modes with frequencies and corresponding assignments given in Table 4. The most noticeable peaks are ~3632 ± 2 cm–1 for schorl, ~3644 ± 1 cm–1 and ~3743 ± 1 cm–1 for dravite, and ~3635 ± 1 cm–1 for foitite. The analysis of the V,WOH vibrations in the Raman spectra of darrellhenryite is difficult due to the very weak modes.
Discussion
According to the data obtained, the tourmalines from granitic pegmatites related to the Murzinka Pluton differ in their compositions and are classified as schorl, oxy-schorl, fluor-schorl, dravite, oxy-dravite, foitite, oxy-foitite and darrellhenryite. The lack of compositional variations in the individual tourmaline samples is probably due to re-equilibration in the system during internal evolution of the pegmatites (Roda-Robles et al., Reference Roda-Robles, Pesquera, Gil, Torres-Ruiz and Fontan2004).
Tourmaline composition reflects the evolution of granitic pegmatites (Jolliff et al., Reference Jolliff, Papike and Shearer1986; Roda et al., Reference Roda, Pesquera and Velasco1995; Tindle et al., Reference Tindle, Breaks and Selway2002; Roda-Robles et al., Reference Roda-Robles, Pesquera, Gil, Torres-Ruiz and Fontan2004, Reference Roda-Robles, Simmons, Pesquera, Gil-Crespo, Nizamoff and Torres-Ruiz2015); the Al content in tourmaline increases during pegmatite evolution (Roda-Robles et al., Reference Roda-Robles, Pesquera, Gil, Torres-Ruiz and Fontan2004). In addition, tourmaline of the earliest stage is richer in Mg, whereas that crystallised at a late stage is characterised by higher Fe, Na, Al and Mn content (Jolliff et al., Reference Jolliff, Papike and Shearer1986; Reference Jolliff, Papike and Laul1987; Roda et al., Reference Roda, Pesquera and Velasco1995; Tindle et al., Reference Tindle, Breaks and Selway2002; Roda-Robles et al., Reference Roda-Robles, Pesquera, Gil, Torres-Ruiz and Fontan2004, Reference Roda-Robles, Simmons, Pesquera, Gil-Crespo, Nizamoff and Torres-Ruiz2015; Galbraith et al., Reference Galbraith, Clarke, Trumbull and Wiedenbeck2009). Tourmalines studied here are Al rich with 5.99–8.09 apfu Altot (Fig. 5c) – darrellhenryite from Ministerskaya has the highest Al; in addition, it is the richest in Mn among all other tourmalines. This indicates darrellhenryite formation was at the late stage.
Roda-Robles et al. (Reference Roda-Robles, Pesquera, Gil, Torres-Ruiz and Fontan2004) suggested that the high Mg content in tourmalines related to granitic pegmatites is due to derivation from an earlier concentration of boron-rich fluids in the granitic chamber, prior to the generation of the pegmatite itself. In the current study, Mg-rich tourmalines were reported from the Buzheninov Bor, Zheltyye Yamy, Ministerskaya and Kopi Mora pegmatites hosted by serpentinites. Therefore, we suggest that these pegmatites were contaminated by host rocks at the early stage. The presence of foitite in a few samples from Ministerskaya and Zheltyye Yamy are very likely related to albite, either Na was partitioned into albite before tourmaline crystallisation (alkali-depleted melt) or into coexisting albite (Roda-Robles et al., Reference Roda-Robles, Pesquera, Gil, Torres-Ruiz and Fontan2004).
Darrellhenryite is the latest forming tourmaline from pegmatites at its type locality Nová Ves in Czech Republic (Novák et al., Reference Novák, Ertl, Povondra, Galiová, Rossman, Pristacz, Prem, Giester, Gadas and Škoda2013) and in the Berry–Havey pegmatite in Maine, USA (Roda-Robles et al., Reference Roda-Robles, Simmons, Pesquera, Gil-Crespo, Nizamoff and Torres-Ruiz2015). Zhou et al. (Reference Zhou, Qin, Tang, Wang, Tian and Sakyi2015) reported the following evolution within the Kokotkay No 3 pegmatite in Altai, China: dravite → foitite-schorl → schorl → elbaite → rossmanite. Having studied paragenesis and compositional zoning within individual tourmaline crystals from the Tanko pegmatite at Bernic Lake in Manitoba, Canada, Selway et al. (Reference Selway, Čerńy, Hawthorne and Novak2000) revealed the sequence of crystallisation from foitite–schorl through Al-rich schorl, schorl, schorl–elbaite, fluor-elbaite, Fe-rich fluor-elbaite, Mn-bearing fluor-elbaite, to rossmanite.
All tourmaline crystals studied here are roughly homogenous and we did not observe overprinting tourmaline species. However, taking into account the aforementioned literary data, the possible compositional evolution of tourmalines studied here is Mg-rich dravite through to Fe-rich schorl, foitite, and oxy-foitite to Fe- and Mn-rich darrellhenryite. This composition trend is shown in Fig. 5c, where the compositions with the lowest Fe and Mg correspond to darrellhenryite.
The compositional changes observed in tourmalines may be explained by five main mechanisms: (1) Fe2+ ↔ Mg; (2) Al + WO2– ↔ Fe2+ + WOH–; (3) X-site vacancy + Al ↔ Na + Fe2+; (4) Al + WO2– ↔ Mg + WOH–; and (5) X-site vacancy + Al ↔ Na + Mg.
The first simple homovalent substitution takes place in early tourmalines from pegmatites, which are not contaminated by host Mg-rich rocks (Selway et al., Reference Selway, Novak, Čerńy and Hawthorne1999, Tindle et al., Reference Tindle, Breaks and Selway2002, Roda-Robles et al., Reference Roda-Robles, Pesquera, Gil, Torres-Ruiz and Fontan2004). The second proton-loss substitution in combination with the third alkali-defect substitution in tourmaline play a significant role for further pegmatite evolution. These three substitutions are identified in tourmalines from three pegmatites hosted by metamorphic rock (Kazennitsa, Mokrusha, Golodnaya) and one pegmatite in serpentinites (Kopi Mora). In the last case, the pegmatite was probably formed in a closed system and did not interact with the host rock.
The fourth and fifth mechanisms are described in tourmalines from pegmatites contaminated by host serpentinites in the Moldubian Zone, Czech Republic (Novák et al., Reference Novák, Prokop, Losos and Macek2017). Pegmatites were divided into A, B and C types in their zoning and mineralogy: from unzoned and mineralogical simple type A to zoned and mineralogical complex type C including lithium minerals. The tourmaline compositions from the Ural pegmatites are similar to those reported in the Moldubian Zone as B and C types. Tourmalines from Buzheninov Bor are comparable with the B type tourmalines in composition, whereas tourmalines from Ministerskaya and Zheltye Yamy are comparable with the C type.
Some tourmalines from Ministerskaya have the highest content of Mn (up to 0.86 apfu Mn, darrellhenryite) and contain inclusions of Cs-mica. Manganese and Cs indicate the evolved pegmatite environment (Čerńy et al., Reference Čerńy, Meintzer and Anderson1985, London Reference London2008, Roda-Robles et al., Reference Roda-Robles, Simmons, Pesquera, Gil-Crespo, Nizamoff and Torres-Ruiz2015) and Ministerskaya is the most evolved pegmatite among those studied here.
Generally, the Fe3+/Fetot ratio in tourmalines from granitic pegmatites does not exceed 10% (Dyar et al., Reference Dyar, Guidotti, Core, Wearn, Wise, Francis, Johnson, Brady, Robertson and Cross1999; Gaweda et al., Reference Gaweda, Pieczka and Kraczka2002), however in the tourmalines of the Třebíč pluton this value is 17–26% (Novak et al., 2011). The Fe3+/Fetot ratio in the tourmalines studied here reaches 39%. The Fe3+/Fetot ratio is clearly governed by the rocks hosting the pegmatite. It ranges from 5 to 15% in tourmalines from pegmatites hosted by metamorphic rocks (Mokrusha, Golodnaya and Kazennitsa) and from 22 to 39% in tourmalines from pegmatites hosted by serpentinites (Ministerskaya, Zheltyye Yamy, Kopi Mora and Buzheninov Bor).
The Fe3+/Fe2+ ratio in Fe tourmalines is a good indicator of a tourmaline crystallisation environment, which is controlled by the conditions prevailing during the crystallisation or later transformations, rather than by substitution mechanisms (Dyar et al., Reference Dyar, Taylor, Lutz, Francis, Guidotti and Wise1998; Oliveira et al., Reference Oliveira, Castañeda, Eeckhout, Gilmar, Kwitko, Grave and Botelho2002). In tourmalines from Mokrusha, Golodnaya and Kazennitsa, this ratio ranges from 0.05 to 0.18, corresponding to the low oxidising conditions in a closed magmatic environment, whereas this value for tourmalines from other pegmatites is between 0.28 and 0.65, reflecting the intermediate oxidising conditions in a half-open environment (Oliveira et al., Reference Oliveira, Castañeda, Eeckhout, Gilmar, Kwitko, Grave and Botelho2002). According to Gaweda et al. (Reference Gaweda, Pieczka and Kraczka2002), the differences in the Fe3+/Fe2+ value in tourmalines is due to both variations in oxygen fugacity in the source metasediments during anatexis and interaction of magmatic/postmagmatic fluids with the metamorphic host rocks.
Generally, tourmalines from this study are characterised by relatively high Zn, Ga, Sn and Sc concentrations (Table 2). The rare-earth element concentration is quite low, except for Ce, which is comparable with other known pegmatitic tourmalines, except for a few REE-enriched tourmalines reported (Jolliff et al., Reference Jolliff, Papike and Laul1987, Roda et al., Reference Roda, Pesquera and Velasco1995, Roda-Robles et al., Reference Roda-Robles, Pesquera, Gil, Torres-Ruiz and Fontan2004, Ertl et al., Reference Ertl, Hughes, Prowatke, Ludwig, Prasad, Brandstätter, Körner, Schuchuchuster, Pertlik and Marschall2006, Novák et al., Reference Novák, Škoda, Filip, Macek and Vaculovič2011, Bačík et al., Reference Bačík, Uher, Ertl, Jonsson, Nysten, Kanický and Vaculovič2012). The high Zn content is usual in tourmalines from pegmatites (Roda et al., Reference Roda, Pesquera and Velasco1995; Roda-Robles et al., Reference Roda-Robles, Simmons, Pesquera, Gil-Crespo, Nizamoff and Torres-Ruiz2015). The highest Zn concentration among tourmalines studied here was measured in Golodnaya, Zheltyye Yamy and Mokrusha (4287, 3758 and 1966 ppm, respectively) (Table 2). The relatively high Sn content (up to 205 ppm) observed in tourmalines from Ministerskaya could be due to possible Sn mineralisation, or be controlled by fractionation of the pegmatite-forming melt (Roda-Robles et al., Reference Roda-Robles, Pesquera, Gil, Torres-Ruiz and Fontan2004, Reference Roda-Robles, Simmons, Pesquera, Gil-Crespo, Nizamoff and Torres-Ruiz2015).
Considering the trace-element data and mineral composition of pegmatites, the most similar tourmalines to those studied here seem to be tourmalines from Třebíč pluton, Czech Republic (Novák et al., Reference Novák, Škoda, Filip, Macek and Vaculovič2011), assigned to the NYF petrogenetic family. According to Popov and Popova (Reference Popov and Popova1999), Kanonerov and Chudinova (Reference Kanonerov and Chudinova2000) and Popova et al. (Reference Popova, Popov and Kanonerov2002), the aforementioned pegmatites contain a wide range of accessory minerals, i.e. annite, titanite, rutile, euxenite, monazite, milarite, etc. At the same time, Novák et al. (Reference Novák, Škoda, Filip, Macek and Vaculovič2011) described in detail allanite- and euxenite-type NYF pegmatites from the Třebíč Pluton with a mineral composition close to those from the Urals. However, tourmalines from that pluton have much higher Sn, Sc and Ni concentrations. Thus, in accordance with Čerńy and Ercit (2005), pegmatites from this study could be classified as NYF pegmatites, however further research is necessary.
The anomalous Ta, U, Zr and Nb content in two samples from Ministerskaya (samples 46.2, 50) and one tourmaline from Kopi Mora (sample 90) is most probably caused by tiny mineral inclusions, captured by laser during LA-ICP-MS analysis.
Overall, Raman data in combination with electron microprobe analysis helped to identify tourmaline species and to assign Fe3+ to the Y site (Watenphul et al., Reference Watenphul, Burgdorf, Schlüter, Horn, Malcherek and Mihailova2016a, Reference Watenphul, Schlüter, Bosi, Skogby, Malcherek and Mihailova2016b). The darrellhenryite spectrum from Ministerskaya is similar to that of elbaite, except for the strongest peak at ~836 cm–1 (Fig. 9). Mid-wavenumber modes in tourmaline are associated with Si–O vibrations of the Si6O18 ring, however this part of the tourmaline spectra is strongly influenced by the cations at the Y site (Hoang et al., Reference Hoang, Hien, Chen, VanMinha and Yang2011; Fantini et al., Reference Fantini, Tavares, Krambrock, Moreira and Righi2014). The higher frequency range with the OH-stretching modes for darrellhenryite displayed weak unrecognisable modes. According to Hoang et al. (Reference Hoang, Hien, Chen, VanMinha and Yang2011), the presence of a strong peak at ~840 cm–1 in elbaite can be explained by OH-vibration coordinated to AlYAlYFeY instead of AlYAlYLiY. Thus, the same peak in darrellhenryite spectra can be explained by the incorporation of Fe in combination with Al and Li at the Y site.
Conclusions
Tourmalines from the Li-poor NYF granitic pegmatites related to the Murzinka Pluton are Al-rich. The tourmaline composition possibly evolves from Mg-rich dravite through to Fe-rich schorl, foitite and oxy-foitite to Fe- and Mn-rich darrellhenryite. The chemical study of tourmalines made it possible to rank the pegmatites by increasing degrees of differentiation: Zheltyye Yamy → Kopi Mora and Kazennitsa → Golodnaya and Mokrusha → Ministerskaya. Tourmaline compositions indicate that the Buzheninov Bor, Zheltyye Yamy, Kopi Mora and Ministerskaya tourmalines were contaminated by host serpentinites. On the basis of the Fe3+/Fe2+ value measured in tourmalines, pegmatites were formed in an environment with variable oxidising conditions.
Acknowledgements
We thank Igor Pekov for the samples kindly placed at our disposal and Lyudmila Sipavina for obtaining the Mössbauer spectra. We are also grateful to the staff of the Rezh Natural Mineralogical Reserve, Urals, Russia and personally to Artem Sergushin, the head of the Reserve for assistance in samples collection. The authors thank Oleg Vereshchagin and the anonymous reviewer for their valuable comments, which significantly improved the manuscript.
The LA-ICP-MS study was supported by the state assignment of the “Geoanalitik” shared research facilities of Institute of Geology and Geochemistry UB RAS (Yekaterinburg, Russia) (№ AAAA-A18-118053090045-8). The re-equipment and comprehensive development of the “Geoanalitik” shared research facilities of the Institute of Geology and Geochemistry UB RAS (Yekaterinburg, Russia) is financially supported by the grant of the Ministry of Science and Higher Education of the Russian Federation (Agreement No. 075-15-2021-680).
Competing interests
The authors declare none.


