


1. INTRODUCTION
High harmonic generation in relativistic interactions from femtosecond laser pulses on solid density targets has stimulated interest in a number of potential applications in plasma diagnostics and technological developments in ultrafast optics for studying dynamical processes in matter, and more recently as sources for generating ultrashort-intense pulses in the attosecond range (Teubner & Gibbon, Reference Teubner and Gibbon2009).
It has long been known from the experiments and particle simulations that laser-generated harmonics from the interaction of a highly intense light pulse with overcritical density plasmas are characterized by a power-law decay that can extend over hundreds or even thousands of harmonic orders. Across this range, the scaling of the intensity I with harmonic order m is well represented by a power-law  $I \propto m^{ - p} $. Gibbon (Reference Gibbon1996) first proposed an empirical scaling on the basis of particle-in-cell (PIC) simulations, a scaling subsequently borne out by observation (Norreys et al., Reference Norreys, Zepf, Moustaizis, Fews, Zhang, Lee, Bakarezos, Danson, Dyson, Gibbon, Loukakos, Neely, Walsh, Wark and Dangor1996). These indicated that p lay in a range p = 5.5 at a 0 ≃ 0.6, decreasing to p ≃ 3.3 at a 0 = 2.9, where
  $a_0 = 8.54{\kern 1pt} (I_{20} {\kern 1pt} {\rm \lambda} _{\rm L}^2 )^{1/2} $ is the normalized quiver momentum, with I 20 denoting the light intensity in units of 1020 W cm−2 and λ L the laser wavelength measured in microns.
This trend persisted as  $I{\rm \lambda} _{\rm L}^{\rm 2} $ increased beyond these moderately relativistic levels into the ultra-relativistic (UR) range. Within this range, Baeva, Gordienko, and Pukhov (BGP; Baeva et al., Reference Baeva, Gordienko and Pukhov2006) devised a similarity model in which the interaction physics remains invariant for constant values of a similarity parameter S = n e0/n ca 0, where n e0/n c is the ratio of the initial electron plasma density to the critical density. This model showed that p = 8/3, a decay claimed, at the time, to be universal. The BGP analysis led moreover, to a spectral cut-off at
  $m_{\rm c} = \sqrt {8{\kern 1pt} \alpha} {\kern 1pt} {\rm \gamma} _{\rm s}^{\rm 3} $, where γ s is the relativistic factor associated with the plasma surface, and α is of order unity.
This would indeed be a remarkable result were it truly universal. However, Boyd and Ondarza-Rovira (BOR) showed that while a p = 8/3 decay is characteristic of harmonic spectra across the range of intensities considered in (Boyd & Ondarza-Rovira, Reference Boyd and Ondarza-Rovira2010a, Reference Boyd and Ondarza-Rovirab), this was only true when the incident laser light was S-polarized. Figure 1a is representative of S-polarized spectra across a wide range of values of the parameters that define the BGP similarity index, S, viz. n e0/n c and a 0. This shows that to a good approximation, p = 8/3 across a harmonic range 10 ≲ m ≲ 1000. In this case, n e0/n c = 100, a 0 = 20, and the pulse length t p = 17 fs. Tellingly, support for p = 8/3 decay was soon forthcoming from measured spectra where Dromey et al. (Reference Dromey, Kar, Bellei, Carroll, Clarke, Green, Kneip, Markey, Nagel, Simpson, Willingale, Mckenna, Neely, Najmudin, Krushelnick, Norreys and Zepf2007) found p in a range 2.4–2.8 in experiments with a 0 = 13.

Fig. 1. Harmonic spectra from laser pulses incident obliquely on a plane target plasma for (a) S-polarization and (b) P-polarization of the incident light. Laser and plasma parameters: a 0 = 20, n e/n c = 100, and t p = 17 fs.
However, PIC simulations using P-polarized light tell a different story. Once again, the simulations encompassed a wide range of n e/n c and a 0, as well as different pulse lengths and pulse shapes; the spectra however, did not fit the so-called universal model. These results led BOR to contest the BGP claim that the index p = 8/3 was truly universal. A typical spectrum in the case of a P-polarized incident light pulse is shown in Figure 1b for the parameters used in Figure 1a. In this case, the spectrum is best fitted by a decay index p = 5/3 across the harmonic range of interest. BOR found that across a range of parameter combinations chosen such that 1 ≤ S ≤ 10, with 5 ≤ a 0 ≤ 30, the decay index was typically p = 5/3.
However as the light intensity is increased beyond this, the simulations showed that the decay index relaxed further to p = 4/3. At the highest intensities used in the simulations (a 0 = 100), it appeared lower still at p = 2/3, though at this end of the scale, noise levels degrade the spectral resolution. BOR characterized aspects of this emission, showing that the deviation seen in the spectra from a p = 8/3 decay reflected details of the interaction physics in which emission at the plasma frequency ωp and its harmonics distort the spectrum of laser harmonics. Plasma waves are excited by bunches of UR electrons, generated by Brunel absorption (electrons that were first pulled out and then strongly accelerated back into the plasma by the laser electric field). These in turn couple to the radiation field in the presence of strong density gradients at the plasma surface.
Across a range 1 ≤ S ≤ 4, BOR found that within the parameter space represented in Figure 2, the decay index was typically p = 5/3. As the light intensity increases, that is, as S decreases, the simulations show that the decay index relaxed further to p = 4/3. However, there appeared to be no marked delineation in this parameter space between the two decays, in contrast to the distinction between the two polarizations. Broadly speaking, the gradation in coloring shown in Figure 2 should be viewed more as an indication of the zones in parameter space across which either of these indices prevail, rather than any hard and fast delineation.

Fig. 2. Data points from PIC experiments and from the theoretical model introduced in Section 3 spanning the region of parameter space (n e0/n c, a 0) enclosed by the lines S = 1, S = 4. Regions colored yellow (red) correspond to those over which p = 5/3 (p = 4/3) spectral decay prevails; the fading of one coloring into the other is intended to indicate that there is no clearly delineated region of the parameter space across which one or other index prevails. Green bullets correspond to PIC data and red bullets to the model described in this paper.
2. MODELING THE LANGMUIR SOURCE ELECTRIC FIELD
Modeling the spectrum of high harmonics along with the plasma emission is a challenge not yet met. Some light can be shed on the problem, albeit piecemeal. The first step is to compare data from our PIC simulations that span a wide range of (n e0/n c, a 0) parameter space, with estimates of the Langmuir electric field computed from a cold beam–plasma model. This comparison in turn provides a basis for modeling the emission in phase 2, guiding our choice of parameters to optimize the Langmuir emission. This aspect will be outlined in Section 3.
We have discussed elsewhere the bunching of the Brunel electrons that provides the driver for the Langmuir wave (Boyd & Ondarza-Rovira, Reference Boyd and Ondarza-Rovira2010b). Figure 3a, 3b show the examples of phenomena that characterize the interaction in the case of P-polarized light (Boyd & Ondarza-Rovira, Reference Boyd and Ondarza-Rovira2010b). Figure 3a shows clear electron bunching across a region approximately 0.2λL in extent, with a peak density n e/n c ~ 230 only 15 nm in width. The corresponding electric field contours in Figure 3b represents the Langmuir field increasing to a peak at x/λL~0.4 before dropping away sharply.

Fig. 3. (a) Example of electron bunching from PIC simulation where a 0 = 30, n e0/n c = 50; (b) corresponding contours of the Langmuir electric field E x (Boyd & Ondarza-Rovira, Reference Boyd and Ondarza-Rovira2010b); (c) maximum Langmuir field excitation  $E \propto (S - \sqrt 2 )^{ - 1/2} $ as a function of n e0/n b from cold electron beam model; and (d) measurements of maximum Langmuir field from PIC simulations across the ranges 10 ≲ a 0 ≲ 40, and 30 ≲ n e0/n c ≲ 100, such that 1 ≤ S ≤ 6 (Boyd & Ondarza-Rovira, Reference Boyd and Ondarza-Rovira2010b).
Figure 3c, 3d recapitulate results from earlier work by Boyd & Ondarza-Rovira (Reference Boyd and Ondarza-Rovira2010b) which adapted a one-dimensional (1D) cold electric beam model to describe the re-entrant Brunel electrons interacting with the plasma to drive beam-resonant Langmuir waves of wave number k~ωp/v b. This model predicts a maximum Langmuir field  $E_{{\rm Lang}}^{{\rm max}} \propto \left[ {n_{\rm b} /} \right.(n_{{\rm e}0} - 2{\kern 1pt} n_{\rm b} )]^{1/2} $, where n b denotes the beam density of the Brunel electrons. Approximating the Brunel beam density
  $n_{\rm b} {\rm \sim} {\rm \gamma} {\kern 1pt} n_{\rm c} {\rm \sim} a_0 {\kern 1pt} n_{\rm c} /\sqrt 2 $ provides an estimate of the peak Langmuir field
  $E \propto (S - \sqrt 2 )^{ - 1/2} $. In other words, optimal plasma emission is expected at low values of S. Evidence from our PIC simulations (Boyd & Ondarza-Rovira, Reference Boyd and Ondarza-Rovira2010b) lends support to this prediction.
Figure 3c plots the maximum Langmuir field according to this simple beam model, showing its dependence on beam density. Figure 3d shows corresponding data points from a set of 1−1/2D PIC simulations in which the parameter range was set at 10 ≲ a 0 ≲ 40, 30 ≲ n e0/n c ≲ 100. We see from this that the predictions from the model are broadly in line with the outcome of the PIC simulations and on this evidence, it appears that the range of S across which emission from a plasma source (or sources) is dominant, is 1 ≲ S ≲ 5. Across this region we find the evidence of plasma effects present in the spectrum of harmonics. At frequencies above the plasma frequency, harmonic decay is generally well represented by a decay coefficient p = 5/3. What happens in the region below  $S = \sqrt 2 $ is more problematic. Here our PIC data are relatively sparse and what there are, do not reflect the behavior of the cold beam–plasma model in this part of the range.
3. SOLITON MODEL OF PLASMA EMISSION
With the Langmuir electric field characterized by means of our PIC simulations, we turn next to a representation of this field first proposed by Weatherall (Reference Weatherall1988) as a radiation source in relativistic beam devices as well as a model of galactic emission (Weatherall & Benford, Reference Weatherall and Benford1991). This work drew attention to radiation from large-amplitude Langmuir waves excited by means of electron beam–plasma interactions, stressing the significance of electron bunching in generating high-amplitude waves. Weatherall modeled the Langmuir electric field as a dipole soliton
 $${\bf E}_{{\rm Lang}} = - \displaystyle{2 \over 3}{\rm \pi} \rho _0 D\,exp( - i{\rm \omega} _{\rm p} t)\hat {\bf p}, $$
where ρ0 is the amplitude of the electron charge density and D is the scale length of the condensate region, oscillating at the plasma frequency ωp, with a dipole moment oriented in the direction  $\hat{\bf p}$ (Weatherall, Reference Weatherall1988).
In particular, Weatherall showed that for an appropriate choice of parameters, with beam bunching added to provide the degree of coherence needed, this model could account not only for strong emission at the plasma frequency and its harmonics (Weatherall & Hobbs, Reference Weatherall and Hobbs1986), but additionally as a source of broadband radiation for ultra-relativistic electron beams. Figure 4a shows a power spectrum computed using Weatherall's model. It shows, naturally, strong emission at the plasma frequency as well as a distinctive spectral cut-off at  ${\rm \omega} _{\rm c} = 2 {\rm \gamma} _{\rm b}^2 (c/D)$, where γb is the relativistic gamma for the beam. Physically, this cut-off frequency corresponds to the highest frequency emitted by electrons scattered by solitons of scale length D. Over the range spanned by these frequencies, spectral decay is well represented by a power-law dependence with p = 5/3.

Fig. 4. (a) Beam radiation power spectrum from density correlations in Weatherall's model and (b) radiation from a laser-accelerated electron perturbed by a soliton field, radiation characterized by strong emission at the plasma frequency ωp and power decay index 5/3 up to m = 220, for a 0 = 40, n e/n c = 167, and m = ωm/ωL.
We have adapted the source in (1) and tailored it to our needs by choosing the parameters ρ0 and D to conform to the range of values measured in our PIC runs described in Section 2 (cf. Figure 3d). With these choices, we then integrated the relativistic Lorentz equation and applied the solution to determine the radiation field and emission spectrum. To distinguish our procedure from that of Weatherall, used to compute the spectrum in Figure 4a, while at the same time, acknowledging that we “borrowed” the Weatherall source in (1), we refer to this hybrid as the BORW model.
The BORW emission spectrum is represented in Figure 4b for a parameter choice a 0 = 40 and n e/n c = 167. Like the spectrum in Figure 4a, this too shows not only strong emission at ωp but also a clear cut-off, at m* ~ 300, while across the frequency range ωp/ωL ≲ m ≲ m* the spectrum is well fitted by a power-law decay with p = 5/3. Notwithstanding the similarity between the spectra in Figure 4, other than the emission peak at the plasma frequency, the two are quite distinct in their spectral detail. As already pointed out, the 5/3 decay seen in Figure 4a is an artifact of the assumption made about the fluctuation spectrum of beam electrons in Weatherall's model, whereas that in Figure 4b is intrinsic in the BORW model and correlates with the spectral decay observed in our PIC experiments.
4. EMISSION SPECTRA FROM BORW MODEL
Figure 5 shows a comparison of output from the BORW model and a PIC simulation for a particular choice of laser–plasma parameters, a 0 = 60, n e0/n c = 95, that is, S = 1.6, so that according to the scaling in Figure 2 we might expect a spectrum with decay p = 5/3. As it happens, our choice of parameters was prompted by the fact that this particular spectrum had been considered independently by an der Brügge and Pukhov (an der Brügge & Pukhov, Reference An Der Brügge and Pukhov2010), in support of their claim that this spectrum derived from a synchrotron source. In the present context, this spectrum provided a ready-made comparison for our own spectrum, shown in Figure 5a. The two spectra match closely, both in decay constant p = 5/3 and with a cut-off at m* = 110 followed by a range over which spectral intensities decay as p = 4. Moreover, by applying details of the Langmuir field measured from our simulation in Figure 5a, to determine the Weatherall source (1), we then computed the BORW emission spectrum, reproduced in Figure 5b. The agreement between the two spectra is generally satisfactory, given the limitations of the BORW model.
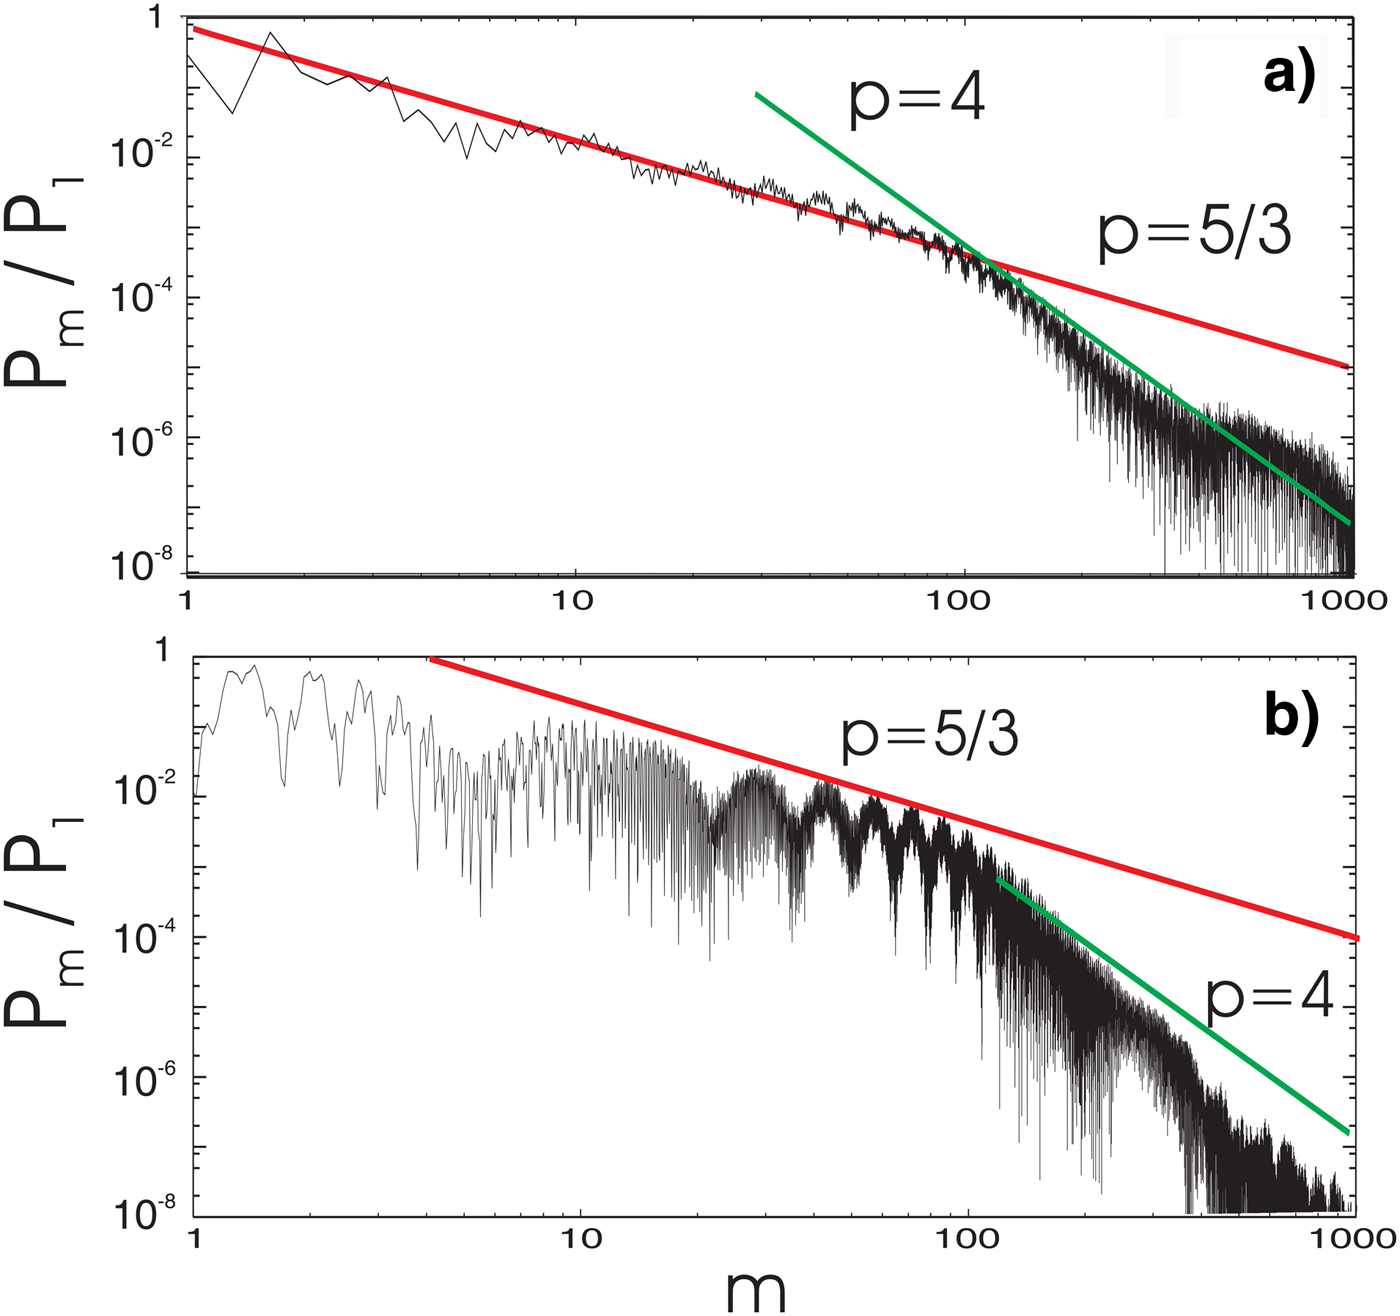
Fig. 5. PIC (a) and BORW model (b) for a 0 = 60 and n e/n c = 95 showing the transition from a region characterized by p = 5/3 decay to one, where p = 4.
A second comparison is shown in Figure 6 for the combination of parameters, a 0 = 50, n e0/n c = 100, such that S = 2; t p = 10 fs. The PIC spectrum for this choice, Figure 6a, shows some difference from that in Figure 5. Now spectral decay governed by a p = 4/3 decay coefficient extends only to a cut-off m* = 30, before a region of steep p = 4 decay, akin to that found in Figure 4. At frequencies m ≳ 100 there is a further transition, though one not well characterized by a unique decay coefficient. Interestingly, the BORW spectrum shown in Figure 6b, likewise exhibits three more or less distinct regions: the zone governed by p = 4/3 decay here extends as in Figure 5 to a m*~100 cut-off before a p = 4 transition zone. This in turn is truncated in a sharp reversal to a region of spectrum characterized by p = 2/3 across 200 ≲ m ≲ 600. With the hindsight afforded by the BORW spectrum, one might identify the high-frequency region in the PIC spectrum with this new feature, with a decay constant lower by far than any observed hitherto.

Fig. 6. (a) PIC and (b) BORW harmonic spectra for a 0 = 50 and n e/n c = 100. The spectra show harmonic transition decays from p = 4/3 to 2/3.
From PIC output we found that p = 2/3 decays corresponded to the most ultra-relativistic interactions within our range, showing the highest Langmuir electric fields. In Figure 7, we present a correlation between the Langmuir fields excited over an ensemble of interactions and the power decay indices found in the corresponding spectra. It was found that the highest Langmuir fields for plasma emission corresponded to the lowest 2/3 indices, and that the plasma emission amplitudes decreased as the spectral decay index approached the value 8/3.

Fig. 7. Correlation between the Langmuir field E Lang and the spectral decay index p.
5. SUMMARY
A particle model has been applied to determine the radiation spectrum from a target plasma irradiated by high-intensity laser light. This model is hybrid in the sense that PIC output has been used to characterize the Langmuir electric field source in the relativistic Lorentz equation. For a wide range of combinations of the key parameters that characterize the interaction, n e0/n c and a 0, chosen, so that the similarity index S lies in the range 1 ≲ S ≲ 5, we found that over a significant frequency range, the spectral power decay index was typically p = 5/3, rising to p = 4/3 at higher intensities.
Moreover, at the highest intensities considered, there were clear indications that bremsstrahlung from the UR Brunel electrons was contributing to the spectrum, indicated by a spectral region with decay constant p = 2/3. To date there has been no experimental evidence from UR laser–plasma interactions, for either spectral decay with p = 5/3, 4/3, or p = 2/3 despite some pointers from relativistic electron beam devices and from galactic emission spectra (Weatherall & Benford, Reference Weatherall and Benford1991; Fleishman & Toptygin, Reference Fleishman and Toptygin2008). With predictions from the model described in this work supporting our earlier reports of p = 5/3 and 4/3 decays, this seems an opportune moment to appeal to experimentalists to test our predictions by looking for the effects on the spectrum presented in this contribution to ECLIM 33.
ACKNOWLEDGMENT
The authors acknowledge support from CONACyT under contract no. 167185.


