


1. INTRODUCTION
The Richtmyer–Meshkov instability (RMI) (Richtmyer, Reference Richtmyer1960; Meshkov, Reference Meshkov1969) occurs for the impulsive acceleration of either the light fluid into the heavy one, or vice versa. Growth of spikes and bubbles and subsequent mixing arise when a shock passes through an interface between two fluids (Wouchuk & Nishihara, Reference Wouchuk and Nishihara1996; Zabusky, Reference Zabusky1999). The light fluid (ρL) is accelerated impulsively into the heavy one (ρH) causing baroclinic vorticity deposition. In the presence of the re-shock, additional vorticity is deposited during its interaction with the evolving interface (Yang et al., Reference Yang, Zabusky and Chern1990; Brouilette & Sturtevant, Reference Brouilette and Sturtevant1994; Balakumar et al., Reference Balakumar, Orlicz, Tomkins and Prestridge2008; Probyn & Thornber, Reference Probyn and Thornber2013). Lugomer, Reference Lugomer2016. With the passage of a shock front, the interface begins to decelerate after shock refraction. Since the pressure decreases monotonically with distance behind the shock front, the reversal of pressure and of density gradients occurs from the heavy into the light fluid. Such a condition at the interface causes the Rayleigh–Taylor instability (RTI) (Miles et al., Reference Miles, Blue, Edwards, Greenough, Hansen, Robey, Drake, Kuranz and Leibrandt2005). Under the influence of the RMI/RTI, interface perturbations grow into spikes of heavy-fluid into light-fluid and bubbles of light-fluid into heavy-fluid. Development of shear along the growing spikes causes the Kelvin–Helmholtz (KH) instability and formation of mushroom-shape spikes (Miles et al., Reference Miles, Blue, Edwards, Greenough, Hansen, Robey, Drake, Kuranz and Leibrandt2005; Lugomer, Reference Lugomer2017).
The evolution of three-dimensional (3D) RMI and RTI on metal surface induced by the laser beam of Gaussian-like power profile in the semiconfined configuration (SCC) is of special interest and reveals some new characteristics (Lugomer, Reference Lugomer2016, Reference Lugomer2017). The nanosecond laser pulse causes plasma detonation and the shock wave that strikes the interface of the vapor/plasma plume [light fluid (ρL)] and the molten metal layer [heavy fluid (ρH)], with baroclinic vorticity deposition and the RMI evolution. The initial multimodal perturbation of the interface determines the amplitude and the wavelength of growing spikes and bubbles. The anisotropic flow and growth of spikes and bubbles depends on the momentum, M , transferred to the fluid parcel and on the fluid density ratio expressed by the Atwood number, A = (ρH – ρL)/(ρH + ρL) (Lugomer, Reference Lugomer2016, Reference Lugomer2017). Due to Gaussian power profile the A number laterally decreases from the central region (CR) to the near central region (NCR) and to the near periphery region (NPR) coinciding with decrease of the momentum transfer M to the density interface, and reveals many new RMI/RTI characteristics, which offer a new insight into these phenomena. Previous studies have shown the evolution of the new wave–vortex paradigm in the CR and NCR of Gaussian-like spot (Lugomer, Reference Lugomer2016, Reference Lugomer2017).
The RMI morphology in the CR resembles the irregular “egg-carton” web with cavities of collapsed bubbles surrounded by irregular “walls” formed at A ~ 1–0.85, M ~ M max (Lugomer, Reference Lugomer2016). Formed as the crests of a heavy fluid around the bubbles, the “walls” are developed during non-linear growth when the instability amplitude becomes comparable with the perturbation wavelength λ (Srebro et al., Reference Srebro, Elbaz, Sadot, Arazi and Shvarts2003; Reckinger, Reference Reckinger2006). The connected walls form irregular web in a random flow field, while in the coherent one form a quasi-periodic polygonal or the rosette-like web. The RMI jet-spikes formed at the nodal points of a web are broken up into nanodroplets similar to that observed in the simulation (Statsenko et al., Reference Statsenko, Sin'kova and Yanilkin2006, Reference Statsenko, Yanilkin, Sin'kova and Toporova2014). Thus, dominant characteristic is – the absence of the mushroom shape spikes – and presence of their remnants slightly higher than the rest of the surface.
The morphology in the NCR formed at A ~ 0.85–0.65, M ~ (0.70–0.60). M max is different from the CR (Lugomer, Reference Lugomer2017) because the RMI is followed by the reversal of pressure and density gradients with onset of the RTI (Miles et al., Reference Miles, Blue, Edwards, Greenough, Hansen, Robey, Drake, Kuranz and Leibrandt2005; Suponitsky et al., Reference Suponitsky, Froese and Barsky2013, Reference Suponitsky, Barsky and Froese2014).The interface perturbations grow into spikes of heavy-fluid into light-fluid and bubbles of light-fluid into heavy-fluid. The density interface of NCR is transformed into the large-scale irregular quasi-periodic web – which in contrast to the CR – comprises the large mushroom-shape spikes. Dynamics in the vertical direction differs dramatically from that in the horizontal (normal) plane, and can be regular (periodic) or quasi-periodic, or disordered (Abarzhi & Hermann, Reference Abarzhi and Hermann2003; Abarzhi, Reference Abarzhi2008; Abarzhi, private communication).
In this paper, we consider the NPR morphology of RMI/RTI structures formed at A ~ 0.60 < 0.2, M ~ (0.50 ≤ 0.2). M max evolves due to the shock and fast reshocks. Morphology evolves into quasi-periodic web with cavities surrounded by irregular “walls”– and with large and small spherical mushroom-shape spikes on disordered two-dimensional (2D) lattice. Disorder is associated with the reshocks, which become oblique and randomly oriented increasing the inhomogeneity of the fluid flow field with deformation of the web structure. In such environment, the organization of mushroom spikes on 2D lattice is different in the domains at various distances from the center of the spot. Intuitively, the new characteristics like dependence of diameter of large and small mushroom spikes with radial distance, as well as dependence of the growth rate on the interface shape (i.e., on the large and small wavelength modes) can be expected. Since the surface corrugations are inhomogeneous, the perturbation modes may be assumed grouped into narrow bands of short and large wavelength modes with different effect on the growth rate.
The basic question is, whether characteristics of RMI/RTI morphology like for example, the growth rates and formation of large and small mushroom spikes, can be explained by a model that would be able to predict the formation of both, the small and the large mushroom spikes on 2D lattice and, and their simultaneous evolution in the subdomains at various distance from the center of the spot. Therefore, the comparison of the experimental results with prediction of empirical multiparameter models and also with prediction of the more fundamental model based on the first principles, will be performed.
The empirical models of the RMI based on the evolution of the multimodal perturbation occurring after the shock and reshocks (Mikelian, Reference Mikelian1989; Leinov et al., Reference Leinov, Malamud, Elbaz, Levin, Ben-Dor, Shvarts and Sadot2009; Ukai et al., Reference Ukai, Balakrishnan and Menon2011), indicate the spike growth rate dependence on the distance the reshock travels in order to reach the interface, and on the interface shape at the moment of its arrival. Levinov et al., have shown that reshock arrival to the interface during the linear growth (before the arrival of the reflected rarefaction wave), will cause the fast linear growth. The reshock arrival during slower, non-linear growth (before the arrival of the reflected rarefaction wave), will progressively decay and the spikes will be small (Leinov et al., Reference Leinov, Malamud, Elbaz, Levin, Ben-Dor, Shvarts and Sadot2009). As shown latter, these models although explain some of the observed phenomena depend on adjustable parameters and suffer from many shortcomings.
The model of the RMI evolution from the first principles with interference of initial perturbation modes (without reshock) was recently proposed by Abarzhi and co-workers (Pandian et al., Reference Pandian, Stellingwerf and Abarzhi2017; Stellingwerf et al., Reference Stellingwerf, Pandian and Abarzhi2016a , Reference Stellingwerf, Pandian and Abarzhi b ). Based on the group theory analysis and the smooth particle hydrodynamics (SPH) simulation their model shows simultaneous evolution of large and small mushroom-shape RMI spikes on 1D lattice resulting from interference of initial perturbation modes. In contrast to usual studies based only on the amplitude of perturbation modes, their model takes into account the amplitude, relative phase, and the symmetry of the wave vectors on the reciprocal lattice, with various A number values (Pandian et al., Reference Pandian, Stellingwerf and Abarzhi2017; Stellingwerf et al., Reference Stellingwerf, Pandian and Abarzhi2016a , Reference Stellingwerf, Pandian and Abarzhi b ). The results obtained by superposition of perturbation waves on 1D lattices with random phase, in-phase, and anti-phase offer more promising (successful) comparison with the experimental ones.
Discussion of the non-linear phase of the RMI evolution with the large-scale coherent structures chaotically arranged as the “late time structures” and the absence of the stochastic small-scale turbulence mixing (Lugomer, Reference Lugomer2016, Reference Lugomer2017), is presented.
The paper is organized as follows: INTRODUCTION; OUTLINES OF THE EXPERIMENT – Expansion of metal vapor–plasma spheroid along the SCC microchannel in the ambient gas; RESULTS AND DISCUSSION – Quasi-periodic, chaotic, or broken web; Spherical mushroom spikes; ORGANIZATION OF MUSHROOM SPIKES – Lattice organization of large and small mushroom spikes; Off-lattice random organization of very-large and very-small mushroom spikes; Characteristics of mushroom diameter distribution across the NPR; Representation of mushroom diameter by orbit in phase space; GROWTH RATE OF SMALL AND LARGE MUSHROOM SPIKES – Dependence of the growth rate on the distance the reshock has to travel; Dependence of the growth rate on the interface shape; Multiscale mushroom spike evolution caused by the interference of perturbation modes: Non-linear dynamics of RM flow; Characteristics of the low-mixing structures in the base-plane; and CONCLUSION.
2. OUTLINES OF THE EXPERIMENT
The experiments were performed in the SCC in which the target is irradiated through transparent quartz plate positioned at Δ ~ 120 µm above the target surface (Lugomer, Reference Lugomer2016, Reference Lugomer2017). Irradiation was performed by a single pulse of a Q-switched ruby laser E ~ 160 mJ (E s ~ 12 J/cm2; P s ~ 0.48 × 10⁹ W/cm2 (~0.5 GW/cm2); τ = 25 ns, λ = 628–693 nm). Indium plates of 1 cm × 1 cm × 0.1 cm, as a soft material with the melting point T M = 429 K and boiling point T B = 2345 K, were used as targets. Schematic representation of the experiment is given in the papers I and II (Lugomer, Reference Lugomer2016, Reference Lugomer2017). The sample was situated in the gas chamber and irradiated in the presence of air as a background gas at the pressure P 0 = 1 atm, and the area irradiated was S = 0.013 cm2. The target surface was prepared by making small and the large-scale random corrugations (scratches) with the scratch–scratch distance, d large scratch ~ 10–60 µm and the amplitude a 0 ~ 10–20 µm. Multimodal perturbation of density interface consisted of a random combination of incomensurate short- and long-wavelength modes.
Absorption of laser energy causes plasma ignition and detonation with generation of a shock wave in the SCC microchannel. The shock wave traveling downward strikes the ρL/ρH interface causing deposition of baroclinic vorticity (Fig. 1a–d and description in the Supplement of the paper I). The shock wave traveling upward is reflected from the cover plate. The reflected shock wave as (from the cover plate or the target surface), as well as the lateral plume expansion in the ambient gas is called reshock [Figs 1e–h of the paper I (Lugomer, Reference Lugomer2016)].

Fig. 1. SEM micrograph of the spot on indium surface after irradiation by Gaussian-like pulse of a ruby laser in the SCC with excerpt of the central region (CR), near central region (NCR), and the near periphery region (NPR). The NPR morphology (outer ring) is better seen in the magnified excerpt from the spot.
2.1. Expansion of Vapor–Plasma Spheroid along the SCC Microchannel in the Ambient Gas
Radial plasma expansion causes the compression of surrounding background gas (air) and formation of the air shell (Ma et al., Reference Ma, Motto-Ros, Boueri, Bai, Zheng, Zheng and Yu2010). Compression increases the ion number density in the radial direction causing minimum in the center of its distribution. The initial density which becomes very low in the CR, increases to the NCR and continues to increase to the NPR, ρL(CR) < ρL(NCR) < ρL(NPR). Since the density of a heavy fluid is the same in all regions ρH(CR) = ρH(NCR) = ρH(NPR), the Atwood number decreases across the spot below the Gaussian power profile in the radial direction from A(CR) > A(NCR) > A(NPR).
The evolution of mushroom spikes and the base-plane structures forms the morphology, which stays frozen permanently by the fast solidification after termination of interaction making possible a posteriori study by the scanning electron microscope (SEM) JEOL.
3. RESULTS AND DISCUSSION
3.1. Quasi-Periodic, Chaotic, or Broken Web
Gaussian-like spot with the excerpt of the CR, the NCR, and the NPR is shown in Figure 2. Morphological structure reveals broken “egg-cartoon” web with cavities – formed by one or more bubbles – surrounded by irregular “walls”. Figure 2. The “walls” are the crests of a heavy fluid around the bubbles, or around a bubble cluster, or the – “curtains between the bubbles” – developed during non-linear growth when the instability amplitude is of the order of λ (Reckinger, Reference Reckinger2006). The “walls” connected into the quasi-periodic web comprise deformed cells (bubble/cavities) with the “wavelength”, λ from ~40 to ~60 µm, which may be attributed to the long-wavelength surface perturbation by corrugation, d scratch ~ 40–60 µm (Lugomer, Reference Lugomer2016). Such structures may be attributed to the characteristic momentum transfer, M , which decreases across the NPR (0.6 M max ≳ M ≲ 0.2 M max), and to the decrease of the A number (0.60 A ≳ 0.2) due to lateral vapor expansion along the SCC microchannel, which causes increase of the density of the low-density fluid ρL (Lugomer, Reference Lugomer2016).

Fig. 2. SEM micrograph of RMI/RTI morphology typical for NPR. Dominant structure is irregular polygonal web which does not show mushroom shape spikes at the nodal points (domain D 0). SEM analysis reveals inside D 0 the subdomains D 1 and D 2 (at the same distance from the center of the spot), which comprise many small and large spherical mushroom spikes on disordered 2D lattice, as well as the subdomain D 3 with off-lattice very-large mushroom spikes.
Quasi-periodic web may be compared with 3D numerically simulated large-scale periodic RMI structures generated by both, the single-mode (Miles et al., Reference Miles, Blue, Edwards, Greenough, Hansen, Robey, Drake, Kuranz and Leibrandt2005; Long et al., Reference Long, Krivets, Greenough and Jacobs2009) and the multimode perturbations (Cohen et al., Reference Cohen, Dennevik, Dimits, Eliason, Mirin, Zhou, Porter and Woodward2002; Kartoon et al., Reference Kartoon, Oron, Arazi and Shvartz2003). A large periodic structure (for the shock tube experiment) is obtained for the vertical interface oscillation in a square cell due to the single-mode 3D perturbation
 $$z(x,y) = a_0{\rm cos}(k_xx){\rm cos}(k_yy),$$
where a 0 = 3.45 mm, k x = k y = √2 π/W, and W = width of the test section, for the weak shock of Ma = 1.22, and the low Atwood number A = 0.65 (Long et al., Reference Long, Krivets, Greenough and Jacobs2009).
Transformation of regular periodic web into deformed, quasi-periodic or chaotic, or even into broken one is caused by the bubble shape oscillations driven by the fast oscillatory reshocks (ν ~ 7–8 MHz), and to the effect of the reshocks on the fluid shear layer (Lugomer, Reference Lugomer2016). High-frequency field of re-shocks generates the pressure gradient, which couples with the bubble oscillations (volume pulsations) and vorticity generation in the ultrasonic field (Leighton et al., Reference Leighton, Walton and Pickworth1990). When the reshock strikes the density interface as rarefaction wave, the molten indium is subjected to tension, which causes it to cavitate (Suponitsky et al., Reference Suponitsky, Froese and Barsky2013; Lugomer, Reference Lugomer2016). Pressure pulsations take place in the mixing zone owing the vortex character of mixing and the pressure field, which is irregular in vortices (Suponitsky et al., Reference Suponitsky, Froese and Barsky2013). Irregularity of the pressure field causes distortion of the shock wave front and of the RMI surface morphology. Forcing of the oscillating pressure field on the bubbles of different size causes bubble dynamics, which generates waves with irregular front in the surrounding fluid. The waves solidified in the fast cooling process make the irregular “walls” of variable shape and size (around the bubbles). Connected into quasi-periodic or even chaotic web of broken “egg-cartoon” morphology, they are characteristic for random (incoherent) flow field (Lugomer, Reference Lugomer2016).
RMI mushroom spikes do not appear at the nodal points of a web, but mostly hillock-like humps with the exception of some (random) nodal points. Large incoherent flow field does not show evolution of coherent flow domains with polygonal or the rosette-like web as in the CR and NCR (Lugomer, Reference Lugomer2016, Reference Lugomer2017). SEM analysis reveals that such large irregular and chaotic or broken web without mushroom spikes (denoted domain D 0) – comprises few subdomains ( D 1, D 2, and D 3) with large and small RMI mushroom spikes. Figure 2. For the obvious reasons we shall not consider domain D 0 but only subdomains D 1, D 2, and D 3, which comprise the spherical mushroom spikes organized on disordered 2D lattice.
3.2. Spherical Shape of Mushroom Spikes
Formed at the nodal points of a web the spherical RMI mushroom spikes are similar to that in the NCR (Lugomer, Reference Lugomer2017), and to that obtained by 3D numerical simulation for the single-mode perturbation (Anuchina et al., Reference Anuchina, Volkov, Gordeychuk, Es'kov, Ilyutina and Kozyrev2004). Similarity with spherical spikes generated by the single-mode perturbation indicates that in the multimodal perturbation not all modes are equally active; only a narrow band of modes (concentrated around one central wavelength mode) acts as the single-mode perturbation. Absence of the elongated prolate, or damped spikes (lack of the shape variation of the mushroom spikes) relates to the specific values of the A number, but also of the Eõtvõs number, Eo, and the Morton number Mo (Lugomer, Reference Lugomer2017). Bubble can be characterized by the Morton number Mo = gμ l 4/ρ l σ3, by the Eõtvõs number, Eo = ρ l gd l 2/σ , as well as by density (ρ l /ρ b ) and viscosity (μ l /μ b ) ratios, where d l is the effective radius of the bubble, index, l, relates to liquid and, b, to the bubble (gas) (Unverdi and Trygvason, Reference Unverdi and Trygvason1992). Morton number involves the fluid properties only, and the Eõtvõs number is the non-dimensional size of the bubble. The analysis of the mushroom shapes (Lugomer, Reference Lugomer2017), indicates that the spherical shape in D 1. D 2, and D 3 may be characterized by Eo ≳ 102 and Mo ~ 102.
4. ORGANIZATION OF THE MUSHROOM SPIKES
Expansion of laterally accelerated shear layer with the velocity u ~ 1650 m/s (the sonic velocity in liquid indium), is associated with variation of thickness and velocity due to reshocks (Lugomer, Reference Lugomer2017). The reshocks become oblique and randomly oriented (due to irregularity of the interface), increasing the inhomogeneity of the fluid flow field. This not only causes quasi-periodicity or chaos of the web structure, but also disturbs the organization of spikes in various subdomains of the NPR. The subdomains D 1 and D 2, show organization of spikes on disordered 2D lattices, while D 3 shows very-large off-lattice mushroom spikes (Fig. 2).
4.1. Lattice Organization of Large and Small Mushroom Spikes
Regarding the mushroom spike organization in D 1, the SEM micrograph shows irregular (chaotic) web of the base-plane structures and the large and small mushroom spikes with the particle number density of ρN ~ 5 × 10⁴/cm2 (Fig. 3). Neglecting the base-plane structures, the mushroom spikes reveal 2D disturbed lattice organization. Reconstruction of regular lattice from Figure 3 starts with conformal mapping of small (blue) and large (red) mushroom spikes (Fig. 4a). The rows of spikes coincide with uncorrelated (chaotic) wavy instabilities in the molten layer (background fluid) (Fig. 4b). Incoherent wavy motion of background fluid is the consequence of fast reshocks, which after series of reflections change the strength and direction of the wavy motion. By continuous deformation the wavy rows of mushroom spikes can gradually be transformed into the rectangular lattice (Fig. 4c) with the primitive cell size of, L y ~ 80–90 µm, and L x ~ 60–70 µm. By extending this arrangement to the whole plane, a pattern is obtained that belongs to the p 2 mm symmetry group with the translation vectors a 1 and a 2 (Fig. 4c), having lengths a 1 = L x ~ 60–70 µm, a 2 = L y ~ 80–90 µm. The repeating structural unit is made of one large and four adjacent small mushroom spikes. The diameter of the large mushroom spike is, D LM ~ 25 µm and of the small one, D SM ≲ 15 µm.
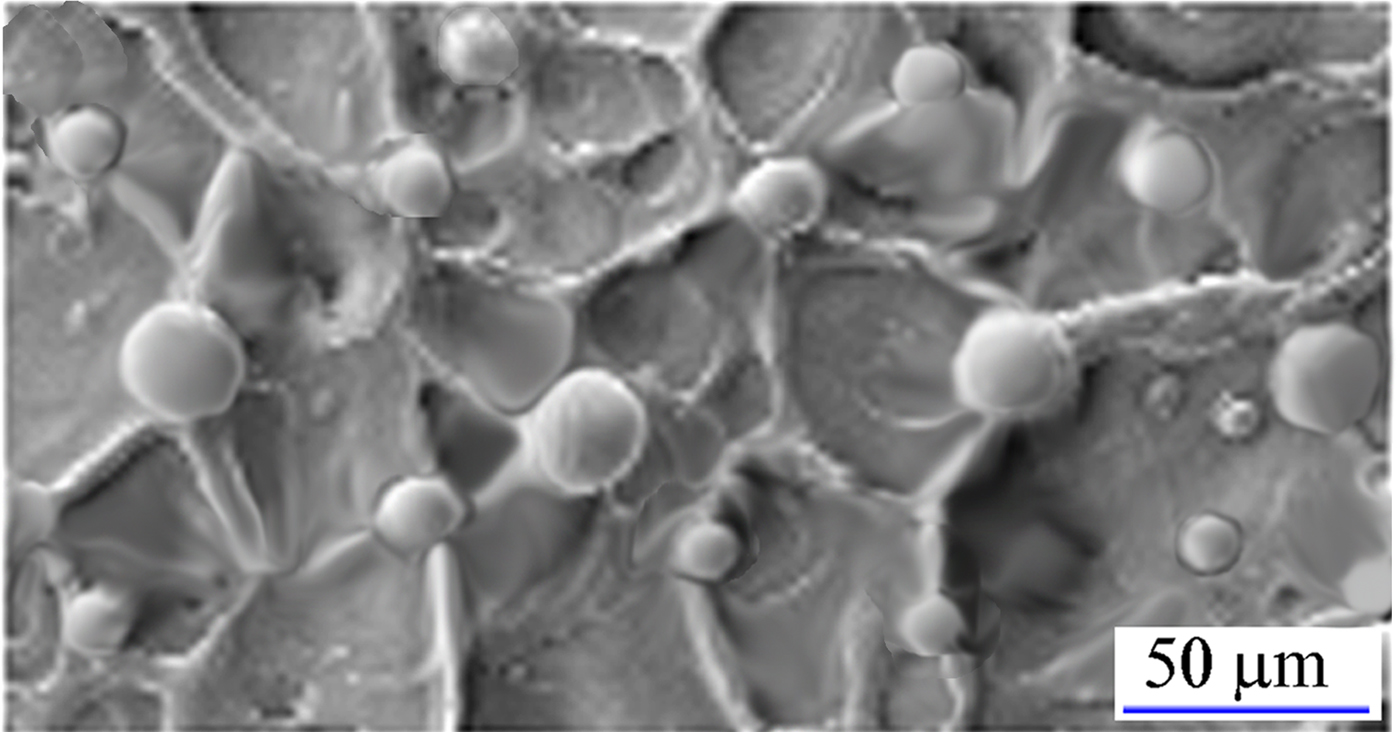
Fig. 3. SEM micrograph of subdomain D 1 (with small rendering) showing large and small spherical mushroom spikes formed at the nodal points of irregular web.

Fig. 4. Organization of small (blue) and large (red) mushroom spikes in the form of disordered lattice, and identification of the closest hypothetical 2D regular lattice to which the observed pattern might belong. (a) Map of the large and small mushroom spikes that corresponds to their organization in Figure 3. (b) Disordered organization of small and large mushroom spikes caused by the instability (wavy motion) of the surface molten layer. (c) Reconstruction of the mushroom spike organization on a 2D regular p 2 mm lattice. The basic cell is the rectangular configuration of four small spikes and one large spike at the center of inversion.
SEM micrograph of D 2 shows irregular (chaotic) web as the base-plane structure, and the large and small mushroom spikes on its nodal points with ρN ~ 3 × 10⁴/cm2 (Fig. 5a). The RMI spherical mushroom spikes on 2D disordered lattice are organized in two rows of large- and two rows of small spikes between them (Fig. 5a). The small spike is connected with the two nearest large mushroom ones under an angle of ~120° (Fig. 5b). The conformal map of disordered small and large mushroom spikes in Figure 6a reveals wavy rows, which coincide with uncorrelated (chaotic) wavy instability in the molten layer, as in the case above (Fig. 6b). Correction of the wavy rows reveals the lattice of p 2 mm symmetry group (Fig. 6c). The size of the rectangular (cell) L y ~ 110 µm, L x ~ 80 µm is equal to the translation vectors of the lattice a 1 and a 2, L x = a 1, (a 1 ~ 80 µm), and L y = a 2 (a 2 ~ 110 µm). The side of the rhombic cell is l ≥ 49 µm. The diameter of the large mushroom spike is D LM ≲ 40 µm and of the small one D SM ~ 10–15 µm.

Fig. 5. SEM micrograph showing (with small rendering) RMI structures in subdomain D 2. (a) Large and small spherical mushroom spikes formed at the nodal points of irregular web. (b) Enlarged segment from disordered lattice of spikes in Figure 5a.

Fig. 6. Organization of small (blue) and large (red) mushroom spikes on disordered lattice, and identification of 2D regular lattice. (a) Map of the large and small mushroom spikes that corresponds to their organization in Figure 5. (b) Disordered organization of small and large mushroom spikes caused by the instability (wavy motion) of the surface molten layer. (c) Reconstruction of the mushroom spike organization on 2D regular lattice. The basic cell is the rectangular configuration of four large spikes and four small ones which make the rhombic subcell.
4.2. Off-Lattice Random Organization of Very-Large and Very-Small Mushroom Spikes
SEM micrographs of subdomain D 3 (Fig. 7a and b) also show irregular (chaotic) and partially broken web and very-large mushroom spikes with ρN ~ 850/cm2 ~ 9 × 10²/cm2 – about three orders of magnitude lower than the number density of the spikes in Figures 3 and 5. These off-lattice spikes with the mushroom diameter, D LM ~ 55–100 µm, reach the height, h S ~ 120 µm, which is just equal to the distance of the cover plate from the target surface (Fig. 1 in the paper I, Lugomer Reference Lugomer2016). The top surface is flattened because the spikes touched the cover plate of the SCC; otherwise they could reach the height of ~140 µm. Similarity of the spherical shape with the spikes in the NCR (Lugomer, Reference Lugomer2017) indicates the A number value of A ≤ 0.65. The ratio of the spike and bubble amplitude, h s/h b ~ 10–15, which is possibly the highest ratio observed in the laser experiments.

Fig. 7. SEM micrograph of RMI/RTI structures in subdomain D 3 showing irregular web structure in the base-plane and very-large spherical mushroom spikes. The top surface was flattened when the spherical mushroom spike reached the quartz cover plate that has stopped its growth. (a) SEM micrograph of two giant mushroom spikes with flattened top surface of diameter D VLM ~ 80 µm at the distance of L ≳ 150 µm. There are no small spikes in the vicinity, but only a small dots, which possibly are a very-small mushroom spikes. The base-plane structures of destroyed web are chaotically organized solitary waves and vortex filaments characteristic for the shallow fluid layer. (b) SEM micrograph of one very-large mushroom spike of diameter D VLM ~ 70 µm, of the height (amplitude) of, h S ~ 120 µm, which is just the height of the SCC channel. The growth rate of this spike is about 10–15 times faster than the growth rate of bubbles. The structures in the base-plane are disturbed and chaotically organized large-scale line-solitons or irregular ribbons, but transition to the small-scale turbulent structures does not appear.
The SEM analysis reveals no small spikes as in Figures 3 and 5, but only small random dots on the walls of the web; we assume them as very-small mushroom spikes. With the size between nano- and micro-scales they are one order of magnitude smaller than the small spikes in Figures 3 and 5. In some domains they can be hardly seen (Fig. 7a), while in other domains cannot be seen at all (Fig. 7b).
Regarding the bubble-cavities, two types can be seen: large flat bubble-cavities and the small curved ones. Since the curvature of the bubble depends on the density ratio and on the acceleration strength, the non-linear RMI bubbles are flattened for weak pressure fluctuations, and are curved for the strong pressure fluctuations (oscillations) of a series of fast reshocks in the SCC. Obviously, various local domains experience the reshocks-induced pressure variation strength (Bromwick & Abarzhi, Reference Bromwick and Abarzhi2016).
4.3. Characteristics of Mushroom Diameter Distribution across the NPR
The question is whether the size (diameter, D) of the large and small spikes in D 1,2,3 have some correlation with the distance from the center the reshok(s) travels to reach the interface in particular subdomain as schematically shown in Figure 8a? Distribution of the mushroom spike diameter, D(μm) as function of radial distance from the center, r(μm), with distances of D 1, D 2, and D 3 from the center of the spot are shown on the same radial axis (Fig. 8b). A monodispersed distribution of the mushroom diameters with the average size 〈D〉 ~ 25 µm in the NCR extends up to r ~ 450 µm, but at r ~ 460 µm NPR becomes spitted into a band of small-diameter spikes, D SM, into a band of large-diameter ones, D LM, while the third branch with mushroom diameters 〈D〉 ~ 25 µm, similar to that in the NCR continues from the NCR into NPR (Fig. 8b). Average diameter 〈D〉 ~ 25 µm in both subdomains D 1 and D 2 intermittently increases (jumps) to 〈D LM〉 ~ 35 µm (large diameter ones), while other branch intermittently decreases (jumps) to 〈D SM〉 ~ 14 µm. Beyond r > 650 µm (subdomain D 3), a new dramatic change occurs: the large spikes with 〈D LM〉 ~ 35 µm intermittently increase to the very-large mushroom spikes 〈D VLM〉 ~ 90 µm; the small ones with 〈D SM〉 ~ 14 µm, intermittently decrease to the very-small mushroom spikes with 〈D VSM〉 ≲ 4 µm. For r > 770 µm (at the border of the PR), the RMI mushroom spikes vanish.

Fig. 8. Size distribution of mushroom spikes in various domains of the NPR. (a) Segment of the NPR corresponding to Figure 2, shows location of subdomains D 1, D 2, and D 3. Domain D 0 (which does not comprise mushroom spikes but only the irregular web) is not limited to some area segment of the NPR, but relates to the whole NPR between the radial distance r 1 and r 4. Subdomains D 1 and D 2 are in the same angular segment between the radial distance r 1 and r 2, while D 3 is in more distant radial segment between r 3 and r 4. (b) Distribution diagram of the mushroom diameter D as function of radial distance, r, from the center of the spot (and the origin of the shock wave). Note that distribution in the NCR (r < 450 µm) shows unique mushroom diameter, of the average size, 〈D〉 ~ 25 µm. However, between r 1 ~ 460 µm and r 2 ~ 650 µm (subdomains D 1 and D 2), the size distribution shows splitting into branch of the large mushroom diameter, 〈D LM〉 ~ 35 µm, into branch of small mushroom diameter, 〈D SM〉 ~ 14 µm, and into the third branch which continues from the NCR with 〈D〉 ~ 25 µm. For the subdomain D 3 between r 3 ~ 650 µm and r 4 ~ 760 µm, the size distribution shows strong divergence; the large spikes become very-large spikes 〈D VLM〉 ~ 90 µm and the small ones become very-small mushroom spikes reaching average diameter 〈D VSM〉 ≲ 4 µm.
4.4. Representation of Mushroom Diameter by Orbit in Phase Space
More detailed insight into the dynamical evolution of small and large spikes can be obtained if the mushroom diameters are represented by orbits or stable periods. Namely, the vortex structure and fluid circulation on the spike, which form the mushroom shape (Anuchina et al., Reference Anuchina, Volkov, Gordeychuk, Es'kov, Ilyutina and Kozyrev2004), correspond to the stable periods in the phase space. For the representation in 2D phase space, we denote the constant mushroom diameter in the NCR by the black circular orbit (stable circulation or constant oscillating frequency), which is the unique one for all mushroom spikes and not dependent on distance from the center (Fig. 9). In the NPR, the appearance of stable periodic orbits (the limit cycles) or their disappearance in a dynamical system indicates the Hopf bifurcation, described by the system of equations (Craford, Reference Craford1991; Bressan, Reference Bressan2014)
 $$dx/dt = mx + y + x^{\rm 3},$$
 $$dy/dt = - x + my + y^{{\rm 3}}.$$

Fig. 9. Phase diagram of the “mixing and merging cycles” of spikes based on the diagram of the mushroom size distribution, D versus r, in Figure 8b. Mushroom spike diameter is represented by the orbit of certain radius or stable periods in 2D phase space. For the representation in phase space, we denote the constant mushroom diameter, 〈D〉, which continues from the NCR into NPR by the black periodic orbit P (stable circulation or constant oscillating frequency), which is the unique one for all mushroom spikes and not dependent on distance from the center. In the NPR, the small mushroom diameters 〈D SM〉 and 〈D VSM〉 are represented by the stable periods P 1 and P 2 (blue orbits) smaller than the period P. The large mushroom diameters 〈D LM〉 and 〈D VLM〉 are represented by the stable periods P 1′ and P 2′ (red orbits) larger than the period P. Note that P 1, P 2, P 1′, and P 2′ are the stable periods, while all other periods (between them) are unstable. Behavior of the unstable cycles resembles the kicked oscillator which is pushed from the stable oscillation into the unstable one until it falls into the stable period again. Thus, the periods represent the limit cycles of the Hopf bifurcation which depends on some dynamic parameter μ (see text). The unstable red spiral orbits change into larger and larger stable ones indicating supercritical Hopf bifurcation. The unstable blue spiral orbits change into smaller and smaller stable ones until finally vanish indicating subcritical Hopf bifurcation.
For μ < 0, the origin is a stable point, and yields of an unstable periodic orbit; bifurcation is subcritical. For μ > 0 the origin is unstable spiral and yields of a stable periodic orbit(s): bifurcation is supercritical (Bressan, Reference Bressan2014). Tentatively, the parameter μ can be defined as difference of the growth rates in the NPR, dh/dt (NPR) and in the NCR, dh/dt (NCR), μ = dh/dt (NPR) – dh/dt (NCR). Considering the phase portrait of dynamics in Figure 9, the red circles (orbits) at the outer side of the black one correspond to increase of the mushroom diameter with distance and tendency to stable orbits, indicating the supercritical Hopf bifurcation (Bressan, Reference Bressan2014), with μ > 0. The blue circles (orbits) at the inner side of the black orbit indicate decrease of the mushroom diameter with distance and tendency to the point in the center (with disappearance of orbits), indicating the subcritical Hopf bifurcation with μ < 0 (Fig. 9). Thus, simultaneous growth of large and small spikes – analogous to the rapid and slow growth rates – which shows divergence with distance may be represented by the supercritical and subcritical Hopf bifurcations.
5. GROWTH RATE OF SMALL AND LARGE MUSHROOM SPIKES
The growth rates of small and large mushroom spikes and dependence on distance cannot be considered on the basis of single-parameter RMI models depending only on the initial amplitude a 0 (Alon et al., Reference Alon, Ofer and Shvarts1996; Shvarts et al., Reference Shvarts, Sadot, Oron, Kishony, Srebro, Rikanati, Kartoon, Yedvab, Elbaz, Yosef-Hai, Alon, Levin, Sarid, Arazi and Ben-Dor2001), which we used for the analysis of the spike growth in the CR (Lugomer, Reference Lugomer2016) and NCR (Lugomer, Reference Lugomer2017). More complex multiparameter models which consider the problem from the empirical point of view (Mikelian, Reference Mikelian1989; Leinov et al., Reference Leinov, Malamud, Elbaz, Levin, Ben-Dor, Shvarts and Sadot2009; Ukai et al., Reference Ukai, Balakrishnan and Menon2011) are more appropriate as the first approach. These empirical models assume dependence of the growth rate of multimodal RMI on the reshock, and in this respect on the distance the reshock travels to strike the interface, as well as on the interface shape in the moment it arrives.
5.1. Dependence of the Growth Rate on the Distance the Reshock Has to Travel
Strong divergence of spitted distribution of mushroom diameters with r (Fig. 8b) indicates that the distance of particular subdomain D i = 1,2,3, affects the growth rate. In addition, the fact that some spikes grow at small growth rate and others at the high rate, indicates that initial random multimodal perturbation does not affect the growth of all spikes in the same way. Since random surface corrugations are inhomogeneous, the small and large perturbation modes are grouped into narrow band of modes; the band of short-wavelength modes between λ ~ 10–30 µm, and the band of the large wavelength ones between λ ~ 40–60 µm. The short-wavelength band is concentrated around the central mode of, λshort ~ 20 µm and the large wavelength one around λlarge ~ 50 µm with the corresponding amplitude of, a 0short ~ 10 µm and a 0large ~ 20–25 µm. Since the distances of the subdomains from the center [and of the shock wave origin, r(D 1) = r(D 2) < r(D 3)], the reshock(s) strike the subdomains D 1 and D 2 in the same time – before the subdomain D 3.
Leinov et al., have shown dependence of post reshock(s) growth rates on distance and the corresponding times the reshock needs to reach the interface (Leinov et al., Reference Leinov, Malamud, Elbaz, Levin, Ben-Dor, Shvarts and Sadot2009). Neglecting the perturbation amplitude of the interface, the reshock strength was found to be a dominant parameter; the evolution of the interface after passage of the reshock is influenced dramatically (Leinov et al., Reference Leinov, Malamud, Elbaz, Levin, Ben-Dor, Shvarts and Sadot2009). If the reshock strikes the interface during the linear growth before the arrival of the reflected rarefaction wave, the post-reshock growth will continue to be the fast liner growth. The linear growth rate which is the result of a bubble competition process leads to formation of large spikes (and bubbles). If the reshock strikes the interface during slower, non-linear growth before the arrival of the reflected rarefaction wave, the post-reshock growth will progressively decay (Leinov et al., Reference Leinov, Malamud, Elbaz, Levin, Ben-Dor, Shvarts and Sadot2009), and the spikes will be small.
5.2. Dependence of the Growth Rate on the Interface Shape
Dependence of the growth rate on the interface shape is characterized by the initial amplitude a 0, by the amplitude of oscillation after the first shock, the velocity jump after reshock, and the wavelength of perturbation. Many models have been proposed, some with controversial conclusion. The interface shape changes after the first shock, meaning that the moment when the reshock strikes it determines the growth rate of the spike in the post-reshock time. Dependence of growth rate on the above parameters that characterize the interface shape is usually transformed into dependence on the mixing length at reshock h r, and the wave vector k of the perturbation modes (Ukai et al., Reference Ukai, Balakrishnan and Menon2011). Considering only the reshock models for multimodal perturbation such as the model of Mikelian, the growth rate is given by (Mikelian, Reference Mikelian1989; Ukai et al., Reference Ukai, Balakrishnan and Menon2011)
 $${d}h_{\rm 2}/{d}t = C\Delta V_{\rm 2}A^ +, $$
where dh 2/dt is the growth rate after reshock, ΔV 2 is the velocity jump caused by the reshock, A+ is the post-reshock A number, and C is the growth rate constant empirically determined, actually the adjustable parameter (Mikelian, Reference Mikelian1989; Ukai et al., Reference Ukai, Balakrishnan and Menon2011). In the Mikelian's model the growth rate is dependent on the parameter C (C ~ 0.28) indicating that the reshock growth rate is only a weak function of h r and k, or not function at all.
However, the study of single- and multi-modal 3D instability with reshock(s) has shown that the rapid and slow growth rates of spikes strongly depend on the interface shape (Ukai et al., Reference Ukai, Balakrishnan and Menon2011), with different initial amplitudes and wave numbers – what makes the conjecture with our case. The rapid post-reshock growth occurs for the small amplitudes a 0 and wave numbers k max, which correspond to the Mikelian's growth rate constant (0.81 < C < 0.93), close to the single mode RMI growth rate (because the interface shape at the moment of the reshock arrival is still sharp and well resolved) (Ukai et al., Reference Ukai, Balakrishnan and Menon2011). The slow post-reshock growth is caused by random initial interface shape (larger a 0 and k max), for 3D case correspond to the constant (0.31 < C < 0.42). In that case, the interface shape at the moment of the reshock arrival is a mixed and not sharp, because the complex mixing of spikes and bubbles carry lateral motion that cease the growth of the mixing length in the longitudinal direction and enhances the mixing of species (Ukai et al., Reference Ukai, Balakrishnan and Menon2011). The model assumption is that a 0 and k max (in non-dimensional units) are the only parameters that determine whether the mixing layer growth rate is rapid or slow. To quantify the initial perturbation they defined the Randomness factor R (Ukai et al., Reference Ukai, Balakrishnan and Menon2011)
 $$R = a_0k_{{\rm max}}/L_y,$$
where L y as the domain size in the y-direction is used to normalize the parameter. Thus, when R is small, the growth rates are similar to the single-mode cases. Thus, rapid 3D growth happens when R ≤ 0.2 (Ukai et al., Reference Ukai, Balakrishnan and Menon2011).
Considering the large spikes with rapid growth in our case, one has a 0 ≳ 10 µm, the domain size is about L y ~ 400 µm, and wavelength in the band of short-wavelength modes, λ ~ 10–30 µm. For the estimation of randomness factor R, the non-dimensional parameter, k max (ND), has to be found. Taking, k max(ND) = 2π/λmin(ND), where λmin(ND) = λmin(μm)/<λ(mm)>, with λmin(μm) ~10 µm is the minimal wavelength in the band, and <λ(mm)> ~15.5 µm, is the average wavelength of the short-wavelength band of modes, gives k max(ND) ~ 10. Based on these parameters, R ~ 0.2 indicating that short-wavelength perturbation modes satisfy the Ukai's condition for the rapid growth.
Regarding the small spikes with slow growth and taking the initial amplitude a 0 ~ 20 µm, the domain size of L y ~ 400 µm, and the wavelength in the band of the long-wavelength modes, λ ~ 40–60 µm, with λmin(μm) ~ 40 µm, and 〈λ(μm) ~ 50 µm, one has k max(ND) ~ 7.9. With these parameters one finds, R = 0.395, the value which satisfies condition for the slow growth, and which is also in agreement with the slow growth rate constant (0.31 < C < 0.42).
The conjecture between these empirical models and our experimental results besides similarities reveals two important differences: (i) The empirical models with adjusting parameters although explain the growth rate of large and small spikes cannot explain their formation on 1D or 2D lattice. (ii) These models cannot describe simultaneous formation of large and small spikes in the same subdomain, but of the large ones in one subdomain, and the small ones in other subdomain – at various distances and with different interface shapes.
5.3. Multiscale Mushroom Spike Evolution Caused by the Interference of Perturbation Modes: Non-linear Dynamics of RM Flow
More appropriate model for description of simultaneous formation of large and small mushroom spikes on 1D lattices from multimodal perturbation is a fundamental model derived from the first principles. The model is based on the group theory analysis and SPH numerical simulations (Pandian et al., Reference Pandian, Stellingwerf and Abarzhi2017, Stellingwerf et al., Reference Stellingwerf, Pandian and Abarzhi2016a , Reference Stellingwerf, Pandian and Abarzhi b ). The growth (rate) of RMI small and large mushroom spikes on regular lattice emerges from the first shock and from the interface shape, and not from the reshock(s). The RMI evolution depends on the wavelength and amplitude but also on the relative phase of the initial perturbation modes. The model assumes that 2D flow spatially extended in the y-direction, periodic in the x-direction and invariant on 1D space groups. The initial multimodal perturbation is expressed by terms of wave vectors each of which corresponds to the symmetry position in the reciprocal lattice of the p 1 and pm 1 groups with translation operators. By using the two-wave initial perturbation, the evolution characteristics of RMI dynamics have been studied by the variation of relative phase of the waves ϕ, of the ratio a 2/a 1 (a 2 and a 1 are the amplitudes of the interfering waves 1 and 2), and of the A number (A = 0.6, 0.8, and 0.9). From the group theory aspect the superposition of perturbation waves on p 1 and pm 1 lattices with random phase ϕ n = any, in the first case, and ϕ n = 0, 2π (in-phase) or ϕ n = ±π (anti-phase) in the second case, have been studied (Pandian et al., Reference Pandian, Stellingwerf and Abarzhi2017; Stellingwerf et al., Reference Stellingwerf, Pandian and Abarzhi2016a , Reference Stellingwerf, Pandian and Abarzhi b ). The results obtained for A = 0.6 and the small amplitude of the second wave show the evolution of KH instability and formation of mushroom spikes. For the waves in anti-phase (ϕ = π), the ratio of amplitudes a 2/a 1 determines the evolution of RMI dynamics. For a 2/a 1 = 0.01 the effects are insignificant, but they start to play some role for 0.1, while for 1.0 the interface morphology changes dramatically, because in the non-linear phase small mushroom-shape spikes start to grow among the large ones (Pandian et al., Reference Pandian, Stellingwerf and Abarzhi2017; Stellingwerf et al., Reference Stellingwerf, Pandian and Abarzhi2016a , Reference Stellingwerf, Pandian and Abarzhi b ). The relative phase and interference of waves determine the RMI dynamics that influence qualitatively and quantitatively the symmetry, morphology, and growth rate of the unstable interface (Pandian et al., Reference Pandian, Stellingwerf and Abarzhi2017; Stellingwerf et al., Reference Stellingwerf, Pandian and Abarzhi2016a , Reference Stellingwerf, Pandian and Abarzhi b ).
Based on this model the formation of spherical mushroom spikes on 2D p 2 mm lattice can be interpreted by the interference of perturbation modes, which are in anti-phase and have the ratio of amplitudes, a 2/a 1 ≲ 1. Lattice disorder, as seen in Figures 3 and 5, can be attributed to the series of fast reshocks, which cause the wavy perturbation of the background fluid and of the lattice of mushroom spikes. Intuitively, these effects should depend on the distance the reshocks travel to reach particular subdomain and affect the post-reshock RMI structure evolution.
5.4. Characteristics of the Low-Mixing Structures in the Base-Plane
SEM micrographs in Figures 3, 5, and 7 show in the base-plane the irregular web of non-linear solitary waves, breaking waves and ribbons as well as vortex filaments, that is, the coherent structures similar to that observed in the NCR (Lugomer, Reference Lugomer2017). Horizontal acceleration causes the formation of non-linear waves in a thin fluid layer (shallow fluid layer), as well as their roll up into vortex filaments (for the Rayleigh number larger than the critical one, Re ≳ 103). The stochastic small-scale RMI turbulent mixing structures reported by many respected authors (Zhang, Reference Zhang1998; Cohen et al., Reference Cohen, Dennevik, Dimits, Eliason, Mirin, Zhou, Porter and Woodward2002; Anuchina et al., Reference Anuchina, Volkov, Gordeychuk, Es'kov, Ilyutina and Kozyrev2004; Miles et al., Reference Miles, Blue, Edwards, Greenough, Hansen, Robey, Drake, Kuranz and Leibrandt2005; Long et al., Reference Long, Krivets, Greenough and Jacobs2009; Youngs, Reference Youngs2013), are absent. Instead, the chaotic or quasi-regular organization of the large-scale coherent structures characterizes the non-linear evolution in the NPR. This problem is connected with the noise and fluctuations in RM/RT mixing called the interfacial RM/RT “turbulent mixing” (Zhang, Reference Zhang1998; Dimotakis, Reference Dimotakis2000). However, turbulence (at least canonical turbulence) is an equivalent of a stochastic process, where the flow fluctuations are independent of the initial conditions, boundary conditions and external forcing (Abarzhi, private communication). For canonical turbulence to occur the conditions of isotropy, locality, homogeneity, and statistical steadiness should be fulfilled. It may be said that in the case observed the RT and RM mixing flows do not obey these conditions. In contrast to turbulence – a chaos, while also appears as ‘irregular’, – depends on the initial conditions. In fact, their sensitivity to the initial conditions suggests that RT and RM mixing are more “chaotic” rather than stochastic processes (Abarzhi, private communication).
6. CONCLUSION
The NPR of Gaussian-like spot shows different morphology from the CR and the NCR. Due to the lateral vapor expansion in the SCC microchannel the ablated vapor is transported into the NPR. The change of morphology follows the change of momentum transfer M and the Atwood number A which continuously decrease across the NPR from about M ≲ 0.65 M max to ~0.2 M max and A ~ 0.6 to ~0.2 or less. Under moderate A and M parameters, a vertical shock wave causes growth of large and small RMI/RTI mushroom spikes organized on 2D rectangular lattice of p 2 mm symmetry.
Distribution of the mushroom spike diameter as function of radial distance from the center of Gaussian-like spot shows that the monodispersed distribution in the NCR at the border of the NPR splits into a band of small-diameter spikes, and into a band of large-diameter ones. Divergence of splitted diameter distribution indicates divergence of growth rates of the spikes with increasing distance from the center of the spot (and of the origin of the shock wave). Evolution of small and large mushroom spikes is considered in the picture of dynamic system in which the mushroom diameter is represented by the orbit or stable periods in 2D phase space. For the corresponding phase portrait, the constant mushroom diameter is represented by the circular orbit (stable circulation or constant oscillating frequency), between unstable spiral ones. The unstable spirals leading to the stable periodic orbits (the limit cycles) represent supercritical Hopf bifurcation; those lading to their disappearance represent the subcritical Hopf bifurcation.
The growth rate of small and large RMI mushroom spikes is considered in the view of empirical models, which assume that the growth rate in multimodal perturbation depends on the reshock, and not primarily on the first shock. Consequently, the growth rate of mushroom spikes in various subdomains indicates dependence on the distance the reshock has to travel, and dependence on the interface shape at the moment of the reshock arrival in particular domain. In spite of the agreement of the growth rates for a given surface roughness parameter predicted by the model and the experimental ones, it was shown that these models cannot describe: (i) formation of mushroom spikes on 2D lattice, and (ii) simultaneous evolution of small and large mushroom spikes at the same distance (but the large spikes at one distance and the mall ones at the other distance).
More complete picture of 2D lattices of small and large mushroom spikes by multimodal perturbation after first shock gives the model based on the interference of perturbation modes taking into account the amplitude, relative phase and the symmetry of the wave vectors of the initial perturbation modes. The model for 1D periodic flow and formation of large and small spikes is based on the group theory and the SPH numerical simulations by Abarzhi and collaborators. The model can also describe more complex 2D periodic fluid flow and formation small and large mushroom spikes like that on a regular p 2 mm lattice, observed in this case.
Lattice disturbance from ideal regular one can be attributed to the series of fast reshocks which cause the wavy perturbation of the background fluid (and of the lattice of mushroom spikes). Intuitively, this effect depends on the distance the reshocks have to travel to reach particular subdomain and on the shape of interface at that moment of its arrival.
The base-plane structures are not small-scale turbulent mixing ones, but the chaotic large-scale low-mixing solitary waves and vortex filament structures
ACKNOWLEDGMENTS
This work has been supported by the Croatian Science Foundation under the project: IP-2014-09-7046. I would like to thank to Professor N.J. Zabusky, Department of Physics of Complex Systems, Weizmann Institute of Science, Rehovot, Israel, for his comments of the wave–vortex paradigm in turbulent mixing in the laser experiments. I would also like to thank to Professor S. I. Abarzhi, Carnegie Mellon University, USA, for the inspiring comments of the chaotic and stochastic aspects of the mixing structures.


