Introduction
Macroalgae or seaweeds are ubiquitous in the marine environment, particularly in shallow waters where they occur in a variety of forms (Littler et al., Reference Littler, Littler and Taylor1983; Doi et al., Reference Doi, Matsumasa, Fujikawa, Kanou, Suzuki and Kikuchi2009). Along temperate coasts, they can dominate entire ecosystems such as on rocky shores and subtidal reefs where they contribute immense production, biomass and diversity (Underwood & Kennelly, Reference Underwood and Kennelly1990; Little & Kitching, Reference Little and Kitching1996; Kraufvelin et al., Reference Kraufvelin, Lindholm, Pedersen, Kirkerud and Bonsdorff2010). As global sea temperatures rise, temperate macroalgal communities are being driven poleward as they face increased competition and herbivory from range-expanding subtropical and tropical organisms including corals and herbivores (Wernberg et al., Reference Wernberg, Russell, Thomsen, Gurgel, Bradshaw, Poloczanska and Connell2011, Reference Wernberg, Bennett, Babcock, de Bettignies, Cure, Depczynski, Dufois, Fromont, Fulton, Hovey, Harvey, Holmes, Kendrick, Radford, Santana-Garcon, Saunders, Smale, Thomsen, Tuckett, Tuya, Vanderklift and Wilson2016; Vergés et al., Reference Vergés, Steinberg, Hay, Poore, Campbell, Ballesteros, Heck, Booth, Coleman, Feary, Figueira, Langlois, Marzinelli, Mizerek, Mumby, Nakamura, Roughan, Van Sebille, Gupta, Smale, Tomas, Wernberg and Wilson2014; Pecl et al., Reference Pecl, Araújo, Bell, Blanchard, Bonebrake, Chen, Clark, Colwell, Danielsen, Evengård, Falconi, Ferrier, Frusher, Garcia, Griffis, Hobday, Janion-Scheepers, Jarzyna, Jennings, Lenoir, Linnetved, Martin, McCormack, McDonald, Mitchell, Mustonen, Pandolfi, Pettorelli, Popova, Robinson, Scheffers, Shaw, Sorte, Strugnell, Sunday, Tuanmu, Vergés, Villanueva, Wernberg, Wapstra and Williams2017).
In tropical and subtropical waters, macroalgae are often perceived to have negative effects on ecosystems due to their role in driving coral-algal phase shifts, during which macroalgae compete for space with, and ultimately replace, hard corals on reefs after major disturbances (McManus & Polsenberg, Reference McManus and Polsenberg2004; Hughes et al., Reference Hughes, Graham, Jackson, Mumby and Steneck2010; Lee et al., Reference Lee, Walford, Goh and Tan2012a). They have been observed to impede recruitment and cause mortality in corals (Kuffner et al., Reference Kuffner, Walters, Becerro, Paul, Ritson-Williams and Beach2006; Smith et al., Reference Smith, Shaw, Edwards, Obura, Pantos, Sala, Sandin, Smriga, Hatay and Rohwer2006; Hughes et al., Reference Hughes, Rodrigues, Bellwood, Ceccarelli, Hoegh-Guldberg, McCook, Moltschaniwskyj, Pratchett, Steneck and Willis2007; Hoey & Bellwood, Reference Hoey and Bellwood2011). Nevertheless, macroalgae also have positive roles in marine ecosystems. They help dampen wave-induced physical damage on reefs and also provide food and shelter against predators in shallow coastal areas (Dean & Connell, Reference Dean and Connell1987).
Hence, macroalgae can greatly affect the distribution, diversity and abundance of fauna in various marine ecosystems. In the absence or depletion of coral cover, for instance, macroalgae can quickly recruit various organisms and even act as nurseries by providing food and shelter for reef fishes, amphipods and crabs (Wilson et al., Reference Wilson, Able and Heck1990; Paddack & Sponaugle, Reference Paddack and Sponaugle2008; Duarte et al., Reference Duarte, Jaramillo, Contreras and Navarro2009). In a comparison between macroalgae and seagrasses, the former were found to contribute a larger proportion of gastropod diets in terms of nitrogen and carbon content (Doi et al., Reference Doi, Matsumasa, Fujikawa, Kanou, Suzuki and Kikuchi2009). Overall, macroalgae account for a considerable part of marine food webs and, more generally, are responsible for the functioning of many marine ecosystems (Bruno et al., Reference Bruno, Boyer, Duffy, Lee and Kertesz2005).
Apart from the important roles played by seaweeds in primary production and ecosystem functioning, their structural composition, complexity and size enable them to house a diverse array of epiphytic decomposers and herbivores (Dudley et al., Reference Dudley, Cooper and Hemphill1986; Gee & Warwick, Reference Gee and Warwick1994a, Reference Gee and Warwick1994b; Christie et al., Reference Christie, Norderhaug and Fredriksen2009; Nyberg et al., Reference Nyberg, Thomsen and Wallentinus2009). Epifauna living amongst macroalgae utilize their hosts in a wide variety of ways. Hosts may be used directly as surface area for attachment by sedentary animals, as permanent or transient shelter, or as sources of food and sediment for algal browsers and detritivores respectively (Hayward, Reference Hayward, Price, Irvine and Farnham1980; Seed & O'Connor, Reference Seed and O'Connor1981). Sessile epifauna have also been found to assimilate dissolved organic carbon in the form of exudates from the host macroalgae (De Burgh & Fankboner, Reference De Burgh and Fankboner1978). Competition for space and food can be intense and is characteristic amongst epifaunal species (Buss, Reference Buss1979). Biotic interactions such as competition and predation also interact with habitat complexity – which has been found to lower predation on a dominant competitor – to influence epifaunal establishment (Russ, Reference Russ1980).
More generally, algal habitat structural complexity has been linked to the diversity and abundance of macroalgal epifauna (Gee & Warwick, Reference Gee and Warwick1994a, Reference Gee and Warwick1994b; Veiga et al., Reference Veiga, Rubal and Sousa-Pinto2014), and there are also indications that the surrounding physical environment and chemical composition of a macroalga can affect the diversity of its associates (Hull, Reference Hull1997; Downes et al., Reference Downes, Lake, Schreiber and Glaister2000; Nyberg et al., Reference Nyberg, Thomsen and Wallentinus2009). Studies have often shown that macroalgae with higher structural complexity host more invertebrate species, individuals and biomass than structurally simpler habitats (Gee & Warwick, Reference Gee and Warwick1994a, Reference Gee and Warwick1994b; Veiga et al., Reference Veiga, Rubal and Sousa-Pinto2014). To various extents, structural complexity is associated with greater abundance of ecological niches, protection from the physical environment, curbing of predation, as well as higher water retention capacity that reduces desiccation of epifauna during low tide (Davenport et al., Reference Davenport, Butler and Cheshire1999; Hooper & Davenport, Reference Hooper and Davenport2006). Epifaunal species are also typically not host specific (Schneider & Mann, Reference Schneider and Mann1991; Taylor & Cole, Reference Taylor and Cole1994; but see Gestoso et al., Reference Gestoso, Olabarria and Troncoso2014).
These patterns remain tentative as few habitats and macroalgal species have been characterized for the associated epifauna (Christie et al., Reference Christie, Norderhaug and Fredriksen2009). Nevertheless, research performed mostly on temperate macroalgae has thus far suggested that certain associations are crucial for mediating the dominance of any one species, such as the invertebrate epifauna which regulate the proliferation of the filamentous green alga Cladophora columbiana (Bracken et al., Reference Bracken, Gonzalez-Dorantes and Stachowicz2007). Macroalgae are also known to serve as refugia for a wide variety of organisms, particularly in rocky shore communities which experience more variable physical conditions (Lee et al., Reference Lee, Tietjen, Mastropaolo and Rubin1977; Gestoso et al., Reference Gestoso, Olabarria and Troncoso2012), with epifaunal diversity and abundance influenced strongly by wave exposure and algal morphology (Hacker & Steneck, Reference Hacker and Steneck1990; Norderhaug et al., Reference Norderhaug, Christie, Andersen and Bekkby2012, Reference Norderhaug, Christie, Rinde, Gundersen and Bekkby2014). Even the invasive macroalga, Caulerpa taxifolia, has been observed to recruit native organisms in New South Wales, Australia (Gibben & Wright, Reference Gibben and Wright2006). More fundamentally, there remains a need to understand how macroalgal morphology and environmental factors drive epifaunal diversity, especially in tropical ecosystems.
Past studies of macroalgal–invertebrate associations typically use conventional sorting and painstaking taxonomic methods to establish host identity and estimate epifaunal diversity, primarily by morphological sorting to the lowest taxonomic level using field guides and keys, primary literature, or assistance from taxonomic experts (e.g. Colman, Reference Colman1940; Hagerman, Reference Hagerman1966; Dommasnes, Reference Dommasnes1969; Jones, Reference Jones1971; Moore, Reference Moore1973; Edwards, Reference Edwards1980; Schultze et al., Reference Schultze, Janke, Krüß and Weidemann1990; Edgar, Reference Edgar1991; Christie et al., Reference Christie, Jørgensen, Norderhaug and Waage-Nielsen2003; Norderhaug, Reference Norderhaug2004; Pereira et al., Reference Pereira, Lima, Queiroz, Ribeiro and Santos2006). DNA barcoding aided by high-throughput sequencing can potentially expedite this process and increase the accuracy of estimates without heavy involvement of taxon-specific experts (Hajibabaei et al., Reference Hajibabaei, Singer, Hebert and Hickey2007; Lahaye et al., Reference Lahaye, van der Bank, Bogarin, Warner, Pupulin, Gigot, Maurin, Duthoit, Barraclough and Savolainen2008; Nagy et al., Reference Nagy, Sonet, Glaw and Vences2012). Using this method, samples are sorted into morphological groups before selecting representatives from each group for amplification and sequencing of a short, standardized gene locus (Hebert et al., Reference Hebert, Ratnasingham and de Waard2003a, Reference Hebert, Cywinska, Ball and deWaard2003b, Reference Hebert, deWaard and Landry2010). The sequence, or DNA barcode, is then compared to a reference database (e.g. GenBank) and identified successfully if it meets a similarity threshold relative to a taxon-identified barcode in the library, or deemed a new sequence record entirely if there are no similar matches (Hajibabaei et al., Reference Hajibabaei, Singer, Hebert and Hickey2007). It is important to note that the accuracy of this method depends critically on the species identification of the database sequences against which the query is being matched (Will & Rubinoff, Reference Will and Rubinoff2004; Nilsson et al., Reference Nilsson, Ryberg, Kristiansson, Abarenkov, Larsson and Kõljalg2006), and its precision is heavily reliant on the taxonomic resolution and coverage of sequences which are closely related to the query sequence (Kwong et al., Reference Kwong, Srivathsan and Meier2012; Kvist, Reference Kvist2013). This approach needs to be tested for its potential to help estimate diversity more accurately and cheaply for specimen-rich samples such as macroalgal-associated epifauna (see Meier et al., Reference Meier, Wong, Srivathsan and Foo2016; Wang et al., Reference Wang, Srivathsan, Foo, Tamane and Meier2018).
The main objective of this study is to examine the community structure and diversity of macroalgal epifauna on hosts of varying morphologies among intertidal sites in Singapore by incorporating DNA barcoding techniques. Macroalgae can be found along most of Singapore's coastal areas, including coral reefs, rocky and sandy shores, as well as mangrove forests (Teo & Wee, Reference Teo and Wee1983). Despite the high diversity and abundance of macroalgae here (e.g. Lee et al., Reference Lee, Liao and Tan2009, Reference Lee, Baula, Miranda and Sin2015; Noiraksar et al., Reference Noiraksar, Lewmanomont, Tan, Ong and Tan2012; Yip et al., Reference Yip, Quek, Low, Wilson, Bauman, Chou, Todd and Huang2018), studies on their epifaunal assemblages are surprisingly rare and usually result from opportunistic sampling (e.g. Low et al., Reference Low, Leng and Chou1997; Jensen, Reference Jensen2015). Specifically, we examine three algal morphologies – three-dimensional (3D), filamentous and foliose structures (Steneck & Dethier, Reference Steneck and Dethier1994) – in relation to their epifaunal communities. Due to the simple tissue organization, phenotypic plasticity and complex evolutionary histories of marine macroalgae (Du et al., Reference Du, Wu, Mao, Guo, Xue and Bi2014), differentiating between species can be extremely difficult. For the invertebrate epifauna, lack of barcode data for most lineages means that a vast majority of organisms may not be easily assigned to species using DNA sequences alone (Schander & Willassen, Reference Schander and Willassen2005). Therefore, this study integrates molecular and morphological approaches to test for differences in epifaunal community structure and diversity among macroalgal host species along a gradient of algal structural complexity at various localities.
Materials and methods
Sample collection and processing
Macroalgal samples were collected from the intertidal environment at five sites in Singapore – Changi Beach (CHB), Cyrene Reefs (CYR), East Coast Park (ECP), Big Sisters' Island (SIS) and Pulau Semakau (SMK) – during low spring tides between June and November 2017 (Figure 1). Each site was sampled once from June to July 2017, with Big Sisters' Island resampled twice in July and August 2017, and Pulau Semakau resampled once in November 2017. Changi Beach is an easily accessible shore in north-eastern mainland Singapore, comprising primarily a seagrass habitat dominated by Halophila ovalis (Lee et al., Reference Lee, Yaakub, Ng, Erftemeijer and Todd2012b), as well as the abundant Bryopsis sp. 2. Cyrene Reefs are a group of patch reefs comprising an extensive 14-ha seagrass bed home to eight of Singapore's 12 seagrass species (Yaakub et al., Reference Yaakub, Lim, Lim and Todd2013; McKenzie et al., Reference McKenzie, Yaakub, Tan, Seymour and Yoshida2016), with high abundances of Caulerpa lentillifera, Bryopsis sp. 1 and Halymenia sp. 1. East Coast Park contains seawalls with a narrow rocky shore characterized by strong waves, and is lined by a subtidal coral community with moderate growths of red and brown macroalgae. Big Sisters' Island is part of Singapore's first marine park with two intertidal lagoons bounded by seawalls and fringed by a diverse coral reef (Jaafar et al., Reference Jaafar, Huang, Tanzil, Ow and Yap2018; Wong et al., Reference Wong, Chan, Ng, Tun, Darling and Huang2018), and contains numerous forms of red, green and brown macroalgae. Pulau Semakau is Singapore's offshore landfill site and the largest multi-habitat intertidal zone south of mainland Singapore (Jaafar et al., Reference Jaafar, Huang, Tanzil, Ow and Yap2018). It has a large 13.7-ha seagrass meadow dominated by Enhalus acoroides, Cymodocea serrulata and Thalassia hemprichii (Lee et al., Reference Lee, Yaakub, Ng, Erftemeijer and Todd2012b; Yaakub et al., Reference Yaakub, Lim, Lim and Todd2013), and the seaward coral reef habitat contains a high diversity of red, green and brown macroalgae but is limited in the filamentous forms.
Fig. 1. Map showing sampling sites in Singapore. CHB, CYR, ECP, SIS and SMK represent Changi Beach, Cyrene Reefs, East Coast Park, Big Sisters' Island and Pulau Semakau, respectively.
A total of 43 samples were collected, each from an algal patch between 20 × 20 cm and 50 × 50 cm in size that was at least 5 m from its nearest sampled patch. The sample size for each species and morphological group varied due to site differences in algal community composition and abundances, but these were factored into the linear regression modelling below. Macroalgae were collected by hand, using plastic Petri dishes 9 cm diameter by 1.4 cm height to standardize the amount of algae collected. The Petri dish was filled to the brim and covered with the same type of lid without applying additional pressure. Rather than standardizing by weight or displacement volume, this method ensured that the alga rested naturally within the Petri dish to yield an equivalent and comparable habitat volume. Specimens were immediately transferred into separate bags to be transported to the laboratory.
Algal samples were processed within 24 h, or fixed in 100% ethanol to be processed later. Invertebrates present in the macroalgae were isolated, sorted, counted and imaged live under a Leica MC190 HD camera mounted on a Leica M205C stereo microscope. Specimens were sorted by observable morphological characteristics to species, subsampled for DNA extraction in 100% ethanol and the remainder of each specimen preserved in 70% ethanol for future taxonomic study. Morphotypes represented by only one specimen were preserved in 70% ethanol and not sequenced as they were used for morphological identification.
Macroalgae were identified by morphology to their lowest taxonomic level according to Lee et al. (Reference Lee, Baula, Miranda and Sin2015) and sorted into three morphological groups – 3D, filamentous and foliose (Table 1) – following the criteria by Steneck & Dethier (Reference Steneck and Dethier1994). Filamentous algae were uniseriate and foliose algae were in layers (single layer or corticated), while 3D macroalgae had complex shapes and branches under the functional groups of corticated and leathery macrophytes (Steneck & Dethier, Reference Steneck and Dethier1994; see also Littler et al., Reference Littler, Littler and Taylor1983; Littler & Littler, Reference Littler and Littler1984). Bryopsis and Ceramiaceae had filamentous uniaxial thalli that were up to 10 cm in height with short side branches, the former forming large patches (≥50 × 50 cm) and the latter in small clumps (≤20 × 20 cm) attached to larger macroalgae. Among the foliose macroalgae, Halymenia and Ulva had flattened, sheet-like thalli that were irregularly foliose and sinuate, reaching ≥10 cm in height; Padina had large, fan-shaped thalli about 6 cm in height that were very lightly calcified; and Turbinaria bore thick, stiff thalli about 10 cm in height. For the 3D group, Caulerpa consisted of horizontal stolons anchored to the substrate with fronds bearing spherical branchlets, attaining heights of ≥10 cm; Gracilaria erect, cylindrical and branching with constrictions at base of axes, reaching ≥10 cm in height; and Sargassum grew from the substrate as tall, upright thalli up to about 30 cm in height (non-bloom), bearing leaf-like, spatulate blades with denticulate margins and spherical vesicles.
Table 1. Macroalgal taxa analysed for each morphological group. CHB, CYR, ECP, SIS and SMK represent Changi Beach, Cyrene Reefs, East Coast Park, Big Sisters' Island and Pulau Semakau, respectively
a Caulerpa racemosa var. turbinata and Caulerpa racemosa were considered distinct species according to Belton et al. (Reference Belton, Prud'homme van Reine, Huisman, Draisma and D Gurgel2014).
b Bryopsis sp. 1 and Bryopsis sp. 2 were considered different species due to distinct morphologies – the former had long, individual strands from a single point, while the latter was distributed in fronds.
c Halymenia sp. 1, 2 and 3 were considered different species due to structural differences. Halymenia sp. 2 had higher occurrences of jagged edges compared with sp. 1, while sp. 3 was distinctly yellow-red coloured.
DNA extraction and amplification
Between one and 10 samples from each epifaunal morphotype were targeted for DNA barcoding. Tissue from each invertebrate specimen was subsampled, pulverized and dried for DNA extraction using QuickExtract (Lucigen, WI) following the manufacturer's protocol.
Mitochondrial cytochrome c oxidase subunit I (COI) was utilized to identify invertebrates (Hebert et al., Reference Hebert, Ratnasingham and de Waard2003a, Reference Hebert, Cywinska, Ball and deWaard2003b; Bucklin et al., Reference Bucklin, Steinke and Bianco-Bercial2011). Two different pairs of metazoan barcoding primers were used to target two lengths of the COI gene. Epifaunal samples were amplified for a 313-bp fragment using mlCO1intF (5′–GGW ACW GGW TGA ACW GTW TAY CCY CC–3′; Leray et al., Reference Leray, Yang, Meyer, Mills, Agudelo, Ranwez, Boehm and Machida2013) and modified jgHCO2198 (5′–TAA ACY TCA GGR TGC CCR AAR AAY CA–3′; Geller et al., Reference Geller, Meyer, Parker and Hawk2013; Meier et al., Reference Meier, Wong, Srivathsan and Foo2016) each with a 9-bp tag, or a 658-bp fragment using LCO1490 (5′–GGT CAA CAA ATC ATA AAG ATA TTG G–3′) and HCO2198 (5′–TAA ACT TCA GGG TGA CCA AAA AAT CA–3′) (Folmer et al., Reference Folmer, Black, Hoeh, Lutz and Vrijenhoek1994). Amplicons produced from the former tagged primers were designated for Illumina sequencing, while those from the latter primer set were sequenced using the Sanger method.
Each polymerase chain reaction (PCR) contained 2 µl of 10× diluted DNA extract, 2.5 µl of 10× buffer, 2 µl of 10 µM total dNTP, 1 µl of each 10 µM primer, 0.2 µl of 5 U µl−1 BioReady rTaq polymerase (BioReady rTaq, BioFlux), and topped up with water for a 10 µl reaction mix. PCR products were visualized using a 1% gel, and successful amplicons were purified using Sera-Mag Magnetic Particles (GE Healthcare) in 18% PEG buffer, with a modified size-selection protocol based on Tay et al. (Reference Tay, Chng, Sew, Rheindt, Tun and Meier2016). For the selection of fragments longer than 500 bp, a bead-PEG suspension to PCR product ratio of 0.67 was used (i.e. 6.7 µl of bead-PEG suspension to 10 µl of PCR product). To select for fragments ~300 bp in length, a ratio of 1.5 was used.
DNA sequencing
For Sanger sequencing of the 658-bp COI fragment, products underwent cycle sequencing using the BigDye Terminator Purification Kit (ThermoFisher Scientific) following manufacturer's protocol. BigDye Terminator removal was carried out using PureSEQ-MP (ALINE Biosciences) following manufacturer's protocol, and products were sequenced on a 3730XL DNA Analyser (Applied Biosystems). Sequence data were checked for quality, trimmed and assembled using Geneious v11.0.2 (Kearse et al., Reference Kearse, Moir, Wilson, Stones-Havas, Cheung, Sturrock, Buxton, Cooper, Markowitz, Duran, Thierer, Ashton, Meintjes and Drummond2012). Possible contamination was checked using BLAST (Altschul et al., Reference Altschul, Gish, Miller, Myers and Lipman1990) against the GenBank database.
Epifaunal samples amplified for the 313-bp COI fragment were sequenced using the 250-bp paired-end chemistry on Illumina MiSeq and HiSeq 2500. Sequences were processed following the pipeline by Meier et al. (Reference Meier, Wong, Srivathsan and Foo2016). Briefly, paired-end reads were merged using the Paired-End reAd mergeR (PEAR) v0.9.10 (Zhang et al., Reference Zhang, Kobert, Flouri and Stamatakis2014), demultiplexed, and the dominant reads of each sample identified. These reads were filtered for count >50 and a maximum ratio of 0.2 between the second-dominant and dominant reads. Quality-filtered sequences were trimmed to 313 bp using Geneious v11.0.2 (Kearse et al., Reference Kearse, Moir, Wilson, Stones-Havas, Cheung, Sturrock, Buxton, Cooper, Markowitz, Duran, Thierer, Ashton, Meintjes and Drummond2012).
COI barcodes from both Sanger and Illumina sequencing were consolidated, aligned using MUSCLE v3.8.425 (Edgar, Reference Edgar2004), and checked for stop codons. Sequences were grouped by pairwise sequence similarity using the objective clustering method (Meier et al., Reference Meier, Kwong, Vaidya and Ng2006, Reference Meier, Wong, Srivathsan and Foo2016) at 3–5% mismatch thresholds. They were searched again on the GenBank database via BLAST to identify potential contamination by crosschecking with the expected morphotype, as well as for taxon identification to the lowest taxonomic rank. The pipeline readsidentifier v1.0 was used to facilitate extraction of taxonomic identities from the BLAST searches (Srivathsan et al., Reference Srivathsan, Sha, Vogler and Meier2015). Sequences were also searched against barcode records at the Barcode of Life Data (BOLD) System. Species identification was determined based on ≥97% match to a known sequence. Matches at ≥90% were identified minimally to order level, and matches <90% were recognized at phylum level and identified to order where possible based on morphology.
From the epifaunal morphotypes and COI barcodes, species were recognized based on three criteria: (1) morphotypes initially sorted as the same species were supported by pairwise COI similarity of ≥97%; (2) morphotypes initially sorted as the same species were separated into two or more distinct species if barcode data showed them to be distinct (<97% pairwise similarity); and (3) morphotypes initially sorted as different species were combined as a single species if they had pairwise COI similarity of ≥97%. All sequence and community data generated are available at Zenodo (http://dx.doi.org/10.5281/zenodo.2528457).
Statistical analyses
The epifaunal community data were analysed to compare community structure and diversity among host algal morphologies, species and sites. Dissimilarities in the assemblage hosted by each macroalgal sample among different morphologies and sites were represented by the Bray–Curtis dissimilarity index (Bray & Curtis, Reference Bray and Curtis1957) and visualized with non-metric multidimensional scaling (NMDS). Analysis of similarities (ANOSIM) was conducted to test for differences in community structure among algal morphologies and sampling sites. Analyses were carried out using the ‘vegan’ package (Oksanen et al., Reference Oksanen, Blanchet, Friendly, Kindt, Legendre, McGlinn, Minchin, O'Hara, Simpson, Solymos, Stevens, Szoecs and Wagner2017) in R (R Core Team, 2017).
The effects of algal morphology, algal species and sampling site on the diversity of macroalgal-associated epifauna were examined using a multiple linear regression model. The Shannon–Wiener diversity index was computed for the epifaunal community in each macroalgal sample to quantify diversity, the response variable. Data were checked for normality and heteroscedasticity. A full model with the above effects and their interactions was fitted. By stepwise simplification, the model with the lowest score based on the Akaike information criterion with a correction for small sample sizes (AICc) was chosen using the ‘MuMIn’ package in R (R Core Team, 2017).
Results
Five 3D, three filamentous and six foliose algal species, represented respectively by 16, 13 and 14 samples, were collected and examined (Table 1). A total of 2061 epifaunal specimens were obtained from the 43 algal samples. Overall, arthropods (68.8%) were the most abundant taxa, followed by molluscs (17.7%) and annelids (12.7%) (Figure 2). Other phyla were present at <1% of total abundance. Arthropods, molluscs and annelids were roughly even in abundance among 3D macroalgae, while arthropods dominated both filamentous and foliose algae (Figures 2, 3). 3D macroalgae had the lowest abundance of epifauna (515 individuals; ~32 per algal sample), with slightly more animals found in foliose algae (519 individuals; ~37 per algal sample), while filamentous macroalgae had much higher epifaunal abundance (1027 individuals; ~79 per algal sample). Among different algal morphologies, the abundances of isopods, amphipods and Placida sp. were greatest in filamentous algae; the highest number of pantopods (pycnogonids) were observed in foliose algae; and the highest abundances of Berthelinia sp. and Volvatella sp. were in 3D algae (Figure 3).
Fig. 2. Mean abundances of different phyla observed for each algal morphology. Error bars represent standard deviation.

Fig. 3. Mean abundances of the most dominant taxa for each algal morphology: (A) Annelida; (B) Arthropoda; (C) Mollusca. Error bars represent standard deviation.
After sorting by morphology, a total of 136 metazoan morphotypes were delimited initially from all 43 algal samples. COI barcoding was performed on 634 of the 2061 animals sampled, with 56.2% successfully amplified and sequenced. From the 356 sequences obtained, objective clustering grouped sequences into 85 molecular operational taxonomic units (MOTUs), or putative species (Supplementary Figure 1). Dissimilarity thresholds between 3% and 5% gave consistent numbers of MOTUs, which were checked against the 136 morphotypes. Based on the 97% similarity threshold, 11 of the morphotypes were found to be indistinguishable from other morphotypes while 47 additional species were detected. Consequently, a total of 172 invertebrate species were found to be present among all macroalgal samples.
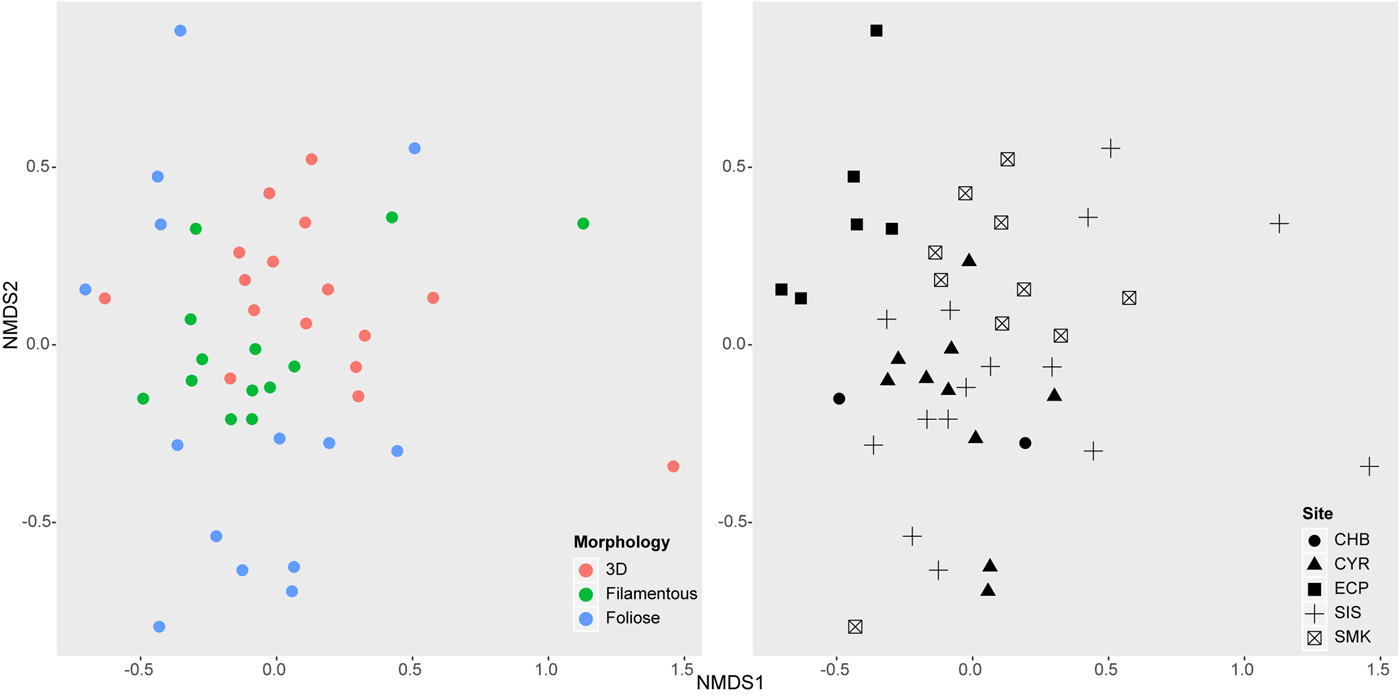
Non-metric multidimensional scaling (NMDS) showed that epifaunal community structure was dissimilar among algal morphologies and sampling sites (Figure 4). ANOSIM confirmed these results, showing that communities on different algal morphologies were significantly different from one another (R = 0.186, P = 0.001), with foliose algae hosting the most distinct epifauna. Communities were also significantly different among sites (R = 0.264, P = 0.001), with East Coast Park epifauna clearly distinguished from other sites.

Fig. 4. Non-metric multi-dimensional scaling (NMDS) of macroalgal-associated epifaunal communities from 43 algal samples (stress = 0.176). Left: Communities on algal samples distinguished by morphology. Right: Communities on algal samples distinguished by sampling site. Site labels follow Figure 1.
The best linear model of epifaunal diversity contained the factor algal morphology (ΔAICc of second-best model = 8.56; Table 2). The full model with the factors algal morphology, algal species and sampling site was suboptimal (ΔAICc = 29.93). No difference in Shannon–Wiener diversity index was detected among sites (Figure 5). Diversity of epifauna on foliose algae was generally lower than on 3D and filamentous algae, but only the difference between 3D and foliose algae was significant (P = 0.002; Table 2). Foliose macroalgae were observed to host the least number of epifaunal species, while 3D macroalgae contained the highest richness (Supplementary Figure 2) despite the low epifaunal abundance (Figures 2 & 3). Less than 10% of the epifaunal species were shared among all three algal morphologies.
Fig. 5. Diversity of macroalgal-associated epifauna in relation to algal morphology and sampling site. Individual lines represent single samples. Site labels follow Figure 1.
Table 2. Results of the best linear model, according to the Akaike information criterion with a correction for small sample sizes (AICc = 91.8), showing the effects of algal morphology on epifaunal Shannon-Wiener diversity index
Values obtained for factors are compared to the intercept which represents 3D morphology. Bold P-values represent P < 0.05.
Discussion
Our study found 172 species of invertebrates associated with 14 species of macroalgae comprising 3D, filamentous and foliose morphologies (Table 1). Arthropods constituted the most abundant (1417 individuals) and species-rich (85 spp.) group, followed by molluscs (364 individuals, 41 spp.) and annelids (260 individuals, 37 spp.) (Figure 2). DNA barcoding was able to distinguish among 85 MOTUs (Supplementary Figure 1), but the reference database was not sufficiently informative for identifying the vast majority of species – only 15 barcodes could be identified to species level. Analyses showed that macroalgal-associated epifaunal community structure differed significantly among algal morphologies and sampling sites (Figure 4), and that algal morphology had a significant effect on epifaunal diversity (Figure 5).
Algal locality affected the community structure of associated epifauna, likely due to the different habitats in which the macroalgae were found. Cyrene Reefs and Changi Beach consisted primarily of seagrass meadows, Pulau Semakau and Big Sisters' Island were mainly coral reef patches, while East Coast Park was a rocky shore (Figure 1). The most distinct assemblages were found in the latter, where organisms had to be able to withstand various stressors such as fluctuating environmental conditions (i.e. water levels, temperature, oxygen availability, nutrient changes and pH), desiccation and strong wave action (Oswald & Seed, Reference Oswald and Seed1986; Taylor, Reference Taylor1998; Schreider et al., Reference Schreider, Glasby and Underwood2003; Hooper & Davenport, Reference Hooper and Davenport2006; Norderhaug et al., Reference Norderhaug, Christie, Rinde, Gundersen and Bekkby2014; Mieszkowska, Reference Mieszkowska and Letcher2016).
Apart from site differences, algal morphology also had an effect on epifaunal communities. In particular, foliose algae had the most distinct epifauna, a pattern congruent with a study by Cacabelos et al. (Reference Cacabelos, Olabarria, Incera and Troncoso2010) who found that macroalgae with simpler structures tend to have more dissimilar communities. Furthermore, foliose macroalgae generally have lower complexity in the available space that could be exploited by invertebrates, resulting in reduced epifaunal abundance and species diversity (Morse et al., Reference Morse, Lawton, Dodson and Williamson1985; Miller et al., Reference Miller, Reed and Brzezinski2009; McDonald & Bingham, Reference McDonald and Bingham2010; Veiga et al., Reference Veiga, Rubal and Sousa-Pinto2014), a pattern consistent with our findings.
Organisms utilize their host seaweeds in different ways. Broadly, hosts may be used as shelter or as a source of food, and detritivores, planktivores and algivores have varying abundances on different macroalgae (Beckley & McLachlan, Reference Beckley and McLachlan1980; Gestoso et al., Reference Gestoso, Olabarria and Troncoso2012; Roff et al., Reference Roff, Wabnitz, Harborne and Mumby2013; Desmond et al., Reference Desmond, Suárez-Jiménez, Nelson and Hepburn2018). For instance, more pycnogonids (Pantopoda) were found on foliose algae as they probably grazed on rhodophytes (Bamber & Davis, Reference Bamber and Davis1982), which accounted for the majority of foliose algae examined in this study. Ecological interactions may also structure epifaunal assemblages. For example, the presence of predators such as annelids may deter grazers from inhabiting particular macroalgae (Antoniadou & Chintiroglou, Reference Antoniadou and Chintiroglou2006; Soler-Membrives et al., Reference Soler-Membrives, Rossi and Munilla2011), and could explain the marginally higher abundance of annelids compared with arthropods and molluscs observed here among 3D macroalgae. Predation and competition among epifauna are important determinants of community organisation (Seed & O'Connor, Reference Seed and O'Connor1981), but these processes remain poorly characterized and ought to be studied in detail for these macroalgal habitats.
Overall, amphipods and gastropods were the most abundant epiphytic invertebrates, a result that is in agreement with Christie et al. (Reference Christie, Norderhaug and Fredriksen2009), who posited that habitat complexity elevates amphipod abundance since they utilize macroalgae as shelter. However, we found that amphipods were much more abundant in filamentous macroalgae than in the more complex 3D hosts. Filamentous algae did occur in greater densities, suggesting that amphipod abundance, and in general abundance of all epifauna, can be affected by how densely packed algal structures are naturally (Seed & O'Connor, Reference Seed and O'Connor1981). Indeed, the high surface area to volume ratio of filamentous algal mats as a consequence of their thinner forms makes available more space for particular epifaunal species to exploit in large numbers. Detailed comparisons of the colonizable area among macroalgal forms will help establish the precise relationship between habitat availability and abundance distribution of the associated invertebrates (Venier & Fahrig, Reference Venier and Fahrig1996).
While epifaunal abundance was highest in filamentous macroalgae, our results clearly showed that 3D species hosted the highest richness of invertebrates, most of which were not found in other algal morphologies (Supplementary Figure 2). This could be due to the greater variety of niches in the form of colonizable surfaces and spaces available in the thalli and associated branchlets and vesicles of 3D macroalgae that allow for increased resource partitioning and specialization among epifauna (Gee & Warwick, Reference Gee and Warwick1994a; Finke & Synder, Reference Finke and Synder2008; Thomaz & da Cunha, Reference Thomaz and da Cunha2010). Conversely, foliose species contained lower epifaunal diversity compared with 3D algae, probably due to fewer niches available in foliose macroalgae for organisms to exploit – the flat blades have relatively low structural complexity and variation to host different species of invertebrates (Parker et al., Reference Parker, Duffy and Orth2001).
The differences observed in epifaunal community structure among algal morphologies, particularly between 3D and filamentous species, may be due to specific host-epifaunal associations. For instance, many gastropods are host-specific because they graze on their macroalgal hosts and can be slow moving (see Howard, Reference Howard1985; Norderhaug et al., Reference Norderhaug, Christie and Rinde2002; Vermeij, Reference Vermeij2002). Among our samples, large numbers of the sea slug Placida sp. were present amongst filamentous Bryopsis spp., but it was rare and absent in foliose and 3D macroalgae respectively (Figure 3). This sea slug is known to feed on Bryopsis and also exhibits crypsis due to the retained chloroplasts enhancing background matching with its host (Trowbridge, Reference Trowbridge1992; Händeler & Wägele, Reference Händeler and Wägele2007). Among other gastropods, Volvatella sp. and Juliidae sp. were observed to be hosted specifically by the 3D structures of Caulerpa racemosa, Caulerpa racemosa var. turbinata and Caulerpa lentilifera, corroborating findings by Thompsen (Reference Thompsen1979) and Renard et al. (Reference Renard, Sabelli and Taviani1996). These specific associations drove the differences in epifaunal communities between 3D macroalgae and the structurally simpler filamentous and foliose species.
Habitat effects are known to influence the community structure and diversity of macroalgal-associated epifauna as each habitat faces distinct environmental regimes and may select for different species interactions (Grabowski et al., Reference Grabowski, Hughes, Kimbro and Dolan2005; Trussell et al., Reference Trussell, Ewanchuk and Matassa2006). These effects were not tested in this study – macroalgae were collected from different habitats including seagrass beds, rocky shores and coral reefs. While the variation among habitats was partitioned roughly by sampling site, future targeted collections at localities with multiple habitats could help discern the effects of habitat type on epifaunal assemblages. Epiphytic invertebrates may also utilize macroalgae for purposes which vary seasonally. For example, polychaete mortality is typically highest in warmer months, and pycnogonids can vary their diets according to seasonal food availability (Woodin, Reference Woodin1974; Soler-Membrives et al., Reference Soler-Membrives, Rossi and Munilla2011). More generally, outside the tropics, the abundance of intertidal animals from amphipods to ostracods are strongly influenced by the changing seasons (DeBlois & Leggett, Reference DeBlois and Leggett1993; Hull, Reference Hull1997). Although Singapore does not experience these climates, variations in temperature, precipitation and salinity driven predominantly by the monsoons can affect intertidal communities (see Sin et al., Reference Sin, Ang, Buurman, Lee, Leong, Ooi, Steinberg and Teo2016; Tan et al., Reference Tan, Acerbi and Lauro2016; Chou et al., Reference Chou, Huang, Tan, Toh, Goh, Tun and Sheppard2018). There are also emerging data demonstrating temperature-driven seasonal variation in the abundances of certain macroalgal species (Low & Chou, Reference Low, Chou, Phang and Lim2013; Low et al., Reference Low, Fong, Todd, Chou and Bauman2019). Therefore, future studies should consider longer-term sampling covering all the monsoonal phases to investigate the temporal variation of macroalgal-associated epifauna. A more even sampling of a wider range of algal morphologies and species could also be targeted to provide more generalizable results and to discover new epifaunal taxa.
Despite the large number (356) of good-quality COI sequences obtained, only 4.2% matched at ≥97% to available GenBank barcodes which have been identified to species, while there was not a single match at ≥97% to BOLD records. In other words, nearly all of the successfully sequenced individuals could not be identified to species level when searched against the global databases. While the majority of our sequences could be confidently matched to their expected morphological identities at the order level, the distances to matched records were too large for most epifauna to be identified more precisely. This lack of certainty and published barcode data emphasizes the need for more basic taxonomic research and collections to be performed on marine invertebrates that will contribute to the global COI databases.
This study is the first to use DNA barcoding to quantify the epiphytic invertebrates living amongst different tropical seaweeds. In conclusion, filamentous macroalgae hosted the highest abundance of epifauna, while 3D macroalgae contained the highest diversity of invertebrates. Epifaunal community structure was affected by site as well as by algal morphology, with differences more accentuated among algal morphologies. On the one hand, our finding of high invertebrate diversity in the most structurally complex epiphytic habitats – exemplified by the 3D macroalgae examined here – is in line with numerous past studies set in temperate ecosystems (Dean & Connell, Reference Dean and Connell1987; Gee & Warwick, Reference Gee and Warwick1994a, Reference Gee and Warwick1994b; Parker et al., Reference Parker, Duffy and Orth2001; Norderhaug et al., Reference Norderhaug, Christie, Andersen and Bekkby2012; Veiga et al., Reference Veiga, Rubal and Sousa-Pinto2014; but see Cacabelos et al., Reference Cacabelos, Olabarria, Incera and Troncoso2010). Invertebrate epifaunal patterns among tropical macroalgae are not as well understood, being sparsely characterized in localities such as Australia (Martin-Smith, Reference Martin-Smith1994), Tanzania (Tano et al., Reference Tano, Eggertsen, Wikström, Berkström, Buriyo and Halling2016) and the Caribbean (Lewis, Reference Lewis1987; Roff et al., Reference Roff, Wabnitz, Harborne and Mumby2013), so our study fills an important knowledge gap in Southeast Asia. On the other hand, the much higher epifaunal abundance in filamentous macroalgae even when compared with the 3D forms suggests that habitat complexity may not drive abundance as much as other factors such as packing density (Gee & Warwick, Reference Gee and Warwick1994b), colonizable space (Seed & O'Connor, Reference Seed and O'Connor1981) and shore height (Schreider et al., Reference Schreider, Glasby and Underwood2003).
More broadly, we have shown that tropical macroalgae can house a diverse array of invertebrates. The resolution of this study could be improved by detailed characterization of invertebrates in each host species and testing various habitat and environmental drivers of epifaunal community structure. Some of those observed here, including polychaetes and caprellids, have the potential to serve as indicator organisms for monitoring the health of habitats, particularly if their abundances co-vary with environmental quality (Pocklington & Wells, Reference Pocklington and Wells1992; Guerra-Garcia & Koonjul, Reference Guerra-Garcia and Koonjul2005). It remains uncertain as to whether macroalgae can serve as vital habitats for species conservation or recovery. Future studies ought to consider these implications in examining the role of seaweeds as a biological tool to help habitats recover from various stressors and recruit biodiversity.
Supplementary material
The supplementary material for this article can be found at https://doi.org/10.1017/S0025315419000900.
Acknowledgements
We are grateful to members of the Reef Ecology Lab (National University of Singapore) for assistance and support in the field and laboratory. In particular, we appreciate Jia Jin Marc Chang and Yin Cheong Aden Ip for advice in the lab, Yong Kit Samuel Chan for help with R and statistics, Mei Lin Neo for her input and giving a fresh perspective, and finally Zhi Ting Yip and Wan Wen Rochelle Chan for help in fieldwork and many other aspects. We thank Greg Rouse for assistance in the identification of annelids, and Arina Adom for help with Illumina barcoding.
Financial support
This work was supported by the National Research Foundation, Prime Minister's Office, Singapore under its Marine Science R&D Programme (MSRDP-P03).