


Introduction
The continuity of marine environments has resulted, historically, in the idea of genetic homogeneity in marine environments based on the idea of panmixia (Palumbi, Reference Palumbi1992; Cowen & Sponaugle, Reference Cowen and Sponaugle2009). In recent years, using molecular approaches, cases of hidden diversity and/or discontinued lineages of marine species have increased, resulting in the revision of the panmixia paradigm (Damasceno et al., Reference Damasceno, Siccha-Ramirez, Morales, Oliveira, Torres, Costa, Silva-Oliveira, Vallinoto, Machado, Tosta and Farro2015; Luz et al., Reference Luz, Reis, Sampaio, Barros and Fraga2015; Freitas et al., Reference Freitas, Sampaio and Schneider2017; Machado et al., Reference Machado, Damasceno, Bertoncini, Farro, Hostim-Silva and Oliveira2017b; Healey et al., Reference Healey, McKeown, Taylor, Provan, Sauer, Gouws and Shaw2018; Hernández et al., Reference Hernández, Barandica and Pizarro2018; Chen et al., Reference Chen, Li, Chen, Li, Yang, Li and Li2020; Neves et al., Reference Neves, Vieira, Sequeira, Paiva, Gordo and Paulo2020). The detection of these Molecular Operational Taxonomic Units (MOTUs) is extremely important for species conservation, since distinct management practices may be necessary to prevent the mixture and/or loss of different gene pools (Frankham et al., Reference Frankham, Ballou and Briscoe2008). Therefore, investigating population structures, mainly of commercially exploited species, is a crucial step towards the conservation of their genetic heritage. Pomatomus saltatrix (Linnaeus, 1766), popularly known as the bluefish, stands out as a biological model for the evaluation of molecular units.
The only representative of the Pomatomidae family (Nelson et al., Reference Nelson, Grande and Wilson2016), P. saltatrix is a species of great economic importance across the world, with a pelagic habitat and occurring in coastal and oceanic, tropical and subtropical waters with temperatures varying between 18–27 °C (Tortonese, Reference Tortonese, Whitehead, Bauchot, Hureau, Nielsen and Tortonese1986; Juanes et al., Reference Juanes, Hare and Miskiewicz1996, Reference Juanes, Buckel and Scharf2002). Its wide distribution can be associated with its high dispersal ability, especially through large group migrations of adult individuals during reproductive periods (Wilk, Reference Wilk1977; Miralles et al., Reference Miralles, Juanes and Garcia-Vazquez2014a), which can be influenced by seasonal changes in water temperature (Hare & Cowen, Reference Hare and Cowen1996; Juanes et al., Reference Juanes, Hare and Miskiewicz1996). This species has high commercial value and can reach 130 cm total length and weight of ~15 kg, acting as an important pelagic fishing resource, as well as a subject of industrial, recreational and artisanal fishing in different countries (Juanes et al., Reference Juanes, Hare and Miskiewicz1996; Carpenter et al., Reference Carpenter, Ralph, Pina Amargos, Collette, Singh-Renton, Aiken, Dooley and Marechal2015).
The fishing pressure exerted on this species since the 1960s is reflected in the decline in the amounts of this fish caught and has resulted in the species being categorized globally as ‘Vulnerable’ (IUCN – International Union for Conservation of Nature; Carpenter et al., Reference Carpenter, Ralph, Pina Amargos, Collette, Singh-Renton, Aiken, Dooley and Marechal2015), with local assessments revealing different scenarios (Europe ‘Near Threatened’, Mediterranean and Gulf of Mexico ‘Least Concern’; Bizsel et al., Reference Bizsel, Yokes, Pollard, Kara, Bariche and Quignard2011; Collette & Abad-Uribarren, Reference Collette and Abad-Uribarren2015; Pina Amargos & Collette, Reference Pina Amargos and Collette2015). Reported global landings of P. saltatrix had an increasing trend until 1983, before declining. Since then, negative oscillations were seen until the last data update in 2018 (Pauly et al., Reference Pauly, Zeller and Palomares2020; additional details about catch values are available in Sea Around Us <seaaroundus.org> as interactive graphics; the cut-out of this graphic also can be found in Supplementary Figure S1).
The wide distribution of this species covers different environmental and ecological conditions, revealing great plasticity in terms of spawning season, number of reproductive peaks along the year, and reproduction zones, for example (Juanes et al., Reference Juanes, Hare and Miskiewicz1996). Although there is little information surrounding the genetic structure and diversity of this species, regional assessments have detected population differences in geographically related schools that may represent potential species (Goodbred & Graves, Reference Goodbred and Graves1996; Turan et al., Reference Turan, Oral, Öztürk and Düzgüneş2006; Pardiñas et al., Reference Pardiñas, Campo, Pola, Miralles, Juanes and Garcia-Vazquez2010; Miralles et al., Reference Miralles, Juanes, Pardiñas and Garcia-Vazquez2014b). This scenario highlights the necessity of the identification of potential evolutionary units for the effective management of this species, with the aim of conserving its genetic patrimony. Furthermore, many monotypic genera, when widely distributed as P. saltatrix, can be divided into new taxa and/or evolutionary units (e.g. Phalloceros caudimaculatus – Lucinda, Reference Lucinda2008; Octopus vulgaris – Amor et al., Reference Amor, Norman, Roura, Leite, Gleadall, Reid and Hochberg2017; Pogonias cromis – Azpelicueta et al., Reference Azpelicueta, Delpiani, Cione, Oliveira, Marceniuk and Díaz de Astarloa2019; Ommastrephes bartrami – Fernández-Álvarez et al., Reference Fernández-Álvarez, Braid, Nigmatullin, Bolstad, Haimovici, Sánchez and Villanueva2020). Thus, the status of P. saltatrix as a monotypic species should be investigated mainly due to both the wide-ranging and ecological plasticity.
As such, using grouping methods in sequences of the Cytochrome C Oxidase Subunit 1 (COI) barcode region has proven to be an efficient tool for a better identification of species richness (Ward et al., Reference Ward, Zemlak, Innes, Last and Hebert2005; da Silva Oliveira et al., Reference da Silva Oliveira, Michonneau and da Cruz Lotufo2017; Moraes et al., Reference Moraes, Pavan and Lima2019). There are different approaches based on distance (DNA barcoding) and coalescent methods. Distance methods are based on the barcoding gap hypothesis, where the intraspecific variation must be lower than interspecific variation (Hebert et al., Reference Hebert, Cywinska, Ball and Dewaard2003; Meyer & Paulay, Reference Meyer and Paulay2005). Coalescent methods combine population genetics and phylogenetics to delimit the MOTUs (Pons et al., Reference Pons, Barraclough, Gomez-Zurita, Cardoso, Duran, Hazell, Kamoun, Sumlin and Vogler2006). Both approaches are very useful to taxonomy, since traditional approaches based on morphological characteristics cannot identify cryptic species and may underestimate the real diversity of taxa (Bickford et al., Reference Bickford, Lohman, Sodhi, Ng, Meier, Winker, Ingram and Das2007; Pinto et al., Reference Pinto, Ojala-Barbour, Brito, Menchaca, Carvalho, Weksler, Amato and Lee2018) including fishes (Berbel-Filho et al., Reference Berbel-Filho, Ramos, Jacobina, Maia, Torres and Lima2018; Jacobina et al., Reference Jacobina, Lima, Maia, Souza, Batalha-Filho and Torres2018, Reference Jacobina, Torres, Roberto, de Mello Affonso, dos Santos, Calado and de Araújo Bitencourt2020). In addition to solving taxonomic uncertainties (Machado et al., Reference Machado, Ishizuka, Freitas, Valiati and Galetti2017a), the barcode region COI can be useful for the identification of species from early stages of development (Hubert et al., Reference Hubert, Delrieu-Trottin, Irisson, Meyer and Planes2010; Almeida et al., Reference Almeida, Frantine-Silva, Lima, Garcia and Orsi2018), detecting market fraud (Barbuto et al., Reference Barbuto, Galimberti, Ferri, Labra, Malandra, Galli and Casiraghi2010; Carvalho et al., Reference Carvalho, Palhares, Drummond and Frigo2015, Reference Carvalho, Guedes, da Gloria Trindade, Coelho and de Lima Araujo2017), phylogenetic studies and can aid in management and conservation practices (van Velzen et al., Reference van Velzen, Bakker and van Loon2007; Healey et al., Reference Healey, McKeown, Taylor, Provan, Sauer, Gouws and Shaw2018; Souza et al., Reference Souza, Affonso, Bitencourt, Sampaio and Carneiro2018; Zhao et al., Reference Zhao, Kong, Yu and Li2018; Kim et al., Reference Kim, Lee, Mutanen, Seung and Lee2020).
Thus, this study aimed to evaluate the evolutionary cohesion of geographically different Pomatomus saltatrix stocks, throughout its distribution in different oceans. We specifically asked if P. saltatrix is composed of more than one evolutionary unit, which introduces the hypothesis that it could be a genus composed of cryptic species, since different genetic groups have been identified in previous studies (Goodbred & Graves, Reference Goodbred and Graves1996; Turan et al., Reference Turan, Oral, Öztürk and Düzgüneş2006; Pardiñas et al., Reference Pardiñas, Campo, Pola, Miralles, Juanes and Garcia-Vazquez2010; Miralles et al., Reference Miralles, Juanes, Pardiñas and Garcia-Vazquez2014b). For this, we used traditional genetic approaches and modern coalescent methods of species delimitation. Furthermore, we evaluated the historical mechanisms responsible for the genetic diversity and diversification of molecular evolutionary units of this species, as well as its genetic diversity, with the aim of contributing to future management plans.
Materials and methods
DNA extraction, amplification, sequencing and alignments
Samples of muscular tissue from six specimens of Pomatomus saltatrix from the Caribbean were obtained (Islas Margaritas, Venezuela), stored in 96% ethanol and kept at −20 °C. The total genomic DNA was extracted from each sample with the help of the DNeasy Tissue (Qiagen®) kit, following the protocol suggested by the manufacturer. The samples were visualized through electrophoresis in 1% agarose gel, coloured with Gelred™ and visualized under ultraviolet light. Given the abundancy of COI barcode database, a region of ~650 bp was amplified, via PCR, in both directions using the universal forward FishF1 (5′TCAACCAACCACAAAGACATTGGCAC3′) and reverse FishR2 primers (5′ACTTCAGGGTGACCGAAGAATCAGAA3′), described by Ward et al. (Reference Ward, Zemlak, Innes, Last and Hebert2005). The reactions were performed with a final volume of 25 μl which comprised: 12.5 μl of 2× Tay Pol Master Mix (Vivantis®), 0.5 μl of each primer (10 mM), 0.5 μl of magnesium chloride (50 mM), 2 μl of genomic DNA (40 ng μl−1) and 9 μl of ultrapure water. The amplification cycle consisted of an initial step of 2 min at 95 °C, followed by 35 cycles of 30 s at 94 °C, 30 s at 57 °C and 2 min at 72 °C with a final extension of 10 min at 72 °C. The amplifications were purified using ExoSap-IT® (Affimetrix®), in accordance with the protocol provided by the manufacturer. The samples were sequenced in forward and reverse directions using the kit ‘Bigdye Terminator v 3.1 Cycle Sequencing Ready Reaction’ (Applied Biosystems), using a capillary sequencing technique using the automatic sequencer ABI 3500-Applied Biosystems. The generated sequences were deposited in GenBank with access codes MN199456–MN199461.
Furthermore, an additional 154 COI sequences that were obtained from NCBI/GenBank and included on BIN AA9142 (Barcode Index Number) of BOLD (Barcode of life database) were added to our dataset. The content of each database was compared rigorously to avoid duplicated sequences in BOLD and GenBank databases. However, the sequences EU263791, GBMND68177 and ERDK030 were removed due to noise in the alignment. In total, 157 P. saltatrix sequences were included in the analyses (Figure 1; Supplementary Table S1). These sequences were from the Western North Atlantic Ocean, Gulf of Mexico, Caribbean Sea, Western and Eastern South Atlantic Oceans, Mediterranean Sea, Sea of Marmara, Black Sea, Indian Ocean and South Pacific Ocean. This is the first global genetic diagnosis of P. saltatrix.

Fig. 1. Map of sampling locations and the geographic distributions of the five MOTUs for P. saltatrix. The different colours in the pie charts correspond to the five MOTUs (see Figures 2, 3 and Supplementary Figure S2 for more details about the MOTUs identifications), based on the FAOs regions. The grey values represent the sample size (N) of each site. (WNA: Western North Atlantic; GM: Gulf of Mexico; CS: Caribbean Sea; WSA: Western South Atlantic; MES: Mediterranean Sea; MS: Sea of Marmara; ESA: Eastern South Atlantic; IO: Indian Ocean; SP: South Pacific).
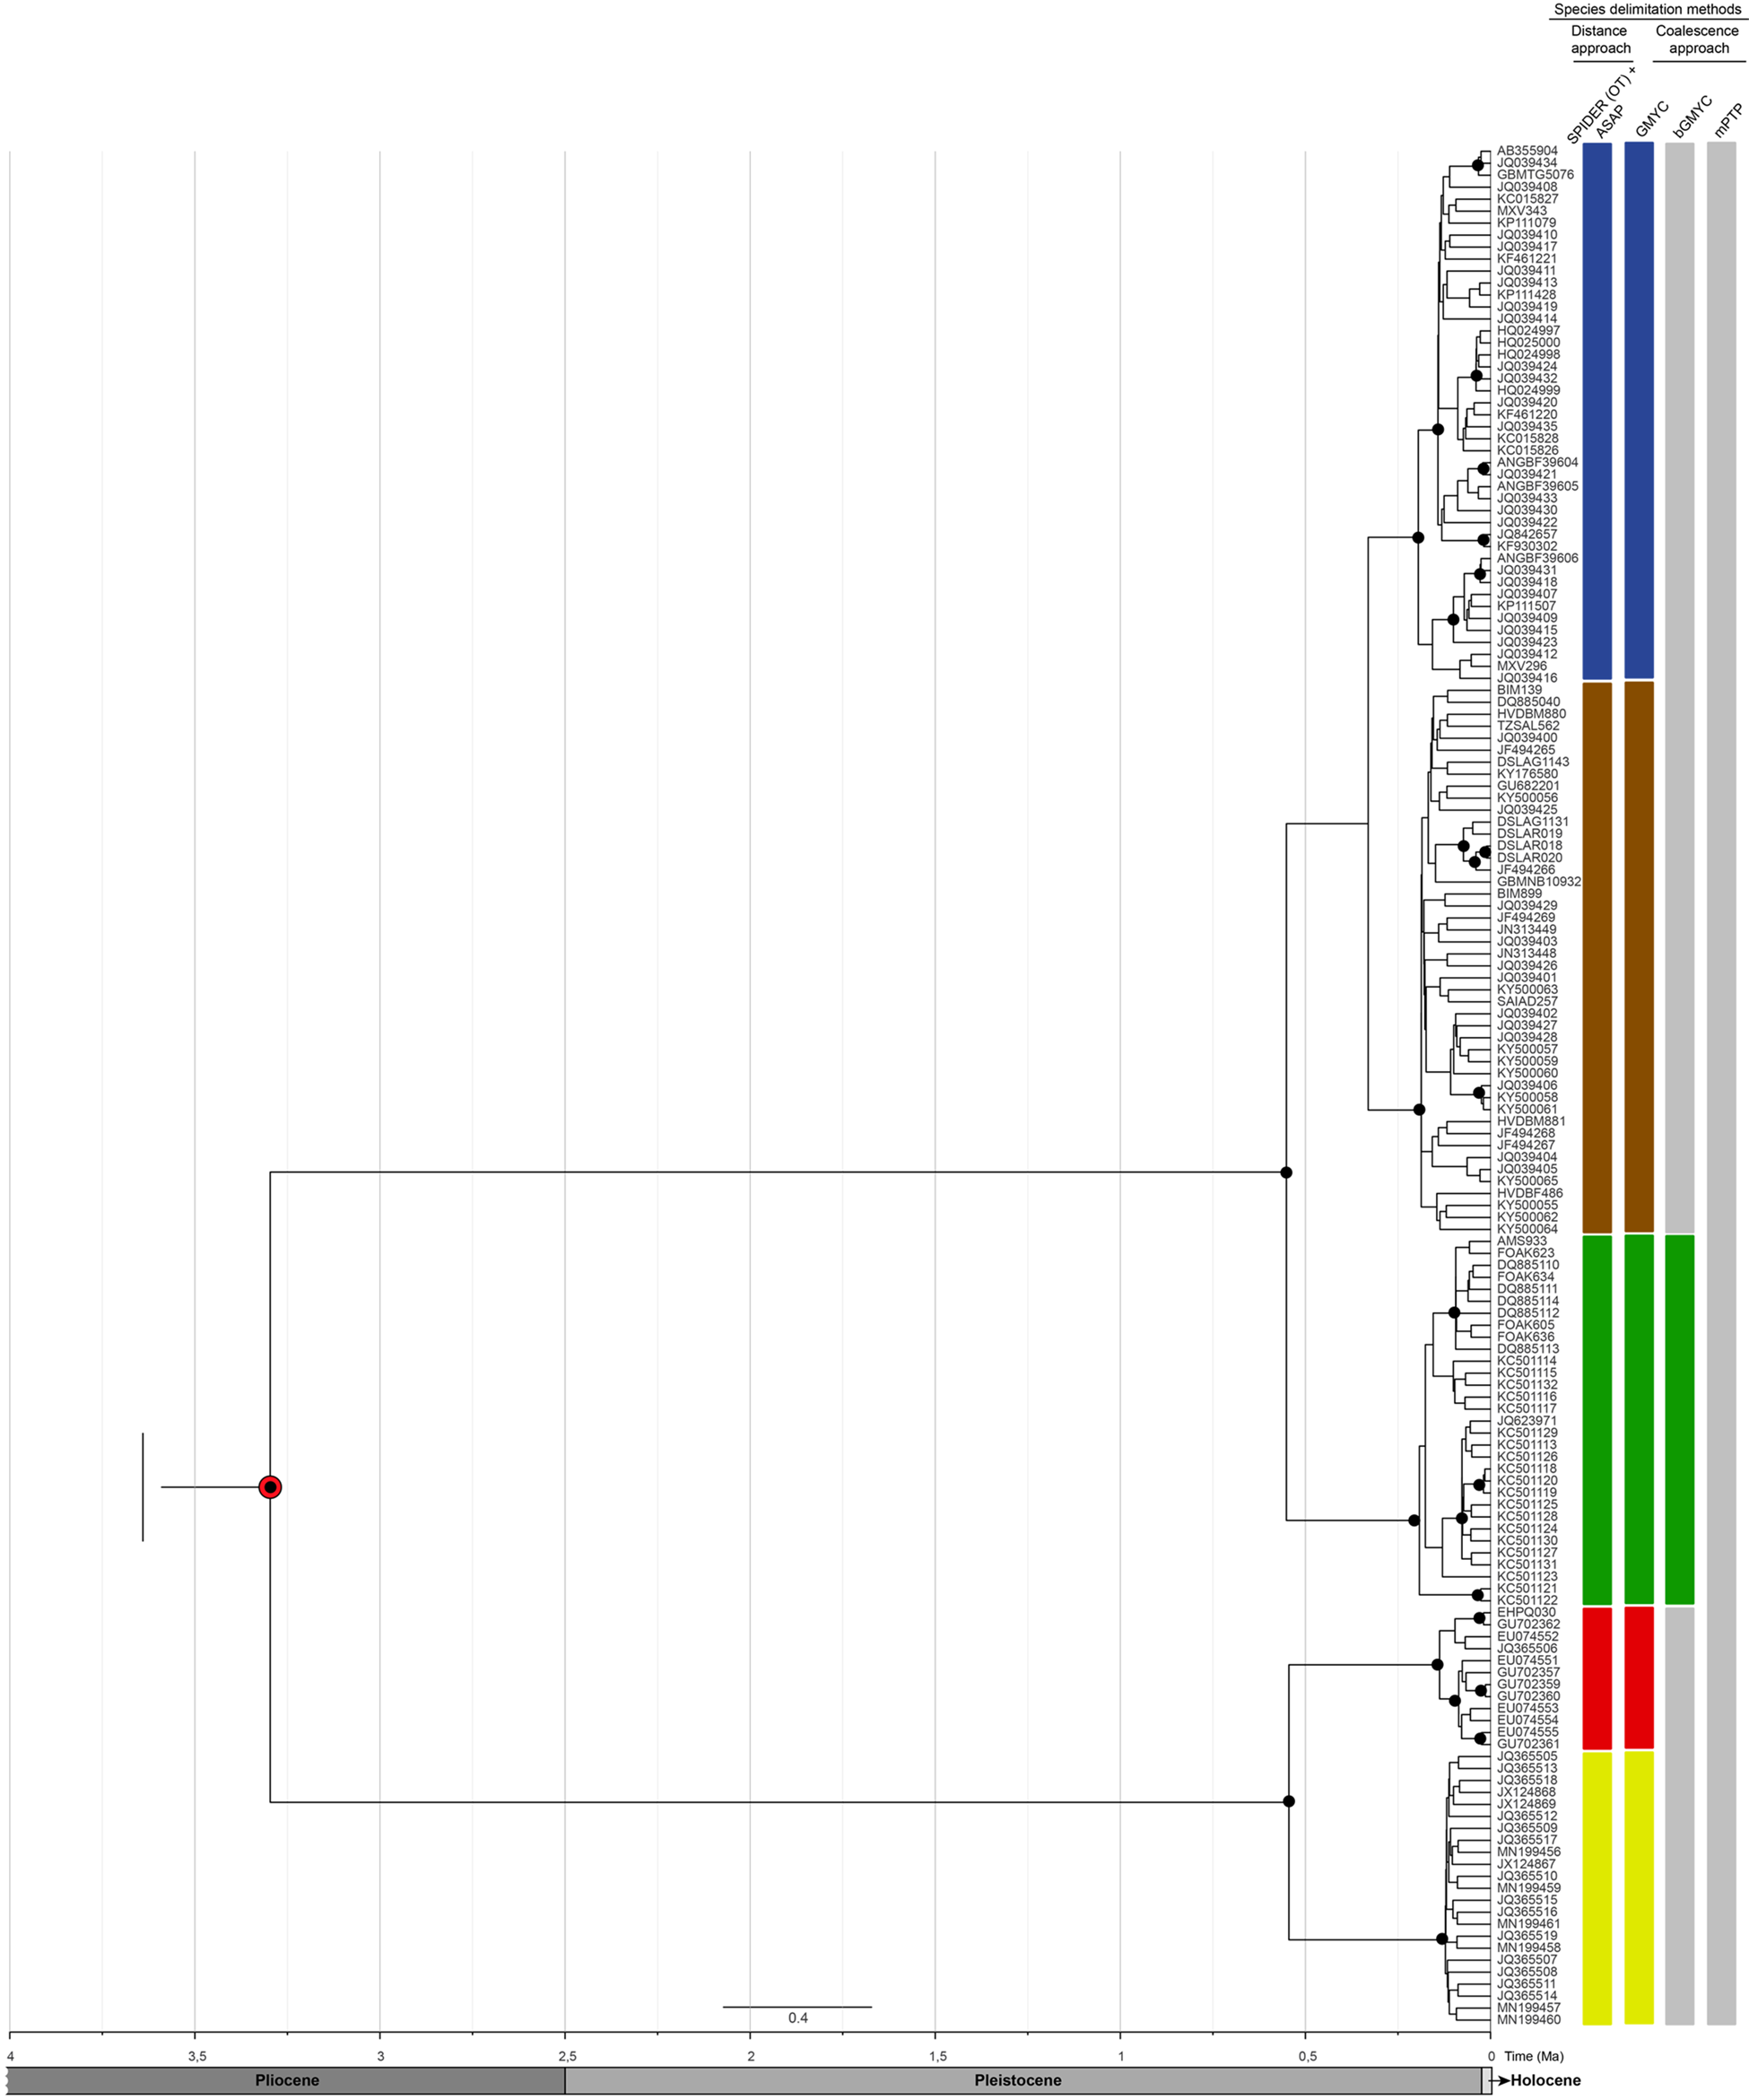
Fig. 2. Bayesian inference calibrated topology of Pomatomus saltatrix based on COI sequences and species delimitation approaches based on distance (SPIDER and ASAP) and coalescence (GMYC, bGMYC and mPTP) methods. The different coloured bars represent the MOTUs (for more details about MOTUs distribution, see Figure 1). The black circles represent posterior probabilities higher than 0.9. The red circle represents the calibrated node based on P. saltatrix fossil (Purdy et al., Reference Purdy, Applegate, McLellan, Meyer and Slaughter2001).
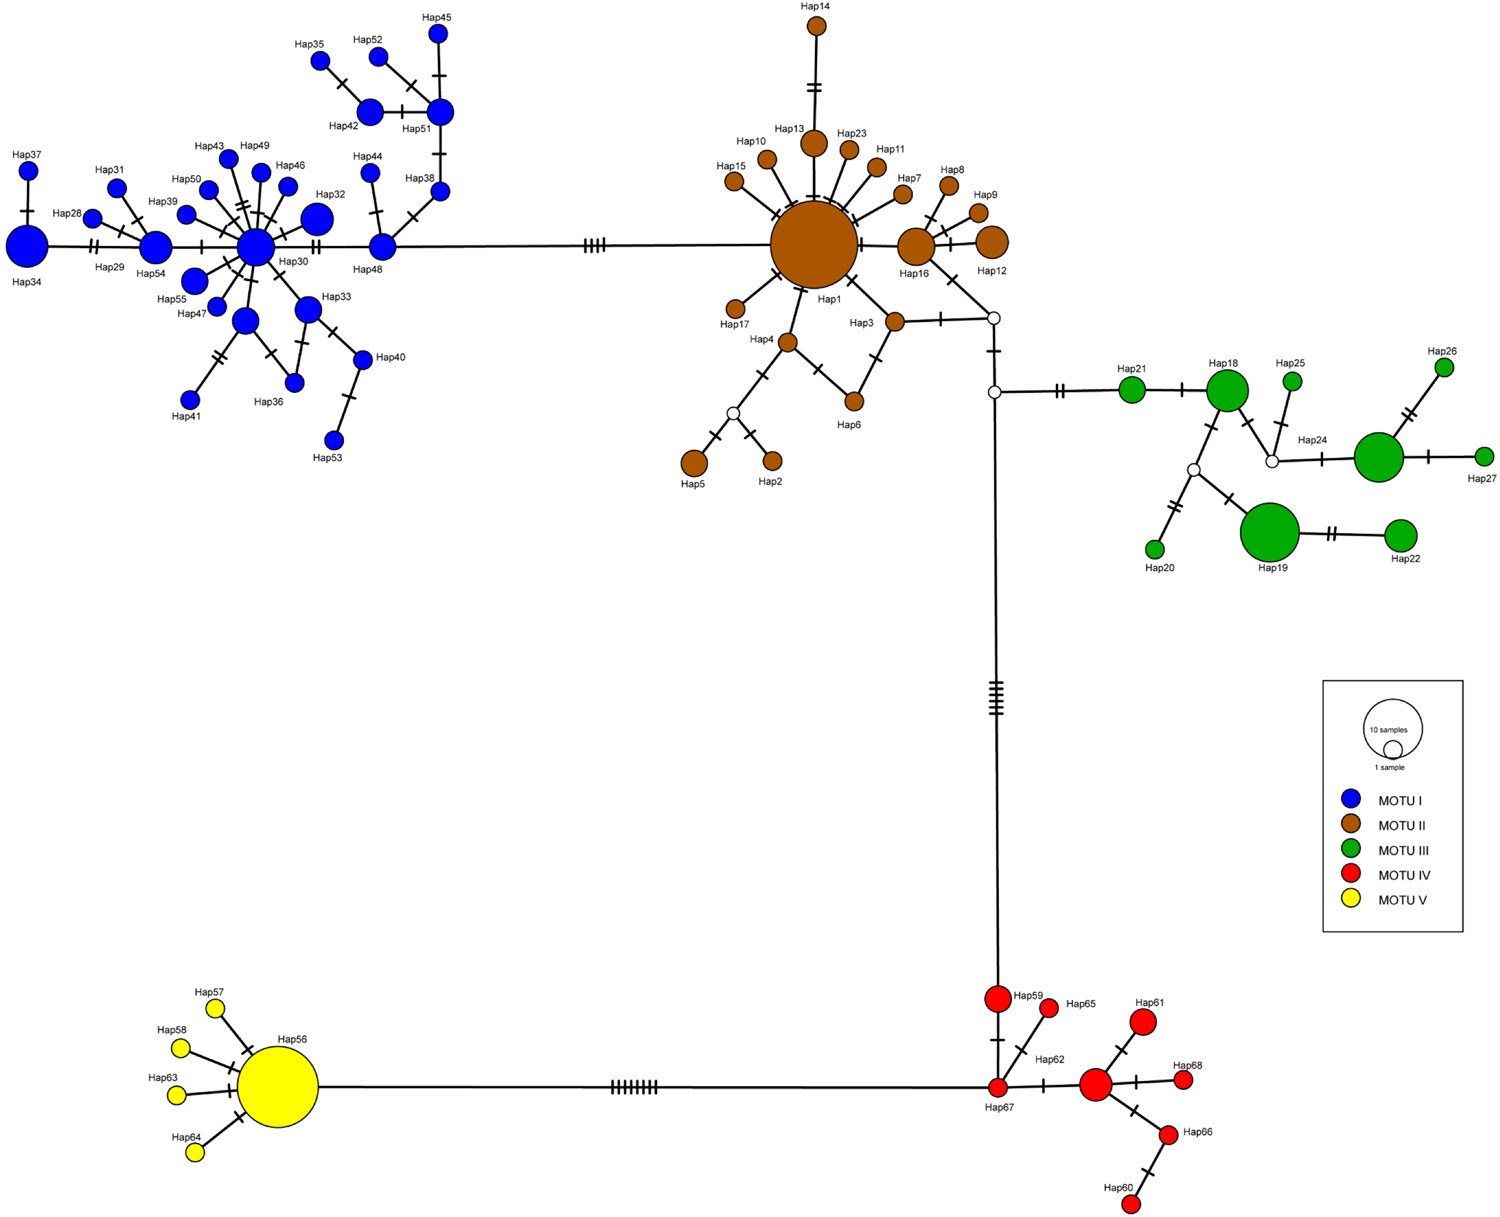
Fig. 3. Haplotype network based on TCS method generated in PopART of Pomatomus saltatrix. The circles represent the haplotypes, and different colours represent the MOTUs (for more details about haplotype distribution, see Supplementary Table S1 and Figure S3). Lines between the haplotypes represent the mutation steps and white circles are missing or unidentified haplotypes.
Species delimitation methods and time divergence estimates
All the sequences were aligned and edited using the ClustalW (Thompson et al., Reference Thompson, Higgins and Gibson1994) algorithm in BioEdit Sequence Alignment Editor v.7.0. (Hall, Reference Hall1999), through multiple alignments using the values 15 and 0.3 for gap openings and extensions, respectively (Hall et al., Reference Hall, Biosciences and Carlsbad2011). To assess the cryptic diversity and identify possible MOTUs, we used two approaches: distance (traditional DNA barcoding and Assemble Species by Automatic Partitioning – ASAP) and coalescence (General Mixed Yule Coalescent – GMYC, Bayesian General Mixed Yule Coalescent – bGMYC, Bayesian implementation of Poisson Tree Processes – bPTP, and Multi-rate Poisson Tree Processes – mPTP). The MOTUs consisted of groups of sequences that acted as molecular entities which can or cannot represent a species (Blaxter et al., Reference Blaxter, Mann, Chapman, Thomas, Whitton, Floyd and Abebe2005; Jones et al., Reference Jones, Ghoorah and Blaxter2011). For all analysis, we used a multiple DNA sequences alignment for preserving the geographic information once we had shared haplotypes between different ocean basins. Because we employed different approaches to delimitate the MOTUs, the best species delimitation model for P. saltatrix will be determined from congruent results across methods and biological sense (geographic information, for example). We will also avoid MOTUs classified as singleton, which are composed of one sequence.
DNA barcoding uses the genetic distance between the COI sequence pairs and assumes that interspecific differences are greater compared with intraspecific differences (Hebert et al., Reference Hebert, Cywinska, Ball and Dewaard2003), due to the choice of an optimal threshold (OT). An OT was estimated from the present dataset through the localMinima function, implemented in the SPIDER package (SPecies IDentity and Evolution in R – Brown et al., Reference Brown, Collins, Boyer, Lefort, Malumbres-Olarte, Vink and Cruickshank2012) in R (R Core Team, 2017; https://www.R-project.org/). Once the OT was defined, the jMOTU v.4.1 software was employed (Jones et al., Reference Jones, Ghoorah and Blaxter2011) for the delimitation of MOTUs. The ASAP method (Puillandre et al., Reference Puillandre, Brouillet and Achaz2021) was performed on the program web-interface (https://bioinfo.mnhn.fr/abi/public/asap/), using K80 as the nucleotide substitution model, and all the other parameters were set as default. The ASAP delimitation was defined considering the partition showing the lowest ASAP-score.
The coalescent methods (GMYC, bGMYC, bPTP and mPTP) were based on phylogenetic trees and are related to the phylogenetic concept of the species (Eldredge & Cracraft, Reference Eldredge and Cracraft1980; Nelson, Reference Nelson, Otte and Endler1989). The GMYC and bGMYC (Pons et al., Reference Pons, Barraclough, Gomez-Zurita, Cardoso, Duran, Hazell, Kamoun, Sumlin and Vogler2006; Reid & Carstens, Reference Reid and Carstens2012) are methods that aim to estimate the transition point, in an ultrametric tree, between the intraspecific (populational/coalescent) and interspecific (speciation/extinction) processes, based on branching rates over time. The pre-transitional nodes represent speciation events, and the post transitional nodes represent the coalescences within species (Pons et al., Reference Pons, Barraclough, Gomez-Zurita, Cardoso, Duran, Hazell, Kamoun, Sumlin and Vogler2006). The main difference between them is that the GMYC employed a consensus tree obtained from the software that implements Bayesian searches, while bGMYC uses multiple trees from the posterior distribution of trees from Bayesian analyses, which is an interesting approach due the stochasticity of Markov Chain Monte Carlo search. For the reconstruction of the ultrametric tree, firstly, the nucleotide substitution model was estimated in jModelTest v.2.1.7 (Posada, Reference Posada2008) under the Bayesian Information Criterion (K80 + I). The Bayesian Inference (BI) topology was reconstructed in BEAST v.2.4.7 (Bouckaert et al., Reference Bouckaert, Heled, Kühnert, Vaughan, Wu, Xie, Suchard, Rambaut and Drummond2014) under the following conditions: relaxed molecular clock with a lognormal distribution and Yule speciation model. Three independent runs with 30 million MCMC, where trees and parameters were saved every 10,000 generations with a burn-in of 25%. The results were then combined using the LogCombiner v.2.4.7 of the BEAST software (Drummond et al., Reference Drummond, Suchard, Xie and Rambaut2012). The ESS values (Effective Sample Size; >200) for the convergence of the estimated parameters were verified used Tracer v.1.5 (Rambaut et al., Reference Rambaut, Suchard and Drummond2009). Posteriorly, the GMYC was performed using SPLITS (SPecies Limits by Threshold Statistics – Monaghan et al., Reference Monaghan, Wild, Elliot, Fujisawa, Balke, Inward, Lees, Ranaivosolo, Eggleton, Barraclough and Vogler2009) on the R platform (https://www.r-project.org/). We used the single threshold method, where a single point of transition between intra- and interspecific events and a default parameter interval is calculated (interval = c (1.10)). For bGMYC we sampled a set of 100 trees of posterior distribution of the BEAST runs using bGMYC package (Reid & Carstens, Reference Reid and Carstens2012) in R platform, following the settings recommended by the authors.
The other used methods were bPTP and mPTP (Zhang et al., Reference Zhang, Kapli, Pavlidis and Stamatakis2013; Kapli et al., Reference Kapli, Lutteropp, Zhang, Kobert, Pavlidis, Stamatakis and Flouri2017) which, different to the above analysis, used the number of substitutions to establish relationships within and between species. Thus, it assumes that the number of substitutions between species is greater than the number of substitutions within species. The analysis requires a non-ultrametric tree, which was generated using MrBayes v.3.1.1 (Huelsenbeck et al., Reference Huelsenbeck, Ronquist, Nielsen and Bollback2001; Ronquist & Huelsenbeck, Reference Ronquist and Huelsenbeck2003), from the 10 million MCMC and a burn-in of 25%. The bPTP method was performed using an online server (http://species.h-its.org/ptp/), using 400,000 MCMC generations with a thinning value = 100 and burn-in = 25%. The mPTP was also conducted in an online server (https://mptp.h-its.org/#/tree).
To understand the diversification processes of P. saltatrix MOTUs, the divergence times were estimated among the MOTUs. For this, we added a specimen of Acanthocybium solandri (Cuvier, 1829) as an external group to our dataset (Betancur-R et al., Reference Betancur-R, Broughton, Wiley, Carpenter, López, Li and Zhang2013). Ultrametric Bayesian topology calibration was performed using two approaches: the first used a fossil (Purdy et al., Reference Purdy, Applegate, McLellan, Meyer and Slaughter2001) and the other used the mutational rate of the COI marker in P. saltatrix (1.2% per site per million years – Miralles et al., Reference Miralles, Juanes, Pardiñas and Garcia-Vazquez2014b). For this analysis, we used the HKY + G + I substitution model, relaxed clock with a normal distribution and Birth and Death model as a prior tree. The fossil record used to calibrate the topology was described from the ‘Yorktown Formation’ in Lee Creek Mine, NC, USA, which it is dated between 4.8 and 2.8 million years ago (Ma) (Hobbs, Reference Hobbs2009). Since the fossil was described as Pomatomus saltatrix, we used it as a Most Recent Common Ancestor – MRCA – of Pomatomus (crown-group). For this calibration point, we implemented an exponential prior offset to 2.8 Ma (minimum age of the clade), with a mean of 0.7. We performed two independent runs of 600 million interactions, sampled at intervals of 100,000 generations with 25% burn-in. The convergence of parameter values was assessed in Tracer v.1.5 (Rambaut et al., Reference Rambaut, Suchard and Drummond2009). Following these procedures, the divergence times of the lineages were related to known climatic events, with the aim of elucidating which historical processes were responsible for MOTUs diversification.
Genetic diversity, population structure and demographic history analysis
The genetic diversity indexes (number of haplotypes (h), polymorphic sites (S), nucleotide (π) and haplotype diversity (Hd)) were obtained through DnaSP v.5.1 (Librado & Rozas, Reference Librado and Rozas2009). These values were calculated per sample site (oceanic basin) and by previously determined MOTUs. Because we had unequal sampling sizes, we applied a rarefaction method using the rarefy function in the R package vegan (Oksanen et al., Reference Oksanen, Blanchet, Friendly, Kindt, Legendre, McGlinn, Minchin, O'Hara, Simpson, Solymos, Stevens, Szoecs and Wagner2018) to provide an unbiased comparison in haplotype richness (Hr) among MOTUs. In the investigation regarding the relationships among haplotypes and their geographic distributions, a haplotype network was built in the software PopART using the TCS method (Clement et al., Reference Clement, Snell, Walker, Posada and Crandall2002; Leigh & Bryant, Reference Leigh and Bryant2015).
Genetic differentiation was tested using pairwise F ST comparisons in ARLEQUIN v.3.0 (Excoffier et al., Reference Excoffier, Laval and Schneider2005) and they were calculated using 1000 permutations (P < 0.05). The Analysis of Molecular Variance (standard AMOVA), using 1000 permutations (P < 0.05), was also performed in ARLEQUIN v.3.0. For this analysis, two structuring hypotheses were tested: (a) all the samples belong to a single unit (null hypothesis) and (b) all molecular units were determined by species delimitation methods. Furthermore, the genetic distances between the molecular units were calculated using the software MEGA X v.10.2.2 (Kumar et al., Reference Kumar, Stecher, Li, Knyaz and Tamura2018) employing the Kimura-2-parameter model (K2P; Kimura, Reference Kimura1980).
The Mismatch Distribution analysis was used to estimate expansions or population bottlenecks through DnaSP 5.1 (Rogers & Harpending, Reference Rogers and Harpending1992; Librado & Rozas, Reference Librado and Rozas2009). Demographic oscillations for each MOTUs were also investigated using a Bayesian Skyline Plot (BSP – Drummond et al., Reference Drummond, Rambaut, Shapiro and Pybus2005) performed on BEAST v.2.4.7 (Bouckaert et al., Reference Bouckaert, Heled, Kühnert, Vaughan, Wu, Xie, Suchard, Rambaut and Drummond2014), using the same mutational rate as used for the calibration (1.2% per site per million years – Miralles et al., Reference Miralles, Juanes, Pardiñas and Garcia-Vazquez2014b). The best evolutionary model for each MOTU was determined in jModelTest v.2.1.7 (Posada, Reference Posada2008), using the Bayesian Information Criterion. All MOTUs were set to evolve by the K80 model, except MOTU I, whose model was K80 + I. Three independent runs of 10 million MCMC interactions, using a burn-in of 25%, were performed for all MOTUs, except for MOTU V, which had four runs, due to chain convergence issues. These runs (log and trees files) were combined using LogCombiner in BEAST v.2.4.7, and the effective sampling size (>200) was checked in Tracer v.1.7.1 (Rambaut et al., Reference Rambaut, Suchard and Drummond2009) and the BSP reconstructed.
Results
Molecular Operational Taxonomic Units and divergence time estimation
The final alignment of the COI sequences had 570 bp containing 63 polymorphic sites, of which 41 were parsimoniously informative. Insertions, deletions and stop codons were not observed in the final alignment, indicating that pseudogenes were not present, avoiding paralogue analyses.
For the species delimitation analysis based on the traditional distance approach, the estimated OT was 0.0074 (0.74%), equivalent to 4 bp for the dataset. Five MOTUs were identified from this value as the intra- and interspecific limits (Figure 2) which belong, generally, to different geographic locations: (a) MOTU I: Western North Atlantic cold waters, covering the coasts of the USA, Canada and the Gulf of Mexico, (b) MOTU II: Mediterranean Sea and adjacent seas, covering Turkey, Tunisia and part of southern Spain, Eastern South Atlantic, the coast of Namibia, the Indian Ocean and the coast of South Africa, (c) MOTU III: Southern Pacific Ocean (Australia) and Sea of Marmara (Turkey), (d) MOTU IV: South Atlantic, represented by the State of São Paulo (Brazil) and Buenos Aires, Mar del Plata (Argentina), and (e) MOTU V: Caribbean Sea (Venezuela), represented by the State of Nueva Esparta, and the Brazilian South Atlantic, represented by the States of São Paulo and Rio de Janeiro. The ASAP distance method found the same pattern with the lowest ASAP-score (Figure 2).
In analyses based on the coalescent methods, only GMYC corroborated the distance analyses, identifying five units (Figure 2), with the maximum likelihood value (ML = 1485.702) for this model significantly higher (P < 0.05) than the null model (ML0 = 1359.036). On the other hand, the bGMYC model only identified three MOTUs (Figure 2). MOTU A was equivalent to the grouping of the Western North and South Atlantic and Mediterranean Sea, Indian Ocean and South Pacific Ocean (joining MOTUs I, II and III). MOTUs B and C were equivalent to MOTUs IV and V, respectively, identified in previous analyses. For both methods, singletons (MOTUs represented by a single sequence) were not identified. The mPTP method grouped all sequences in one single species. The bPTP showed a lot of singletons (105 singletons), and, therefore, we did not include these results. Our best species delimitation model based on congruence across methods and absence of singletons revealed five MOTUs. Although in IB topology the deep nodes are not supported, the five MOTUs had probabilities over 0.9. Estimates of Pomatomus saltatrix divergence time among the five identified MOTUs indicated that the processes of differentiation began in the Pliocene (~3.3 Ma, IC = 2.8–4.37). This showed a dichotomous event, where two clades were formed: (a) Western North Atlantic, Eastern South Atlantic, Indian Ocean, Mediterranean Sea, Sea of Marmara and South Pacific and (b) Caribbean Sea and Western South Atlantic.
Genetic diversity, population structure and demographic history
The 157 sequences were composed of 68 haplotypes of which 44 were unique and, in general, the species showed high levels of haplotype and nucleotide diversity (Table 1). The haplotype richness for all MOTUs was corrected for sample size and evidenced that MOTUs III and V had the lowest rarefaction haplotype richness (Supplementary Figure S2). The rarefaction curves of haplotype richness showed that our sampling was incomplete, especially for MOTUs I, II, and IV. The haplotype network showed that these haplotypes were distributed across five distinct haplogroups (Figure 3; Supplementary Figure S3) equivalent to the identified MOTUs.
Table 1. Genetic diversity indexes for COI marker of Pomatomus saltatrix for the sampling locations (ocean basins) and the five MOTUs identified by distance and GMYC methods
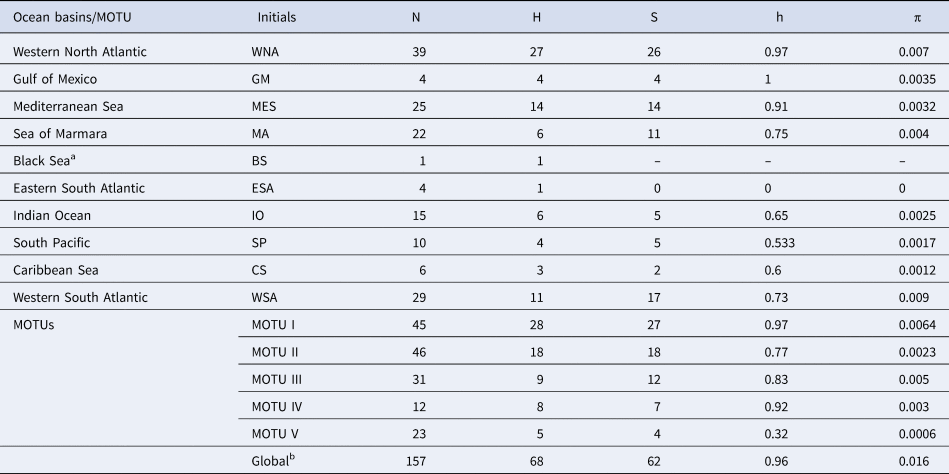
N, Sample size; H, Haplotype number; S, Polymorphic sites; h, Haplotype diversity; π, Nucleotide diversity; MOTU, Molecular Operational Taxonomic Unit.
1Since the Black Sea has only one sample, the genetic diversity parameters could not be calculated; bThe final database was composed by 157 samples, with two without geographic information.
The AMOVA considering the existence of a single group, presented a F ST value of 0.73 (P < 0.05), demonstrating a greater difference between the sample sites (73.04%) (Table 2). Similarly, considering the presence of five distinct units, the analysis presented a F ST value of 0.814 (P < 0.05), demonstrating a greater difference between the groups (77.4%) (Table 2). The pairwise F ST between the five MOTUs presented significant values varying between 0.67–0.91, whereas the genetic distances were 1.4–2.86% (Table 3).
Table 2. AMOVA for COI marker of Pomatomus saltatrix considering all samples in one unit (null hypothesis) and the five units identified by distance and GMYC approaches (MOTUs)

The italic values represent the major variation font. *Significant values (P < 0.05).
Table 3. Pairwise F ST differentiation (below diagonal) and mean genetic distance percentages for the K2P model (above diagonal) for the five molecular units of Pomatomus saltatrix COI marker identified by distance and GMYC approaches

*Significant F ST values (P < 0.05).
Due to the profound genetic differentiation among MOTUs, the demographic analyses were performed one by one, separately. The Mismatch distribution analysis, for both models and units, presented a unimodal distribution, except for MOTU V, with a possible contraction in population size (Supplementary Figure S3). In general, the BSP results agreed with the Mismatch analyses, where MOTUs I and II presented a recent population expansion and MOTUs IV and V showed a stable pattern. Retraction in the population size was identified only for MOTU III (Figure 4).

Fig. 4. BSP of each Pomatomus saltatrix MOTU. The y axis represents population size, and the x axis the time in years. The blue line is the mean population size × generation time, and the blue bar corresponds to the 95% confidence intervals. (a) MOTU I, (b) MOTU II, (c) MOTU III, (d) MOTU IV, (e) MOTU V.
Discussion
Cryptic diversity, genetic variation and demographic history of Pomatomus saltatrix
The sequences are grouped into a single BIN (AA9142) in BOLD, which consists of a sequence cluster defined algorithmically, based on distance method, in the BOLD database. The high threshold employed by BIN (2.2% – Ratnasingham & Hebert, Reference Ratnasingham and Hebert2013) merged all sequences in a single MOTU. Despite that, the species delimitation methods (distance SPIDER and ASAP, and coalescence GMYC) and genetic population analyses demonstrated the presence of five molecular units in Pomatomus saltatrix. This evidence, therefore, sustains our hypothesis that this species, although distributed worldwide, comprises different genetic pools, sufficiently different to flag a potential complex of cryptic species.
The bGMYC identified that the Western North Atlantic (MOTU I) and part of the Mediterranean Sea (MOTU II) formed a single molecular evolutionary unit. However, Miralles et al. (Reference Miralles, Juanes, Pardiñas and Garcia-Vazquez2014b) and Pardiñas et al. (Reference Pardiñas, Campo, Pola, Miralles, Juanes and Garcia-Vazquez2010), using a similar approach involving data from two mitochondrial markers (Cytb and COI), found a clear separation between these locations. As well as the other analysis, MOTU III was recovered and morphometric data suggest differentiation between the Sea of Marmara (part of MOTU III) and the Mediterranean Sea (part of MOTU II) (Turan et al., Reference Turan, Oral, Öztürk and Düzgüneş2006), despite mPTP recovery only one general unit. The results obtained by Miralles et al. (Reference Miralles, Juanes, Pardiñas and Garcia-Vazquez2014b) and Pardiñas et al. (Reference Pardiñas, Campo, Pola, Miralles, Juanes and Garcia-Vazquez2010) are similar to those found in our analyses using the distance methods and GMYC, which indicated three distinct units: MOTUs I, II and III. Nevertheless, the pairwise F ST values were very high and significant between the five defined units for the other methods used in our analyses, suggesting a high genetic-evolutionary differentiation and the possible absence of gene flow. Gene flow has been recognized as one of the main mechanisms which determines how populations evolve in an independent way (Slatkin, Reference Slatkin and Real2018). Thus, the comparison of all the data obtained here with data found in the literature, reinforces the genetic-evolutionary structure of five distinct molecular units in P. saltatrix.
As COI represents the most conservative gene region in the mitochondrial genome, it may not be sensitive to intraspecific events (same species, but different populations), especially recent ones (Hebert et al., Reference Hebert, Cywinska, Ball and Dewaard2003; Satoh et al., Reference Satoh, Miya, Mabuchi and Nishida2016), being more suitable for molecular species identification or cryptic diversity. These events are highly interconnected, since cryptic diversity can be originated from distinct populations that have spent a long time isolated, resulting in gene flow loss (Mayr, Reference Mayr, Wheeler and Meier1893; Fišer et al., Reference Fišer, Robinson and Malard2018), which seems to be the case of P. saltatrix. Therefore, despite the COI marker not being ideal for phylogeographic approaches, inferences can and should be made about the mechanisms that lead to diversification of the different units found here.
These five MOTUs established their current configurations in ~0.25 Ma during the Pleistocene glacial cycles (Levin, Reference Levin2009). The MRCA of P. saltatrix dates from the Pliocene (~3.3 Ma, IC = 2.8–4.37), during the global cooling of the planet (Herbert et al., Reference Herbert, Lawrence, Tzanova, Peterson, Caballero-Gill and Kelly2016; Karas et al., Reference Karas, Nürnberg, Bahr, Groeneveld, Herrle, Tiedemann and Demenocal2017). At ~3.3 Ma there was cooling in the northern hemisphere and Pacific, and warming in the southern hemisphere (see Karas et al., Reference Karas, Nürnberg, Bahr, Groeneveld, Herrle, Tiedemann and Demenocal2017). This palaeoclimatic event indicates the origin of two lineages of P. saltatrix: a more plastic lineage, which adapted to cold and warm environments (hypothetical ancestor of MOTUs I, II and III) and another lineage which was restricted to warmer environments (hypothetical ancestor of MOTUs IV and V). At ~0.3 Ma (Pleistocene; IC = 0.03–0.59), during the preglacial Riss cycle (Levin, Reference Levin2009), there was an increase in global temperatures which was associated with the other cladogenetic episode detected here (MOTUs I and II). This dichotomy can be related to migrating events to colder waters.
A peculiar relationship between the Sea of Marmara and the South Pacific Australian coast was found in MOTU III. Although having been established at ~0.2 Ma (IC = 0.02–0.432) during the Pleistocene, the MRCA dates to the Pliocene, when the Red Sea had not yet been formed, thereby allowing free passage between these oceans (see Herold et al., Reference Herold, Huber, Muller and Seton2012). As there is no connectivity between these regions under their current configurations, the pattern found here can be treated as retention of ancestral genetic polymorphisms.
One of the most intriguing findings was the division of P. saltatrix along the Western South Atlantic (Brazil and Argentina) in two genetic-evolutionary isolated units (MOTU IV and V), with the possible absence of gene flow between them. This result is also reflected in the high and significant pairwise F ST value (0.914), where the region around the Rio de Janeiro and São Paulo states (south-eastern Brazil) appears to be the possible location of a phylogeographic break. Genetic evidence, combined with distribution modelling, demonstrated that the latitude of ~25°S (coast of Rio de Janeiro/São Paulo) represents a water temperature transition region, which cools in a southern direction (Acha et al., Reference Acha, Mianzan, Guerrero, Favero and Bava2004; Anderson et al., Reference Anderson, Salas, Rocha and Floeter2017). This is due to the contrast of warm water from the north (Brazilian Current) and cold water coming from the south (the branch of the Antarctic Circumpolar Current that moves northwards along the Patagonian shelf). This water temperature gradient has already been associated with the fixation of local adaptations in various marine organisms that co-exist along the Brazilian coast (Macrodon ancylodon – Santos et al., Reference Santos, Hrbek, Farias, Schneider and Sampaio2006; Epinephelus itajara – Benevides et al., Reference Benevides, Vallinoto, Fetter Filho, De Souza, Silva-Oliveira, Freitas, Ferreira, Bertoncini, Hostim-Silva, Blanchard and Torres2014; Chaetodipterus faber – Machado et al., Reference Machado, Damasceno, Bertoncini, Farro, Hostim-Silva and Oliveira2017b; Mussismilia hispida – Peluso et al., Reference Peluso, Tascheri, Nunes, Castro, Pires and Zilberberg2018; Scartella cristata – Araujo et al., Reference Araujo, Vilasboa, Britto, Bernardi, von der Heyden, Levy and Floeter2020; Galeocerdo cuvier – Andrade et al., Reference Andrade, Afonso, Hazin, Mendonça and Torres2021), a phenomenon known as environmental isolation (Wang & Bradburd, Reference Wang and Bradburd2014). Variations in temperature intervals represent factors that can mould the genetic structure of organisms (Crow et al., Reference Crow, Munehara, Kanamoto, Balanov, Antonenko and Bernardi2007; Freitas et al., Reference Freitas, Sampaio and Schneider2017; Hoey & Pinsky, Reference Hoey and Pinsky2018). Therefore, this would explain the split between MOTU IV, which occupies zones of colder waters, and MOTU V, which occupies warmer waters.
Regions with distinct climatic conditions can also create abiotic barriers to gene flow (Nielsen et al., Reference Nielsen, Nielsen, Meldrup and Hansen2004; Crow et al., Reference Crow, Munehara, Kanamoto, Balanov, Antonenko and Bernardi2007; Machado-Schiaffino et al., Reference Machado-Schiaffino, Juanes and Garcia-Vazquez2010; McKeown et al., Reference McKeown, Gwilliam, Healey, Skujina, Potts, Sauer and Shaw2020). This is observed between the Gulf of Mexico and the Western North Atlantic (location of MOTU I), and the Caribbean Sea and the Western South Atlantic. Although these regions are near to each other, the sharing of haplotypes between these regions was not observed. The transition between tropical and temperate climates, from the region of the Caribbean Sea is a known barrier of gene flow for many marine species (DeBiasse et al., Reference DeBiasse, Richards, Shivji and Hellberg2016; Nunes et al., Reference Nunes, Van Wormhoudt, Faroni-Perez and Fournier2017; Mattos et al., Reference Mattos, Seixas and Paiva2019), even for long distance migratory species such as P. saltatrix.
The close relationship between the Caribbean Sea and the Atlantic Ocean (MOTU V) represents a paradigm break. The Amazon River Plume is known as a gene flow barrier between Caribbean and Brazilian regions (Araujo et al., Reference Araujo, Vilasboa, Britto, Bernardi, von der Heyden, Levy and Floeter2020), due to its ever more intense modification of the marine landscape (Floeter et al., Reference Floeter, Rocha, Robertson, Joyeux, Smith-vaniz, Wirtz and Brito2008; Luiz et al., Reference Luiz, Madin, Robertson, Rocha, Wirtz and Floeter2012; Gouveia et al., Reference Gouveia, Gherardi and Aragão2019). However, there is an extensive rich coral reef corridor in the twilight zone at the Amazon River Plume, which allows the transit of species, connecting the Caribbean and the South Atlantic (Moura et al., Reference Moura, Amado-Filho, Moraes, Brasileiro, Salomon, Mahiques and Brito2016; Liedke et al., Reference Liedke, Pinheiro, Floeter and Bernardi2020). Pomatomus saltatrix could, therefore, overcome this barrier possibly using this route of deeper marine waters, which would explain the genetic-evolutionary lack of differentiation of MOTU V.
Corroborating the data found here, phenomena of evolutionary diversification in the marine environment, due to Pleistocene climatic oscillations, have been documented in the literature (Hofreiter & Stewart, Reference Hofreiter and Stewart2009; Stewart et al., Reference Stewart, Lister, Barnes and Dalén2009; Gaither & Rocha, Reference Gaither and Rocha2013; Ludt & Rocha, Reference Ludt and Rocha2015; Piñeros & Gutiérrez-Rodríguez, Reference Piñeros and Gutiérrez-Rodríguez2017; Domingues et al., Reference Domingues, Bruels, Gadig, Chapman, Hilsdorf and Shivji2018; Chen et al., Reference Chen, Li, Chen, Li, Yang, Li and Li2020). Furthermore, the profound differentiation found for P. saltatrix can be associated with different environmental conditions which the species experiences in each of the regions where the MOTUs are found (see Juanes et al., Reference Juanes, Hare and Miskiewicz1996). Therefore, these data need to be better evaluated from an adaptive point of view (i.e. RNA sequencing).
The levels of genetic diversity varied between 0.0006 (MOTU V) to 0.007 (MOTU I) and between 0.32 (MOTU V) to 0.97 (MOTU I) for nucleotide and haplotypic diversity, respectively. This parameter is of extreme importance since it represents the potential of populations to evolve and to adapt, in the face of selective pressures (Frankham et al., Reference Frankham, Ballou and Briscoe2008). According to the IUCN, Pomatomus saltatrix is a species classified as ‘Vulnerable’, whose population size is declining. Despite the high global values found in this study for nucleotide and haplotypic diversity (0.0016 and 0.96), these values can be masked by the profound evolutionary differentiation found in this species. Furthermore, the high genetic diversity values may be characteristic of this species. In general, species with wide distribution, high migratory capacity and long larval periods are characterized by high genetic diversity (Planes, Reference Planes, Hecht, MacIntyre and Clegg1988). Thus, as this species presents distinct genetic pools throughout its areas of occurrence, the concern surrounding its conservation should not diminish. This is especially critical for MOTU V, which presents the lowest rarefied haplotype richness compared with the others.
The study of the demographic history of species is extremely important for their conservation, since bottlenecks or population expansions can affect their adaptation potential, as effective population size reflects the magnitude of non-neutral genetic gain fixed by selection (Frankham et al., Reference Frankham, Ballou and Briscoe2008). MOTUs I and II presented slight population expansions, dating from the Pleistocene at ~160,000 and 60,000 years, during the Riss glacial and Riss-Wurm interglacial cycles, respectively, remaining stable to the present day. MOTU III was the only one to present a slight drop in Holocene population size, at ~5000 years. Besides MOTUs IV remained stable throughout time, and MOTU V presents a pattern that may reflect a population size retraction for Mismatch distribution analysis, caution is needed with the BSP results, since the plain line may not reflect stable population sizes, but rather be due to lack of genetic information (Grant, Reference Grant2015). The Pleistocene was a period marked by temperature and water level fluctuations (Chappell & Shackleton, Reference Chappell and Shackleton1986; Adams et al., Reference Adams, Maslin and Thomas1999; Reis et al., Reference Reis, Maia, Silva, Rabineau, Guerra, Gorini, Ayres, Arantes-Oliveira, Benabdellouahed, Simões and Tardin2013) and for some marine species, glacial and interglacial cycles have been associated with the expansion and diversification of effective population sizes (Díaz-Viloria et al., Reference Díaz-Viloria, Sánchez-Velasco and Pérez-Enríquez2012; Da-Silva et al., Reference Da-Silva, Veneza, Sampaio, Araripe, Schneider and Gomes2015; Souza et al., Reference Souza, Dias-Junior, Galetti, Machado, Pichorim and Molina2015). Thus, these results reinforce a scenario of palaeoclimatic oscillations influencing the population history of several marine species.
Conservation implications
Species delimitation approaches and knowledge about the distribution of genetic diversity, are important tools for the definition of management units (Batista, Reference Batista2010; Zhao et al., Reference Zhao, Kong, Yu and Li2018). Despite being one of the most conserved mitochondrial regions, the COI gene recovered a deep and ancient diversification, revealing five molecular units and flagging potential cryptic species within the nominal species Pomatomus saltatrix. Although we reinforce the necessity to include more robust data (e.g. multiloci approach and/or integrative taxonomy), for now, we suggested to consider these molecular units for management. For conservation, the species is divided into six stocks, but not all are formally managed (Carpenter et al., Reference Carpenter, Ralph, Pina Amargos, Collette, Singh-Renton, Aiken, Dooley and Marechal2015): (1) USA, (2) Brazil, (3) North-east Atlantic and Mediterranean, (4) Eastern Central Atlantic, (5) Angola and South Africa and (5) Australia. Not all these groups correspond to those identified by the present data.
At a global level, there are some conservation initiatives for this taxon. Populations in the USA are managed by the Atlantic States Marine Fisheries Commission and Mid-Atlantic Fishery Management Council, which only consider the existence of the stock found in this region (Carpenter et al., Reference Carpenter, Ralph, Pina Amargos, Collette, Singh-Renton, Aiken, Dooley and Marechal2015). The data obtained here support these management strategies, since all the populations in this region form a single molecular unit (MOTU I). The use of molecular information has been used to aid such strategies in the management of marine species (Mamet et al., Reference Mamet, Daglio and García-De León2019; Nykänen et al., Reference Nykänen, Dillane, Reid and Rogan2020). In South Africa, the initiative involves interruption in the capture of species coinciding with the spawning period, as well as the implementation of a minimum size of fish that can be captured (30 cm; Carpenter et al., Reference Carpenter, Ralph, Pina Amargos, Collette, Singh-Renton, Aiken, Dooley and Marechal2015). Additionally, in this region, the establishment of a marine protected area has been recommended (Dunlop & Mann, Reference Dunlop and Mann2012). The association of these data from the literature with that obtained in this study, which defined MOTU II, allows for the observation that the establishment of a marine protected area in South Africa would favour the maintenance of that genetic stock found on the west and east African coasts, as well as the stock in the Mediterranean Sea. Since these regions were defined here as belonging to the same genetic-evolutionary unit, there is a need for congruence in the management forms in these regions.
On the Australian coast, the current management plan includes a definition of minimum sizes that can be fished (between 23–35 cm), and temporary pauses in fishing during spawning periods, to avoid the capture of individuals which have not yet reached sexual maturity. These strategies have already demonstrated positive effects (Broadhurst et al., Reference Broadhurst, Butcher and Cullis2012; Schilling et al., Reference Schilling, Smith, Stewart, Everett, Hughes and Suthers2019). However, in these regions, fishing is mainly artisanal and for sporting purposes (Juanes et al., Reference Juanes, Hare and Miskiewicz1996; Ceyhan et al., Reference Ceyhan, Akyol, Ayaz and Juanes2007) and it has already been demonstrated that this exploitation strategy is also detrimental to stocks (Bender et al., Reference Bender, Machado, Azevedo-Silva, Floeter, Monteiro-Netto, Luiz and Ferreira2014; Giglio et al., Reference Giglio, Luiz and Gerhardinger2015). However, despite the regulations described above, MOTU III (Sea of Marmara – Turkey + Southern Pacific – Australia) was the only one to present a reduction in effective population size in this study. Thus, the combination of all this evidence draws attention to the exploitation of this evolutionary lineage, in order to avoid further compromising its effective population size.
In the Sea of Marmara, which represents the largest catch volumes in the Mediterranean basin, the fishing regulations are not respected, as individuals smaller than 25.5 cm (age of first maturation) are captured (Soykan, Reference Soykan2019). This, therefore, can potentially over-exploit this resource (Cengiz et al., Reference Cengiz, Özekinci, Öztekin and Kumaova2013; Ulman, Reference Ulman2014). In the Australian region, Juanes et al. (Reference Juanes, Hare and Miskiewicz1996) previously demonstrated that a low catch (less than 1000 tonnes year−1) would reflect a small population size. Corroborating these data, this stock showed the second lowest rarefied haplotype richness, reflecting the need for attention surrounding the maintenance of the evolutionary potential and effective population size of this stock. Furthermore, they indicate that the state of ‘Least Concern’ by the IUCN in the Mediterranean basin (Bizsel et al., Reference Bizsel, Yokes, Pollard, Kara, Bariche and Quignard2011), should be viewed with caution.
In Brazil, the two molecular units found should be managed as different stocks. The MOTU V, which presented the lowest genetic diversity values, based on the rarefied haplotype richness, covered two Brazilian marine ecoregions (Figure 1) that suffer from intense human-related disturbance pressures (Magris et al., Reference Magris, Costa, Ferreira, Vilar, Joyeux, Creed, Copertino, Horta, Sumida, Francini-Filho and Floeter2020). Despite the commercial value of this species in Brazil and the evidence of significant declines in capture rates in the region (Haimovici & Krug, Reference Haimovici and Krug1996; Pauly et al., Reference Pauly, Zeller and Palomares2020), this species is not managed (Carpenter et al., Reference Carpenter, Ralph, Pina Amargos, Collette, Singh-Renton, Aiken, Dooley and Marechal2015). However, a reduction in general capture force and in the capture of juveniles has already been recommended (Silvano & Begossi, Reference Silvano and Begossi2010) to maintain population renewal cycles. Thus, considering this scenario of low genetic diversity with high exploitation rates in an ecoregion suffering from environmental disturbance pressure, it can be predicted that the rapid depletion of the stock in this region is very critical.
Final remarks
Considering the results obtained, we concluded that Pomatomus saltatrix has five Molecular Operational Taxonomic Units. These five units represent potential candidates to be cryptic species. However, it is necessary to combine this information with other markers using a multi-loci approach, to confirm this hypothesis. Additionally, an integrative approach is also necessary, comparing molecular, morphological and ecological data aiming to obtain a more robust result for the taxonomic status of the species. If this species is considered as one single species, these units should not be managed as one set, due to the profound degree of divergence between them, with high F ST values which indicate the apparent absence of gene flow and high genetic distances. For future management plans, greater attention should be given to MOTUs III and V, especially the populations from Brazil and Turkey. These populations do not have robust management plans, in addition to their MOTUs presenting the lowest rarefied haplotype richness and shallow signals of population contractions.
Furthermore, the results reinforce the influence of Pleistocene oscillations of the sea level on the structure of marine populations and contribute to the break in the panmixia paradigm in the marine environment, reinforcing that more phylogeographic histories, especially in species that are widely distributed, ought to be investigated.
Supplementary material
The supplementary material for this article can be found at https://doi.org/10.1017/S0025315422000236.
Financial support
The resources supporting this study were provided by Fundação de Amparo à Ciência e Tecnologia do estado de Pernambuco (FACEPE; grant nos. APQ-1203-2.02/10 and APQ-0551-2.04/15). MCGQB, DJGM and UPJ thank the Fundação de Amparo à Ciência e Tecnologia do estado de Pernambuco (FACEPE) and the Coordenação de Aperfeiçoamento de Pessoal de Nível Superior (CAPES) for scholarships and other supporting resources. CBM thanks the Coordenação de Aperfeiçoamento de Pessoal de Nível Superior (CAPES) for their scholarship (Financial code 001). RAT is grateful for the research fellowship provided by CNPq – Conselho Nacional de Desenvolvimento Científico e Tecnológico (Grant no. 306290/2015-4).


