


Introduction
Accurate assessment of functional abilities is a hallmark in the clinical evaluation of Alzheimer’s disease (AD) when determining the diagnostic status and disease severity of a patient. AD-related pathology manifests as a continuum of clinical status, ranging from normal cognition, mild cognitive impairment (MCI) to AD dementia, and the diagnosis of dementia is made especially based on significant disturbance in the functional impairment (McKhann et al., Reference McKhann, Knopman, Chertkow, Hyman, Jack, Kawas and Phelps2011). An objective definition of dementia as a disease is becoming increasingly important with the advance of the biomarker instruments, but the ultimate implication of the brain pathology becomes apparent with the evidence of whether the pathology leads to a real-world disability. For this reason, an accurate description of the functional status remains a crucial part of clinical diagnosis and judgments.
The presence of disturbance or loss of independence in functional ability can be assessed through interviews and inferences by clinicians, and the distinction between MCI and dementia in terms of functional assessment largely relies on the purported information.
A more subtle variation of functional ability across various daily tasks can be examined in detail through the specified questionnaires. The overall functional ability is assessed with instrumental activities of daily living (IADL), which is typically measured with a list of items that ask which of the daily life can be proficiently performed. The IADL score provides comprehensive information on the progression and clinical severity of the disorder. While IADL changes are most significant in populations with dementia, studies also showed that variation in IADL was also observed in the MCI population (Chang et al., Reference Chang, Bondi, McEvoy, Fennema-Notestine, Salmon, Galasko and Dale2011; Jekel et al., Reference Jekel, Damian, Wattmo, Hausner, Bullock, Connelly and Frölich2015; Lindbergh, Dishman, & Miller, Reference Lindbergh, Dishman and Miller2016). In other words, even when an individual maintains relatively intact functional independence, subtle variations of functional proficiency can be reflected in the IADL assessment.
Functional ability in daily activity is one of the most important outcomes for both patients and caregivers. The researchers have examined which of the specific assessment instruments can predict such outcomes during the process of late-life cognitive impairment (Fields, Ferman, Boeve, & Smith, Reference Fields, Ferman, Boeve and Smith2011). According to the systematic review of the previous studies, multiple tests that are included in a neuropsychological battery predict the current or future functional outcomes (Belleville, Fouquet, Hudon, Zomahoun, & Croteau, Reference Belleville, Fouquet, Hudon, Zomahoun and Croteau2017; Fields et al., Reference Fields, Machulda, Aakre, Ivnik, Boeve, Knopman and Smith2010; Royall et al., Reference Royall, Lauterbach, Kaufer, Malloy, Coburn and Black2007). In older adults with or without cognitive impairment, the tests modestly explained the variance of daily activity function around 22–30% variance (de Paula et al., Reference de Paula, Diniz, Bicalho, Albuquerque, Nicolato, de Moraes and Malloy-Diniz2015). These studies suggest substantial but rather insufficient utility of the neuropsychological test batteries in estimating the functional capacities of real-life settings.
Likewise, the studies have also shown that brain imaging features are also predictive of one’s clinical status of dementia. Brain structural differences are consistently observed between the MCI, dementia of AD, compared to the cognitively intact older adults (Pellegrini et al., Reference Pellegrini, Ballerini, Hernandez, Chappell, González-Castro, Anblagan and Wardlaw2018; Ruan et al., Reference Ruan, D’Onofrio, Sancarlo, Bao, Greco and Yu2016). The hippocampal volume or white matter changes that indicate the pathophysiological process of dementia have shown a unique association with daily functional activities, implicating a clinical value of the measures (Overdorp, Kessels, Claassen, & Oosterman, Reference Overdorp, Kessels, Claassen and Oosterman2016). The previous study also indicated that even at a similar level of clinical impairment [i.e., Clinical Dementia Rating (CDR) score of 0.5], the subtle variability in the IADL was associated with a more progressed cortical thinning in the medial temporal cortex (Chang et al., Reference Chang, Bondi, McEvoy, Fennema-Notestine, Salmon, Galasko and Dale2011). However, it remains unclear the extent to which the association is a result of poorer neuropsychological performances, and how distinct brain regional contribution differs, though these studies suggest the presence of a neuropathological basis in terms of dementia’s functional capacity.
Despite the abundance of studies reporting the correlates of neuropsychological and brain pathological markers in IADL, the current instruments of cognitive and behavioral abilities are often criticized for their insufficient ecological validity. Due to the classical focus on the role of neuropsychological tests in detecting early signs of pathophysiology, the predictors tend to measure cognitive performance in a highly structured setting or target biological process that may not be crucial to disabilities in daily life (Bilder & Reise, Reference Bilder and Reise2019; Howieson, Reference Howieson2019). Thus, neuropsychological and neural correlates that have additive relevance in explaining daily function need further systematic exploration.
One of the remaining questions in identifying cognitive and biological correlates of late-life IADL is how multiple measures of predictors share a common basis of functional capacities. Previous studies lacked neuroimaging correlates of IADL and have been limited in interpreting the presence of small regional effects based on a relatively small population, which resulted in inconsistent findings (Donders, Reference Donders2019; Overdorp et al., Reference Overdorp, Kessels, Claassen and Oosterman2016). Furthermore, the nature of the large overlaps across multiple predictors of cognitive, neuropsychiatric, and brain structural markers remains unexplored in having unique predictability to daily functional abilities.
According to the process of disability model, biological changes of dementia lead to disabilities in daily activities via cognitive abilities that are necessary for coping and solving complex tasks (Royall et al., Reference Royall, Lauterbach, Kaufer, Malloy, Coburn and Black2007; Verbrugge & Jette, Reference Verbrugge and Jette1994). The model also resonates with a more recent conceptualization of the hypothetical model of ADs pathological progression (Jack & Holtzman, Reference Jack and Holtzman2013). One notable study effectively depicted that a path analysis can translate such a conceptual cascade model into testable forms (Vemuri et al., Reference Vemuri, Lesnick, Przybelski, Knopman, Lowe, Graff-Radford and Jack2017).
Another issue in looking at the neural basis of IADL is the extent to which researchers set the scope of brain regions. Until now, most of the studies exploring correlations have been conducted in a way that interprets the inconsistent results of univariate tests or narrowing the scope to only a few regions of interest (Overdorp et al., Reference Overdorp, Kessels, Claassen and Oosterman2016). However, utilizing neuroanatomical measures within the locally confined area may be insufficient to describe heterogeneous pathophysiological processes across individuals (Dong et al., Reference Dong, Toledo, Honnorat, Doshi, Varol, Sotiras and Davatzikos2017). Moreover, the use of repeated univariate testing across every neuroanatomical measure often captures spurious regional effects while omitting widespread effects across multiple brain regions (Masouleh, Eickhoff, Hoffstaedter, & Genon, Reference Masouleh, Eickhoff, Hoffstaedter and Genon2019). Utilizing the multiple patterns of cortical and non-cortical areas may broaden the utility of brain imaging markers in predicting clinical outcomes. A recent preference for the predictive approach may provide a more realistic picture of the multiple intercorrelated predictors of IADL (Bzdok & Meyer-Lindenberg, Reference Bzdok and Meyer-Lindenberg2018; Yarkoni & Westfall, Reference Yarkoni and Westfall2017). The application of the cross-validation procedure provides a non-overfitted set of multivariate predictors that are characterized with distinct patterns of brain structural measures.
In the current study, we identified neuropsychological, neuropsychiatric, and neuroanatomical predictors of daily functional status across the cognitively normal to dementia population. Using a multivariate predictive approach, we integrated the latent pattern of neural and cognitive–behavioral basis functional status (IADL) while taking into account the high collinearity of multiple predictors. Next, we tested the path models that identify which latent patterns of the neuropsychological score (cognitive performance and neuropsychiatric symptoms) mediate the effect of latent brain structural patterns. We hypothesized that multiple cognitive–behavioral functions mediate the association between brain structure and IADL. For the explorative purpose, we examined the specific brain-to-cognition pathways of IADL.
Methods
Participants
The older adults with or without cognitive impairment were retrospectively recruited from SMG-SNU Boramae Medical Center and Dongjak-Gu Center for Dementia from January 2014 to December 2019. The participants underwent both neuropsychological assessment and magnetic resonance imaging (MRI) scan. This study was conducted under the Declaration of Helsinki, and the protocol was approved by the Institutional Review Board of SMG-SNU Boramae Medical Center (IRB No.30-2020-181). The current study included older adults diagnosed without cognitive impairment (normal aging or only presenting subjective cognitive decline) or with MCI, AD dementia, Mixed Dementia (AD with vascular dementia). The diagnosis of the AD and MCI were based on the criteria of the National Institute of Neurological and Communicative Disorders and Stroke and AD and Related Disorders Association (NINCDS-ADRDA) and Petersen’s criteria (McKhann et al., Reference McKhann, Drachman, Folstein, Katzman, Price and Stadlan1984; Petersen et al., Reference Petersen, Smith, Waring, Ivnik, Tangalos and Kokmen1999). The presence of vascular disease including small vessel disease, stroke, infarction which are not in a typical range of normal aging, or AD were additively considered as having the vascular feature. The clinical characteristics of dementia severity were provided based on the CDR. The structured interview and the reassurance of the survey responses were administered by the trained clinical psychologists. Since the current study’s focus was on the correlates of functional status in the early clinical stages of dementia, we confined the severity of dementia to a mild level (CDR ≤ 1). Subjects with the primary cause of dementia other than AD, including Lewy body dementia, frontotemporal lobe dementia, vascular dementia, were not included in the analysis. Those identified or suspected with significant neurological conditions including stroke, traumatic brain injury, meningioma, hemorrhage, normal pressure hydrocephalus, delirium, intellectual disabilities were also excluded. The older adults who showed a significant impairment in the basic activities of daily living (e.g., walking, bathing, dressing, toileting) were excluded (Barthel ADL ≤ 16, maximum score = 20) to rule out the cases of impairment possibly due to constraints in physical health rather than changes in neurocognitive function (Wade & Collin, Reference Wade and Collin1988). Finally, a total of 881 older adults who met the screening criterion were analyzed in the study (Tables 1 and 2).
Table 1. Descriptive characteristics of the participants.

Table 2. Neuropsychological test performances, NPI, and IADL across clinical groups.

CN = Cognitively Normal; MCI = Mild Cognitive Impairment; AD = Alzheimer’s disease type of dementia.
† Chi-square test result.
†† Post hoc group comparison was tested with Tukey’s test.
** p < 0.001.
* p < 0.05.
Instrumental activities of daily living
The Lawton IADL was used to evaluate the ability to function independently in a list of activities (Lawton & Brody, Reference Lawton and Brody1969). The index was initially developed to sum the item scores differentially depending on the gender (the item of housework and food preparation are additionally summed in the case of women). The current study used five items of Lawton IADL that are commonly applicable to both genders. The IADL items included whether the respondent could perform the following tasks with minimal or full support: phone use (1–4), buying goods (1–4), taking medicine (1–3), managing money (1–3), and transportation use (1–5). The total score indicated the levels of functional independence ranging from 5 (full independence) to 19 (requiring full support or complete inability The instrument’s reliability and concurrent validity have been confirmed (Kim, Won, & Cho, Reference Kim, Won and Cho2005). The IADL was primarily assessed based on the informant report, but the self-report was used only when the patients were able to visit without the accompanying caregiver. The validity of the IADL rating was reviewed by the interviewer whether the items were misconstrued. The correlation between IADL items was generally high (r = 0.57 − 0.72).
Neuropsychological assessment
The neuropsychological assessment mainly included an informant survey of neuropsychiatric symptoms and the cognitive test battery. The Consortium to Establish a Registry for Alzheimer’s Disease Neuropsychological Battery for Koreans (CERAD-K) was administered to measure the multiple domains of cognitive function (Lee et al., Reference Lee, Lee, Lee, Kim, Jhoo, Kim and Woo2002). The test facilitates the diagnosis of MCI and dementia and contains the following subtests: Verbal fluency (animal), Boston Naming Test, Word List Recall (immediate, delayed), Constructional Praxis (copy, delayed), Word List Recognition, Trail Making Test (A and B: TMT-A, TMT-B). The Trail Making Test measured the total time spent to complete the tasks. Similar to that of the previous study, there was a high rate of failure especially in the TMT-B (Current dataset: 76%; Seo et al.’s Normative dataset: 60%). According to the previous report, the high failure rate is prominently due to difficulties in sequencing the seven Korean letters and difficulties in understanding instruction (Seo et al., Reference Seo, Lee, Kim, Lee, Jhoo, Youn and Woo2006). The test administration had set the maximum time limit at 360 s (TMT-A) and 300 seconds (TMT-B) based on administration instruction in CERAD-K. The score was interpolated as the maximum time limit in the cases when the TMT was aborted or not feasible due to the following reasons: exceeded the time limit, unable to understand the rule, or committed more than five errors.
Neuropsychiatric Inventory (NPI) score assessed the presence and severity of neuropsychiatric symptoms which typically manifest as behavioral disturbance and socio-emotional regulation (Choi et al., Reference Choi, Na, Kwon, Yoon, Jeong and Ha2000; Cummings et al., Reference Cummings, Mega, Gray, Rosenberg-Thompson, Carusi and Gornbein1994). The NPI was rated by clinical psychologists and was based on the semi-structured interview administered to the patients’ informants or caregivers and rated. It consists of 12 separate items assessing neuropsychiatric disturbances, including delusion, hallucination, agitation/aggression, depression/dysphoria, anxiety, elation/euphoria, apathy/indifference, disinhibition, irritability/lability, aberrant motor behavior, sleep, and appetite. The item scores were calculated by multiplying the severity and frequency of each symptom. In sum, 10 cognitive measures (CERAD-K) and behavioral measures (NPI) were used to predict IADL in the subsequent regression models.
Neuroimaging acquisition and preprocessing
The neuroimaging data were collected in the MR scanner (3 Tesla, Achieva, Philips Medical Systems, Best, the Netherlands) to acquire a high-resolution T1 anatomical brain image with a 3D T1-weighted turbo field echo sequence (TR: 9.3 ms, TE: 4.6 ms, flip angle: 8˚, voxel size: 1.0 × 1.0 × 1.0 mm, slice thickness: 1mm, 180 slices, image matrix: 224 × 224). We used a fully automated preprocessing procedure implemented in CAT12 r1450 (Computational Anatomy Toolbox; Structural Brain Mapping Group, Departments of Psychiatry and Neurology, Jena University Hospital, http://dbm.neuro.uni-jena.de/cat/) to apply a standardized analysis pipeline. First, a spatial-adaptive nonlocal means denoising filter was employed (Manjón, Coupé, Martí-Bonmatí, Collins, & Robles, Reference Manjón, Coupé, Martí-Bonmatí, Collins and Robles2010). Segmentation algorithms based on the adaptive maximum a posterior technique, implemented in CAT12, were used to classify brain tissue into three classes: Gray matter, white matter, and cerebrospinal fluid. Additionally, partial volume estimation was used to create a more accurate segmentation for the mixed tissue classes. The quality of images (index of quality rating, IQR) was calculated by CAT12 during the preprocessing. The images with poor preprocessing performance were excluded (IQR > 2.3). After segmentation, the segmented image of gray matter tissue was spatially transformed while preserving for the total amount of gray matter signal in the normalized partitions. We used two parcellation atlas to define cortical, subcortical, and infratentorial regions, and the mean density measures were extracted within each parcellated region. For the cortical regions, a 400 cortical parcellation map was used (Schaefer et al., Reference Schaefer, Kong, Gordon, Laumann, Zuo, Holmes and Yeo2018). It has been suggested that the functional parcellation of the brain structure may provide more fine-grained patterns of brain structural phenotypes. The regional labels were assigned with the 17 functional networks (Varkuti et al., Reference Varkuti, Cavusoglu, Kullik, Schiffler, Veit, Yilmaz and Sitaram2011; Yeo et al., Reference Yeo, Krienen, Sepulcre, Sabuncu, Lashkari, Hollinshead and Buckner2011). For the non-cortical regions, the 24 regions in the subcortical structures (brain stem, caudate, putamen, pallidum, amygdala, thalamus, and hippocampus) and cerebellum (exterior, vermis) were defined with Neuromorphometric atlas (http://Neuromorphometrics.com). In total, 424 brain measures of cortical, subcortical, cerebellum were used to predict IADL. All measures of gray matter density were adjusted by residualizing the effect of sex and total intracranial volume in the fitted regression model.
Statistical analyses
The main analyses were conducted in two steps: (1) Identification of the latent predictors of IADL composed of brain structure measure (Figure 1A) or cognitive and behavioral measures (Figure 1B) and (2) testing the mediation model using the latent component scores (Figure 1C).

Fig. 1. Analysis scheme. (A and B) Partial Least Square Regression (PLSR) identifies latent components (colored circles) that are composed of the observed measures (blue squares). The combinations of the latent scores explain the target variable (IADL). The total number of components in the regression model is selected with the cross-validation that achieves the highest prediction accuracy. (A) PLSR with brain structural measures. (B) PLSR with cognitive and behavioral measures. (C) The latent scores identified in the previous PLSR are used to test the multiple mediational effects. Path analysis tests the extent to which the association between brain structural components and the IADL is mediated by the cognitive and behavioral components.
Partial least square regression
To effectively summarize the multiple correlates of IADL, we constructed a cross-validated partial least square (PLS) regression model using the caret package for R (Kuhn, Reference Kuhn2015). The PLS regression reduces high-dimensional data into orthogonal components with the greatest covariance with the output (the target of the prediction, namely IADL) before regression analysis. In contrast to reducing dimensions with principal component analysis, PLS decomposes orthogonal components in a way that is more relevant to the target variable in the model construction stage. The PLS method is utilized in neuroimaging studies to effectively summarize the highly collinear data structures observed across brain regions (Giorgio, Landau, Jagust, Tino, & Kourtzi, Reference Giorgio, Landau, Jagust, Tino and Kourtzi2020; Krishnan, Williams, McIntosh, & Abdi, Reference Krishnan, Williams, McIntosh and Abdi2011; Rudolph et al., Reference Rudolph, Graham, Feczko, Miranda-Dominguez, Rasmussen, Nardos and Fair2018). In this study, the PLS regression model was constructed to find linearly combined latent components which are predictive of the IADL of an individual. The PLS regression was separately conducted using the set of cognitive–behavioral measures and brain structural measures. We identified the latent predictors of IADL composed of brain structure measures (Figure 1A) and cognitive–behavioral measures (Figure 1B). After identifying latent factors of cognitive–behavioral and brain structural factors that predict IADL, we conducted a path analysis that tests the mediating effect of cognitive–behavioral function in the relationship between brain structure and IADL (Figure 1C).
In order to find a model generalizable to the independent dataset, the optimal number of latent components was selected based on the lowest accuracy in the leave-one-out cross-validation (LOOCV). Although sequentially adding more components of predictors produces a more complex model in explaining the given data, cross-validation procedures scrutinize whether such complexity provides additive accuracy in explaining the novel data independent of training data. Using the LOOCV procedure, we iteratively partitioned the training data to construct a model and predicted the left-out single-subject data. With a differing number of components within each model, the root mean squared error (RMSE) and explained variance (R 2) across the iterated LOOCV procedures were calculated. Examining the out-of-sample prediction error for each number of PLS components, the optimal model is selected between underfitted (fewer components) and overfitted (more components) models that show the lowest RMSE in predicting IADL. For the visualization purpose, 10-folded training and testing dataset generated the predicted value of the IADL score. The loading weights of the latent components were described with Pearson’s correlation coefficient between the component score and the raw input measures.
Path analysis
After identifying latent scores of cognitive–behavioral and brain structural factors that predict IADL, we conducted a path analysis that tests the mediating effect of cognitive–behavioral function in the relationship between brain structure and IADL (Figure 1C). We used the lavaan package in R to calculate the path coefficients, direct effect, and indirect effect (Rosseel, Reference Rosseel2012). The extent of the mediation effect was assessed with the proportion of indirect effect within the total effect (Kievit et al., Reference Kievit, Davis, Mitchell, Taylor, Duncan and Henson2014). The standard error of the effects was calculated with 1000 resamplings of bootstrap.
Multiple regression analysis
We used multiple linear regression to see the incremental predictive value and the unique association between the PLS latent scores. The explained variance (R 2) across the models (model 1: Demographic, model 2: Brain components, model 3: Cognitive–behavioral components, model 4: Brain + Cognitive–behavioral components, model 5: Demographic + Brain components + Cognitive–behavioral components). By comparing the changes in the model’s explained variance (R 2), the extent of unique and overlapping variances of the predictive components was assessed.
Results
We first conducted a PLS regression analysis that predicts IADL scores with brain structural measures. The leave-one-out cross-validation identified the optimal number of the components to be fitted in the final model. We found that the PLS regression model with three brain components showed the lowest error in predicting the IADL of the testing dataset (Figure 2A; RMSE = 2.007, R 2 = 0.182). On the contrary, the model with fewer or greater components produced lower prediction accuracy, indicating a underfitted or overfitted results in other models (two components: RMSE = 2.025, R 2 = 0.167; four components: RMSE = 2.018, R 2 = 0.176).

Fig. 2. PLSR result of cross-validation and the visualized prediction with (A) brain measures and (B) cognitive–behavioral measures. Left panel: Averaged prediction error (root mean squared error, RMSE) of 10-fold cross-validation across the number of latent components. The optimal number of components in the PLSR model is identified showing the lowest error. Right panel: Each dot notes the predicted IADL value estimated with the 10 times folded training dataset.
We explored the regional brain contribution by calculating the correlation between the latent component scores and raw gray matter density measures. The distribution of multiple brain measures was plotted across the predefined functional networks or anatomical labels (Figure 3). We found that the first PLS brain component was associated with the gray matter density in cerebellar regions. The first brain component also showed relatively weak and widely distributed loadings on overall cortical regions (Figure 1A, Table 3). The second PLS brain component was highly comprised of the medial temporal lobe (hippocampus, amygdala) and subcortical (thalamus) regions (Table 3). In the cortical regions, gray matter densities within the limbic and default mode network showed relatively higher loadings on the second component (Figure 1B). The third PLS brain component was highly comprised of the medial temporal lobe, inferior parietal lobule, and orbitofrontal cortex regions (Table 3). Overall, the strength of loading was relatively lower than the former components, and the brain regions of limbic and default mode networks largely comprised the third component (Figure 1C). Unexpectedly, the positive loadings in the regions of striatal structures (caudate, putamen, pallidum) were observed possibly due to the misclassified tissue labels of white matter hypointensities.
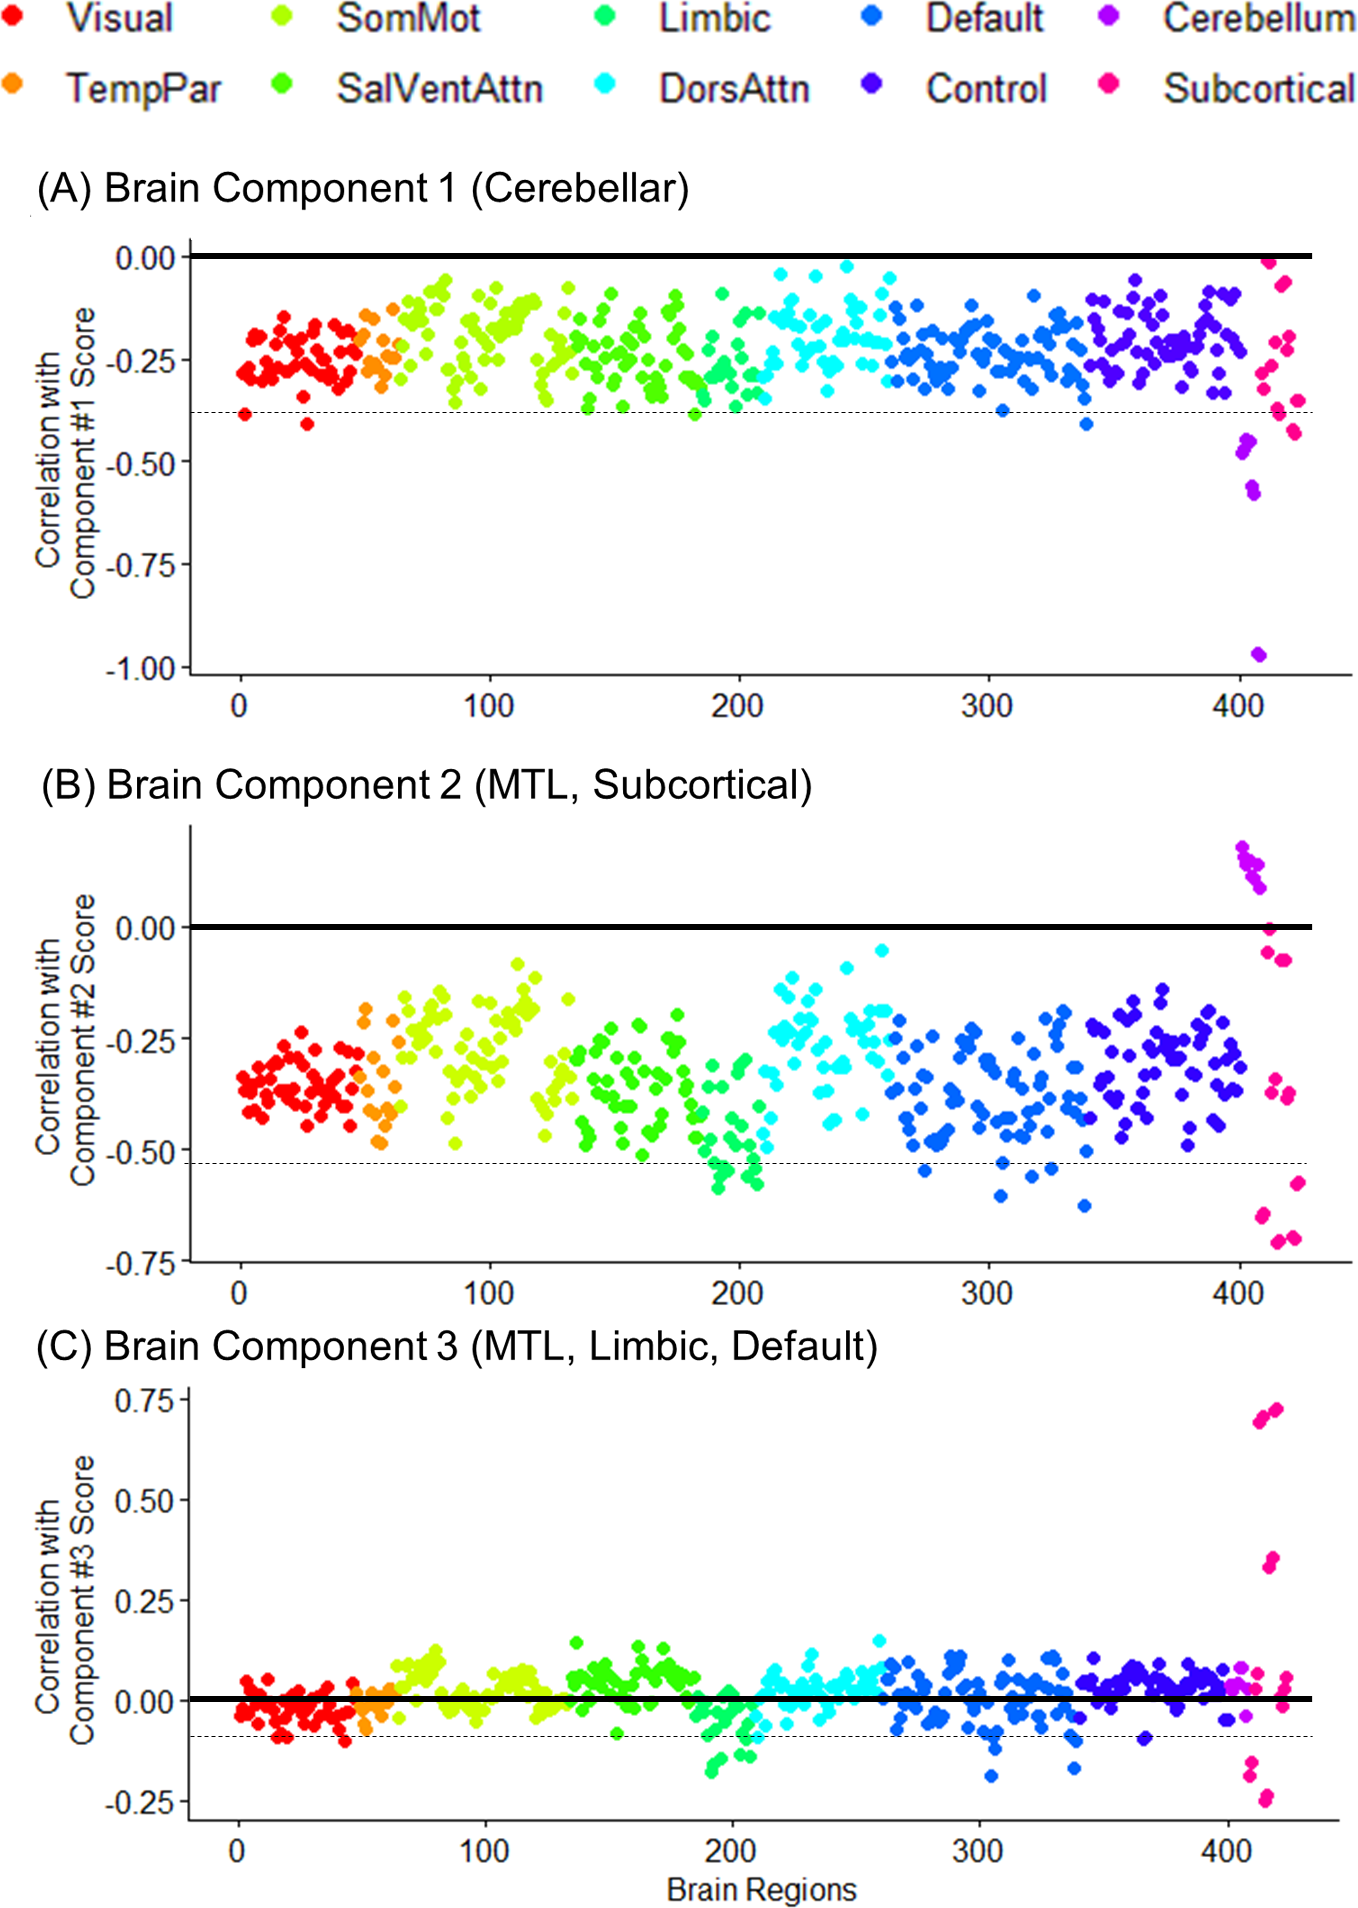
Fig. 3. The loading weights (Pearson’s correlation coefficient r) of the 424 gray matter density measures on each PLSR component score. The colored dots represent the membership of the regional loading across the functional network parcellation (Schaefer et al., Reference Schaefer, Kong, Gordon, Laumann, Zuo, Holmes and Yeo2018) or the neuroanatomical label. Horizontal dashed line notes the range of 15 regions with the highest weights. TempPar = Temporoparietal; SomMot = Somatosensory and Motor; SalVentAttn = Salience and Ventral Attention; DorsAttn = Dorsal Attention; Default = Default Mode; Control = Cognitive control; MTL = Medial temporal lobe.
Table 3. The loading weights (Pearson’s correlation coefficient r) of the brain structural measures on PLSR components. The 15 regions with the highest loading weights are listed in descending order. Neuroanatomical and functional network labels of the gray matter density measures are noted.

SalVentAtt = Salience and Ventral Attention; Default = Default Mode; Control = Cognitive control.
We next conducted a PLS regression analysis that explains the IADL score with the multiple cognitive and behavioral measures (test performances and neuropsychiatric symptoms). We found that the PLS regression model with four cognitive components showed the optimally lowest error in predicting IADL (Figure 2B; RMSE = 1.830, R 2 = 0.320), whereas the model with fewer or greater components showed a lower prediction accuracy (three components: RMSE = 1.897, R 2 = 0.269; five components: RMSE = 1.840, R 2 = 0.316).
We explored cognitive–behavioral measures’ relative loadings by calculating the correlation between the latent component scores and the raw scores (Table 4). The first component comprised the performances of TMT-A and overall cognitive test scores, including episodic memory, language, learning, and visuospatial construction domains, while NPI was weakly associated. The second component was primarily comprised of TMT-B. The third component indicated lower episodic memory performances and higher neuropsychiatric symptoms (NPI positive). On the contrary, the fourth component indicated poorer episodic memory performances and inversely intact neuropsychiatric symptoms (NPI negative).
Table 4. The loading weights (Pearson’s correlation coefficient r) of the cognitive and behavioral measures on PLSR components.

Loadings correlation coefficient higher than 0.40 were noted as bold. NPI pos/neg: High positive/negative loadings on neuropsychiatric symptom inventory.
†Higher scores indicated poorer performance (seconds).
††Higher scores indicated poorer and more severe functioning.
Using the latent scores of each PLS model, the path analysis explored the explanatory strength of each identified component on IADL and the systematic relationship between brain structure and cognitive–behavioral factors. The scores of the three brain component scores and four cognitive–behavioral scores optimized in the previous PLS cross-validation were used in the path analysis (Figure 1C). We showed that the first brain component (cerebellar) had relatively strong path coefficients on the first (General, TMT-A) and fourth (Memory, NPI negative) cognitive–behavioral components. The second brain component (MTL, subcortical) showed a strong path coefficient on the episodic memory components (3 and 4), while the overall components likewise showed significant coefficients (Figure 4). The third brain component (MTL, Default mode network, Limbic network) showed a strong path on the third (memory, NPI positive) component, indicating a relatively independent role of parietal and ventral prefrontal regions in explaining the cognitive components that comprise neuropsychiatric symptoms.

Fig. 4. Mediational path model. Standardized coefficients and the p-values are noted. Solid or dashed lines indicate the statistical significance. Major brain regions/networks or cognitive domains are labeled in parenthesis. MTL = Medial temporal lobe; NPI = Neuropsychiatric Inventory. ** p < 0.001, * p < 0.005.
The total effect of brain structural components was decomposed into the indirect and direct effects: the effects that indirectly explain IADL by mediating the cognitive–behavioral components and the effects that directly explain IADL regardless of the cognitive–behavioral components, respectively (Figure 5). The mediational analysis showed that the first and third cognitive–behavioral components mostly mediated the brain components (Table 5). The indirect effect of the cognitive component comprised more than half of the total effect.

Fig. 5. Schematic mediational effects of the path model. The total effect (brain components to IADL) is decomposed into multiple indirect effects of cognitive and behavioral components (m1–m4) and direct effects of the brain component (c). NPI pos = Neuropsychiatric symptom-positive; NPI neg = Neuropsychiatric symptom-negative; Cog-Beh = Cognitive and Behavioral.
Table 5. Mediational path analysis result.

Lastly, hierarchical multiple regression models were tested to check the incremental value of predictors (Table 6). We first confirmed that most of the demographic effects were accountable to the brain and cognitive–behavioral components. Moreover, when comparing the explained variance of the hierarchical models, cognitive–behavioral components added larger explaining variances compared to the brain components (Model 2–Model 4: R 2 change = 0.032; Model 3–Model 4: R 2 change = 0.157).
Table 6. Hierarchical multiple regression models and the explained variances (R 2) of each model (Dependent/Outcome variable: IADL total score).

Comp = Component of partial least square model; Brain = Latent factors of brain structural measures; CogBeh = Latent factors of cognitive and behavioral measures.
*** p < .001, ** p < .01, * p < .05.
Table 7. Spearman correlation (rho) between latent scores of PLSR and IADL items.

Subc = subcortical; MTL = medial temporal lobe; DMN = default mode network; Mem = memory; NPI+/− = neuropsychiatric symptom positive/negative.
The IADL consists of different types of daily activities, and further subitem analysis was conducted (Table 7). The spearman correlations between latent scores of PLSR models were assessed to compare the relative contribution of the brain and cognitive–behavioral components. Overall, the association with the component scores was not noticeably different across IADL items. Specifically, the functional capacity of transportation use was more predicted with the cerebellar component, while activities with financial management were more associated with MTL and subcortical components. Managing medicine intake was highly reflective of MTL and DMN components.
Discussion
In the current study, we identified multiple latent components of gray matter density and cognitive–behavioral test measures that are predictive of daily functional abilities. We first identified three distinct patterns of brain structural components, including cerebellar (component 1), hippocampal and subcortical (component 2), and limbic and default network regions (component 3). We also showed that distinct patterns of general cognitive ability, processing speed (components 1 and 2), episodic memory, and neuropsychiatric symptoms (components 3 and 4) were predictive of IADL. In the path analysis, more than half of the effects of brain structural measures on IADL were mediated by the components of cognitive–behavioral measures. When comparing the explanatory size of the brain and cognitive–behavioral components across multiple regression models, brain measures minimally added the information in predicting the IADL on the basis of the effects of cognitive–behavioral measures.
Our exploratory analysis of PLS regression with the brain structural measures identified a component of non-cortical regions in addition to the medial temporal lobe component. We found that the cerebellar structure showed a notable contribution in the first latent component alongside other cortical regions. According to the path analysis results, the first brain component may account for the variabilities in IADL via the components of general cognitive ability and processing speed function. The neural significance of cerebellar structure has been well-documented, in that cerebellum has widely connected with the cerebral regions of higher order cognition, other than mere somatosensory regions (Marek et al., Reference Marek, Siegel, Gordon, Raut, Gratton, Newbold and Dosenbach2018). The cerebellar cortex is commonly affected by AD pathology, and such changes may lead to aberrant functional responsivity in cerebellar regions (Guo et al., Reference Guo, Tan, Hodges, Hu, Sami and Hornberger2016; Jacobs et al., Reference Jacobs, Hopkins, Mayrhofer, Bruner, Van Leeuwen, Raaijmakers and Schmahmann2018; Reiman et al., Reference Reiman, Quiroz, Fleisher, Chen, Velez-Pardo, Jimenez-Del-Rio and Lopera2012). The atrophy in the cerebellar region is typically observed not only in the normal aging population but also in sporadic AD or MCI (Fjell et al., Reference Fjell, Westlye, Grydeland, Amlien, Espeseth, Reinvang and Walhovd2013; Möller et al., Reference Möller, Vrenken, Jiskoot, Versteeg, Barkhof, Scheltens and van der Flier2013; Thomann et al., Reference Thomann, Schläfer, Seidl, Santos, Essig and Schröder2008). Our finding suggests that the cerebellar pathology is not a bystander in the process of late-life cognitive impairment, especially in the relevance to real-world functioning.
In particular, the cerebellar component explained IADL mainly through the first cognitive–behavioral component, which primarily reflected general cognition and processing speed function. Although the cognitive tests that reflect the processing speed domain have not been a primary marker in distinguishing the dementia of Alzheimer’s type, it is notable in our finding that TMT-A was a critical measure in explaining the functioning ability. The previous studies have shown that the tests of processing speed appear to reflect subtle changes from the very early stages of dementia (Albert et al., Reference Albert, Zhu, Moghekar, Mori, Miller, Soldan and Wang2018; Amieva et al., Reference Amieva, Mokri, Le Goff, Meillon, Jacqmin-Gadda, Foubert-Samier and Dartigues2014; Johnson, Lui, & Yaffe, Reference Johnson, Lui and Yaffe2007; Younes et al., Reference Younes, Albert, Moghekar, Soldan, Pettigrew and Miller2019). Our finding suggests that episodic memory is not a sole cognitive domain in explaining functional status during the process of dementia.
The subsequent brain components showed that medial temporal, subcortical, limbic network, and default network plays a role in explaining IADL. The second and third brain components that mainly consisted of the hippocampal and amygdala volume showed strong paths on the memory-related cognitive components. On the other hand, it is notable that cortical regional volume of higher order function (orbitofrontal, inferior parietal) was associated with IADL specifically through the third component that accompanies neuropsychiatric behavioral symptoms. We speculate that older adults with additive neurodegeneration in prefrontal and parietal cortical regions may indicate AD variants with additional behavioral symptoms (Ossenkoppele et al., Reference Ossenkoppele, Pijnenburg, Perry, Cohn-Sheehy, Scheltens, Vogel and Rabinovici2015).
Our study identified relatively weak but distinct components that are associated with neuropsychiatric symptoms concomitant with episodic memory function. The previous studies have reported the importance of behavioral symptoms (e.g., apathy, agitation, disinhibition, etc.) as uniquely explaining functional impairment (Burton, O’Connell, & Morgan, Reference Burton, O’Connell and Morgan2018; You, Walsh, Chiodo, Ketelle, & Miller, Reference You, Walsh, Chiodo, Ketelle and Miller2015). The changes in neuropsychiatric symptoms are typically observed in MCI or mild stages of dementia and constitute a distinct feature of dementia progression (Delgado et al., Reference Delgado, Vergara, Martínez, Musa, Henríquez and Slachevsky2019). It is possible that performance-based measures were insufficient to characterize disturbances in socio-emotional function, which is crucial in obtaining adequate help from caregivers or maintaining basic social activities in daily life.
It should be noted, however, that the current multivariate mediation models are based on the specific population of older adults. It remains untested whether these patterns of prediction generalize to other types of dementia or neurological diseases. When examined in populations with other types of neuropathology, the relevant neurocognitive function may play a different role in explaining IADL.
In the current study, we assessed the predictive accuracy of multiple cognitive and brain structural correlates and evaluated the practical utility of our predictive model. The overall accuracy showed a modest strength of association which was slightly higher than the previous reports in older adults (R 2 = 0.30; de Paula et al.) or various clinical populations (R 2 median/average = 0.15/0.22; Royall et al.) (de Paula et al., Reference de Paula, Diniz, Bicalho, Albuquerque, Nicolato, de Moraes and Malloy-Diniz2015; Royall et al., Reference Royall, Lauterbach, Kaufer, Malloy, Coburn and Black2007). One of our study interests was to also evaluate the ecological significance of predictability. However, since numerous factors that influence the metric (i.e., the inclusion of cross-validation procedure, range of age, the proportion of the clinical population, etc.) differs across studies, direct comparison with the previous reports may be inadequate. It remains unclear, whether the unexplained proportion of IADL variance is due to the inherent properties of IADL (e.g., inaccurate reports or indefinite boundary between ability and propensity) or insufficiency of predictive information (e.g., other neuroimaging modalities, cognitive domains, physical capabilities). Moreover, previous literature scarcely reported the explanatory strength as a multivariate model using neuroimaging measures (Chang et al., Reference Chang, Bondi, McEvoy, Fennema-Notestine, Salmon, Galasko and Dale2011). Future studies are needed to assess the accuracy of predictive models of IADL across various clinical populations with unified predictors (Lindbergh et al., Reference Lindbergh, Dishman and Miller2016; Pellegrini et al., Reference Pellegrini, Ballerini, Hernandez, Chappell, González-Castro, Anblagan and Wardlaw2018; Rathore, Habes, Iftikhar, Shacklett, & Davatzikos, Reference Rathore, Habes, Iftikhar, Shacklett and Davatzikos2017).
While the overall accuracy showed a modest strength of predictability, a large proportion of the variance remains unexplained. This may raise the issue that classical neuropsychological tests may be still insufficient in depicting real-life functioning. Contrary to the classical conception that neuropsychological test focuses on detecting brain lesions, multi-modular cognitive tests that are not specific to a certain region or types of neuropathology may be adequate for depicting the ecological valid function. It has been suggested that the tests that encompass more general and broad cognitive domains tend to correlate more strongly with real-world functioning (Bilder & Reise, Reference Bilder and Reise2019). Our current composition of the cognitive tests may have omitted domains of verbal communication, social judgment, spatial navigation, which has not been the focus of dementia assessment protocols (Harrison et al., Reference Harrison, Minassian, Jenkins, Black, Koller and Grundman2007; Howieson, Reference Howieson2019). We expect a more accurate prediction on IADL when the neuropsychological battery comprises ecological and relevant test measures.
Lastly, our path analysis revealed the relative importance of neuropsychological assessment on the contrary to the brain morphological features. We found that more than half of the brain structural effects on IADL were mediated by the composite scores of cognitive and behavioral scores. Moreover, the hierarchical regression model also showed that the effect of brain structural components added minimal information to the neuropsychological test model. This finding supports the disability process model that maps the pathophysiological consequences of dementia (Royall et al., Reference Royall, Lauterbach, Kaufer, Malloy, Coburn and Black2007; Verbrugge & Jette, Reference Verbrugge and Jette1994). It seems that the predictability gap between functional disability and brain structure is due to multiple buffering and moderating factors. The pathophysiological changes lead to disabilities after sufficient processes are undergone. According to the concept of reserve and resilience, the effect of neuropathology does not directly manifest in the functional impairment due to protective factors of reserve and resilience (Arenaza-Urquijo & Vemuri, Reference Arenaza-Urquijo and Vemuri2018; Stern et al., Reference Stern, Arenaza-Urquijo, Bartrés-Faz, Belleville, Cantilon, Chetelat and Vuoksimaa2018). The older adults with larger protective factors and premorbid function would have delayed or buffer against neuropathology, leaving intact IADL and a large predictability gap of brain structural measures.
One of the fundamental limitations of our study is the validity of the IADL measurement. The five items of IADL may have under-specified the wide variety of daily activities, and the significance of each activity differs across the lifestyle context of individuals. In addition, the validity highly depends on the source of information including the awareness of subtle difficulties, qualities of the informant relationship, and the levels of functional support available. The quality of caregivers’ reports is an exogenous factor of the actual disease process and may degrade the overall accuracy of our model. Another conceptual limitation of IADL is complications in physical status (walking, bathing, other self-cares). While the current study attempted to rule out the subjects with a significant physical disability assessed with Barthel ADL, there remain possibilities that IADL may have been impaired due to the presence of mild forms of physical distress or frailty. On the other hand, changes in basic self-care can also be affected by cognitive impairment. Excluding some proportion of dementia with moderate severity may omit significant variability in IADL. The unexplained variance of IADL, which was unrelated to cognitive–behavioral or brain structural predictors may indicate the remaining importance of the general physical function in cognitive disorders (Borges, Canevelli, Cesari, & Aprahamian, Reference Borges, Canevelli, Cesari and Aprahamian2019).
Despite the emerging discussions regarding the values of using biological markers of dementia (Jack et al., Reference Jack, Bennett, Blennow, Carrillo, Dunn, Haeberlein and Silverberg2018; Rathore et al., Reference Rathore, Habes, Iftikhar, Shacklett and Davatzikos2017), our study suggests a relatively weak predictive value of brain structural markers and warrants caution in interpreting such markers in terms of predicting real-world functioning. Also, neuropsychological tests can be conceptualized as a structured predictor of the later real-world functional ability, rather than to be lumped together as a clinical outcome (Jack & Holtzman, Reference Jack and Holtzman2013). We suggest that the utility of neuroimaging markers can be more accentuated when examining the prognostic changes of brain pathology, rather than identifying current levels of clinical functioning.
Acknowledgments
The authors would like to acknowledge the support from the regional dementia clinic of Dong Jak district of Seoul for elders.
Financial Support
This research was supported by the Ministry of Science and ICT, Korea, under the Information Technology Research Center support program (No. IITP- 2021-2017-0-01630) supervised by the Institute for Information & Communications Technology Promotion (IITP).
Conflicts of Interest
SK, SMP, YJ, HK, DJO, JL report no disclosures relevant to this manuscript.


