

1. Introduction
The flow past an impulsively started cylinder serves as a prototype for studying the generation of vorticity and its separation from the surface of bluff bodies. In the last hundred years it has been the subject of pioneering and fundamental works in fluid mechanics starting with the seminal work of Prandtl (Reference Prandtl1925) and continuing strong in our times: a possible indication is that a search on Google scholar with the words ‘flow past a circular cylinder’ results in over 7500 entries for 2022 alone. The majority of these studies is concerned with the process of vortex shedding in the wake that occurs after the initial evolution of the vorticity field near the cylinder surface.
The flow past an impulsively started cylinder is initially two-dimensional. Solving the Navier–Stokes equations for planar flows provides physical insight into the process of vorticity generation while the existence of analytical solutions for the early time evolution of the flow allows for testing numerical solvers and explaining complex physics in a two-dimensional framework. Studies of this flow yield insight into fundamental vorticity creation mechanisms (Lighthill Reference Lighthill1963) and provide information for the design of engineering applications (Pedley Reference Pedley1983). Over the last 50 years, theoretical (Collins & Dennis Reference Collins and Dennis1973; Bar-Lev & Yang Reference Bar-Lev and Yang1975), experimental (Bouard & Coutanceau Reference Bouard and Coutanceau1980) and computational studies (Chang & Chern Reference Chang and Chern1991; Koumoutsakos & Leonard Reference Koumoutsakos and Leonard1995; Mittal et al. Reference Mittal, Dong, Bozkurttas, Najjar, Vargas and von Loebbecke2008) have provided invaluable information for the vorticity dynamics of this flow and have motivated our fundamental understanding of unsteady separation (van Dommelen Reference van Dommelen1991). However, to date, most computational and experimental studies have been limited to Reynolds numbers up to  $10\,000$ (Li et al. Reference Li, Shock, Zhang and Chen2004; Wu et al. Reference Wu, Kinnas, Li and Wu2019). Simulations at Reynolds numbers up to
  $100\,000$ were first attempted by Smith & Stansby (Reference Smith and Stansby1988), using vortex methods. The results neither matched the analytical solution at early times, nor converged due to the limitations of vortex methods at those times (Cottett & Koumoutsakos Reference Cottett and Koumoutsakos2000). More recently, Rossinelli et al. (Reference Rossinelli, Hejazialhosseini, van Rees, Gazzola, Bergdorf and Koumoutsakos2015) performed a preliminary study at
  $Re=40\,000$ with wavelet-adaptive vortex methods, where
  ${Re}$ is the Reynolds number. Another study by Durante et al. (Reference Durante, Rossi, Colagrossi and Graziani2017) reported simulations reaching
  $Re = 500\,000$ but focusing on wake vortices and statistically steady-state patterns. They carried out simulations that provide a comprehensive summary of the various flow regimes with varying Reynolds numbers. Their results are not concerned with the impulsive start but put emphasis on fully developed flow with asymmetric conditions and vortex shedding, the correct resolution of which arguably requires fewer computational elements, compared with the resolution of early and transient structures.
The impulsively started flow is characterised by the generation of a vortex sheet on the cylinder surface that diffuses into the flow field before separation (Panton Reference Panton2013). Capturing this early structure along the curved cylinder surface is essential to resolving the subsequent dynamics of vortices separating into the flow field. Increasing the Reynolds number implies significant thinning of the initial vortex layer (with a thickness proportional to  $Re^{-{1}/{2}}$), imposing extreme resolution demands for simulations and stringent requirements for noise-free experimental studies. Here we perform direct numerical simulations (DNS), using adaptive mesh refinement (AMR) to capture the thin vortex layers and their evolution (Almgren et al. Reference Almgren, Bell, Colella, Howell and Welcome1998). The method is validated using analytical solutions for early times (Collins & Dennis Reference Collins and Dennis1973) that serve as a rigorous benchmark for numerical methods.
The present study extends by an order of magnitude the Reynolds number of the benchmark simulations by Koumoutsakos & Leonard (Reference Koumoutsakos and Leonard1995). The simulations provide unique insight in unsteady separation by revealing a striking cascade of vortex instabilities and eruptions. The governing equations and the numerical method are referenced in § 2, while § 3 presents the results of the simulations. We conclude with a summary and an assessment of the relevance of this work to the modelling and control of unsteady separated flows.
2. Governing equations and numerical method
We solve the incompressible Navier–Stokes equations
 \begin{equation} \left.\begin{array}{c@{}} \boldsymbol{\nabla}\boldsymbol{\cdot}\boldsymbol{u}=0,\\ \displaystyle \dfrac{\partial{\boldsymbol{u}}}{\partial{t}}+(\boldsymbol{u} \boldsymbol{\cdot} \boldsymbol{\nabla})\boldsymbol{u}={-}\dfrac{1}{\rho}\boldsymbol{\nabla} p+\nu\nabla^2 \boldsymbol{u}, \end{array}\right\} \end{equation}
where  $\boldsymbol {u},\rho,p$ and
  $\nu$ are the fluid velocity, density, pressure and kinematic viscosity. The no-slip boundary condition is enforced on the cylinder surface with a prescribed velocity
  $\boldsymbol {u}^{s}$ through the penalisation approach (Angot, Bruneau & Fabrie Reference Angot, Bruneau and Fabrie1999; Ueda & Kida Reference Ueda and Kida2021), which augments the Navier–Stokes equations by a penalty term
  $\lambda \chi (\boldsymbol {u}^{s}-\boldsymbol {u})$. Here,
  $\lambda$ denotes the penalisation coefficient. The characteristic function
  $\chi$ takes values
  $\chi =1$ inside the cylinder and
  $\chi =0$ outside. The benefit of this approach in contrast to body-fitted meshes is that it allows for the simulation of multiple deforming geometries with arbitrary shapes, at a manageable computational cost. Equation (2.1) is solved using a pressure projection method (Chorin Reference Chorin1968). The simulations rely on the CubismAMR software (Chatzimanolakis, Weber & Koumoutsakos Reference Chatzimanolakis, Weber and Koumoutsakos2022) that is an adaptive version of the Cubism library, which partitions the simulation domain into cubic blocks of uniform resolution that are distributed to multiple compute nodes for cache-optimised parallelism (Rossinelli et al. Reference Rossinelli, Hejazi, Hadjidoukas, Bekas, Curioni, Bertsch, Futral, Schmidt, Adams and Koumoutsakos2013). CubismAMR organises these blocks in an octree data structure (for three-dimensional simulations) or a quadtree data structure (for two-dimensional simulations), which allows for AMR in different regions (Chatzimanolakis et al. Reference Chatzimanolakis, Weber and Koumoutsakos2022).
At the present Reynolds numbers it is known that symmetric flow conditions can be lost by tiny perturbations, such as numerical round-off errors. In our simulations we confirm a previous finding by Fleischmann, Adami & Adams (Reference Fleischmann, Adami and Adams2019), who found that fixing the order of operations through the inclusion of parentheses in the source code can preserve symmetry. The presence of symmetry without explicitly enforcing it is a manifestation of minimal numerical noise in the computations of the flow past an impulsively started cylinder (Koumoutsakos & Leonard Reference Koumoutsakos and Leonard1995).
In the following, time is non-dimensionalised as  $D/(2U)$, where
  $D$ is the cylinder diameter and
  $U$ its velocity. Simulations were performed in a
  $[0,40D]\times [0,20D]$ domain and the cylinder was placed at
  $(10D,10D)$. The domain was discretised such that the coarsest grid possible had a resolution of
  $128\times 64$ gridpoints. Starting from this resolution, the grid was dynamically adapted in order to capture the cylinder surface and vorticity. The finest resolution was varied in order to guarantee convergence for each case. The region within
  $\pm 0.1D$ of the cylinder surface always has the finest resolution allowed, while the rest of the grid is adapted according to vorticity magnitude
  $|\omega |$. Regions with
  $|\omega | > 5$ are refined and regions with
  $|\omega |<0.01$ are compressed. The regions with intermediate values are neither refined nor compressed. Based on the finest spacing and the highest velocity on the adaptive grid, the time step is computed from a Courant number of 0.45. As discussed in Chatzimanolakis et al. (Reference Chatzimanolakis, Weber and Koumoutsakos2022), the penalisation coefficient
  $\lambda$ can take arbitrarily large values for the present numerical method; here we set
  $\lambda =10^7$, a value above which the cylinder drag coefficient for a simulation at
  $Re=25\,000$ did not change.
The forces acting on the cylinder are computed as surface integrals of the viscous and pressure forces (Chatzimanolakis et al. Reference Chatzimanolakis, Weber and Koumoutsakos2022). In order to relate the appearing vortices in the wake and the forces computed on the surface, we borrow a relation from vortex methods, where the forces can be computed with the help of the following equation (Quartapelle & Napolitano Reference Quartapelle and Napolitano1983; Koumoutsakos & Leonard Reference Koumoutsakos and Leonard1995):
 \begin{equation} {\boldsymbol F}_b={-}\frac{\mathrm{d}}{\mathrm{d} t} \int_{fluid} (\boldsymbol{x}\times \boldsymbol{\omega}) \,\mathrm{d}\kern0.7pt \boldsymbol{x}={-}\frac{\mathrm{d}}{\mathrm{d} t} \sum_{i=1}^N \varGamma_i \boldsymbol{x}_i\times\hat{\boldsymbol{e}}_z.\end{equation}
Here,  $\boldsymbol {x}_i=(x_i, y_i)$ is the location and
  $\varGamma _i$ the strength of the individual vortices in the wake while
  $\hat{\boldsymbol{e}}_z$ denotes the unit vector that is normal to the plane where the vortices lie. This formula carries directly from vortex particle methods but can also be used for any set of
  $N$ vortices. We note that the computation of the forces was not based on this relation, but it is rather stated for the reader to understand the causal relationship between the forces and the vortices in the flow. For example, a vortex that is rotating clockwise (negative
  $\varGamma _i$) and is moving in the positive
  $y$-direction will cause an increase in drag.
3. Results
We present high resolution simulations of the planar flow past a cylinder at  $Re=25\,000$,
  $Re=50\,000$ and
  $Re=100\,000$. Table 1 summarises the resources and spatial resolution used; the effective resolution corresponds to a uniform grid with the finest resolution present on the adaptive mesh. The compression factor is the ratio of the effective resolution divided by the time-averaged number of the employed grid points. In order to ensure converged results, we performed a refinement study and selected the resolution such that each simulation can capture the early pressure and viscous drag history given by the analytical results of Collins & Dennis (Reference Collins and Dennis1973) for
  $t\in [0.01T,1T]$ with less than
  $1\,\%$ error (see figure 1). We remark that those analytical results are considered valid for up to
  $1.5T$ for
  $Re=5000$ and up to
  $1.25T$ for higher Reynolds numbers. The initial transient state of all three cases can be characterised by four phases: (i) the early times of diffusion-dominated evolution of the vortex sheet, (ii) the vorticity eruption, (iii) the re-impingement on the cylinder surface of the wake dipole and (iv) the wake development stage. Depending on the case, those phases may overlap. They are highlighted with different colours in figure 1, which shows the drag coefficient (
 $C_D$) as a function of time. The full time evolution of the vorticity field from
  $t=0$ up to
  $t=20T$ can be found in the supplementary movies available at https://doi.org/10.1017/jfm.2022.988: Movie 1 for
  $Re=25\,000$, supplementary movie 2 for
  $Re=50\,000$ and supplementary movie 3 for
  $Re=100\,000$.

Figure 1. (a–c) Computed pressure (———–, blue) and viscous (———–, orange) drag coefficients and analytical pressure (- - - - -) and viscous (– - – - –) drag coefficients from Collins & Dennis (Reference Collins and Dennis1973). (d–f) Drag coefficient as a function of time. On the time axis we indicate the early vorticity diffusion regime (———–, dark red), the vorticity eruption (———–, blue), the re-impingement on the cylinder surface of the wake dipole (———–, green), and the wake development stage (———–, orange).
Table 1. Summary of DNS for the flow around a cylinder.

3.1.  $Re=25\,000$

The four previously mentioned phases are distinct for this Reynolds number and are described in the following. Stages (i) to (iii) repeat themselves as the flow evolves, with stage (i) manifesting itself before the first separation point, stage (ii) spreading throughout the back of the cylinder and stage (iii) repeating at regular intervals.
3.1.1. Vorticity diffusion at early times
During this period the vortex sheet generated on the cylinder surface right after its impulsive start diffuses outwards (Lighthill Reference Lighthill1963) and the drag decreases inversely proportional to the square root of time.
3.1.2. Flow separation via vorticity eruptions
At  $\sim 1.5T$, primary vortices are pushed outwards by the secondary vorticity, roll up and begin to shed. While at
  $Re=10\,000$ and below, this process appears in only one point on the cylinder surface; here we observe three such instances (figure 3a). The shedding process is reminiscent of a Kelvin–Helmholtz instability, known to also occur when transitioning from the
  $Re=1000$ to the
  $Re=10\,000$ regime (Kourta et al. Reference Kourta, Boisson, Chassaing and Minh1987; Sheridan et al. Reference Sheridan, Soria, Jie and Welsh1993), for the primary vortex sheet that is being disturbed by the secondary vortices that grow and cut the primary vortex sheet from the cylinder surface. The shed vortices merge in the vicinity of the cylinder surface and form two elongated, counter-rotating ones right behind the cylinder (figure 3). After the flow separates for the first time, the separation point moves towards the front of cylinder surface at a gradually increasing angle. The location of points of zero vorticity (an indication of steady separation, shown in the first row of figure 2) asymptotically reaches an angle of
  $\sim 105^\circ$ at
  $4T$. During this process, the drag coefficient keeps increasing. The separation is accompanied by a signature of constant pressure on the cylinder surface (figure 2d–f).

Figure 2. (a–c) Angles of zero vorticity on cylinder surface, as a function of time. (d–i) Pressure coefficient and surface vorticity for  $t=0$ (———–, blue),
  $t=5$ (———–, orange),
  $t=10$ (———–, green),
  $t=15$ (———–, dark red),
  $t=20$ (———–, violet). All angles are measured from the right-most cylinder point. Due to symmetric flow conditions, angles up to 180
 $^\circ$ are shown that correspond to the top half of the cylinder.
3.1.3. Re-impingement of dipolar vortices
After the first two large vortices have been shed and the separation point has reached its most forward location, smaller vortices are created and the aforementioned process is repeated. An inverse cascade is observed, as small shed eddies combine, forming larger vortices; by  $5T$ four of them can be seen at the wake. As the first large pair of vortices is advected downstream, they are gradually attracted and form a dipole that returns towards the cylinder surface. At
  $7T$ the dipole starts approaching the cylinder, bringing the stronger vorticity closer to the centreline of the flow and causing some drag reduction and a local drag minimum as it impinges the cylinder surface, see also (2.2). At
  $\sim 10T$, the dipole briefly slides onto the cylinder surface, as shown in figure 3, generating a series of secondary vortices; refer also to the studies performed by Homa, Lucas & Rockwell (Reference Homa, Lucas and Rockwell1988) and Orlandi (Reference Orlandi1993). The formation of the first dipole and the first pair of recirculating vortices is visualised in figure 3. We note that the process of re-impingement is repeated throughout the flow with alternating vortex pairs re-impinging on the surface before merging into larger vortices that are finally weakened and shed into the wake.

Figure 3. Vorticity field at  $Re=25\,000$. Negative/positive vorticity is coloured with blue/orange. (a)
  $t=1.5T,2.5T,3.5T$ (vorticity eruption stage), (b)
  $t=5T,7T,9T$ (re-impingement of the wake dipole on the cylinder surface), (c)
  $t=10T,10.4T,10.8T$ (time when the dipole hits the cylinder and slides onto its surface).
3.1.4. Wake formation
The re-impingement gives rise to a plethora of new vortices that merge with primary vortex structures at the front separation point and are shed into the wake. The last row of figure 2 shows the vorticity created at the cylinder surface. Regions of separated flow are characterised by oscillations around zero vorticity points. The region between 90 $^\circ$ and 270
 $^\circ$, where the flow is still attached to the cylinder, reaches constant, steady-state values of vorticity after
  $10T$, which signifies the start of the wake formation stage.
3.2. $Re=50\,000$

At  $Re=50\,000$, stages (i) and (ii) of the flow are repeated with the key difference that the first separation occurs further in the back of the cylinder and approximately five eruptions (or ‘instabilities’) are observed in the primary vortex structure (figure 4a). The separating vortices are smaller in size and stronger. The displacement of the separation point on the surface happens simultaneously with flow reattachment (figure 4b).

Figure 4. Vorticity field at  $Re=50\,000$. Negative/positive vorticity is coloured with blue/orange. (a) Forming of instabilities and first five vorticity eruptions (
 $t=2T,2.5T,3T$). (b) Vortex dipole re-impingement and simultaneous movement of the flow separation point (
 $t=3.5T,5.5T,7.5T$). (c) Mixing of smaller vortices to form larger structures (
 $t=10T$ and
  $t=15T$).
3.2.1. Separation and vortex dipole re-impingement
Contrary to Reynolds number flows below  $Re=10\,000$, where we observe a distinct separation point, here several primary vortices roll up, pair with the secondary vorticity leading to dipoles erupting from the cylinder surface. We observe instabilities on the primary vortex sheet starting to form at approximately
  $2T$ and a series of small dipoles are being shed. The wake flow involves a mixing and annihilation of these dipoles (except some surviving by departing into the far wake) leading eventually to the merging or primary vortices and formation of a larger structure (refer to figure 4c). The pressure coefficient is plotted in the centre row of figure 2. Again, regions of constant pressure are associated with separated flow and cause an increase in drag. The points of zero vorticity (and zero shear stress) are shown in the first row of figure 2. The separation point is moving along the cylinder surface and seems to asymptotically reach a location at an angle of
  $\sim 110^\circ$.
3.2.2. Wake formation
After the separation point reaches a location of  $\sim 110^\circ$, small vortices merge into larger ones and an inverse energy cascade takes place. Repeated re-impingement reduces the drag at regular intervals (figure 1). After repeated mergers, larger vortices form and are advected downstream, forming the wake. The last row in figure 2 shows vorticity on the cylinder surface. Similar to the previous case, strong oscillations with almost a zero mean appear at the region of flow separation, whereas the vorticity profile stops changing in the region of attached flow, after
  $10T$.
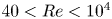
3.3. $Re=100\,000$

At  $Re=100\,000$, we observe a large decrease of the mean drag and repeated instances where the drag forces are close to zero. The situation is reminiscent of the well-known drag crisis (Singh & Mittal Reference Singh and Mittal2005) but we refrain from adopting this term as we are simulating planar flows. The four stages that characterise the transient state cannot be distinguished clearly as in the previous cases, with elements of each appearing in different regions of the flow field in the vicinity of the cylinder. The primary vortex sheet breaks into a multitude of vortices leading to planar turbulent flow and a reduced breadth of the wake (figure 5a). Vortical structures in the wake are smaller, characterised by pairing and destruction of almost circular dipoles. Similar to the flow at
  $Re=50\,000$ the re-impingement and flow separation start simultaneously. However, here the tight small vortices that separate form immediately dipoles with vortices from the lower side of the cylinder and re-impinge to the surface fast, not allowing the drag to increase (see middle of figures 5 and 1).

Figure 5. Vorticity field at  $Re=100\,000$. Negative/positive vorticity is coloured with blue/orange. (a) Initial vortex eruptions and vortex sheet breaking into multiple smaller structures (
 $t=2T,2.5T,3T$). (b) Formed dipoles merge quickly and re-impinge on the cylinder surface, causing drag reduction (
 $t=5T,6T,7T$). (c) Developed wake of the cylinder, exhibiting a fragile symmetry (
 $t=20T$).
The separation angle in this case tends to 90 $^\circ$, as can be seen in the first row of figure 2. This smaller angle, compared with lower Reynolds numbers, means that the flow remains attached for longer, thanks to the boundary layer's transition to turbulence. Being almost 90
 $^\circ$, it leads to vortices departing almost horizontally, limiting the wake's thickness to approximately one cylinder diameter. Larger eddies are formed in the middle and smaller ones are advected at the edges of the wake (figure 5). The wake has a very fragile symmetry that can in practice easily be broken by round-off errors or by the slightest of imperfections in an experiment. In fact, reaching the symmetric state shown for
  $t=20T$ may never be feasible by experiments.
We observe flat pressure profiles that span a smaller region along the cylinder's surface for  $Re=100\,000$ (compared with
  $Re=50\,000$), which accounts for the observed drag reduction and delayed separation. See also the centre row of figure 2 where the pressure coefficient is plotted. Even stronger oscillations are present in the surface vorticity profiles (last row of figure 2). The vorticity profile in the attached region becomes fixed earlier than before, at approximately
  $t=5T$.
3.4. Discussion
The present simulations uncover a process of bluff-body unsteady separation that exhibits common patterns, not evident from simulations at lower Reynolds numbers. Vortex ‘separation’ occurs in multiple regions along the cylinder surface as the initial vortex sheet develops instabilities. Those lead to primary vortex roll-ups that erupt along with secondary vorticity from the cylinder surface. As they enter the wake, the weaker secondary vorticity is eventually annihilated during the merging of smaller primary vortices into larger ones. The second common pattern is that of vortex impingement on the back of the cylinder as primary vortices from both sides of the cylinder rotate and attract each other to the centre line, forming a reverse jet that leads to drag reduction. The re-impinging vortices lead again to secondary separation and a cascade of new vortex dipoles that are ejected into the wake. These patterns may have significant implications for flow modelling and control in terms of discrete vortex dynamics (Darakananda et al. Reference Darakananda, Eldredge, Colonius and Williams2016; Eldredge Reference Eldredge2019). The present simulations may be abstracted in terms of asymmetric vortex dipoles that are being ejected from the cylinder surface at locations across the body surface. The simulations also indicate that a mechanism for drag reduction is the re-impingement of wake vortices into the cylinder surface. Such mechanisms may be promoted by suitable wake controllers (Vernet, Örlü & Alfredsson Reference Vernet, Örlü and Alfredsson2018).
4. Conclusions
We present high-resolution simulations of the planar flow past an impulsively started circular cylinder at Reynolds numbers up to  $100\,000$. Our numerical method accurately captures the early times analytical solutions and preserves the fragile symmetry of the flow. Our results provide insight into mechanisms of unsteady separation that may not be evident from lower-
 $Re$-number simulations. Four distinct stages are identified: the early times of diffusion-dominated evolution of the vortex sheet, the vorticity eruption, the re-impingement on the cylinder surface of the wake dipole and the wake development stage. A strong dependence of drag on the vortex patterns observed during these stages is identified. Commencing of separation leads to a significant increase in drag, whereas vortex re-impingement leads to local drag minima. We observe a large drag reduction at
  $Re=100\,000$ when the primary separation angle becomes equal to or less than 90
 $^\circ$. By comparing the flows at different Reynolds numbers, we find that the mechanisms of wake formation involve a cascade of separation events and merging of small primary vortices and the annihilation of secondary vorticity that erupts in the form of tight dipoles from the cylinder surface. Inducing such dipole eruptions may be an effective mechanism for control of turbulent, unsteady separated flows.
Supplementary movies
Supplementary movies are available at https://doi.org/10.1017/jfm.2022.988.
Acknowledgements
We acknowledge computational resources granted by the Swiss National Supercomputing Center (CSCS) under project ID s929.
Declaration of interests
The authors report no conflict of interest.