


1. Introduction
Immersed granular flows such as debris flows, landslides or submarine avalanches are ubiquitous in nature. They are often associated with catastrophic events leading to infrastructure destruction and human losses. These flows belong to dense particulate two-phase flows involving a solid phase and a fluid phase interacting one with the other. In the case of a gravity-driven flow of cohesionless grains immersed in a fluid, the relative motion of the fluid with respect to the solid skeleton may dramatically modify the overall dynamics of the mixture (e.g. Iverson Reference Iverson1997). Therefore, modelling and predicting interactions between the fluid and solid phases in immersed granular flows are of major interest. Due to the complexity of the processes involved, grain–fluid interactions still remain a real challenge and the goal of the present contribution is to propose an alternative two-phase flow model for predicting such flows.
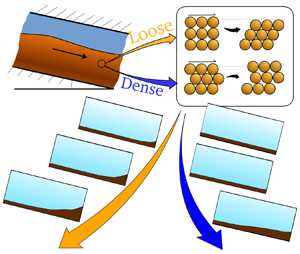
In a series of landslide experiments performed at the USGS large-scale facility, Iverson et al. (Reference Iverson, Reid, Iverson, LaHusen, Logan, Mann and Brien2000) put in evidence the critical influence of the initial soil volume fraction on the landslide dynamics when submitted to rainfall. An initially loose soil flows down a slope almost instantaneously while an initially dense soil slowly creeps for a while before the landslide is eventually triggered. The explanation behind these observations involves two processes. First, in the absence of fluid, an initially dense granular medium dilates when submitted to shear deformation while an initially loose granular medium exhibits a contraction behaviour (e.g. Reynolds Reference Reynolds1885; Mitchell & Soga Reference Mitchell and Soga2005). In between these two initial volume fractions, there is a critical state for which the granular medium flows without any change in the volume fraction (Schofield & Wroth Reference Schofield and Wroth1968). Second, when dilation/contraction occurs in a saturated granular medium, due to the incompressibility of the fluid, the variation of the pore volumes induces an inward/outward fluid flow and a resulting fluid pore pressure gradient (negative/positive) which can significantly affect the deformation of the soil, this mechanism being called ‘pore pressure feedback’ (Iverson Reference Iverson2005). More recently, Pailha, Nicolas & Pouliquen (Reference Pailha, Nicolas and Pouliquen2008) conducted small-scale experiments in a tiltable Hele-Shaw cell using spherical particles in a viscous liquid. The authors varied the initial volume fraction of the granular bed and measured the surface velocity of the bed as well as the fluid pore pressure at the bottom of the granular bed. The experimental results reproduce the same phenomenology as the large-scale experiments from Iverson et al. (Reference Iverson, Reid, Iverson, LaHusen, Logan, Mann and Brien2000) and represent the most comprehensive dataset for the development and validation of two-phase flow models including dilatancy effects.
The first attempt to model this behaviour based on the depth-averaged two-phase flow equations was proposed by Pitman & Le (Reference Pitman and Le2005). Since then, several contributions have been published incorporating dilatancy and pore pressure feedback into this framework. Pailha & Pouliquen (Reference Pailha and Pouliquen2009) introduced a linear approximation of the dilatancy angle as function of the volume fraction, shear rate and granular pressure. In turns, the dilatancy angle was added as an additional frictional coefficient to compute the granular shear stress. Their model solves for the temporal evolution of the system at a single spatial position and has been validated against experimental data from Pailha et al. (Reference Pailha, Nicolas and Pouliquen2008). Iverson & George (Reference Iverson and George2014) essentially extended this model in two dimensions and incorporated a slight compressibility to obtain the basal pore pressure. The proposed model has been validated in George & Iverson (Reference George and Iverson2014) for large-scale debris flow experiments from Iverson et al. (Reference Iverson, Reid, Iverson, LaHusen, Logan, Mann and Brien2000). Bouchut et al. (Reference Bouchut, Fernández-Nieto, Mangeney and Narbona-Reina2016) proposed a depth-averaged model for immersed granular flows based on a thin-layer approximation. The model has been successfully validated with the experimental data from Pailha et al. (Reference Pailha, Nicolas and Pouliquen2008) for an immersed granular avalanche. All these models are able to reproduce the dilatant and contractant behaviour of the granular flow as a function of the initial compaction of the granular bed.
More recently, Wang et al. (Reference Wang, Wang, Peng and Meng2017) and Yin et al. (Reference Yin, Jin, Kotronis and Wu2018) proposed a multidimensional two-phase flow model including dilatancy effects for immersed granular flows using the critical state theory in the framework of the smoothed particle hydrodynamics method. Baumgarten & Kamrin (Reference Baumgarten and Kamrin2019) derived a set of governing equations for fluid–sediment mixtures capable of reproducing granular flows ranging from dense to dilute regime. Their model was implemented in the material point method to describe the dilatant/contractant behaviour of a granular column collapse depending on the initial volume fraction. Using a finite volume approach, Lee & Huang (Reference Lee and Huang2018) developed a two-fluid model that correctly predicts the effect of the initial volume fraction and the pore pressure feedback for the collapse of a submerged granular column. The same model has been successfully tested to reproduce underwater landslides (Yu & Lee Reference Yu and Lee2019). Similarly, Si, Shi & Yu (Reference Si, Shi and Yu2018) introduced a two-phase model to explore the granular behaviour during the collapsing process of underwater columns. In addition to dilatancy, their model takes into account a cohesive effect of the fluid phase on the solid particles. However, these multiphase flow models ignore the plastic effects on the solid pressure due to particle rearrangements. Indeed, Mari et al. (Reference Mari, Seto, Morris and Denn2014) showed that these effects are crucial for fully describing the dilatant/contractant behaviour of granular flows and the authors proposed a frictional–viscous model for dense suspensions in which increasing frictional contacts between particles form as the shear rate increases. Similarly, Dsouza & Nott (Reference Dsouza and Nott2020) suggested that plastic deformations at a certain point do not occur exclusively by local yielding and introduced a non-local constitutive model for slow granular flow. Recently, Lee (Reference Lee2021) introduced a sophisticated two-phase depth-resolved model to capture the shear-induced volume change and the pore-pressure feedback. The main contribution of that work is to incorporate a relaxation process in the static solid pressure to include the changes caused by grain rearrangements and compression. The present work follows a similar yet slightly simpler approach. Namely, the compressibility of the grains is neglected, whereas the deformation of the granular skeleton is related the changes in granular stress in an elasto-plastic framework. Moreover, the present study extends the analysis of granular avalanches to initially very loose beds. Although Lee (Reference Lee2021) also focused on slightly loose granular avalanches, the contractant behaviour was not investigated. In the current work, however, the contractant behaviour is studied in detail for considerably loose beds.
The aim of the present work is to develop a multidimensional two-phase flow model which includes dilatancy and incorporates plastic effects on the solid pressure due to particle rearrangements. Like most recent two-phase flow models, our approach combines critical state theory and rheology to describe the granular flow (see § 2). In order to validate the proposed model, the underwater avalanches performed by Pailha et al. (Reference Pailha, Nicolas and Pouliquen2008) are reproduced numerically (§ 3). Additionally, the influences of the steady-state granular rheology parameters and the inclination angle are presented in § 3 together with a sensitivity analysis of numerical calibration parameters and permeability. Finally, two-dimensional (2-D) simulations corresponding to the exact experimental configuration are also presented in § 3.
2. Mathematical formulation
In this section the Eulerian–Eulerian two-phase flow governing equations and the closures for the drag force and the fluid and particle phase stresses are presented.
2.1. Two-phase flow governing equations
The mass conservation equations for the solid phase and fluid phase are written as follows:
 \begin{gather} \frac{\partial \phi }{\partial t} + \boldsymbol{\nabla} \boldsymbol{\cdot} ( \boldsymbol{u}^{\boldsymbol{s}} \phi )= 0, \end{gather}
 \begin{gather}\frac{\partial (1-\phi) }{\partial t} + \boldsymbol{\nabla} \boldsymbol{\cdot} ( \boldsymbol{u}^{\boldsymbol{f}} (1-\phi) )= 0, \end{gather}
where  $\phi$ is the solid volume faction,
  $\boldsymbol {u}^{\boldsymbol {s}}$ is the particle phase velocity and
  $\boldsymbol {u}^{\boldsymbol {f}}$ is the fluid phase velocity. Hereafter
  $\boldsymbol {S}^{\boldsymbol {f}}$ and
  $\boldsymbol {S}^{\boldsymbol {s}}$ denote the deviatoric and symmetric part of the velocity gradient for the fluid phase and for the solid phase, respectively:
 \begin{equation} \boldsymbol{S}^{\boldsymbol{f}}= \tfrac{1}{2} \left ( \boldsymbol{\nabla} \boldsymbol{u}^{\boldsymbol{f}} + (\boldsymbol{\nabla} \boldsymbol{u}^{\boldsymbol{f}})^\textrm{T} \right ) - \tfrac{1}{3} \textrm{tr}(\boldsymbol{\nabla} \boldsymbol{u}^{\boldsymbol{f}}). \end{equation}
Their norm is defined by  $\vert \vert \boldsymbol {S}\vert \vert = \sqrt {2 \,\textrm {tr}(\boldsymbol {S}\boldsymbol {:}\boldsymbol {S})}$, where ‘:’ denotes the tensor product.
Following Iverson (Reference Iverson1997), the momentum conservation equations for the solid phase and fluid phase are written as
 \begin{gather} \rho^{s} \phi \left[ \frac{\partial \boldsymbol{u}^{\boldsymbol{s}} }{\partial t} + \boldsymbol{\nabla} \boldsymbol{\cdot} \left(\boldsymbol{u}^{\boldsymbol{s}}\otimes \boldsymbol{u}^{\boldsymbol{s}} \right)\right]= \phi(\rho^{s}-\rho^{f}) \boldsymbol{g} + \dfrac{(1-\phi) \rho^{f} \nu^{f}}{k} (\boldsymbol{u}^{\boldsymbol{f}} - \boldsymbol{u}^{\boldsymbol{s}}) - \boldsymbol{\nabla} p^{s} + \boldsymbol{\nabla} \boldsymbol{\cdot} \boldsymbol{\tau^{s}} \nonumber\\ \quad - \phi \boldsymbol{\nabla} p^{f}, \end{gather}
 \begin{gather} \rho^{f} (1-\phi) \left[\frac{\partial \boldsymbol{u}^{\boldsymbol{f}} }{\partial t}+ \boldsymbol{\nabla} \boldsymbol{\cdot} \left( \boldsymbol{u}^{\boldsymbol{f}}\otimes \boldsymbol{u}^{\boldsymbol{f}} \right)\right]= \dfrac{(1-\phi) \rho^{f} \nu^{f}}{k} (\boldsymbol{u}^{\boldsymbol{s}} - \boldsymbol{u}^{\boldsymbol{f}}) + \boldsymbol{\nabla} \boldsymbol{\cdot} \boldsymbol{\tau^{f}} - (1-\phi) \boldsymbol{\nabla} p^{f}, \end{gather}
where  $\rho ^{s}$ is the solid density,
  $\rho ^{f}$ is the fluid density,
  $\otimes$ is the outer product of two vectors,
  $p^{f}$ is the excess pore pressure,
  $p^{s}$ is the solid pressure,
  $\boldsymbol {\tau }^{\boldsymbol {s}}$ is the granular shear stress,
  $\boldsymbol {\tau }^{\boldsymbol {f}}$ is the fluid phase shear stress and
  $k$ is the permeability of the porous medium modelled following Ergun (Reference Ergun1952) as
 \begin{equation} k= \frac{d^{2} \nu^{f} (1-\phi)^{2}}{150 \phi \nu^{f} + 1.75 d \left\| \boldsymbol{u}^{\boldsymbol{f}} - \boldsymbol{u}^{\boldsymbol{s}} \right\| }, \end{equation}
where  $\nu ^{f}$ is the fluid kinematic viscosity and
  $d$ is the mean particle diameter.
Similar to Revil-Baudard & Chauchat (Reference Revil-Baudard and Chauchat2013), closures are proposed to model the fluid and intergranular stresses separately. Inspired by the empirical suspension model of Boyer & Pouliquen (Reference Boyer, Guazzelli and Pouliquen2011), wherein the total stress is the sum of contact and hydrodynamic contributions, we assume that the partial stress associated with the fluid phase corresponds to the hydrodynamic part (of the Boyer & Pouliquen (Reference Boyer, Guazzelli and Pouliquen2011) model):
 \begin{equation} \boldsymbol{\tau}^{\boldsymbol{f}}= 2 \rho^{f} \nu^{f} (1- \phi) \left ( 1+ \tfrac{5}{2} \phi I_v^{{-}1/2} \right )\boldsymbol{S}^{\boldsymbol{f}}. \end{equation}
 The viscous number  $I_v$ in (2.7) is the inverse of a normalized granular pressure, defined as
 \begin{equation} I_v = \dfrac{ \rho^{f} \nu^{f} \vert\vert \boldsymbol{S}^{\boldsymbol{s}}\vert\vert }{p^{s}}, \end{equation}
and empirically related to the solid volume fraction by
 \begin{equation} I_v= \left ( 1- \frac{\phi_{c}}{\phi} \right )^{2}, \end{equation}
where  $\phi _{c}$ is the volume fraction in quastistatic shear (
 $I_v \rightarrow 0$). Note that the Reynolds shear stress terms and the turbulent suspension terms are not incorporated in this work as only laminar flows are considered herein.
The shear stress  $\boldsymbol {\tau }^{\boldsymbol {s}}$ from solid contacts is described in Boyer & Pouliquen (Reference Boyer, Guazzelli and Pouliquen2011) in terms of a Coulomb-type friction law by introducing a state-dependent friction coefficient
  $\mu$. It is worth mentioning that in the context of viscous inertial flows, Boyer & Pouliquen (Reference Boyer, Guazzelli and Pouliquen2011), Trulsson, Andreotti & Claudin (Reference Trulsson, Andreotti and Claudin2012), Amarsid et al. (Reference Amarsid, Delenne, Mutabaruka, Monerie, Perales and Radjai2017), Baumgarten & Kamrin (Reference Baumgarten and Kamrin2019) and Vo et al. (Reference Vo, Nezamabadi, Mutabaruka, Delenne and Radjai2020) proposed several dimensionless numbers to characterize the flow. Following Boyer & Pouliquen (Reference Boyer, Guazzelli and Pouliquen2011), in this work the viscous dimensionless number is considered to determine the friction coefficient for a certain shear state:
 \begin{equation} \mu(I_v)= \mu_s + \dfrac{ \Delta \mu }{ I_0/I_v + 1}, \end{equation}
where the empirical material constants correspond to the static friction coefficient  $\mu _s$, the dynamic friction coefficient
  $\Delta \mu$ and the reference viscous number
  $I_0$.
Thus, this allows the granular shear stress to be cast in the form
 \begin{equation} \boldsymbol{\tau}^{\boldsymbol{s}}= \rho^{s} \nu^{s} \boldsymbol{S}^{\boldsymbol{s}}, \end{equation}
where  $\nu ^{s}$ is the frictional shear viscosity:
 \begin{equation} \nu^{s}= \frac{ \mu(I_v) p^{s}}{ \rho^{s} \vert\vert \boldsymbol{S}^{\boldsymbol{s}}\vert\vert}. \end{equation}
 Equation (2.12) introduces a singularity in  $\vert \vert \boldsymbol {S}^{\boldsymbol {s}}\vert \vert =0$. There is no singularity in the original model of Boyer & Pouliquen (Reference Boyer, Guazzelli and Pouliquen2011) because therein the granular pressure
  $p^{s}$ is proportional to
  $\vert \vert \boldsymbol {S}^{\boldsymbol {s}}\vert \vert$; however, such viscous scaling is only valid at steady state in a flowing regime. Equation (2.12) is a yield condition; thus, it does not necessarily hold in static or transient conditions (see next section), and possible singularities remain. They are addressed by the regularization technique of Chauchat & Médale (Reference Chauchat and Médale2014), such that the regularized form reads
 \begin{equation} \nu^{s}= \frac{ \mu(I_v) p^{s}}{ \rho^{s} \left ( \vert\vert \boldsymbol{S}^{\boldsymbol{s}}\vert\vert^{2}+\lambda^{2}_r \right ) ^{1/2}}, \end{equation}
and the regularization parameter is taken to be  $\lambda _r=10^{-6}$ s
 $^{-1}$.
It is noteworthy that (2.7), (2.10), (2.11) and (2.12) fully recover the Boyer & Pouliquen (Reference Boyer, Guazzelli and Pouliquen2011) model under the framework of a two-phase model.
2.2. Dilatancy model
Equations (2.8) and (2.9) together imply that in a steady flowing state,  $\phi$ is a function of
  $p^{s}$ and shear rate:
 \begin{equation} \phi_{\infty} = \frac{\phi_{c}}{1+ I_v^{1/2}}. \end{equation}
Transitions between various values of solid fraction are thus expected in transient conditions, such as the onset of an avalanche, fluctuating flow rates or arrest. In quasistatic deformations this phenomenon is often referred to as dilatancy.
At this point, it is worth noting that (2.14) does not strictly imply a change of  $\phi$ after every increase/reduction of shear rate. There is, indeed, an implied dependency on
  $p^{s}$ through
  $I_v$, such that the equation could be inverted to give the rate-dependent normal stress
  $p^{s}_{\infty }$ in isochoric simple shear (where
  $\phi$ is imposed) as
 \begin{equation} p^{s}_{\infty} = \rho^{f} \nu^{f} \vert\vert \boldsymbol{S}^{\boldsymbol{s}}\vert\vert \left ( 1- \frac{\phi_{c}}{\phi} \right )^{{-}2}. \end{equation}
 In general conditions, both  $\phi$ and
  $p^{s}$ can be variable in space and time though still satisfying (2.15) in stationary or weakly transient regimes.
Dilatancy is classically associated with a coefficient  $\delta$, defining the instantaneous rate of expansion under constant granular pressure
  $p^{s}$ as
 \begin{equation} -\frac{1}{\phi} \frac{\textrm{d} \phi}{\textrm{d}t}= \boldsymbol{\nabla} \boldsymbol{\cdot} \boldsymbol{u}^{\boldsymbol{s}} = \delta \vert\vert \boldsymbol{S}^{\boldsymbol{s}}\vert\vert, \end{equation}
where  $\delta$ depends, in general, on internal state variables (at least current
  $\phi$).
The dependency of internal friction on  $\phi$ in softening or hardening regimes is often related to
  $\delta$ (Rowe Reference Rowe1962). Earlier two-phase flow models for granular avalanches (Pailha & Pouliquen Reference Pailha and Pouliquen2009; Bouchut et al. Reference Bouchut, Fernández-Nieto, Mangeney and Narbona-Reina2016) partly accounted for dilatancy by defining a
  $\phi$-dependant friction invoking the dilatancy coefficient (
 $\delta$). A dilatant material (
 $\delta >0$) then led to an increase of the effective friction, while a contractant material (
 $\delta <0$) led to a lower effective friction.
In contrast, the present work makes no a priori assumption on  $p^{s}$. Instead,
  $p^{s}$ is defined as a visco-elasto-plastic material response to be integrated as part of the solution. Following Johnson & Jackson (Reference Johnson and Jackson1987), Cheng, Hsu & Calantoni (Reference Cheng, Hsu and Calantoni2017) and Chauchat et al. (Reference Chauchat, Cheng, Nagel, Bonamy and Hsu2017), the total solid-phase pressure
  $p^{s}$ is defined as the sum of a viscous shear-induced contribution
  $p_s^{s}$ and of a contribution
  $p_c^{s}$ reflecting enduring contacts:
 \begin{equation} p^{s}=p^{s}_s+p^{s}_c. \end{equation}
The enduring contacts term is related to the elastic compliance of the granular phase. It depends on the difference between the actual solid fraction  $\phi$ and the reference solid fraction
  $\phi _{pl}$ (the dilatancy effects are embedded in the evolution of
  $\phi _{pl}$ hereafter). We assume that
  $p_c^{s}$ corresponds to an elastic repulsion taking the form
 \begin{equation}
\left.\begin{array}{ll@{}} 0 & \phi < \phi_{pl}
\\ p^{s}_{c}=E
\dfrac{(\phi-\phi_{pl})^{3}}{(\phi_{rcp}-\phi)^{5}} & \phi
\geqslant \phi_{pl}, \end{array}\right\}
\end{equation}
\begin{equation}
\left.\begin{array}{ll@{}} 0 & \phi < \phi_{pl}
\\ p^{s}_{c}=E
\dfrac{(\phi-\phi_{pl})^{3}}{(\phi_{rcp}-\phi)^{5}} & \phi
\geqslant \phi_{pl}, \end{array}\right\}
\end{equation}
where  $E$ is an elastic modulus and
  $\phi _{rcp}$ is the random close packing (
 $\phi _{rcp}=0.625$ for spheres). A similar functional dependency can be found in Johnson & Jackson (Reference Johnson and Jackson1987) yet therein
  $\phi _{pl}$ is assumed to be constant and usually referred to as the random loose packing fraction. Capturing dilatancy needs, instead, to consider initial and transient packing fractions which differ from the random loose packing fraction.
It is worth mentioning that the initial value of  $\phi _{pl}$ is used to control the initial volume fraction (
 $\phi _{0}$). The initial volume fraction is computed as the depth-averaged volume fraction over the bed height:
 \begin{equation} \phi_{0}=\frac{1}{h_0}\int_{0}^{h_0} \phi(y,t=0) \,{\textrm{d} y} , \end{equation}
where  $h_0$ is the lowest wall-normal position above which
  $\phi \leqslant \phi _{top}=0.55$. Different volume fractions can be achieved by changing the initial plastic volume fraction (
 $\phi _{pl,t=0}$) which is kept constant during the gravitational deposition. Once the equilibrium state is reached, the numerical sedimentation is over and
  $\phi _{pl}$ evolves following (2.20). Large values (
 $\phi _{pl,t=0} > 0.565$) lead to initially dense granular beds whereas low values (
 $\phi _{pl,t=0} < 0.54$) result in initially loose granular packings.
Following the classical decomposition of volumetric strain into elastic and plastic parts and using (2.16) as the plastic flow rule (Roscoe, Schofield & Wroth Reference Roscoe, Schofield and Wroth1958; Nova & Wood Reference Nova and Wood1982) gives the evolution law for  $\phi _{pl}$ as a function of the shear deformation (
 $\gamma$):
 \begin{equation} \frac{\textrm{d} \phi_{pl}}{\textrm{d} \gamma } ={-} \phi_{pl} \delta . \end{equation}
Based on the chain rule, (2.20) can also be expressed as
 \begin{equation} \frac{\partial\phi_{pl}}{\partial t} + \boldsymbol{u}^{\boldsymbol{s}} \boldsymbol{\cdot} \boldsymbol{\nabla} \phi_{pl} ={-} \phi_{pl} \delta \vert\vert \boldsymbol{S}^{\boldsymbol{s}}\vert\vert. \end{equation}
 Solid fraction  $\phi$ is supposed to converge asymptotically to
  $\phi _{\infty }$ (equation (2.14)) with a first-order kinetics (as in Pailha & Pouliquen Reference Pailha and Pouliquen2009). Hence in the above equation
 \begin{equation} \delta = K_1 ( \phi-\phi_{\infty}), \end{equation}
where  $K_1=4$ is a calibration parameter. Although literature measurements of the dilatancy coefficient generally fall in the range
  $-0.4 \leqslant \delta \leqslant 0.4$ (Pouliquen & Renaut Reference Pouliquen and Renaut1996; Iverson & George Reference Iverson and George2014; Alshibli & Cil Reference Alshibli and Cil2018), the numerical model of this work sets the limits
  $-0.9 \leqslant \delta \leqslant 0.9$.
This model extends the critical state soil mechanics (at least in a simple form) to a rate-dependent critical state  $\phi _{\infty }$ – whereas in other approaches
  $\phi _{\infty }$ is usually a function of
  $p^{s}$ only in quasistatic deformations of soils. In slow isochoric shear (simple shear at constant volume), this model leads to an increase or a decrease of granular pressure depending on the initial volume fraction which, in turn, results in pressure-driven expansion or compaction of the solid phase under shear.
Finally, the viscous contribution  $p_s^{s}$ to the granular pressure is defined consistently with the stationary pressure given by (2.15). The actual pressure is supposed to converge asymptotically to the stationary pressure with accumulated strain; hence a rate equation similar to that formulated for
  $\phi _{pl}$ governs the progressive mobilization of
  $p_s^{s}$:
 \begin{equation} \frac{\textrm{d} p^{s}_s }{\textrm{d} \gamma} = K_2 \phi ( p^{s}_{\infty} - p^{s}_s ). \end{equation}
 Some studies (Utter & Behringer Reference Utter and Behringer2004; Sun & Sundaresan Reference Sun and Sundaresan2011) have shown that the pressure arising from shear deformation exhibits some delay in opposition to the instantaneous deformation of the mixture. It seems, thus, reasonable to adopt different values for  $K_1$ and
  $K_2$. Here,
  $K_2=1$ is taken.
Equations (2.20) and (2.23) together govern the changes of the visco-plastic shear-induced pressure which, in turn, influence the motion of the solid phase and the evolution of volume fraction in time. In the case of an initially dense bed, the typical response of the sediment in this model can be summarized in the following sequence.
Right after the initial tilting, the granular shear stress is controlled by the static friction  $\mu _s$ and granular pressure
  $p^{s}$:
  $\tau ^{s}= \mu _s p^{s}$. Since the changes in
  $p^{s}$ require enough accumulated strain, initially the mixture remains at equilibrium.
As the flow starts to develop,  $p^{s}$ increases following (2.20) and (2.23) (mainly the former when flow rate is still small). The consequences are twofold: first, bed expansion, by which the excess
  $p^{s}$ is released. At the same time the dilatant bed acts against the macroscopic drag (equation 2.6). Second, increased
  $p^{s}$ implies a proportional increase of the mobilized shear stress (
 $\mu p^{s}$) locally, which reduces the out-of-equilibrium forces hindering the motion of the mixture downslope.
In systems controlled by drag resistance, the dissipation of excess  $p^{s}$ is a slow process and the corresponding equilibrium of stresses is reached before any noticeable bed expansion occurs. This regime of deformation is termed undrained response in poromechanics. In such a case, the dense sediment phase deforms at constant
  $\phi$, only as much as it needs to reach the equilibrium of shear stresses via the increase in
  $p^{s}$, then it is arrested. The changes in
  $p^{s}$ come mainly from plastic dilatancy: the difference
  $(\phi -\phi _{pl})$ in (2.18) increases because
  $\phi _{pl}$ decreases irreversibly with accumulated shear.
On a longer time scale, the excess  $p^{s}$ is relaxed by expansion of the granular bed, leading unswervingly towards lower
  $\phi$. When the excess
  $p^{s}$ is small enough, the avalanche starts.
It is worth noting that expansion of the sediment phase in this model is driven not only by plastic dilatancy but also by the rate-dependent viscous term  $p_s^{s}$. Therefore, the negative pore pressure is not a feature bound to the transient, quasistatic, equilibrium. For instance, an accelerating flow rate may cause negative pore pressure even after the triggering of an avalanche, which may delay the truly steady-state regime.
2.3. Numerical implementation
Simulations are conducted with the open-source software SedFoam (Chauchat et al. Reference Chauchat, Cheng, Nagel, Bonamy and Hsu2017), a two-phase flow solver frequently used for sediment transport applications (Mathieu et al. Reference Mathieu, Chauchat, Bonamy and Nagel2019) based on the open-source finite volume library OpenFOAM (Jasak & Uroić Reference Jasak and Uroić2020). The solver is available for download at GitHub (https://github.com/SedFoam/). In the finite volume method, partial differential equations are discretized by integrating them over each control volume. By means of Gauss theorem, convection and diffusion terms in the conservation equations are transformed to face fluxes. Several interpolation/discretization techniques can be used to evaluate the face fluxes. Table 1 shows the temporal and spatial discretization schemes used in the present work. It is worth noting that the Gauss upwind scheme is only adopted for the divergence discretization of  $\phi _{pl}$ and
  $p^{s}_s$ fields. After the spatial and temporal discretization, the system is solved with the PIMPLE algorithm, which combines the pressure-implicit split-operator (PISO) and the semi-implicit method for pressure-linked equations (SIMPLE) algorithms.
Table 1. Numerical schemes for the interpolation of the convective fluxes.

3. Results and discussion
3.1. One-dimensional granular avalanche
In order to evaluate the model, the gravity-driven flow of a granular bed fully immersed in a water–oil mixture is considered. Initially, the sediment phase is deposited by gravity at zero inclination forming a granular layer of height  $h_0$ as displayed in figure 1. Then, the system is rapidly rotated to a specific inclination angle (
 $\theta$) and gravitational forces accelerate the mixture. The physical and geometrical parameters have been taken from the experimental set-up of Pailha et al. (Reference Pailha, Nicolas and Pouliquen2008) except for the elastic modulus (see table 2).

Figure 1. Sketch of the immersed granular avalanche in (a) 1-D and (b) 2-D configurations. Details of the boundary conditions are displayed in each case. (c) Schematic mixture velocity profiles for the 1-D and 2-D numerical simulations. Due to the geometrical constraints of the 2-D configuration, an upstream flow is observed in the upper part of the box. The height of the 1-D domain ( $h_1$) has been adjusted to reproduce a similar velocity profile.
Table 2. Physical and geometrical variables of the problem (Pailha et al. Reference Pailha, Nicolas and Pouliquen2008).

At first, one-dimensional (1-D) numerical simulations are carried out imposing periodic boundary conditions along the streamwise direction (see figure 1a). At the top and bottom boundaries, the velocity of both phases is set according to a homogeneous Dirichlet boundary condition (no-slip velocity) and homogeneous Neumann boundary conditions are prescribed for the volume fraction (zero gradient). A homogeneous Dirichlet boundary condition is prescribed for the pore pressure at the top boundary whereas a fixedFluxPressure (fFP) condition is imposed at the bottom. The fFP condition is a Neumann boundary condition that sets the wall-normal pore pressure gradient at the boundary consistently with the velocity boundary condition. All the details can be found in the sketch presented in figure 1(a). It is worth mentioning that the height of the 1-D domain ( $h_1=0.03\ \textrm {m}$) has been adjusted to reproduce the flow conditions of the experiments. Indeed, experiments were conducted in a closed container (
 $L \times h_2 = 1\ \textrm {m} \times 0.07\ \textrm {m}$) in which an upstream flow was observed in the upper part of the box. Schematic velocity profiles of the mixture (
 $v^{m}=\phi v^{s}+(1-\phi ) v^{f}$) are plotted in figure 1(c) for a 1-D and a 2-D numerical simulation. Due to the opposite flow directions in the container, a zero-velocity line is observed at height
  $h_1$ as shown in figure 1(c). Therefore, the height of the 1-D box has been set to
  $h_1$ with a zero velocity at the top wall. The difference between the actual experimental geometry and the 1-D set-up is discussed in detail in § 3.5.
The  $\mu (I_v)$ rheology has been discussed in many recent publications (Boyer & Pouliquen Reference Boyer, Guazzelli and Pouliquen2011; Trulsson et al. Reference Trulsson, Andreotti and Claudin2012; Amarsid et al. Reference Amarsid, Delenne, Mutabaruka, Monerie, Perales and Radjai2017; Cheal & Ness Reference Cheal and Ness2018; Chèvremont, Chareyre & Bodiguel Reference Chèvremont, Chareyre and Bodiguel2019) and the values of the different rheological coefficients are subject to certain scatter (see table 3 for typical ranges). As mentioned by Pailha & Pouliquen (Reference Pailha and Pouliquen2009), the shallow-water model results are sensitive to the choice of these coefficients. In this section the rheological coefficients have been tuned to reproduce the experimental steady-state velocity of the avalanche (see table 3). Variations of the results due to the choice of the rheological coefficients are further discussed in § 3.2.
Table 3. Rheological coefficients used in § 3.1, coefficients used in § 3.2 obtained by Chèvremont et al. (Reference Chèvremont, Chareyre and Bodiguel2019) using DEM-PVF simulations and typical ranges reported in the literature.

Figure 2 shows the temporal evolution of the surface velocity of the grains and the evolution of the excess pore pressure at the bottom of the granular bed. Velocity is made dimensionless by  $\sqrt {gd}$ and time by
  $\sqrt {d/g}$. In the numerical simulations, the surface velocity is measured at the highest cell having a solid volume fraction above
  $\phi _{top}=0.55$.

Figure 2. (a) Evolution of surface particle velocity and (b) excess pore pressure with time. Experimental curves are extracted from Pailha et al. (Reference Pailha, Nicolas and Pouliquen2008).
At this point it is worth mentioning that Pailha et al. (Reference Pailha, Nicolas and Pouliquen2008) classified the avalanche behaviour in two sets: loose behaviour for  $\phi _0<0.58$ and a dense behaviour for
  $\phi _0>0.58$. In the current work, a shear-rate-dependent critical model is considered. Even though the quasistatic critical volume fraction is chosen to be
  $\phi _c=0.585$, the critical volume fraction decreases gradually as the granular material starts flowing following (2.14). Expectedly, a similar loose/dense classification is found in the numerical simulations. As a matter of fact, after tilting the plane, an initially dense bed is barely moving and a significant negative pore pressure develops under the granular layer. As time increases, the excess pore pressure gradually reduces and the granular layer starts flowing normally. All dense cases (
 $\phi _0=0.583$ and
  $\phi _0=0.592$) displayed in figure 2(a) show a slow increase of velocity towards the stationary velocity with similar acceleration. After reaching the stationary velocity, the excess of fluid pore pressure has fully dissipated as shown in figure 2(b). Note that this is true for the experiments with
  $\phi _0 \leqslant 0.584$ but not for the configuration with
  $\phi _0=0.592$ in which the excess pore pressure remains almost constant in time.
Figure 2 suggests that the proposed model predicts reasonably well the initiation of the avalanche for an initially dense granular bed in terms of both surface velocity and excess pore pressure. The model, however, gives less satisfactory results for the densest granular layer. The results of Pailha et al. (Reference Pailha, Nicolas and Pouliquen2008) indicate that the densest granular layer remains immobilized and dilatancy effects during the creeping phase are the source of negative pore pressure within the mixture. The bed expansion leads to a reduction of the dilatancy angle and, subsequently, to lower frictional resistance. Then, the velocity starts increasing towards the steady state (never reached in the experiments of Pailha et al. (Reference Pailha, Nicolas and Pouliquen2008) due to geometrical constraints) and the excess pore pressure gradually decreases. In this case, the numerical model is unable to capture the constant excess pore pressure manifested during the creeping phase. Moreover, the expansion of the granular bed and its acceleration predicted by the numerical model occur gradually while motion of the layer in the experiments is clearly delayed and triggered when the strain of the granular layer is around  $25\,\%$ (Pailha Reference Pailha2009). It should be noted that the measurements of Pailha et al. (Reference Pailha, Nicolas and Pouliquen2008) did not include the evolution of the volume fraction along the vertical or detailed information on the permeability. The unknown rate of pore dilation, and consequent soil hardening, adds more complexity to the present model. However, adjustments in permeability and dilatancy are further discussed in §§ 3.3.1 and 3.3.3 to better capture the behaviour of the densest case.
Regarding the initially loose granular beds, rapid accelerations of the granular flow are observed (see figure 2a). Meanwhile, positive excess pore pressures are measured at the bottom of the granular layer (see figure 2b). Furthermore, in initially loose cases the surface velocity reaches values higher than the stationary velocity followed by a gradual decrease until the steady-state velocity, in agreement with the experimental results. Indeed, Pailha & Pouliquen (Reference Pailha and Pouliquen2009) showed that dilatancy effects lead to a lower frictional resistance and, therefore, to a higher transient velocity before reaching the steady-state value. Additionally, the expulsion of the fluid during the contraction process is responsible for the positive pore pressure values. Likewise, in the landslide studies carried out by Iverson (Reference Iverson2005), the authors pointed out that the rapid acceleration of loose granular layers is accompanied by a positive pore pressure feedback that reduces the basal effective normal stress and frictional resistance. In some cases, these stresses can vanish when the liquefaction limit is reached. Similar to the densest case, discrepancies with the experiments are found for the loosest granular bed. Even though there is an evident qualitative agreement with the numerical model, peak velocities immediately after the tilting point are significantly higher than the experimental ones. In terms of excess pore pressure, the magnitude of the peak is well captured but the gradual relaxation is smoother than in the experiments. The velocity overshoot predicted by the model is a consequence of a marked reduction of the frictional resistance. Section 3.3.1 analyses the same loosest avalanche when the dilatancy coefficient is deliberately reduced to regulate the onset and the acceleration of the granular layer. The evolution of the excess pore pressure, though, is strongly influenced by the permeability. Therefore, § 3.3.3 studies the role of permeability in the relaxation rate of the excess pore pressure.
Finally, granular beds with initial volume fraction near the critical state do not show a clear loose/dense behaviour. A  $\phi _0=0.578$ granular bed (see figure 2) starts flowing without delay; however, the acceleration is much lower than that of the loose cases. Besides, slightly negative pore pressures are measured under the granular layer. It is, therefore, an intricate task to describe the behaviour of granular beds close to the critical state.
Overall, there is a fairly good description of the initial and steady dynamics of granular avalanches ranging from loose to dense behaviour. However, there is room for improvement in terms of very dense/loose granular layers. Sections 3.3.1, 3.3.2 and 3.3.3 examine some factors that improve the performance of the model in such specific cases.
In order to gain further insight into the complex mechanical behaviour of the avalanche, depth profiles of solid volume fraction, solid phase velocity, excess solid pressure and excess pore pressure are presented in figures 3 and 4 for an initially dense ( $\phi _0=0.592$) and an initially loose (
 $\phi _0=0.562$) granular bed, respectively. The excess of solid pressure is defined as the difference between the actual solid pressure predicted by the model and the hydrostatic solid pressure
  $\widetilde {p^{s}} = \phi (\rho ^{s}-\rho ^{f}) g h_0$ corresponding to the static equilibrium. The temporal evolution from early times to the steady state is represented by the line colours from lighter to darker.

Figure 3. (a) Evolution of volume fraction profile, (b) particle velocity profile, (c) increase of particle pressure and (d) excess pore pressure along the vertical. Dense packing ( $\phi _0=0.592$). Different times
  $(t^{*}={t}/{\sqrt {d/g}} )$ are displayed.

Figure 4. (a) Evolution of volume fraction profile, (b) particle velocity profile, (c) increase of particle pressure and (d) excess pore pressure along the vertical. Loose packing ( $\phi _0=0.562$). Different times
  $( t^{*}={t}/{\sqrt {d/g}} )$ are displayed.
For the initially dense case, figure 3 shows that, after the box is tilted, the shear stress that develops inside the granular bed leads to bed expansion, i.e. the volume fraction decreases (see figure 3a), associated with a slow acceleration of the grains, i.e. the solid-phase velocity increases (see figure 3b). Figure 3(a) evidences a more rapid  $\phi$ reduction near the bottom in agreement with experimental observation (Pailha Reference Pailha2009). More specifically, dilatancy induces a reduction of
  $\phi _{pl}$ following (2.20) and, subsequently, an increase of the contact pressure
  $p^{s}_c$ (see (2.18)) as shown in figure 3(c). The increase of
  $p^{s}_c$ adds frictional resistance hindering the motion of the solid particles. Figure 3(d) also illustrates the pore pressure feedback mechanism and its consequences on the granular medium. At first, the granular bed experiences minor motion (see the low velocities at the early times of figure 3b) due to the increase of
  $p^{s}_c$ and the subsequent frictional resistance derived from the dilatancy process. At the same time, the granular layer expands, mobilizing drag resistance as the fluid is pumped in. This inward flow is associated with the negative pore pressure observed in figure 3(d). The excess pore pressure (
 $p^{f}$) and change of granular pressure (
 $p^{s}-\widetilde {p^{s}} \cos \theta$) increase, then dissipate, rather simultaneously, with equal magnitudes and opposite signs, this feature becoming evident in figures 3(c) and 3(d). This is merely an indication that the pressure in the whole mixture is constant, as expected when there are no strong inertial effects in the normal direction.
For the initially loose granular bed, the granular medium contracts in response to the initial shearing as illustrated in figure 4(a). During the early stage, the contact forces between grains slightly decrease (see negative increases in the solid pressure of figure 4c) and some direct grain contacts are lost. The lower solid pressure values observed after tilting the plane lead to a rapid acceleration of the granular bed (see figure 4b). As shearing goes on, the amount and magnitude of intergrain contacts build up (see the evolution of the solid pressure towards the hydrostatic distribution corresponding to the steady state in figure 4c). This leads to an increase of frictional forces and a reduction of the particle velocity. The reasoning is supported by figures 4(b) and 4(c). Moreover, the volumetric changes in the soil skeleton during the contraction process entail a marked increase of the excess pore pressure as shown in figure 4(d). Close to the steady state, the fluid pressure is almost restored to the hydrostatic distribution, indicating that the fluid phase is no longer constrained to flow out of the sediment layer: compaction has ended.
Hereinafter, a depth-averaged variable over the bed height is denoted as  $\bar {\psi }$ with the following definition:
 \begin{equation} \bar{\psi}=\frac{1}{h_0}\int_{0}^{h_0} \psi(y) \,{\textrm{d} y}, \end{equation}
where  $h_0$ is the lowest wall-normal position above which
  $\phi \leqslant \phi _{top}$. In figure 5(a), the temporal evolution of the depth-averaged particle volume fraction (
 $\bar {\phi }$) is shown for three different initial values corresponding to loose, critical and dense configurations:
  $\phi _0=0.562$,
  $0.583$ and
  $0.592$, respectively. In figure 5(b), the evolution of the depth-averaged
  $\bar {\phi }$ is plotted with the depth-averaged value of the viscous number
  $\overline {I_{v}}$ as well as the empirical law given by (2.14). It is worth noting that
  $I^{\infty }_v$ stands for the viscous number at steady state (
 $t \rightarrow \infty$). This figure reveals that, regardless of the initial state, all curves follow closely the steady-state law,
  $\phi (I_v)$ collapsing, eventually, on the equilibrium volume fraction. Except at the beginning of the process, very little dispersion is displayed. Indeed, the rapid convergence is expected under this particular visco-elastic regime where the inertial contribution plays a minor role.

Figure 5. (a) Depth-averaged volume fraction as a function of time for different initial volume fractions and (b)  $\bar {\phi }$–
 $\overline {I_v}$ relationship.
The major difference between the proposed model and existing models from the literature (Pudasaini, Wang & Hutter Reference Pudasaini, Wang and Hutter2005; Pailha & Pouliquen Reference Pailha and Pouliquen2009; David & Richard Reference David and Richard2011; Bouchut et al. Reference Bouchut, Fernández-Nieto, Mangeney and Narbona-Reina2016) lies in the resolution of the pore pressure. Previous approaches are based upon certain assumptions to determine the excess pore pressure. Herein the excess pore pressure is obtained by full resolution of the mass and momentum conservation equations, while the shear-induced granular pressure acts like a diffusive source term. Additionally, a distinctive feature of the present depth-resolving multiphase flow model compared with a depth-averaged model is to take into account dilatancy as a modification of the solid pressure and not as an effective friction coefficient. The results presented above suggest that the proposed model is able to capture the full range of behaviours of the avalanche, from loose to dense initial conditions, in a physically consistent manner. This is, undoubtedly, the main result of the present contribution.
3.2. Influence of rheological coefficients
The rheological coefficients in § 3.1 have been adjusted to fit the experimental data in terms of steady-state velocity. In this section, the influence of rheological coefficients on the results is discussed.
A wide range of rheological coefficients has been proposed in the literature (Divoux & Géminard Reference Divoux and Géminard2007; Boyer & Pouliquen Reference Boyer, Guazzelli and Pouliquen2011; Gallier et al. Reference Gallier, Lemaire, Peters and Lobry2014; Lecampion & Garagash Reference Lecampion and Garagash2014; Chèvremont et al. Reference Chèvremont, Chareyre and Bodiguel2019) (see table 3). According to Divoux & Géminard (Reference Divoux and Géminard2007), the main source of dispersion for the rheological coefficients is due to the grain surface characteristics. Notwithstanding the difficulties of finding rheological coefficients valid for a wide range of cases, the influence of such coefficients on the transient and steady state is evaluated and discussed in this section. More particularly, a new series of numerical simulations is performed adopting the rheological coefficients proposed by Chèvremont et al. (Reference Chèvremont, Chareyre and Bodiguel2019) (see table 3).
The temporal evolutions of the surface velocity and the excess pore pressure underneath the granular layer are shown in figure 6. Qualitatively, the new simulations using the rheological coefficients from Chèvremont et al. (Reference Chèvremont, Chareyre and Bodiguel2019) reproduce the observed experimental behaviour: the initially dense avalanche is retarded while the initially loose avalanche accelerates instantaneously with a velocity overshoot. However, from a quantitative point of view, the steady-state velocity ( $v^{s,sim}_{\infty }$) is overestimated by a factor of almost 8. In order to characterize the discrepancies more objectively, the root mean square error in time for the surface velocity is computed and shown in table 4. It is worth noting that discrepancies between the two sets of rheological coefficients are essentially observed in the magnitude of particle velocity and excess pore pressure drop. The initiation and transient dynamics of the granular flow are well captured by the Chèvremont et al. (Reference Chèvremont, Chareyre and Bodiguel2019) rheological coefficients and the time scale to reach the steady state is not significantly affected compared with the results presented in § 3.1.

Figure 6. (a) Evolution of surface particle velocity and (b) excess pore pressure with time using the rheological coefficients of Chèvremont et al. (Reference Chèvremont, Chareyre and Bodiguel2019).
Table 4. Root mean square error (RMSE) for different volume fractions. Parameter  $v^{s}_{\infty }$ is the top solid-phase velocity when the steady state is reached.

The results presented in this subsection suggest that rheological coefficients have a strong effect on the evolution of the surface velocity of the granular avalanche. Less influence is observed on the pore pressure; results remain of the same order of magnitude but the pore pressure peaks are roughly two times larger than those measured in § 3.1. The initial dynamics, the time scale to reach the triggering point of dense avalanche and the time scale to reach a fully developed avalanche are essentially unaltered by changing the rheological coefficients.
3.3. Sensitivity analysis
The model has been successfully tested against experimental data for the initiation of immersed granular avalanches. In this section, the sensitivity of the model results to the numerical parameters  $K_1$ and
  $K_2$ is studied, and the influence of the permeability is discussed.
3.3.1. Sensitivity to  $K_1$
$K_1$

Although good agreement with the experimental results is observed, discrepancies are found in the loosest and densest cases (see figure 2). In the loosest scenario, the excess pore pressure is well captured but the velocities immediately after the tilting point are much higher than those in the experiments. On the other hand, the densest case of Pailha et al. (Reference Pailha, Nicolas and Pouliquen2008) showed that the excess pore pressure remained constant during the creeping phase, while in the numerical simulations the granular layer starts flowing slowly almost immediately and a gradual dissipation of the excess pore pressure is observed. Both cases are influenced by the initial dynamics controlled by dilatancy effects. Thus, in this section, the sensitivity to dilatancy factor  $K_1$ is examined in a series of simulations.
Figure 7 shows the results are moderately sensitive to  $K_1$. Low
  $K_1$ values reduce the velocity overshoot of the loose case; however, they also reduce the magnitude of the excess pore pressure. Very low values (see
  $K_1 = 4 \times 10^{-2}$ curve in figure 7) describe the velocity peak remarkably well for the loosest scenario but the low impact of dilatancy underpredicts the rapid and abrupt acceleration observed in the experiments. Concerning the densest scenario, a large
  $K_1$ value leads to a larger negative excess of pore pressure peak. The acceleration of the granular layer matches the experimental curve (see slopes of
  $\phi _0=0.592$ in figure 7 once the avalanche starts flowing normally) but the triggering point occurs earlier than in the experiments. Overall, figure 7 suggests low
  $K_1$ values better predict the loose behaviour and larger
  $K_1$ values provide a reasonable description of dense granular avalanches.

Figure 7. (a) Evolution of surface particle velocity and (b) excess pore pressure with time for different  $K_1$. The loosest cases are plotted with dashed lines while the densest cases are shown with solid lines. Experimental curves extracted from Pailha et al. (Reference Pailha, Nicolas and Pouliquen2008) are shown in black. The increasing
  $K_1$ value of numerical results is displayed with blue curves from lighter to darker.
3.3.2. Sensitivity to $K_2$

In this section the influence of  $K_2$ in (2.23) is analysed. The parameter
  $K_2$ controls the rate at which the shear-induced pressure converges to its equilibrium. Figures 8(a) and 8(b) show there are no strong changes in terms of excess pore pressure and solid-phase velocity. The results in figure 8(d) show that small
  $K_2$ values mean a lower shear-induced pressure which takes longer to develop. Whereas larger
  $K_2$ values correspond to a rapid build-up. Nonetheless, almost no influence is observed in the granular avalanche dynamics. It is worth remembering here that numerical simulations presented in this work take place under a viscous dense regime. Therefore, it is not surprising that the contact pressure is much more dominant than the shear-induced pressure (at least seven times larger according to figure 8c,d).

Figure 8. (a) Evolution of surface particle velocity and (b) excess pore pressure with time for different  $K_2$. The loosest cases are plotted with dashed lines while the densest cases are shown with solid lines. Experimental curves extracted from Pailha et al. (Reference Pailha, Nicolas and Pouliquen2008) are shown in black. (c,d) The increasing
  $K_2$ value of numerical results is displayed with arrows and blue curves from darker to lighter.
3.3.3. Sensitivity to permeability
Changes in permeability not only result in variations of the excess pore pressure, but also in different dynamics worth discussing. When the permeability from (2.6) is multiplied by a certain factor (in figure 9,  $\frac {2}{3}$ and
  $\frac {1}{5}$) the mobility of the layer is significantly reduced for the densest case. The increase of the creeping phase comes with larger peaks in the excess pore pressure. The dilatancy factor
  $K_1$ can be adjusted to better fit the experimental pore pressure; however, under these conditions the evolution of the surface velocity is poorly represented by the numerical model.

Figure 9. (a) Evolution of surface particle velocity and (b) excess pore pressure with time for different permeabilities. The loosest cases are plotted with dashed lines while the densest cases are shown with solid lines. Experimental curves extracted from Pailha et al. (Reference Pailha, Nicolas and Pouliquen2008) are shown in black. The increasing permeability of numerical results is displayed with arrows and blue curves from darker to lighter.
3.4. Slope influence
In this section the evolution of the granular flow for three different initial volume fractions ( $\phi _0 = 0.562, 0.580, 0.590$) and three different inclination angles (
 $\theta = 25^{\circ }, 28^{\circ }, 30^{\circ }$) is examined.
Figure 10 shows the behaviour of the avalanche in terms of surface velocity and excess pore pressure at the bottom for different inclination angles and different initial volume fractions. Obviously, increasing the bed slope leads to a larger stationary solid velocity. Even though greater negative pore pressure values develop under the granular bed (see figure 10), the additional friction due to dilatancy is not enough to delay the motion of the gravity-driven flow. Another interesting feature observed in figure 10 is that the time to reach the steady state does not seem to be much affected by the bed slope.

Figure 10. Evolution of surface particle velocity with time for (a)  $\theta =25^{\circ }$, (b)
  $\theta =28^{\circ }$ and (c)
  $\theta =30^{\circ }$; and excess pore pressure with time for (d)
  $\theta =25^{\circ }$, (e)
  $\theta =28^{\circ }$ and (f)
  $\theta =30^{\circ }$.
In contrast to the previous results, for which all the final volume fractions converge to a single value (see figure 5), different volume fractions are predicted when the steady state is reached for different slopes (see figure 11a). The evolution of the solid volume fraction depends on the shear rate and granular pressure; thus, different inclinations, corresponding to different  $I_v$, influence not only the dynamics but also the fully developed granular flow. Figure 11(b) shows that all the
  $\bar {\phi }$–
 $\overline {I_v}$ relationships collapse on the solid volume fraction law given by (2.14). Even though the three curves share the same starting point (
 $\overline {I_v}=0$), different terminal volume fractions are found depending on the slope of the plane. As expected, larger inclination angles lead to increasing dimensionless shear rate or
  $I_v$ number, and looser steady states. Overall, figure 11 evidences that the solid volume fraction relaxes towards an equilibrium volume fraction that depends only on the viscous number.

Figure 11. (a) Volume fraction as a function of time and (b)  $\bar {\phi }$–
 $\overline {I_v}$ relationship for different inclination angles. Here
  $\phi _0=0.580$.
Results from § 3.1 show an excellent agreement with the experimental data for a wide range of initial volume fractions at  $\theta =25^{\circ }$. In figure 12, the proposed two-fluid model is compared with experimental results reported in Pailha & Pouliquen (Reference Pailha and Pouliquen2009) for different inclination angles. As expected, the pore pressure drop increases in magnitude with increasing inclination angle. Both trends are confirmed in figure 12(a) in which the numerical results are in reasonable agreement with the experimental data (only two points for initially dense granular layers are available in Pailha & Pouliquen (Reference Pailha and Pouliquen2009)). The drop in pore pressure can be derived analytically by postulating a stable state, as suggested by Mutabaruka et al. (Reference Mutabaruka, Delenne, Soga and Radjai2014). Following Pailha & Pouliquen (Reference Pailha and Pouliquen2009), Iverson & George (Reference Iverson and George2014) and Mutabaruka et al. (Reference Mutabaruka, Delenne, Soga and Radjai2014), the effective friction is obtained as the sum of the static friction coefficient
  $\mu _s$ and the dilatancy coefficient
  $\delta$; thus, the Coulomb yield criterion can be written as
 \begin{equation} \tau^{s} \leqslant (\mu_s + \delta ) p^{s}. \end{equation}
Figure 12. (a) Minimum fluid pore pressure measured in dense granular avalanches as a function of the inclination angle. Three initial volume fractions are considered ( $\phi _0=0.555$,
  $\phi _0=0.580$ and
  $\phi _0=0.590$). (b) Dependency of
  $I_b$ on the slope (
 $\theta$) when the granular flow is fully developed. Experimental points taken from Pailha & Pouliquen (Reference Pailha and Pouliquen2009) correspond to dense cases.
Since the changes in  $p^{s}$ and
  $p^{f}$ are of same magnitude but with opposite sign,
  $p^{s} = \widetilde {p^{s}} - p^{f}$, where
  $\widetilde {p^{s}}$ is the static granular pressure (
 $\widetilde {p^{s}} = \cos \theta \phi (\rho ^{s}-\rho ^{f}) g h_0$ at the bottom of the layer), (3.2) can be rewritten as
 \begin{equation} \tau^{s} \leqslant (\mu_s + \delta ) (\widetilde{p^{s}}-p^{f}). \end{equation}
If inertial effects are negligible in the streamwise direction, then the shear stress must balance gravitational forces, i.e.  $\tau ^{s} = \widetilde {p^{s}} \tan \theta$, and (3.3) can be rewritten as
 \begin{equation} \tan \theta \leqslant (\mu_s + \delta ) \left ( 1- \frac{p^{f}}{\widetilde{p^{s}} } \right ). \end{equation}
The last term on the right-hand side of this equation reflects an additional strength associated with negative pore pressure.
Equation (3.4) may be rewritten to express the excess pore pressure as a function of the other parameters:
 \begin{equation} p^{f} \leqslant \widetilde{p^{s}} \cos \theta \left( \dfrac{\tan \theta}{\mu_s + \delta} -1 \right ). \end{equation}
The two black lines and the blue shaded region in figure 12(a) indicate the excess pore pressure drop predicted by (3.5) (values assuming the equality) using  $\phi _0=0.585$ and
  $\phi _0=0.592$ with the corresponding dilatancy coefficient
  $\delta =0$ and
  $\delta =0.028$, respectively. Although (3.4) is based on a simplified force balance where dynamic contributions are neglected, figure 12(a) shows that the analytic approach is in agreement with the experimental and numerical results. It is worth noting that the analytical approach is only valid for an initially dense granular bed. For an initially loose bed, inertial effects arise rapidly and the bed becomes unstable almost instantaneously after tilting the plane.
In figure 12(b) the bulk viscous number at steady state, defined as
 \begin{equation} I_b=\frac{2 \nu^{f} \rho^{f} \left\| \boldsymbol{u}^{\boldsymbol{s}} \right\|}{((\rho^{s}-\rho^{f}) g h_0^{2} \phi_c \cos \theta)}, \end{equation}
is plotted as a function of the inclination angle for experiments and numerical simulations. The linear trend observed in the experiments is well predicted by the two-fluid model.
3.5. Two-dimensional granular avalanche
In this section, a 2-D numerical investigation is carried out by solving the multidimensional two-phase flow equations described in § 2. The numerical domain is shown in figure 1(b). The geometrical parameters and boundary conditions are set to reproduce precisely the experimental set-up of Pailha et al. (Reference Pailha, Nicolas and Pouliquen2008) consisting of a Hele-Shaw cell. The velocities of both phases are set to zero at all boundaries (lateral, top and bottom) while a fFP condition is imposed for the excess pore pressure on all boundaries. A homogeneous Neumann boundary condition (zero gradient) is imposed for all the other quantities.
The series of snapshots shown in figure 13 illustrate how gravitational forces drag the solid phase down the slope while the upper part of the domain occupied by fluid only is forced to flow upslope due to mass conservation. The mixture velocity ( $\boldsymbol {v}^{\boldsymbol {m}}=\phi \boldsymbol {v}^{\boldsymbol {s}}+(1-\phi ) \boldsymbol {v}^{\boldsymbol {f}}$) field displayed in figure 13 evidences the presence of the flux loop in the vicinity of the bottom corner of the Hele-Shaw cell. Unlike the 1-D avalanches, where periodic conditions were imposed on the upstream and downstream faces, in this domain the streamwise extent is finite; therefore, solid particles are continuously transported downslope leading to a progressive reduction of the granular bed height upstream whereas grains accumulate at the bottom corner. The two series of snapshots shown in figure 13 illustrate the dynamics of initially loose and dense granular beds. In the loose case, the solid phase accelerates very quickly, whereas in the dense avalanche, dilatancy effects delay the motion of the granular medium. As shown in figure 14, the excess pore pressure rapidly jumps to positive values in the loose case and negative values in the dense case, in agreement with 1-D numerical simulations and experimental results. Additionally, figure 14 shows increasing pore pressures at the bottom corner of the container. As described earlier, particles are accumulating in this region and the incoming grains along with the downward fluid flow contribute to compact this area; hence, the impact of the avalanche leads to positive excess pore pressure that expels the pore fluid.

Figure 13. Evolution of solid morphology, velocity field and flow streamlines throughout the numerical simulation. Initially (a) loose ( $\phi _0=0.566$) and (b) dense (
 $\phi _0=0.592$) granular beds are compared. For the sake of clarity the arrows of the velocity field are not displayed within the granular bed.

Figure 14. Evolution of excess pore pressure field throughout the numerical simulation. Initially (a) loose ( $\phi _0=0.566$) and (b) dense (
 $\phi _0=0.592$) granular beds are compared.
Finally, figure 15 shows the same quantities as figure 2: the temporal evolution of the surface velocity and the excess pore pressure at the bottom of the granular bed for three initial volume fractions (loose:  $\phi _0=0.566$; critical:
  $\phi _0=0.580$; and dense:
  $\phi _0=0.592$) measured at the same point as in the experiments (see curves with open symbols in figure 15). In this figure, 1-D simulation results are also plotted (filled symbols in figure 15) to illustrate the comparison between the 1-D and 2-D approaches. The agreement with the experimental curves for the 2-D simulations is similar compared with the 1-D approach though the avalanche accelerates slightly faster in the 2-D case. An interesting feature is observed for the initially loose granular bed: the surface velocity does not decelerate down to the steady-state value. This is due to the lack of particle availability at the upstream side of the container resulting in a progressive reduction of the granular bed thickness (see the evolution of the solid phase in figure 17 in the upper part of the domain, significantly different from the dense case displayed in figure 16). This is consistent with the experiments from Pailha et al. (Reference Pailha, Nicolas and Pouliquen2008) for which the measurements stop around
  $t^{*} \approx 35\,000$ because the length of the container is not long enough to reach a steady state for the loose granular beds. The same phenomenon occurs in the 2-D numerical simulations: around
  $t^{*}=50\,000$ the thickness of the granular bed significantly decreases and the numerical estimation of the surface velocity becomes unpractical as observed in figure 15(a).

Figure 15. (a) Evolution of surface particle velocity and (b) excess pore pressure after a 2-D simulation to reproduce the experimental set-up.

Figure 16. Evolution of solid-phase morphology and velocity field for a dense granular avalanche.

Figure 17. Evolution of solid-phase morphology and velocity field for a loose granular avalanche.
4. Conclusions
In the present contribution, multidimensional, depth-resolving two-phase flow equations have been formulated to incorporate dilatancy effects. Following most existing depth-averaged models, our approach relies on the  $\mu (I_v)$ rheology for the granular shear stress and a modified version of the shear-rate-dependent critical state theory for granular materials introduced by Pailha & Pouliquen (Reference Pailha and Pouliquen2009) for the particle pressure. Unlike existing models, the proposed formulation incorporates dilatancy effects due to local rearrangements of the grains as a modification of the contact solid pressure and not as a modification of the apparent friction angle. Consequently, the geometrical microscopic changes arise as increases/reductions of the enduring solid contact pressure, leading to increased/decreased granular shear resistance depending on the initial compaction of the granular medium, dense/loose respectively.
Numerical simulations using this new dilatancy model have been performed to reproduce the immersed granular avalanche experiments from Pailha et al. (Reference Pailha, Nicolas and Pouliquen2008). The qualitative agreement between the numerical simulations and the experimental results demonstrates the consistency of the model in capturing the coupling between the pore pressure feedback mechanism and the avalanche dynamics for both loose and dense initial states. An analysis of the evolution of the solid pressure, the fluid excess pore pressure, the particle velocity and the volume fraction along the wall-normal direction for different initial volume fractions allowed a better understanding of the details of the mechanical behaviour of the avalanche in this complex particulate two-phase flow. In the initially dense case, the initial rearrangement of the grains leads to a decrease of the volume fraction associated with an increase of the solid-phase pressure (enduring contact contribution). Consequently, the granular shear stress increases slowing down the development of the avalanche. The dynamics of the granular rearrangement is controlled by the dissipation of the excess pore pressure which depends on viscosity and permeability of the bed. In the initially loose case, the initial rearrangements of the grains lead to an increase of the volume fraction and a reduction of the solid pressure (enduring contact contribution). Therefore, the granular shear stress decreases and the avalanche accelerates much faster than in the critical state. The time needed by the granular flow to adjust to the applied solicitation is also controlled by the dissipation of the excess pore pressure in the granular bed. This vision is quite different from earlier models and allows one to reproduce, at least qualitatively, the dynamics of the avalanche in both dense and loose initial states.
Variations of rheological coefficients have shown that the steady-state surface velocity of the avalanche is very sensitive but the overall dynamics of the avalanche, triggering time and time to reach the steady state are almost not affected.
The sensitivity analysis conducted in this work provides a more comprehensive picture of which parameters can be adjusted to reproduce the experimental behaviour of granular avalanches at the limits of the wide spectrum given by Pailha et al. (Reference Pailha, Nicolas and Pouliquen2008). Dilatancy prefactor  $K_1$ and permeability strongly affect the initial dynamics of granular avalanches, whereas negligible impact is observed for changes in
  $K_2$, a calibration parameter that controls the relaxation rate of the shear-induced pressure. Low
  $K_1$ values lead to a smooth overshoot for the loosest avalanche (
 $\phi _0 =0.562$) but the excess pore pressure developed at the bottom is much smaller than for the experimental observations. Regarding the densest granular avalanche (
 $\phi _0 =0.592$), variations of
  $K_1$ result in different magnitudes of the pore pressure peak but none of them is able to describe the constant negative excess pore pressure manifested in the experiments. On the contrary, slight variations of the permeability capture the continuous excess pore pressure observed in the densest case to the detriment of the velocity prediction.
The influence of the inclination angle for different initial volume fractions has been investigated and the numerical results are in very good agreement with the experimental data in terms of excess pore pressure drop and steady-state surface velocity. A simple model has been proposed to predict the excess pore pressure drop in the dense case which fits well with the available experimental data and numerical simulation results. Interestingly, the time needed by the avalanche to reach the steady state does not seem to depend much on the inclination angle.
Finally, to illustrate the multidimensional capability of the numerical model, the exact 2-D configuration of the experiments has been reproduced numerically. The differences from the 1-D simulations presented earlier are small and can be explained by the limited availability of particles, especially in the initially loose case. These multidimensional simulations represent a first proof of concept that the proposed model is well suited to perform two- or three-dimensional granular flow problems in which dilatancy effects play a crucial role such as granular collapse or burial of objects.
Funding
This research is supported by the Strategic Environmental Research and Development Program (MR20-1478). Most of the computations presented in this paper were performed using the GENCI infrastructure under Allocations A0060107567 and A0080107567 and the GRICAD infrastructure. We are also grateful to the developers involved in OpenFOAM.
Declaration of interests
The authors report no conflict of interest.
Data availability statement
SedFoam solver, input files and scripts to reproduce 1-D/2-D granular avalanches and the main figures of the article are available on Zenodo at https://zenodo.org/record/5095239#.YO2lPTqxVH4 with the following DOI: https://doi.org/10.5281/zenodo.5095239 (Bonamy et al. Reference Bonamy, Chauchat, Montellà, Chassagne, Mathieu and Higuera2021).


