


1 Introduction
Droplet impact is involved in a large number of industrial applications and natural phenomena from ink-jet printing to fuel atomization, surface treatment or soil erosion (Rein Reference Rein1993; Yarin Reference Yarin2006; Josserand & Thoroddsen Reference Josserand and Thoroddsen2016). Understanding the physics of impacts, as well as predicting and/or controlling their outcome, thus remains a major challenge in fluid mechanics.
Droplets may impact on different substrates, solid surfaces, thin liquid films or deep liquid pools in particular, and very different dynamics can be observed, from smooth deposition to violent splashes (Marengo et al. Reference Marengo, Antonini, Roisman and Tropea2011). Investigation of drop impact started more than a century ago with the experimental studies of Worthington using pioneering photography techniques at the end of the 19th century (Worthington Reference Worthington1876). Since then, drop impact has been an intensive subject of research, particularly in these past twenty years thanks to the parallel improvement of both high speed imagery (Thoroddsen, Etoh & Takehara Reference Thoroddsen, Etoh and Takehara2008) and numerical simulations (Fuster et al. Reference Fuster, Agbaglah, Josserand, Popinet and Zaleski2009; Agbaglah et al. Reference Agbaglah, Delaux, Fuster, Hoepffner, Josserand, Popinet, Ray, Scardovelli and Zaleski2011). However, despite these numerous works, a full understanding of droplet impact dynamics is still lacking. It depends in fact on many physical parameters, the impact velocity, the drop radius, the liquid viscosity and the liquid–gas surface tension in particular, usually characterized by the Reynolds and Weber numbers defined below. On the other hand, although the influence of the gas on droplet impact was noticed approximately thirty years ago (Esmailizadeh & Mesler Reference Esmailizadeh and Mesler1986), the surrounding gas was usually neglected because the density and viscosity ratios between liquid and gas are always large in experiments. However, theoretical, numerical and experimental works have now shown that the surrounding gas clearly influences the dynamics. This influence is manifested at early times by the formation of a dimple beneath the drop at impact that leads to the entrapment of a gas bubble (Mehdi-Nejad, Mostaghimi & Chandra Reference Mehdi-Nejad, Mostaghimi and Chandra2003; Smith, Li & Wu Reference Smith, Li and Wu2003; Purvis & Smith Reference Purvis and Smith2004; Thoroddsen et al. Reference Thoroddsen, Etoh, Takehara, Ootsuka and Hatsuki2005). More importantly, it has been observed experimentally that the surrounding gas pressure can suppress the splash at low pressures (Xu, Zhang & Nagel Reference Xu, Zhang and Nagel2005). Since then, numerous studies have investigated the mechanism by which gas pressure influences the splash dynamics. These studies have involved and combined theoretical, experimental and numerical approaches (Korobkin, Ellis & Smith Reference Korobkin, Ellis and Smith2008; Mandre, Mani & Brenner Reference Mandre, Mani and Brenner2009; Hicks & Purvis Reference Hicks and Purvis2010; Mani, Mandre & Brenner Reference Mani, Mandre and Brenner2010; Driscoll & Nagel Reference Driscoll and Nagel2011; Duchemin & Josserand Reference Duchemin and Josserand2011, Reference Duchemin and Josserand2012; Hicks et al. Reference Hicks, Ermanyuk, Gavrilov and Purvis2012; Kolinski et al. Reference Kolinski, Rubinstein, Mandre, Brenner, Weitz and Mahadevan2012; Mandre & Brenner Reference Mandre and Brenner2012; Kim et al. Reference Kim, Park, Lee, Kim, Kim and Kim2014; Riboux & Gordillo Reference Riboux and Gordillo2014; Liu, Tan & Xu Reference Liu, Tan and Xu2015; Guo, Lian & Sussman Reference Guo, Lian and Sussman2016). It has been demonstrated that splashing is closely linked with the dynamics of the thin film of gas, beneath the drop before impact but also during the fast spreading of the drop after impact.
In particular, it has been explained that dimple formation leading to bubble entrapment is due, as a first approximation, to the viscous cushioning of the gas beneath the drop (Smith et al. Reference Smith, Li and Wu2003; Purvis & Smith Reference Purvis and Smith2004; Korobkin et al. Reference Korobkin, Ellis and Smith2008; Mandre et al. Reference Mandre, Mani and Brenner2009; Mani et al. Reference Mani, Mandre and Brenner2010; Duchemin & Josserand Reference Duchemin and Josserand2011). The lubrication pressure in the gas deforms the drop before contact, forming a dimple, so that contact occurs along a circle entrapping the gas bubble, as observed experimentally (Thoroddsen et al. Reference Thoroddsen, Etoh, Takehara, Ootsuka and Hatsuki2005; Driscoll & Nagel Reference Driscoll and Nagel2011; Bouwhuis et al. Reference Bouwhuis, van der Veen, Tran, Keij, Winkels, Peters, van der Meer, Sun, Snoeijer and Lohse2012; Kolinski et al. Reference Kolinski, Rubinstein, Mandre, Brenner, Weitz and Mahadevan2012; Tran et al. Reference Tran, de Maleprade, Sun and Lohse2013).
However, this dynamics is far more complex than expected: although the cushioning of such gas films is dominated by the lubrication dynamics, the usual incompressible lubrication theory is not able to explain the splashing transition that occurs when the gas pressure varies. Indeed, because of the Maxwell law for gases (Maxwell Reference Maxwell1866), the viscosity, which is the only gas parameter involved in the lubrication equation, remains approximately constant when the gas pressure is varied because it is the (approximately constant) product between the mean-free path and the density that determines the viscosity. Therefore, additional parameters and physical mechanisms have to be considered to explain the influence of the gas pressure on the dynamics. Essentially, three different physical effects have been suggested that depend on the gas pressure: the compressibility of the gas that is subjected to high pressure when the film is thin (Mandre et al. Reference Mandre, Mani and Brenner2009; Mani et al. Reference Mani, Mandre and Brenner2010), the inertial correction to the lubrication regime (Mandre & Brenner Reference Mandre and Brenner2012) with its purely inertial limit in the air cushioning (Moore, Ockendon & Oliver Reference Moore, Ockendon and Oliver2013; Moore & Oliver Reference Moore and Oliver2014) and the non-continuum dynamics in the thin gas layer when its thickness becomes of the order of the mean-free path (quantified by the Knudsen number) (Duchemin & Josserand Reference Duchemin and Josserand2011, Reference Duchemin and Josserand2012; Mandre & Brenner Reference Mandre and Brenner2012). These effects may also have to be considered in the situation where the expanding liquid layer wets the substrate, thus involving a moving contact line (Yokoi et al. Reference Yokoi, Vadillo, Hinch and Hutchings2009; Riboux & Gordillo Reference Riboux and Gordillo2014). For instance, the compressibility of the gas beneath the drop clearly affects the dimple formation and the bubble entrapment (Mandre et al. Reference Mandre, Mani and Brenner2009; Mani et al. Reference Mani, Mandre and Brenner2010; Mandre & Brenner Reference Mandre and Brenner2012). Similarly, the non-continuum dynamics affects the bubble entrapment dynamics and the expansion of the liquid lamella on the substrate (Duchemin & Josserand Reference Duchemin and Josserand2012; Mandre & Brenner Reference Mandre and Brenner2012; Riboux & Gordillo Reference Riboux and Gordillo2014). However, a direct link between the bubble entrapment and the splashing is still lacking, so that it is not clear how this dynamics could explain the pressure dependence on the splashing. Inertial effects have been invoked through the Bernoulli pressure jump (Riboux & Gordillo Reference Riboux and Gordillo2014, Reference Riboux and Gordillo2015) and/or a Kelvin–Helmholtz-like instability of the expanding liquid sheet that could even be enhanced by the non-continuum correction (Kim et al. Reference Kim, Park, Lee, Kim, Kim and Kim2014; Liu et al. Reference Liu, Tan and Xu2015). In a recent paper, Riboux & Gordillo (Reference Riboux and Gordillo2014) have gathered the contributions to the wetting expanding liquid lamella of the lubrication pressure, taking into account the non-continuum correction to the contact angle dynamics, with the suction pressure due to the Bernoulli pressure on top of the lamella. Quantitative estimates based on reasonable assumptions on the dynamics gave good agreement with experiments, suggesting that the influence of the gas pressure is due to the sum of these different contributions, although a direct measure of these different contributions would be interesting to perform (Riboux & Gordillo Reference Riboux and Gordillo2014, Reference Riboux and Gordillo2015). Finally, these different mechanisms have raised the question of whether the expanding lamella is formed before or after the droplet wets the substrate, leading to qualitatively different splashing scenarios, as suggested by Mandre & Brenner (Reference Mandre and Brenner2012). In fact, Riboux & Gordillo (Reference Riboux and Gordillo2014) argue and develop their model assuming that the bubble entrapment is independent from the splashing that is then clearly a consequence of the rapidly expanding liquid rim that is wetting the substrate. In contrast, it has been argued that the liquid lamella could skate on a thin gas layer while splashing (Driscoll & Nagel Reference Driscoll and Nagel2011; Duchemin & Josserand Reference Duchemin and Josserand2011; Kolinski et al. Reference Kolinski, Rubinstein, Mandre, Brenner, Weitz and Mahadevan2012).
Therefore, despite intense research, the final word on the influence of the surrounding gas on the detailed mechanisms of splash formation has not been written. In particular, if the various relevant effects involving the gas have been identified, namely compressibility, inertia, contact-line dynamics and non-continuum effects, their quantitative contributions still remain to be investigated and the interplay between the lamella formation and the wetting of the substrate needs also to be clarified (Riboux & Gordillo Reference Riboux and Gordillo2014; Josserand & Thoroddsen Reference Josserand and Thoroddsen2016).
In this paper, we investigate the influence of the gas inertia on the splashing dynamics by performing numerical simulations of drop impact on a solid surface, solving the incompressible Navier–Stokes equations for each fluid, using the Gerris flow solver (Popinet Reference Popinet2006), as shown in figure 1. The goal here is to clearly identify and thus discriminate a purely incompressible effect in the gas dynamics. Indeed, by varying only the gas density and viscosity, we seek to isolate the gas inertia correction to the cushioning since neither compressibility nor non-continuum effects are taken into account by our numerics. The key point of our approach lies in solving the full Navier–Stokes equations and not a reduced model involving the lubrication approximation for the gas cushioning and the inviscid dynamics for the liquid, as done by most of the numerical and analytical studies of this problem until now (Smith et al. Reference Smith, Li and Wu2003; Purvis & Smith Reference Purvis and Smith2004; Korobkin et al. Reference Korobkin, Ellis and Smith2008; Mandre et al. Reference Mandre, Mani and Brenner2009; Duchemin & Josserand Reference Duchemin and Josserand2011; Hicks et al. Reference Hicks, Ermanyuk, Gavrilov and Purvis2012), which consist of completely neglecting the gas inertia. Solving the full incompressible Navier–Stokes equations for both the gas and the liquid phase remains nowadays a real challenge in the context of drop impact in order to capture the dimple and the bubble entrapment correctly (Guo et al. Reference Guo, Lian and Sussman2016; Josserand, Ray & Zaleski Reference Josserand, Ray and Zaleski2016) which explains why reduced models have been mostly used until now. Therefore our work will help to disentangle the influence of the different contributions in the splashing dynamics by focusing on purely incompressible mechanisms.

Figure 1. Snapshots of droplet impact on a solid substrate obtained by solving the axisymmetric two-phase Navier–Stokes equations using the Gerris solver, for
 $Re=1000$
,
$Re=1000$
,
 $We=370$
,
$We=370$
,
 $\unicode[STIX]{x1D6FC}=0.003$
and
$\unicode[STIX]{x1D6FC}=0.003$
and
 $m=0.15$
. The images correspond to the dimensionless times (a)
$m=0.15$
. The images correspond to the dimensionless times (a)
 $t=-0.1$
, (b)
$t=-0.1$
, (b)
 $t=0$
, (c)
$t=0$
, (c)
 $t=0.048$
, (d)
$t=0.048$
, (d)
 $t=0.087$
, (e)
$t=0.087$
, (e)
 $t=0.2$
and (f)
$t=0.2$
and (f)
 $t=0.6$
.
$t=0.6$
.
2 Problem and method
2.1 General description
We consider a spherical droplet of diameter
 $D=2R$
, of a liquid of density
$D=2R$
, of a liquid of density
 $\unicode[STIX]{x1D70C}_{l}$
and viscosity
$\unicode[STIX]{x1D70C}_{l}$
and viscosity
 $\unicode[STIX]{x1D707}_{l}$
falling from a small height
$\unicode[STIX]{x1D707}_{l}$
falling from a small height
 $h$
between the droplet and the substrate, with an initial velocity
$h$
between the droplet and the substrate, with an initial velocity
 $U_{0}$
normal to the substrate, surrounded by a gas of density
$U_{0}$
normal to the substrate, surrounded by a gas of density
 $\unicode[STIX]{x1D70C}_{g}$
, viscosity
$\unicode[STIX]{x1D70C}_{g}$
, viscosity
 $\unicode[STIX]{x1D707}_{g}$
, the liquid–gas surface tension being
$\unicode[STIX]{x1D707}_{g}$
, the liquid–gas surface tension being
 $\unicode[STIX]{x1D6FE}$
(see figure 2). The substrate is dry and flat and a typical partially wettable surface is considered with a contact angle
$\unicode[STIX]{x1D6FE}$
(see figure 2). The substrate is dry and flat and a typical partially wettable surface is considered with a contact angle
 $\unicode[STIX]{x1D703}=90^{\circ }$
for the sake of simplicity. We have also tested other contact angles (from
$\unicode[STIX]{x1D703}=90^{\circ }$
for the sake of simplicity. We have also tested other contact angles (from
 $\unicode[STIX]{x1D703}=0$
to
$\unicode[STIX]{x1D703}=0$
to
 $\unicode[STIX]{x1D703}=180^{\circ }$
) finding no qualitative changes in the mechanisms described below, so that we only show here the results for
$\unicode[STIX]{x1D703}=180^{\circ }$
) finding no qualitative changes in the mechanisms described below, so that we only show here the results for
 $\unicode[STIX]{x1D703}=90^{\circ }$
. It also indicates that the details of the moving contact line does not play a significant role in the impact dynamics, because of the rapid spreading, although it could be crucial in the receding dynamics of the drop as observed experimentally (Bartolo, Josserand & Bonn Reference Bartolo, Josserand and Bonn2005). Notice however, that the full account of the moving contact-line dynamics can be implemented in numerical simulations using specific boundary conditions (Afkhami, Zaleski & Bussmann Reference Afkhami, Zaleski and Bussmann2009; Legendre & Maglio Reference Legendre and Maglio2015; Mahadi, Afkhami & Kondic Reference Mahadi, Afkhami and Kondic2015; Mahady, Afkhami & Kondic Reference Mahady, Afkhami and Kondic2016; Afkhami et al.
Reference Afkhami, Buongiorno, Guion, Popinet, Scardovelli and Zaleski2017). Experiments are typically achieved by releasing a pendant liquid droplet from a height
$\unicode[STIX]{x1D703}=90^{\circ }$
. It also indicates that the details of the moving contact line does not play a significant role in the impact dynamics, because of the rapid spreading, although it could be crucial in the receding dynamics of the drop as observed experimentally (Bartolo, Josserand & Bonn Reference Bartolo, Josserand and Bonn2005). Notice however, that the full account of the moving contact-line dynamics can be implemented in numerical simulations using specific boundary conditions (Afkhami, Zaleski & Bussmann Reference Afkhami, Zaleski and Bussmann2009; Legendre & Maglio Reference Legendre and Maglio2015; Mahadi, Afkhami & Kondic Reference Mahadi, Afkhami and Kondic2015; Mahady, Afkhami & Kondic Reference Mahady, Afkhami and Kondic2016; Afkhami et al.
Reference Afkhami, Buongiorno, Guion, Popinet, Scardovelli and Zaleski2017). Experiments are typically achieved by releasing a pendant liquid droplet from a height
 $H\gg D$
, that then falls under gravity, so that
$H\gg D$
, that then falls under gravity, so that
 $U_{0}\sim \sqrt{gH}$
. If the Froude number (
$U_{0}\sim \sqrt{gH}$
. If the Froude number (
 $Fr=U_{0}^{2}/(gD)\sim H/D$
) is large, the liquid inertia dominates the gravitational force so that gravity can be neglected during impact itself. We assume a spherical droplet although its shape can sometimes be affected both by the initial oscillations triggered by the dynamics of detachment (Wang, Kuan & Tsai Reference Wang, Kuan and Tsai2013; Thoraval, Li & Thoroddsen Reference Thoraval, Li and Thoroddsen2016) and the gas drag (Thoroddsen et al.
Reference Thoroddsen, Etoh, Takehara, Ootsuka and Hatsuki2005). Indeed, we will focus here on the short time dynamics that will be mostly determined by the radius of curvature of the bottom of the drop that we suppose to be close to
$Fr=U_{0}^{2}/(gD)\sim H/D$
) is large, the liquid inertia dominates the gravitational force so that gravity can be neglected during impact itself. We assume a spherical droplet although its shape can sometimes be affected both by the initial oscillations triggered by the dynamics of detachment (Wang, Kuan & Tsai Reference Wang, Kuan and Tsai2013; Thoraval, Li & Thoroddsen Reference Thoraval, Li and Thoroddsen2016) and the gas drag (Thoroddsen et al.
Reference Thoroddsen, Etoh, Takehara, Ootsuka and Hatsuki2005). Indeed, we will focus here on the short time dynamics that will be mostly determined by the radius of curvature of the bottom of the drop that we suppose to be close to
 $R$
. In general, drop impact is characterized by two dimensionless numbers based on the liquid drop parameters: the Reynolds number that compares inertial effects with viscous effects
$R$
. In general, drop impact is characterized by two dimensionless numbers based on the liquid drop parameters: the Reynolds number that compares inertial effects with viscous effects
 $$\begin{eqnarray}\displaystyle Re=\frac{\unicode[STIX]{x1D70C}_{l}U_{0}D}{\unicode[STIX]{x1D707}_{l}} & & \displaystyle\end{eqnarray}$$
and the Weber number which compares inertial effects with capillary effects
 $$\begin{eqnarray}\displaystyle We=\frac{\unicode[STIX]{x1D70C}_{l}U_{0}^{2}D}{\unicode[STIX]{x1D6FE}}. & & \displaystyle\end{eqnarray}$$
Here, since we neglect gravity, compressibility and non-continuum effects, only two additional dimensionless numbers are present in the problem: the density and viscosity ratio
 $\unicode[STIX]{x1D6FC}=\unicode[STIX]{x1D70C}_{g}/\unicode[STIX]{x1D70C}_{l}$
and
$\unicode[STIX]{x1D6FC}=\unicode[STIX]{x1D70C}_{g}/\unicode[STIX]{x1D70C}_{l}$
and
 $m=\unicode[STIX]{x1D707}_{g}/\unicode[STIX]{x1D707}_{l}$
respectively. Note that the incompressible lubrication of the gas layer is controlled by the Stokes number alone:
$m=\unicode[STIX]{x1D707}_{g}/\unicode[STIX]{x1D707}_{l}$
respectively. Note that the incompressible lubrication of the gas layer is controlled by the Stokes number alone:
 $$\begin{eqnarray}\displaystyle St=\frac{\unicode[STIX]{x1D707}_{g}}{\unicode[STIX]{x1D70C}_{l}U_{0}D}=\frac{m}{Re}, & & \displaystyle\end{eqnarray}$$
which is nothing more than the ratio between the viscosity ratio and the Reynolds number. Compressibility is often neglected for droplet impact problems as long as the impact velocity is much below the speed of sound in both fluids (Lesser & Field Reference Lesser and Field1983). In fact, if this assumption is usually correct for most of the flow and in the liquid domain, it has been shown that it is not the case in the small region beneath the drop just before the impact if the gas pressure is small enough (Mandre et al. Reference Mandre, Mani and Brenner2009). There, because of the high pressure coming from the inertia of the drop cushioning the thin gas film, the lubrication gas pressure can overcome the ambient pressure so that compressible effects have to be taken into account. The potential influence of compressibility on the splashing dynamics has been studied in great detail in the framework of the simplified model solving the lubrication equation for the gas and an inviscid dynamics for the liquid drop approximated by a parabolic shape (Mandre et al. Reference Mandre, Mani and Brenner2009; Mani et al. Reference Mani, Mandre and Brenner2010; Mandre & Brenner Reference Mandre and Brenner2012). Although it shows that changing the surrounding gas pressure, as done in the pioneering experiments of Xu et al. (Reference Xu, Zhang and Nagel2005), can lead to different compressible regimes, no clear relation between this dynamics and the suppression of the splash was deduced beside qualitative arguments (Mandre & Brenner Reference Mandre and Brenner2012). This is why in the present paper we propose to investigate the dynamics omitting the compressibility of the gas in order to isolate the different effects leading to the splash in the dynamics. In particular, our approach will help to identify a purely incompressible inertial contribution favouring the splashing at high gas pressure (in our case it corresponds then to high gas density), explaining thus how a lower gas density could eventually suppress the splash.

Figure 2. Calculation domain. The domain is constituted of a square. A semi-circular droplet of diameter
 $D$
, density
$D$
, density
 $\unicode[STIX]{x1D70C}_{l}$
and viscosity
$\unicode[STIX]{x1D70C}_{l}$
and viscosity
 $\unicode[STIX]{x1D707}_{l}$
falls from a height
$\unicode[STIX]{x1D707}_{l}$
falls from a height
 $h$
with an initial velocity
$h$
with an initial velocity
 $U_{0}$
. The surrounding gas has a density
$U_{0}$
. The surrounding gas has a density
 $\unicode[STIX]{x1D70C}_{g}$
, a viscosity
$\unicode[STIX]{x1D70C}_{g}$
, a viscosity
 $\unicode[STIX]{x1D707}_{g}$
and a surface tension
$\unicode[STIX]{x1D707}_{g}$
and a surface tension
 $\unicode[STIX]{x1D6FE}$
. The bottom boundary (
$\unicode[STIX]{x1D6FE}$
. The bottom boundary (
 $z=0$
) is considered as a solid substrate with no-slip condition and a contact angle
$z=0$
) is considered as a solid substrate with no-slip condition and a contact angle
 $\unicode[STIX]{x1D703}=90^{\circ }$
is defined.
$\unicode[STIX]{x1D703}=90^{\circ }$
is defined.
Within this framework, the system obeys the Navier–Stokes equations for incompressible flow with surface tension and sharp interfaces that read:
 $$\begin{eqnarray}\displaystyle & \displaystyle \unicode[STIX]{x1D70C}(\unicode[STIX]{x2202}_{t}\boldsymbol{u}+\boldsymbol{u}\boldsymbol{\cdot }\unicode[STIX]{x1D735}\boldsymbol{u})=-\unicode[STIX]{x1D735}p+\unicode[STIX]{x1D735}\boldsymbol{\cdot }(2\unicode[STIX]{x1D707}\mathbb{D})+\unicode[STIX]{x1D6FE}\unicode[STIX]{x1D705}\unicode[STIX]{x1D6FF}_{s}\boldsymbol{n} & \displaystyle\end{eqnarray}$$
 $$\begin{eqnarray}\displaystyle & \displaystyle \unicode[STIX]{x1D735}\boldsymbol{\cdot }\boldsymbol{u}=0, & \displaystyle\end{eqnarray}$$
where
 $p$
and
$p$
and
 $\boldsymbol{u}$
are the pressure and velocity fields respectively.
$\boldsymbol{u}$
are the pressure and velocity fields respectively.
 $\mathbb{D}=1/2(\text{}^{t}\unicode[STIX]{x1D735}\boldsymbol{u}+\unicode[STIX]{x1D735}\boldsymbol{u})$
is the rate-of-strain tensor (
$\mathbb{D}=1/2(\text{}^{t}\unicode[STIX]{x1D735}\boldsymbol{u}+\unicode[STIX]{x1D735}\boldsymbol{u})$
is the rate-of-strain tensor (
 $\mathbb{D}_{ij}\equiv (\unicode[STIX]{x2202}_{i}u_{j}+\unicode[STIX]{x2202}_{j}u_{i})/2$
). The distribution function
$\mathbb{D}_{ij}\equiv (\unicode[STIX]{x2202}_{i}u_{j}+\unicode[STIX]{x2202}_{j}u_{i})/2$
). The distribution function
 $\unicode[STIX]{x1D6FF}_{s}$
is a delta function which insures the jump conditions at the interface,
$\unicode[STIX]{x1D6FF}_{s}$
is a delta function which insures the jump conditions at the interface,
 $\unicode[STIX]{x1D705}$
the curvature and
$\unicode[STIX]{x1D705}$
the curvature and
 $\boldsymbol{n}$
the normal vector to the interface. In this formulation the density
$\boldsymbol{n}$
the normal vector to the interface. In this formulation the density
 $\unicode[STIX]{x1D70C}(\boldsymbol{x},t)$
and viscosity
$\unicode[STIX]{x1D70C}(\boldsymbol{x},t)$
and viscosity
 $\unicode[STIX]{x1D707}(\boldsymbol{x},t)$
are fields that take constant values (
$\unicode[STIX]{x1D707}(\boldsymbol{x},t)$
are fields that take constant values (
 $\unicode[STIX]{x1D70C}_{l}$
and
$\unicode[STIX]{x1D70C}_{l}$
and
 $\unicode[STIX]{x1D70C}_{g}$
for the density,
$\unicode[STIX]{x1D70C}_{g}$
for the density,
 $\unicode[STIX]{x1D707}_{l}$
and
$\unicode[STIX]{x1D707}_{l}$
and
 $\unicode[STIX]{x1D707}_{g}$
for the viscosity). Finally, since we are interested in the short-time dynamics after impact, we can make the assumption that the dynamics is axisymmetric, although the influence of three-dimensional effects would need to be investigated in the future.
$\unicode[STIX]{x1D707}_{g}$
for the viscosity). Finally, since we are interested in the short-time dynamics after impact, we can make the assumption that the dynamics is axisymmetric, although the influence of three-dimensional effects would need to be investigated in the future.
2.2 Numerical method
The set of incompressible two-fluid Navier–Stokes equations (2.4) and (2.5) is solved in dimensionless form using the free code Gerris (Popinet Reference Popinet2003, Reference Popinet2006, Reference Popinet2009) in a two-dimensional axisymmetric geometry (using cylindrical space variable
 $r$
and
$r$
and
 $z$
). Rescaling the density, space, time, velocity and pressure by
$z$
). Rescaling the density, space, time, velocity and pressure by
 $\unicode[STIX]{x1D70C}_{l}$
,
$\unicode[STIX]{x1D70C}_{l}$
,
 $D$
,
$D$
,
 $D/U_{0}$
,
$D/U_{0}$
,
 $U_{0}$
and
$U_{0}$
and
 $\unicode[STIX]{x1D70C}_{l}U_{0}^{2}$
respectively, the Navier–Stokes equations become (using the
$\unicode[STIX]{x1D70C}_{l}U_{0}^{2}$
respectively, the Navier–Stokes equations become (using the
 $^{\ast }$
for dimensionless variables):
$^{\ast }$
for dimensionless variables):
 $$\begin{eqnarray}\displaystyle \unicode[STIX]{x1D70C}^{\ast }\frac{\text{d}\boldsymbol{u}^{\ast }}{\text{d}t^{\ast }}=-\unicode[STIX]{x1D735}^{\ast }p^{\ast }+\frac{1}{Re}\unicode[STIX]{x1D735}^{\ast }\boldsymbol{\cdot }(2\unicode[STIX]{x1D707}^{\ast }\mathbb{D}^{\ast })+\frac{1}{We}\unicode[STIX]{x1D705}^{\ast }\unicode[STIX]{x1D6FF}_{s}^{\ast }\boldsymbol{n}, & & \displaystyle\end{eqnarray}$$
involving the Reynolds and Weber numbers defined above. The density
 $\unicode[STIX]{x1D70C}^{\ast }$
and viscosity
$\unicode[STIX]{x1D70C}^{\ast }$
and viscosity
 $\unicode[STIX]{x1D707}^{\ast }$
fields now take values
$\unicode[STIX]{x1D707}^{\ast }$
fields now take values
 $1$
in the liquid phase and
$1$
in the liquid phase and
 $\unicode[STIX]{x1D6FC}$
and
$\unicode[STIX]{x1D6FC}$
and
 $m$
in the gas phase. The dimensionless strain tensor now reads
$m$
in the gas phase. The dimensionless strain tensor now reads
 $\mathbb{D}_{ij}^{\ast }\equiv (\unicode[STIX]{x2202}_{i}^{\ast }u_{j}^{\ast }+\unicode[STIX]{x2202}_{j}^{\ast }u_{i}^{\ast })/2$
. For the sake of simplicity, we will drop the
$\mathbb{D}_{ij}^{\ast }\equiv (\unicode[STIX]{x2202}_{i}^{\ast }u_{j}^{\ast }+\unicode[STIX]{x2202}_{j}^{\ast }u_{i}^{\ast })/2$
. For the sake of simplicity, we will drop the
 $^{\ast }$
in what follows. Gerris solves this set of equations using a finite-volume method on an adaptive tree-structured (quadtree/octree) mesh. Momentum and pressure are computed by a projection method and the velocity advection is calculated by a second-order Bell–Collela–Glaz scheme. The interface is tracked by a volume-of-fluid/piecewise linear interface calculation (VOF/PLIC) method (Li Reference Li1995) with a mixed Young’s centred scheme (Tryggvason, Scardovelli & Zaleski Reference Tryggvason, Scardovelli and Zaleski2011) to determine the normal vector and a Lagrangian-explicit scheme for VOF advection. Curvature is computed by the height-function method and surface tension is estimated from curvature by a balanced continuous-surface-force method (Popinet Reference Popinet2009). The density and viscosity fields are computed based on the VOF fraction
$^{\ast }$
in what follows. Gerris solves this set of equations using a finite-volume method on an adaptive tree-structured (quadtree/octree) mesh. Momentum and pressure are computed by a projection method and the velocity advection is calculated by a second-order Bell–Collela–Glaz scheme. The interface is tracked by a volume-of-fluid/piecewise linear interface calculation (VOF/PLIC) method (Li Reference Li1995) with a mixed Young’s centred scheme (Tryggvason, Scardovelli & Zaleski Reference Tryggvason, Scardovelli and Zaleski2011) to determine the normal vector and a Lagrangian-explicit scheme for VOF advection. Curvature is computed by the height-function method and surface tension is estimated from curvature by a balanced continuous-surface-force method (Popinet Reference Popinet2009). The density and viscosity fields are computed based on the VOF fraction
 $C$
using an arithmetic mean. The adaptive mesh refinement is controlled using the following criteria, as illustrated in figure 3:
$C$
using an arithmetic mean. The adaptive mesh refinement is controlled using the following criteria, as illustrated in figure 3:
-
(i) the gradient of the VOF function
 $C$
tracking the interface,
$C$
tracking the interface, -
(ii) the variation of the vorticity,
-
(iii) the curvature in the meshes near the interface,
-
(iv) the solid surface.

The refinement consists in dividing a square parent cell into four (eight in three dimensions) square children cells of size half that of the parent one. Therefore, the level of refinement
 $n$
corresponds to a cell size
$n$
corresponds to a cell size
 $2^{-n}$
smaller than the computational unit size. Finally, a no-slip boundary condition is imposed on the solid substrate boundary (
$2^{-n}$
smaller than the computational unit size. Finally, a no-slip boundary condition is imposed on the solid substrate boundary (
 $z=0$
), while free slip is imposed on the other two boundaries (the last one, corresponding to
$z=0$
), while free slip is imposed on the other two boundaries (the last one, corresponding to
 $r=0$
comes from the axial symmetry). Because of the Navier–Stokes solver, this no-slip boundary condition imposes in fact an effective slip length of the order of half of the grid size at the substrate and a convergence study needs to be performed to investigate the influence of such a condition on the results.
$r=0$
comes from the axial symmetry). Because of the Navier–Stokes solver, this no-slip boundary condition imposes in fact an effective slip length of the order of half of the grid size at the substrate and a convergence study needs to be performed to investigate the influence of such a condition on the results.

Figure 3. Snapshots of the adaptive mesh refinement at two different instants of the impact: (a) just before impact where most of the refinement is concentrated on the interface and solid surface, and (b) a zoom after the impact when a layer of liquid is skating above the solid surface, the red curve representing the interface.
In this paper, since we want to characterize the influence of the gas properties (density and viscosity) on the dynamics, we have kept all the other quantities constant, specifically
 $Re=1000$
and
$Re=1000$
and
 $We=370$
. In other words we are performing a parametric study by varying only the ratios
$We=370$
. In other words we are performing a parametric study by varying only the ratios
 $\unicode[STIX]{x1D6FC}$
and
$\unicode[STIX]{x1D6FC}$
and
 $m$
(notice that the Stokes number also varies since the gas viscosity does). These values of the Reynolds and Weber numbers have to be compared with those of the original experiment of Xu et al. (Reference Xu, Zhang and Nagel2005),
$m$
(notice that the Stokes number also varies since the gas viscosity does). These values of the Reynolds and Weber numbers have to be compared with those of the original experiment of Xu et al. (Reference Xu, Zhang and Nagel2005),
 $Re\sim 10\,000$
and
$Re\sim 10\,000$
and
 $We\sim 1500$
that are significantly higher. In fact, numerical simulations at such high Reynolds and Weber numbers are possible but may rapidly suffer from a lack of spatial resolution because of the thin liquid layer formed at impact. The influence of the gas density is however present for the values of the parameters chosen here so that a qualitative parametric study of the mechanisms involved is possible. Furthermore, in the actual configuration, a typical simulation run takes about 12 hours on one core of a powerful machine with a refinement level
$We\sim 1500$
that are significantly higher. In fact, numerical simulations at such high Reynolds and Weber numbers are possible but may rapidly suffer from a lack of spatial resolution because of the thin liquid layer formed at impact. The influence of the gas density is however present for the values of the parameters chosen here so that a qualitative parametric study of the mechanisms involved is possible. Furthermore, in the actual configuration, a typical simulation run takes about 12 hours on one core of a powerful machine with a refinement level
 $n=11$
while it would take almost
$n=11$
while it would take almost
 $5$
days for
$5$
days for
 $n=12$
, making the parametric study done here difficult. Finally, our numerics can be understood as the impact of a drop of smaller diameter than the original experiment, with a higher liquid viscosity, smaller velocity and smaller surface tension. For instance, considering the velocity and the drop diameter both divided by two compared to the experiment, one would obtain our numerical value by multiplying the liquid viscosity by 2.5 and dividing the surface tension by 2, something that can easily be obtained experimentally. The initial distance
$n=12$
, making the parametric study done here difficult. Finally, our numerics can be understood as the impact of a drop of smaller diameter than the original experiment, with a higher liquid viscosity, smaller velocity and smaller surface tension. For instance, considering the velocity and the drop diameter both divided by two compared to the experiment, one would obtain our numerical value by multiplying the liquid viscosity by 2.5 and dividing the surface tension by 2, something that can easily be obtained experimentally. The initial distance
 $h$
between the droplet and the substrate has been set such that it has no influence on the impact dynamics, leading to
$h$
between the droplet and the substrate has been set such that it has no influence on the impact dynamics, leading to
 $h=0.1$
in dimensionless unit. A typical impact obtained by numerical simulations is shown in figure 1 for
$h=0.1$
in dimensionless unit. A typical impact obtained by numerical simulations is shown in figure 1 for
 $\unicode[STIX]{x1D6FC}=0.003$
and
$\unicode[STIX]{x1D6FC}=0.003$
and
 $m=0.15$
. The origin of time is taken as the virtual time at which a perfectly spherical droplet falling at constant speed would contact the solid providing the droplet does not deform. In other words, the numerical simulation starts at dimensionless time
$m=0.15$
. The origin of time is taken as the virtual time at which a perfectly spherical droplet falling at constant speed would contact the solid providing the droplet does not deform. In other words, the numerical simulation starts at dimensionless time
 $t=-h$
. As the droplet approaches the solid substrate, the gas cushioning delays the contact between the droplet and the substrate that happens slightly later than for
$t=-h$
. As the droplet approaches the solid substrate, the gas cushioning delays the contact between the droplet and the substrate that happens slightly later than for
 $t=0$
and not at the droplet bottom (
$t=0$
and not at the droplet bottom (
 $r=0$
) but rather at a positive radius: a small bubble of gas is subsequently entrapped by the dynamics between the expanding liquid drop and the solid substrate. This bubble cannot really be distinguished in figure 1 but its formation can be observed on the refined mesh of figure 3(b) which is taken before the bubble entrapment, and will be characterized below. The drop then spreads on the substrate and a thin jet emerges at some angle, forming the splash. The splash deforms with time and a characteristic S-shape is created (Josserand et al.
Reference Josserand, Ray and Zaleski2016).
$r=0$
) but rather at a positive radius: a small bubble of gas is subsequently entrapped by the dynamics between the expanding liquid drop and the solid substrate. This bubble cannot really be distinguished in figure 1 but its formation can be observed on the refined mesh of figure 3(b) which is taken before the bubble entrapment, and will be characterized below. The drop then spreads on the substrate and a thin jet emerges at some angle, forming the splash. The splash deforms with time and a characteristic S-shape is created (Josserand et al.
Reference Josserand, Ray and Zaleski2016).
Numerical convergence for drop impact simulation is a hard challenge because of the small structures created by the impact (Josserand et al.
Reference Josserand, Ray and Zaleski2016) but also due to the moving contact-line dynamics that has to be accounted for in the present configuration. The numerical convergence of our results has been tested by measuring the minimal film thickness, which is one of the most sensitive quantities among those that depend on the mesh size and on the boundary condition on the substrate. Figure 4 shows this quantity as a function of time for increasing mesh refinement demonstrating a good convergence for refinement levels above
 $n=10$
. For the rest of this paper, all the results will be computed using the same maximum refinement level
$n=10$
. For the rest of this paper, all the results will be computed using the same maximum refinement level
 $n=11$
. However, the convergence for the dynamics of the moving contact line cannot be obtained in our numerics because of the no-slip boundary conditions that leads to a singular behaviour in the continuum limit (Dussan Reference Dussan1979). Physically, the flow is regularized by small-scale effects, that can be accounted for through an effective boundary slip condition at the solid surface, with a slip length of the order of a few tens of nanometres (Bonn et al.
Reference Bonn, Eggers, Indekeu, Meunier and Rolley2009). To obtain numerical convergence for this dynamics, complex boundary conditions at the moving contact line involving the mesh size have to be introduced (Afkhami et al.
Reference Afkhami, Zaleski and Bussmann2009; Legendre & Maglio Reference Legendre and Maglio2015; Afkhami et al.
Reference Afkhami, Buongiorno, Guion, Popinet, Scardovelli and Zaleski2017). Keeping a fixed maximum refinement level avoids the question of the numerical convergence of the moving contact-line dynamics, since it corresponds then to a fixed slip length boundary condition at the solid substrate. For instance, for a millimetre drop diameter, the slip length in our simulations is approximately 250 nanometres, clearly larger than the physical one, but with no expected qualitative change in the dynamics.
$n=11$
. However, the convergence for the dynamics of the moving contact line cannot be obtained in our numerics because of the no-slip boundary conditions that leads to a singular behaviour in the continuum limit (Dussan Reference Dussan1979). Physically, the flow is regularized by small-scale effects, that can be accounted for through an effective boundary slip condition at the solid surface, with a slip length of the order of a few tens of nanometres (Bonn et al.
Reference Bonn, Eggers, Indekeu, Meunier and Rolley2009). To obtain numerical convergence for this dynamics, complex boundary conditions at the moving contact line involving the mesh size have to be introduced (Afkhami et al.
Reference Afkhami, Zaleski and Bussmann2009; Legendre & Maglio Reference Legendre and Maglio2015; Afkhami et al.
Reference Afkhami, Buongiorno, Guion, Popinet, Scardovelli and Zaleski2017). Keeping a fixed maximum refinement level avoids the question of the numerical convergence of the moving contact-line dynamics, since it corresponds then to a fixed slip length boundary condition at the solid substrate. For instance, for a millimetre drop diameter, the slip length in our simulations is approximately 250 nanometres, clearly larger than the physical one, but with no expected qualitative change in the dynamics.

Figure 4. Evolution with time of
 $h_{min}(t)$
, the minimal air thickness in the numerics, for different maximum refinement levels
$h_{min}(t)$
, the minimal air thickness in the numerics, for different maximum refinement levels
 $n$
(numbers indicated bottom left of the figure) for
$n$
(numbers indicated bottom left of the figure) for
 $m=0.1$
and
$m=0.1$
and
 $\unicode[STIX]{x1D6FC}=0.001$
. The grid size is then proportional to
$\unicode[STIX]{x1D6FC}=0.001$
. The grid size is then proportional to
 $1/2^{n}$
near the substrate. Although small deviations can be observed between the different levels, we observe a rapid convergence of the results. The straight line indicates the free fall of the drop and the inset shows a zoom of the figure near the time where the bubble is entrapped.
$1/2^{n}$
near the substrate. Although small deviations can be observed between the different levels, we observe a rapid convergence of the results. The straight line indicates the free fall of the drop and the inset shows a zoom of the figure near the time where the bubble is entrapped.
2.3 Scaling analysis
Prior to performing a parametric study of the dynamics, it is useful to define and to estimate some quantities related to the impact. In particular, a geometrical argument based on the intersection of the impacting drop with the substrate shows that, at short times, the vertical length of the intersection
 $h(t)$
varies like
$h(t)$
varies like
 $t$
while the horizontal one follows
$t$
while the horizontal one follows
 $r_{c}(t)\sim \sqrt{h}\sim \sqrt{t}$
. This simple argument has been used since Wagner (Reference Wagner1932), implying a self-similar dynamics of the impact at short times (Josserand & Zaleski Reference Josserand and Zaleski2003; Smith et al.
Reference Smith, Li and Wu2003). More precisely, a quantitative estimate can even be done for the foot of the jet following
$r_{c}(t)\sim \sqrt{h}\sim \sqrt{t}$
. This simple argument has been used since Wagner (Reference Wagner1932), implying a self-similar dynamics of the impact at short times (Josserand & Zaleski Reference Josserand and Zaleski2003; Smith et al.
Reference Smith, Li and Wu2003). More precisely, a quantitative estimate can even be done for the foot of the jet following
 $\sqrt{3t/2}$
(Riboux & Gordillo Reference Riboux and Gordillo2015; Philippi, Lagrée & Antkowiak Reference Philippi, Lagrée and Antkowiak2016) (notice that the
$\sqrt{3t/2}$
(Riboux & Gordillo Reference Riboux and Gordillo2015; Philippi, Lagrée & Antkowiak Reference Philippi, Lagrée and Antkowiak2016) (notice that the
 $3/2$
factor, in contrast with the 3 in the literature, comes from the rescaling by
$3/2$
factor, in contrast with the 3 in the literature, comes from the rescaling by
 $D$
used here instead of
$D$
used here instead of
 $R$
) but remarkably, the general square-root-of-time law (with possibly a different prefactor) describes correctly all the horizontal scales at small times (Josserand & Zaleski Reference Josserand and Zaleski2003). Figure 5 shows the spreading radius
$R$
) but remarkably, the general square-root-of-time law (with possibly a different prefactor) describes correctly all the horizontal scales at small times (Josserand & Zaleski Reference Josserand and Zaleski2003). Figure 5 shows the spreading radius
 $r_{w}(t)$
, defined as the position where the interface height is minimum, as a function of time for
$r_{w}(t)$
, defined as the position where the interface height is minimum, as a function of time for
 $\unicode[STIX]{x1D6FC}=0.001$
and
$\unicode[STIX]{x1D6FC}=0.001$
and
 $m=0.1$
as an illustration of this evolution. In fact, it has been shown that the spreading radius varies only slightly with the fluid viscosity and surface tension (Josserand & Zaleski Reference Josserand and Zaleski2003), so that the curves obtained with other parameters will show the same overall aspect. The curve is well fitted by the predicted law:
$m=0.1$
as an illustration of this evolution. In fact, it has been shown that the spreading radius varies only slightly with the fluid viscosity and surface tension (Josserand & Zaleski Reference Josserand and Zaleski2003), so that the curves obtained with other parameters will show the same overall aspect. The curve is well fitted by the predicted law:
 $$\begin{eqnarray}\displaystyle r_{w}(t)\sim \sqrt{3(t-t_{d})/2}, & & \displaystyle\end{eqnarray}$$
where
 $t_{d}$
is the time when the dimple starts to form beneath the drop. Remarkably, the fit overestimates the spreading radius at very short time, probably because of a small capillary correction when the dimple forms. Rapidly however, the predicted law gives a very good approximation of the spreading radius.
$t_{d}$
is the time when the dimple starts to form beneath the drop. Remarkably, the fit overestimates the spreading radius at very short time, probably because of a small capillary correction when the dimple forms. Rapidly however, the predicted law gives a very good approximation of the spreading radius.

Figure 5. Radius
 $r_{w}$
, defined as the radius of minimal height as a function of time
$r_{w}$
, defined as the radius of minimal height as a function of time
 $t-t_{d}$
, where
$t-t_{d}$
, where
 $t_{d}=0.102$
is the time at which the dimple beneath the drop appears, for
$t_{d}=0.102$
is the time at which the dimple beneath the drop appears, for
 $\unicode[STIX]{x1D6FC}=0.001$
and
$\unicode[STIX]{x1D6FC}=0.001$
and
 $m=0.1$
. The inset shows the relation between
$m=0.1$
. The inset shows the relation between
 $r_{w}$
and
$r_{w}$
and
 $\sqrt{t-t_{d}}$
. Symbols denote the temporal evolution of the
$\sqrt{t-t_{d}}$
. Symbols denote the temporal evolution of the
 $r$
-coordinate of the
$r$
-coordinate of the
 $h_{min}$
point and the dashed curve represents the law
$h_{min}$
point and the dashed curve represents the law
 $r_{w}=\sqrt{3(t-t_{d})/2}$
.
$r_{w}=\sqrt{3(t-t_{d})/2}$
.
Small discontinuities can be observed above
 $t-t_{d}\sim 0.03$
corresponding to
$t-t_{d}\sim 0.03$
corresponding to
 $r_{w}\sim 0.2$
. Above these values, the central bubble has been entrapped and the dynamics of the numerical contact line induces a sequence of contact zone separated by bubbles as illustrated in figure 6. There,
$r_{w}\sim 0.2$
. Above these values, the central bubble has been entrapped and the dynamics of the numerical contact line induces a sequence of contact zone separated by bubbles as illustrated in figure 6. There,
 $r_{w}(t)$
is defined as the largest value of the liquid in contact with solid, explaining the discontinuities in the curve 5. These bubbles are formed by an instability of the moving contact line but note that due to the cylindrical symmetry of our calculations these bubbles are in fact tori that would be unstable in three dimensions. These bubbles are similar to those observed in numerical simulations of drop impacts on a thin liquid film (Josserand et al.
Reference Josserand, Ray and Zaleski2016) and reminiscent of experimental observations by Li, Vakarelski & Thoroddsen (Reference Li, Vakarelski and Thoroddsen2015b
). How these bubbles would fare under refinement of the grid has not been investigated but their size would likely vary.
$r_{w}(t)$
is defined as the largest value of the liquid in contact with solid, explaining the discontinuities in the curve 5. These bubbles are formed by an instability of the moving contact line but note that due to the cylindrical symmetry of our calculations these bubbles are in fact tori that would be unstable in three dimensions. These bubbles are similar to those observed in numerical simulations of drop impacts on a thin liquid film (Josserand et al.
Reference Josserand, Ray and Zaleski2016) and reminiscent of experimental observations by Li, Vakarelski & Thoroddsen (Reference Li, Vakarelski and Thoroddsen2015b
). How these bubbles would fare under refinement of the grid has not been investigated but their size would likely vary.

Figure 6. The expanding lamella after bubble entrapment (
 $t=0.059$
) for the same parameters as in figure 5. The liquid–gas interface is drawn while the solid surface is the dashed line plotted at
$t=0.059$
) for the same parameters as in figure 5. The liquid–gas interface is drawn while the solid surface is the dashed line plotted at
 $z=0$
. Small bubbles are entrapped within the wetted area due to the rapid expansion of the lamella, as displayed in the inset that shows a zoom of the wetted area.
$z=0$
. Small bubbles are entrapped within the wetted area due to the rapid expansion of the lamella, as displayed in the inset that shows a zoom of the wetted area.
This well-known bubble entrapment mechanism has been observed experimentally (Thoroddsen, Etoh & Takehara Reference Thoroddsen, Etoh and Takehara2003; Thoroddsen et al.
Reference Thoroddsen, Etoh, Takehara, Ootsuka and Hatsuki2005) and numerically (Mehdi-Nejad et al.
Reference Mehdi-Nejad, Mostaghimi and Chandra2003; Smith et al.
Reference Smith, Li and Wu2003; Korobkin et al.
Reference Korobkin, Ellis and Smith2008; Mandre et al.
Reference Mandre, Mani and Brenner2009; Duchemin & Josserand Reference Duchemin and Josserand2011) in many studies and contexts. It is usually explained using the lubrication equation framework in the gas (Smith et al.
Reference Smith, Li and Wu2003; Korobkin et al.
Reference Korobkin, Ellis and Smith2008; Mandre et al.
Reference Mandre, Mani and Brenner2009; Mani et al.
Reference Mani, Mandre and Brenner2010) and we will rephrase now the scaling arguments for consistency. Indeed, when the drop approaches the solid, the gas layer beneath the drop becomes very thin so that the gas inertia can be neglected in the Navier–Stokes equations leading to the lubrication equation for the gas layer thickness
 $h(r,t)$
, involving the pressure
$h(r,t)$
, involving the pressure
 $p_{g}(r,t)$
in the gas, written here in dimensionless form:
$p_{g}(r,t)$
in the gas, written here in dimensionless form:
 $$\begin{eqnarray}\displaystyle \frac{\unicode[STIX]{x2202}h}{\unicode[STIX]{x2202}t}=\frac{1}{12r\,St\,}\frac{\unicode[STIX]{x2202}}{\unicode[STIX]{x2202}r}\left(rh^{3}\frac{\unicode[STIX]{x2202}p_{g}}{\unicode[STIX]{x2202}r}\right). & & \displaystyle\end{eqnarray}$$
Using the scalings induced by the geometrical argument above and considering that
 $\unicode[STIX]{x2202}_{t}h\sim 1$
, we obtain the following scaling for the lubrication pressure in the gas:
$\unicode[STIX]{x2202}_{t}h\sim 1$
, we obtain the following scaling for the lubrication pressure in the gas:
 $$\begin{eqnarray}\displaystyle p_{g}\sim \frac{St\,r_{c}^{2}}{h^{3}}\sim \frac{St}{h^{2}}\sim \frac{St}{t^{2}}. & & \displaystyle\end{eqnarray}$$
On the other hand the pressure in the liquid
 $p_{l}$
needed for the deformation of the drop at impact can be estimated using the same self-similar argument by balancing the pressure force
$p_{l}$
needed for the deformation of the drop at impact can be estimated using the same self-similar argument by balancing the pressure force
 $p_{l}\times \unicode[STIX]{x03C0}r_{c}^{2}$
with the momentum variation in the half-sphere of radius
$p_{l}\times \unicode[STIX]{x03C0}r_{c}^{2}$
with the momentum variation in the half-sphere of radius
 $r_{c}$
(in dimensionless form, the vertical velocity is
$r_{c}$
(in dimensionless form, the vertical velocity is
 $U^{\ast }=1$
, and the liquid density is
$U^{\ast }=1$
, and the liquid density is
 $\unicode[STIX]{x1D70C}^{\ast }=1$
, kept in the first formula below to avoid confusion):
$\unicode[STIX]{x1D70C}^{\ast }=1$
, kept in the first formula below to avoid confusion):
 $$\begin{eqnarray}\displaystyle \frac{\text{d}}{\text{d}t}\left(\unicode[STIX]{x1D70C}^{\ast }\frac{2}{3}\unicode[STIX]{x03C0}r_{c}^{3}U^{\ast }\right)=2\unicode[STIX]{x03C0}\unicode[STIX]{x1D70C}^{\ast }r_{c}^{2}\frac{\text{d}r_{c}}{\text{d}t}U^{\ast }, & & \displaystyle\end{eqnarray}$$
yielding (taking now
 $\unicode[STIX]{x1D70C}^{\ast }=U^{\ast }=1$
and using the fact that
$\unicode[STIX]{x1D70C}^{\ast }=U^{\ast }=1$
and using the fact that
 $r_{c}(t)=\sqrt{t}$
so that
$r_{c}(t)=\sqrt{t}$
so that
 $\text{d}r_{c}/\text{d}t=1/(2r_{c})$
)
$\text{d}r_{c}/\text{d}t=1/(2r_{c})$
)
 $$\begin{eqnarray}\displaystyle 2\unicode[STIX]{x03C0}r_{c}\sim p_{l}\times \unicode[STIX]{x03C0}r_{c}^{2}, & & \displaystyle\end{eqnarray}$$
which leads to the scaling for the pressure in the liquid near the impact zone:
 $$\begin{eqnarray}\displaystyle p_{l}\sim \frac{2}{r_{c}}\sim \frac{2}{\sqrt{t}}. & & \displaystyle\end{eqnarray}$$
The entrapment of the bubble can be interpreted within this simplified scaling analysis: when
 $t$
is small enough, the lubrication pressure
$t$
is small enough, the lubrication pressure
 $p_{g}$
is much bigger than the inertial one
$p_{g}$
is much bigger than the inertial one
 $p_{l}$
needed to deviate the impacting drop so that the drop skates on a thin gas layer. On the other hand, when
$p_{l}$
needed to deviate the impacting drop so that the drop skates on a thin gas layer. On the other hand, when
 $t$
increases, the lubrication pressure decreases much more rapidly than the inertial one so that at a critical time, the gas layer cannot any more deviate the liquid that then enters in contact with the solid. This threshold, measured in term of entrapment time
$t$
increases, the lubrication pressure decreases much more rapidly than the inertial one so that at a critical time, the gas layer cannot any more deviate the liquid that then enters in contact with the solid. This threshold, measured in term of entrapment time
 $t_{e}$
or height
$t_{e}$
or height
 $h_{e}=t_{e}$
, radius
$h_{e}=t_{e}$
, radius
 $r_{e}=\sqrt{t_{e}}$
and volume
$r_{e}=\sqrt{t_{e}}$
and volume
 $V_{e}\propto r_{e}^{2}h_{e}$
can be estimated by balancing the two pressures
$V_{e}\propto r_{e}^{2}h_{e}$
can be estimated by balancing the two pressures
 $p_{l}\sim p_{g}$
leading to:
$p_{l}\sim p_{g}$
leading to:
 $$\begin{eqnarray}\displaystyle h^{\ast }\sim t_{e}\propto St^{2/3},\quad r_{e}\propto St^{1/3}\quad \text{and}\quad V_{e}\propto St^{4/3}. & & \displaystyle\end{eqnarray}$$
Measuring these quantities experimentally remains a difficult challenge because of the small values of the Stokes numbers but this has been done eventually using complex optical techniques (Driscoll & Nagel Reference Driscoll and Nagel2011; Bouwhuis et al.
Reference Bouwhuis, van der Veen, Tran, Keij, Winkels, Peters, van der Meer, Sun, Snoeijer and Lohse2012; Kolinski et al.
Reference Kolinski, Rubinstein, Mandre, Brenner, Weitz and Mahadevan2012; Klaseboer, Manica & Chan Reference Klaseboer, Manica and Chan2014; Li, Vakarelski & Thoroddsen Reference Li, Vakarelski and Thoroddsen2015a
). The results are somehow puzzling since the theoretical predictions have not always been observed or only in a narrow range of Stokes numbers. We have investigated numerically the radius of the entrapped bubble by measuring the radius
 $r_{e}$
of the first contact between the droplet and the solid and the height
$r_{e}$
of the first contact between the droplet and the solid and the height
 $h_{e}$
of the gas film at that time taken at
$h_{e}$
of the gas film at that time taken at
 $r=0$
, for different Stokes numbers, by varying the gas viscosity. As shown in figure 7(a), the scaling laws work well for a large range of Stokes numbers, proving that the lubrication is clearly in action at first order. However they fail for small or very large Stokes numbers: the finite size of the drop affects the scaling for high Stokes numbers while one may expect inertia effects to dominate lubrication theory at small Stokes numbers (Wilson & Duffy Reference Wilson and Duffy1998; Luchini & Charru Reference Luchini and Charru2010), as already observed numerically for the impact on a liquid surface (Jian et al.
Reference Jian, Josserand, Ray, Duchemin, Popinet and Zaleski2015; Josserand et al.
Reference Josserand, Ray and Zaleski2016). This variation of the entrapped bubble size with the gas density at small Stokes numbers is a first manifestation of an effect related to the gas inertia in the impact. This is shown in figure 7(b), where the volume is plotted as the density ratio varies for a fixed Stokes number (
$r=0$
, for different Stokes numbers, by varying the gas viscosity. As shown in figure 7(a), the scaling laws work well for a large range of Stokes numbers, proving that the lubrication is clearly in action at first order. However they fail for small or very large Stokes numbers: the finite size of the drop affects the scaling for high Stokes numbers while one may expect inertia effects to dominate lubrication theory at small Stokes numbers (Wilson & Duffy Reference Wilson and Duffy1998; Luchini & Charru Reference Luchini and Charru2010), as already observed numerically for the impact on a liquid surface (Jian et al.
Reference Jian, Josserand, Ray, Duchemin, Popinet and Zaleski2015; Josserand et al.
Reference Josserand, Ray and Zaleski2016). This variation of the entrapped bubble size with the gas density at small Stokes numbers is a first manifestation of an effect related to the gas inertia in the impact. This is shown in figure 7(b), where the volume is plotted as the density ratio varies for a fixed Stokes number (
 $St=10^{-5}$
), exhibiting a decrease of the bubble entrapped with decreasing gas density. There, while a monotonic increasing trend can be seen, a high scattering of the data is also observed. This scattering comes from the small gas density that enhances numerical instability. In particular, large velocity gradients form in this region where the maximum refinement level is reached, so that these gradients are probably not sufficiently well resolved. Future studies should use higher refinement to clarify this point. When comparing the lubrication pressure with the Bernoulli pressure in this configuration, it has been shown that the threshold between inertia and lubrication occurs for
$St=10^{-5}$
), exhibiting a decrease of the bubble entrapped with decreasing gas density. There, while a monotonic increasing trend can be seen, a high scattering of the data is also observed. This scattering comes from the small gas density that enhances numerical instability. In particular, large velocity gradients form in this region where the maximum refinement level is reached, so that these gradients are probably not sufficiently well resolved. Future studies should use higher refinement to clarify this point. When comparing the lubrication pressure with the Bernoulli pressure in this configuration, it has been shown that the threshold between inertia and lubrication occurs for
 $\unicode[STIX]{x1D6FC}\sim St^{2/3}$
(Josserand et al.
Reference Josserand, Ray and Zaleski2016), in good qualitative agreement with the plateau observed at small density ratio in figure 7(b). Even if it is tempting to associate this volume decrease with a smaller angle of jet formation and thus with a weaker splash, the full dynamics needs to be investigated further to elucidate the splashing mechanisms.
$\unicode[STIX]{x1D6FC}\sim St^{2/3}$
(Josserand et al.
Reference Josserand, Ray and Zaleski2016), in good qualitative agreement with the plateau observed at small density ratio in figure 7(b). Even if it is tempting to associate this volume decrease with a smaller angle of jet formation and thus with a weaker splash, the full dynamics needs to be investigated further to elucidate the splashing mechanisms.

Figure 7. (a) Thickness of the gas layer
 $h_{e}$
, radius of the first contact point
$h_{e}$
, radius of the first contact point
 $r_{e}$
and volume of the central entrapped bubble
$r_{e}$
and volume of the central entrapped bubble
 $V_{e}$
versus the Stokes number
$V_{e}$
versus the Stokes number
 $St$
(logarithmic scale) for density ratio
$St$
(logarithmic scale) for density ratio
 $\unicode[STIX]{x1D6FC}=0.003$
(this implies
$\unicode[STIX]{x1D6FC}=0.003$
(this implies
 $m=Re\cdot St=1000\,St$
), symbols represent simulation results. Dashed lines represent the scaling laws
$m=Re\cdot St=1000\,St$
), symbols represent simulation results. Dashed lines represent the scaling laws
 $h_{e}=2.6\,St^{2/3}$
,
$h_{e}=2.6\,St^{2/3}$
,
 $r_{e}=3.3\,St^{1/3}$
and
$r_{e}=3.3\,St^{1/3}$
and
 $V_{e}=28.314St^{4/3}$
respectively. (b)
$V_{e}=28.314St^{4/3}$
respectively. (b)
 $V_{e}$
versus density ratio
$V_{e}$
versus density ratio
 $\unicode[STIX]{x1D6FC}$
for
$\unicode[STIX]{x1D6FC}$
for
 $St=10^{-5}$
.
$St=10^{-5}$
.
3 Identification of two splashing mechanisms
In order to investigate the influence of the gas properties on the splashing mechanism, we perform a collection of numerical simulations by varying only the gas density and viscosity through the ratios
 $\unicode[STIX]{x1D6FC}$
and
$\unicode[STIX]{x1D6FC}$
and
 $m$
respectively. The results on the bubble entrapment suggest that this dynamics is a priori dominated by the gas viscosity (through the Stokes number, involving the viscosity ratio
$m$
respectively. The results on the bubble entrapment suggest that this dynamics is a priori dominated by the gas viscosity (through the Stokes number, involving the viscosity ratio
 $m$
) but with a small correction due to inertia (involving then the density ratio
$m$
) but with a small correction due to inertia (involving then the density ratio
 $r$
), as highlighted by the variation of the entrapped bubble with the gas density. The variation of the impact dynamics with the viscosity ratio can be observed in figure 8 where the temporal evolution of the interface profile at the early stage of impact is shown for three different values of
$r$
), as highlighted by the variation of the entrapped bubble with the gas density. The variation of the impact dynamics with the viscosity ratio can be observed in figure 8 where the temporal evolution of the interface profile at the early stage of impact is shown for three different values of
 $m$
for a fixed value of
$m$
for a fixed value of
 $\unicode[STIX]{x1D6FC}=0.003$
. As the gas viscosity decreases, the impact dynamics presents three different regimes and exhibits in particular two distinct splashing mechanisms: at the highest viscosity ratio
$\unicode[STIX]{x1D6FC}=0.003$
. As the gas viscosity decreases, the impact dynamics presents three different regimes and exhibits in particular two distinct splashing mechanisms: at the highest viscosity ratio
 $m=0.15$
, figure 8(a), a jet emerges from the drop just before the contact with the solid, leading eventually to a splash forming rapidly a large angle with the substrate. We call this mechanism the jet splash. When the viscosity ratio is decreased, for
$m=0.15$
, figure 8(a), a jet emerges from the drop just before the contact with the solid, leading eventually to a splash forming rapidly a large angle with the substrate. We call this mechanism the jet splash. When the viscosity ratio is decreased, for
 $m=0.04$
(figure 8
b), a splash is still present but it is formed by the detachment of a jet from the rapid spreading of the liquid already in contact with the substrate, leading eventually to a splash forming firstly a small angle with the substrate (typically below
$m=0.04$
(figure 8
b), a splash is still present but it is formed by the detachment of a jet from the rapid spreading of the liquid already in contact with the substrate, leading eventually to a splash forming firstly a small angle with the substrate (typically below
 $5^{\circ }$
here). We call this mechanism the detachment splash. Then at even smaller gas viscosity (
$5^{\circ }$
here). We call this mechanism the detachment splash. Then at even smaller gas viscosity (
 $m=0.01$
, figure 8
c), no splash is observed, the rapid spreading of the drop on the substrate remains stable. This regime is called the spreading. Such splashing jet angle variation has already been observed when varying the Reynolds number (Thoraval et al.
Reference Thoraval, Takehara, Etoh, Popinet, Ray, Josserand, Zaleski and Thoroddsen2012) and it is interesting to notice here that the gas density can similarly affect this angle.
$m=0.01$
, figure 8
c), no splash is observed, the rapid spreading of the drop on the substrate remains stable. This regime is called the spreading. Such splashing jet angle variation has already been observed when varying the Reynolds number (Thoraval et al.
Reference Thoraval, Takehara, Etoh, Popinet, Ray, Josserand, Zaleski and Thoroddsen2012) and it is interesting to notice here that the gas density can similarly affect this angle.

Figure 8. Interface evolution in time at the early stage of impact for
 $\unicode[STIX]{x1D6FC}=0.003$
but different viscosity ratios
$\unicode[STIX]{x1D6FC}=0.003$
but different viscosity ratios
 $m$
: (a) jet splash,
$m$
: (a) jet splash,
 $m=0.15$
, the interfaces from left to right correspond to
$m=0.15$
, the interfaces from left to right correspond to
 $t=0.025,0.030,0.035,0.040,0.080$
respectively; (b) detachment splash,
$t=0.025,0.030,0.035,0.040,0.080$
respectively; (b) detachment splash,
 $m=0.04$
, the interfaces from left to right correspond to
$m=0.04$
, the interfaces from left to right correspond to
 $t=0.015,0.020,0.025,0.030,0.035,0.080$
respectively; (c) spreading,
$t=0.015,0.020,0.025,0.030,0.035,0.080$
respectively; (c) spreading,
 $m=0.01$
, the interfaces from left to right correspond to
$m=0.01$
, the interfaces from left to right correspond to
 $t=0.007,0.010,0.015,0.030,0.040$
respectively. The line
$t=0.007,0.010,0.015,0.030,0.040$
respectively. The line
 $z=0$
represents the solid substrate.
$z=0$
represents the solid substrate.
Our numerics have thus helped to identify two different splashing mechanisms depending on whether a jet is formed before or after the liquid wets the solid. Such distinct behaviours have been in fact already suggested by Mandre & Brenner (Reference Mandre and Brenner2012) based on qualitative arguments but it is to our knowledge the first time that they are observed in numerical simulations. Although the two splashing mechanisms exhibit different behaviours for the jet formation at small times, their further evolution shows eventually similar features for the jet deviation shape, as can be seen in figure 9 where the interface is shown for the two splashing cases of figure 8 at the later time
 $t=0.5$
. There, the two interface shapes are similar forming a characteristic shape that resembles the letter ‘S’. In the lowest viscosity case the jet is only slightly closer to the horizontal than for the higher viscosity case. To illustrate further on the two different splashing mechanisms, we show in figure 10 the pressure and velocity fields at the onset of the jet formation for
$t=0.5$
. There, the two interface shapes are similar forming a characteristic shape that resembles the letter ‘S’. In the lowest viscosity case the jet is only slightly closer to the horizontal than for the higher viscosity case. To illustrate further on the two different splashing mechanisms, we show in figure 10 the pressure and velocity fields at the onset of the jet formation for
 $m=0.04$
(detachment splash, a) and
$m=0.04$
(detachment splash, a) and
 $m=0.15$
(jet splash, b). Higher pressure is observed in the detachment case because of the arrest of the liquid by the contact with the solid substrate. By contrast, the velocity field clearly exhibits the skating of the liquid jet on a thin gas layer in the case of the jet splash.
$m=0.15$
(jet splash, b). Higher pressure is observed in the detachment case because of the arrest of the liquid by the contact with the solid substrate. By contrast, the velocity field clearly exhibits the skating of the liquid jet on a thin gas layer in the case of the jet splash.

Figure 9. Interface profiles at the same time
 $t=0.5$
for density ratio
$t=0.5$
for density ratio
 $\unicode[STIX]{x1D6FC}=0.003$
and for the two viscosity ratios
$\unicode[STIX]{x1D6FC}=0.003$
and for the two viscosity ratios
 $m=0.15$
and
$m=0.15$
and
 $m=0.04$
at which splash was observed in figure 8. The line
$m=0.04$
at which splash was observed in figure 8. The line
 $z=0$
represents the solid substrate.
$z=0$
represents the solid substrate.

Figure 10. Pressure (colour) and velocity (arrows) fields at time
 $t=0.04$
for the two different splashing mechanisms at
$t=0.04$
for the two different splashing mechanisms at
 $\unicode[STIX]{x1D6FC}=0.003$
. (a) The detachment splash for
$\unicode[STIX]{x1D6FC}=0.003$
. (a) The detachment splash for
 $m=0.04$
and (b) the jet splash for
$m=0.04$
and (b) the jet splash for
 $m=0.15$
. In (b) the liquid layer is skating on a thin gas film, and the velocity field in the liquid is almost parallel, while in (a) the liquid is arrested by the substrate, leading to a weaker and more complex velocity field, and higher pressure.
$m=0.15$
. In (b) the liquid layer is skating on a thin gas film, and the velocity field in the liquid is almost parallel, while in (a) the liquid is arrested by the substrate, leading to a weaker and more complex velocity field, and higher pressure.
The formation of the splash is even clearer in figure 11 where the evolution of the positions of the rim of the expanding liquid sheet (defined as its maximum
 $r$
-coordinate) is drawn for different viscosity ratios. Two main behaviours can be observed at large times/radius (for
$r$
-coordinate) is drawn for different viscosity ratios. Two main behaviours can be observed at large times/radius (for
 $r/D>0.5$
typically): a splash is formed for the highest values of
$r/D>0.5$
typically): a splash is formed for the highest values of
 $m$
(here for
$m$
(here for
 $m\geqslant 0.04$
) while the rim remains attached to the substrate for the two lowest values. Since the position is taken at the edge of the expanding rim, this explains why even for the no-splash regime the height is still slowly growing with time. Looking more precisely at the short-time evolution (around
$m\geqslant 0.04$
) while the rim remains attached to the substrate for the two lowest values. Since the position is taken at the edge of the expanding rim, this explains why even for the no-splash regime the height is still slowly growing with time. Looking more precisely at the short-time evolution (around
 $r/D\sim 0.3$
to be compared with the bubble entrapment at
$r/D\sim 0.3$
to be compared with the bubble entrapment at
 $r/D\sim 0.2$
), one can observe the detachment-splash regime for
$r/D\sim 0.2$
), one can observe the detachment-splash regime for
 $m=0.04$
where the dynamics follows for a short time the evolution of the smaller viscosities until they depart and then follows a splash dynamics.
$m=0.04$
where the dynamics follows for a short time the evolution of the smaller viscosities until they depart and then follows a splash dynamics.
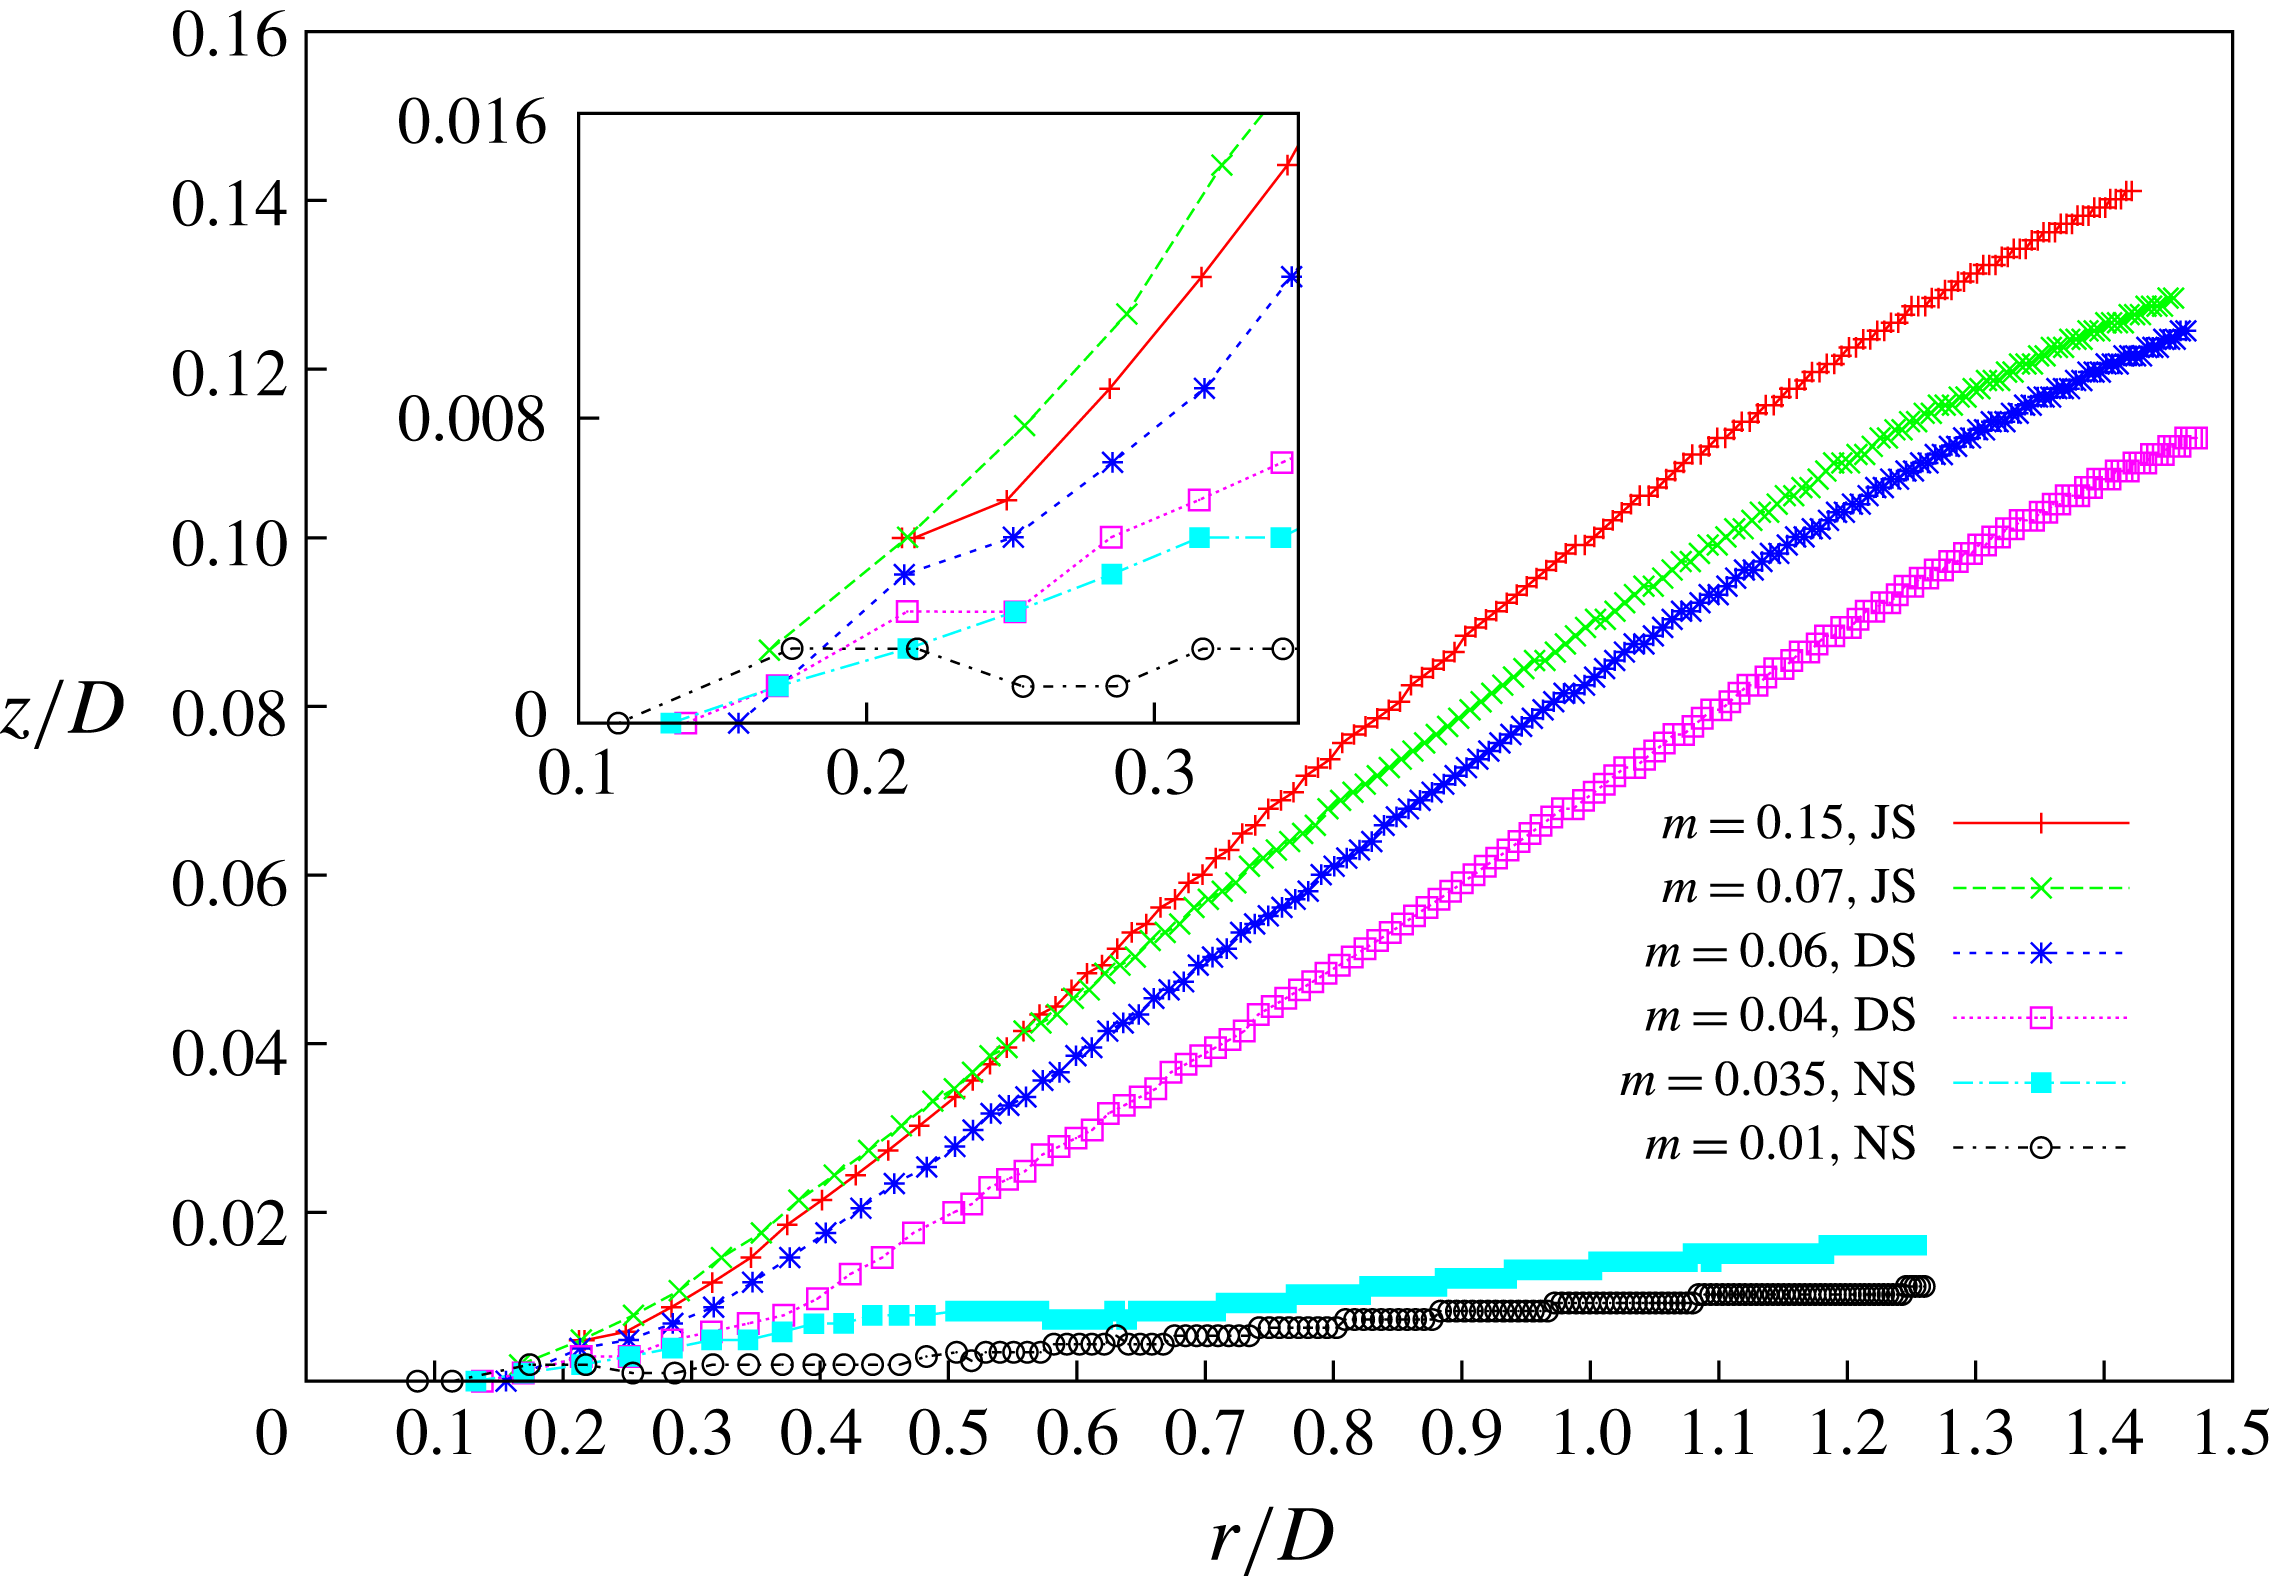
Figure 11. Evolution in time of the position of the rim of the liquid sheet for various viscosity ratios
 $m=0.01,0.035,0.04,0.06,0.07,0.15$
with a constant density ratio
$m=0.01,0.035,0.04,0.06,0.07,0.15$
with a constant density ratio
 $\unicode[STIX]{x1D6FC}=0.003$
. NS represents non-splashing spreading, DS represents the detachment-splash regime and JS the jet-splash behaviour. Inset shows a zoom at small times (around
$\unicode[STIX]{x1D6FC}=0.003$
. NS represents non-splashing spreading, DS represents the detachment-splash regime and JS the jet-splash behaviour. Inset shows a zoom at small times (around
 $r/D\sim 0.3$
). The position of the rim is defined as the maximum
$r/D\sim 0.3$
). The position of the rim is defined as the maximum
 $r$
-coordinate of the expanding liquid lamella. The local minimum observed around
$r$
-coordinate of the expanding liquid lamella. The local minimum observed around
 $r/D\sim 0.6$
for
$r/D\sim 0.6$
for
 $m=0.035$
corresponds to the formation of a liquid rim on the spreading lamella.
$m=0.035$
corresponds to the formation of a liquid rim on the spreading lamella.
These behaviours can also be observed when the gas density varies, as shown in figure 12 where the evolution of the position of the rim is plotted for varying density ratios
 $\unicode[STIX]{x1D6FC}$
for two different viscosity ratios
$\unicode[STIX]{x1D6FC}$
for two different viscosity ratios
 $m=0.037$
and
$m=0.037$
and
 $m=0.07$
. For the first case, the splash is suppressed for low enough density ratio (below
$m=0.07$
. For the first case, the splash is suppressed for low enough density ratio (below
 $\unicode[STIX]{x1D6FC}=10^{-3}$
) and the detachment-jet dynamics is observed for
$\unicode[STIX]{x1D6FC}=10^{-3}$
) and the detachment-jet dynamics is observed for
 $\unicode[STIX]{x1D6FC}=0.0015$
. When the viscosity ratio is increased to
$\unicode[STIX]{x1D6FC}=0.0015$
. When the viscosity ratio is increased to
 $m=0.07$
, the splash threshold is lowered when the density ratio decreases but there no suppression is obtained for the lowest density ratio available in our numerics. These results are particularly important since they show that even in incompressible gas dynamics the density can influence the impact and eventually suppress the splash. Together with the variation of the entrapped bubble size with gas density, it suggests that gas inertia does influence the splashing threshold. However, this effect appears here as a correction to the dominant incompressible lubrication mechanism.
$m=0.07$
, the splash threshold is lowered when the density ratio decreases but there no suppression is obtained for the lowest density ratio available in our numerics. These results are particularly important since they show that even in incompressible gas dynamics the density can influence the impact and eventually suppress the splash. Together with the variation of the entrapped bubble size with gas density, it suggests that gas inertia does influence the splashing threshold. However, this effect appears here as a correction to the dominant incompressible lubrication mechanism.

Figure 12. Position evolution of the rim of the thin liquid sheet on varying the density ratio
 $\unicode[STIX]{x1D6FC}=0.0005,0.001,0.0015,0.004$
with a constant viscosity ratio: (a)
$\unicode[STIX]{x1D6FC}=0.0005,0.001,0.0015,0.004$
with a constant viscosity ratio: (a)
 $m=0.037$
and (b)
$m=0.037$
and (b)
 $m=0.07$
. NS represents non-splashing spreading, DS represents the detachment-splash regime and JS the jet-splash behaviour. The local minimum observed in (a) around
$m=0.07$
. NS represents non-splashing spreading, DS represents the detachment-splash regime and JS the jet-splash behaviour. The local minimum observed in (a) around
 $r/D\sim 0.6$
for
$r/D\sim 0.6$
for
 $\unicode[STIX]{x1D6FC}=0.001$
corresponds to the formation of a liquid rim on the spreading lamella.
$\unicode[STIX]{x1D6FC}=0.001$
corresponds to the formation of a liquid rim on the spreading lamella.
4 Phase diagram
The influence of the gas properties on the impact dynamics can be summarized in a phase diagram obtained by varying only the gas viscosity and density, through their ratio with the liquid ones, all the other parameters kept constant. It corresponds thus to fixed Reynolds and Weber numbers (the same as those used until now,
 $Re=1000$
and
$Re=1000$
and
 $We=370$
). Figure 13 shows the phase diagram for the whole range of parameters studied here, with a variation of the gas density and viscosity over approximately two orders of magnitude. In this phase diagram the regions leading to the different splash mechanisms are marked using different symbols and colours. At first glance, one can see that the splashing/spreading boundary, but also the detachment-/jet-splash boundary, depends almost only on the gas viscosity, as suggested by the previous results showing that the incompressible lubrication dynamics was the dominant effect on the short-time dynamics of the impact. However, one can notice an effect of the gas density at small densities showing that the low gas densities (corresponding thus to low pressure) tend to lower and sometimes even suppress the splashing, in qualitative agreement with the experimental observation (Xu et al.
Reference Xu, Zhang and Nagel2005). Interestingly, the detachment-splash regime always separates the two main behaviours (spreading and jet splashing) and can thus be considered as a transition domain.
$We=370$
). Figure 13 shows the phase diagram for the whole range of parameters studied here, with a variation of the gas density and viscosity over approximately two orders of magnitude. In this phase diagram the regions leading to the different splash mechanisms are marked using different symbols and colours. At first glance, one can see that the splashing/spreading boundary, but also the detachment-/jet-splash boundary, depends almost only on the gas viscosity, as suggested by the previous results showing that the incompressible lubrication dynamics was the dominant effect on the short-time dynamics of the impact. However, one can notice an effect of the gas density at small densities showing that the low gas densities (corresponding thus to low pressure) tend to lower and sometimes even suppress the splashing, in qualitative agreement with the experimental observation (Xu et al.
Reference Xu, Zhang and Nagel2005). Interestingly, the detachment-splash regime always separates the two main behaviours (spreading and jet splashing) and can thus be considered as a transition domain.

Figure 13. Phase diagram of the impact outcome concerning the splashing dynamics. NS represents non-splashing spreading, DS represents the detachment-splash regime and JS the jet-splash behaviour.

Figure 14. Evolution of maximal vorticity in the gas as a function of time for different viscosity ratios ranging from
 $m=0.01$
to
$m=0.01$
to
 $m=0.15$
and
$m=0.15$
and
 $\unicode[STIX]{x1D6FC}=0.001$
to
$\unicode[STIX]{x1D6FC}=0.001$
to
 $\unicode[STIX]{x1D6FC}=0.004$
, covering the different splash and spreading regimes. NS represents non-splashing spreading, DS represents the detachment-splash regime and JS the jet-splash behaviour.
$\unicode[STIX]{x1D6FC}=0.004$
, covering the different splash and spreading regimes. NS represents non-splashing spreading, DS represents the detachment-splash regime and JS the jet-splash behaviour.
Finally, now that we have observed that gas density can influence the splashing of a droplet on a solid substrate even in the incompressible flow limit, it is crucial to identify the physical mechanisms involved in this dependency! Indeed, since the gas density in this incompressible limit enters in the equations through the inertial term, we need to understand its effect. In that framework, we should distinguish two different situations, whether the splash is initiated before or after the contact and wetting with the solid. Since the spreading dynamics after contact with the substrate involves the complex dynamics of the moving contact line, we will focus first on the transition between detachment and jet splash. In that situation, the main difference between the jet and the detachment splashes comes from the observation that a jet is ejected from the drop prior to contact for the jet splash, in contrast with the detachment splash. It suggests that an instability mechanism involving gas inertia is enhanced by the gas density. When the jet is initiated before the contact (jet-splash regime), we can consider that the droplet is spreading and skating on a thin layer of air and it is tempting to draw an analogy with the atomization of liquid jets (Boeck & Zaleski Reference Boeck and Zaleski2005; Fuster et al.
Reference Fuster, Matas, Marty, Popinet, Hoepffner, Cartellier and Zaleski2013). In fact, it has been already suggested and demonstrated experimentally that in this case, the rapid skating of the liquid on a thin gas layer can develop a Kelvin–Helmholtz (KH) like instability that generates the splash (Kim et al.
Reference Kim, Park, Lee, Kim, Kim and Kim2014; Liu et al.
Reference Liu, Tan and Xu2015). In particular Liu et al. (Reference Liu, Tan and Xu2015) has shown that the splash could be suppressed by draining the air layer beneath the drop near the contact location, emphasizing the role of the skating of the liquid on the gas layer. The KH instability involves the density ratio as well as the viscosity ratio in the growth rate of the instability (Villermaux Reference Villermaux1998; Yecko & Zaleski Reference Yecko and Zaleski1999; Yecko, Zaleski & Fullana Reference Yecko, Zaleski and Fullana2002; Boeck & Zaleski Reference Boeck and Zaleski2005; Fuster et al.
Reference Fuster, Matas, Marty, Popinet, Hoepffner, Cartellier and Zaleski2013), and although the shear flow induced by the skating has a complex structure, such an instability should be present in the dynamics prior to the contact. To quantify the shear induced by the dynamics, we measure the vorticity (
 $\unicode[STIX]{x1D714}=\unicode[STIX]{x2202}_{z}u-\unicode[STIX]{x2202}_{r}v$
) in the gas layer beneath the droplet. Figure 14 shows the evolution of the maximum of this vorticity in the gas layer as a function of time for different viscosity ratios (ranging from
$\unicode[STIX]{x1D714}=\unicode[STIX]{x2202}_{z}u-\unicode[STIX]{x2202}_{r}v$
) in the gas layer beneath the droplet. Figure 14 shows the evolution of the maximum of this vorticity in the gas layer as a function of time for different viscosity ratios (ranging from
 $m=0.01$
to
$m=0.01$
to
 $m=0.15$
) and density ratios (
$m=0.15$
) and density ratios (
 $\unicode[STIX]{x1D6FC}=0.001$
and
$\unicode[STIX]{x1D6FC}=0.001$
and
 $\unicode[STIX]{x1D6FC}=0.004$
): as expected for the lubrication regime in the gas layer, we observe a strong dependence of the vorticity following roughly
$\unicode[STIX]{x1D6FC}=0.004$
): as expected for the lubrication regime in the gas layer, we observe a strong dependence of the vorticity following roughly
 $\unicode[STIX]{x1D714}\propto 1/\unicode[STIX]{x1D707}_{g}$
(this can be inferred from the shear stress balance at the interface between the gas layer and the liquid spreading). On the other hand, no dependency on the gas density is observed since for a fixed viscosity ratio
$\unicode[STIX]{x1D714}\propto 1/\unicode[STIX]{x1D707}_{g}$
(this can be inferred from the shear stress balance at the interface between the gas layer and the liquid spreading). On the other hand, no dependency on the gas density is observed since for a fixed viscosity ratio
 $m$
(see in particular for
$m$
(see in particular for
 $m=0.037\sim 0.04$
in the figure), we cannot distinguish the curves for the three density ratios (
$m=0.037\sim 0.04$
in the figure), we cannot distinguish the curves for the three density ratios (
 $\unicode[STIX]{x1D6FC}=0.001$
, 0.003 and 0.004). Then, even if the shear flow here is more complex than in situations considered usually in theoretical studies, we can argue that the KH instability for fixed
$\unicode[STIX]{x1D6FC}=0.001$
, 0.003 and 0.004). Then, even if the shear flow here is more complex than in situations considered usually in theoretical studies, we can argue that the KH instability for fixed
 $m$
will be enhanced by the increase of the gas density. Therefore, we expect the jet splash to form in this situation at higher values of
$m$
will be enhanced by the increase of the gas density. Therefore, we expect the jet splash to form in this situation at higher values of
 $\unicode[STIX]{x1D6FC}$
than the detachment splash, as observed in the numerics. On the other hand, the transition between the detachment splash and the spreading cannot be explained by this KH instability of the liquid skating on a thin gas layer, since the expanding liquid sheet wets the substrate. In that case, it has been suggested that the strong damping of the spreading due to the contact of the liquid with the solid would generate the splash and in that case the lift force that deviates the liquid jet needs to be identified (Mandre & Brenner Reference Mandre and Brenner2012). In a recent work Riboux & Gordillo (Reference Riboux and Gordillo2014) proposed to decompose this lift force in two contributions, one coming from the gas dynamics near the rapidly moving contact line, the other being the suction due to the Bernoulli pressure acting on top of the spreading liquid layer. The gas density is involved in these two contributions in different ways, through the non-continuum effect for the force near the contact line and through the gas inertia in the Bernoulli pressure. In our numerics, only the Bernoulli pressure involves the gas density since the non-continuum effects are not accounted for. Therefore, our approach can be seen as an illustration of the influence of the lift force due to the Bernoulli suction on the detachment-splash/spreading transition.
$\unicode[STIX]{x1D6FC}$
than the detachment splash, as observed in the numerics. On the other hand, the transition between the detachment splash and the spreading cannot be explained by this KH instability of the liquid skating on a thin gas layer, since the expanding liquid sheet wets the substrate. In that case, it has been suggested that the strong damping of the spreading due to the contact of the liquid with the solid would generate the splash and in that case the lift force that deviates the liquid jet needs to be identified (Mandre & Brenner Reference Mandre and Brenner2012). In a recent work Riboux & Gordillo (Reference Riboux and Gordillo2014) proposed to decompose this lift force in two contributions, one coming from the gas dynamics near the rapidly moving contact line, the other being the suction due to the Bernoulli pressure acting on top of the spreading liquid layer. The gas density is involved in these two contributions in different ways, through the non-continuum effect for the force near the contact line and through the gas inertia in the Bernoulli pressure. In our numerics, only the Bernoulli pressure involves the gas density since the non-continuum effects are not accounted for. Therefore, our approach can be seen as an illustration of the influence of the lift force due to the Bernoulli suction on the detachment-splash/spreading transition.
Finally, quantitative comparisons between our results and the experimental results of Xu et al. (Reference Xu, Zhang and Nagel2005) and Riboux & Gordillo (Reference Riboux and Gordillo2014) would be interesting to perform in order to precisely separate the different effects involved in the splashing dynamics. Unfortunately, such a quantitative study is not possible in the context of this paper because our impact parameters (Reynolds and Weber numbers) are too different from the experimental ones. Such work is thus postponed to a further investigation.
5 Conclusion
In this paper, we have performed a parametric numerical study of droplet impact on a solid substrate in the incompressible limit both for the gas and the liquid flow, allowing us to identify the influence of the gas by varying the gas density and viscosity only. We have shown that the dominant effect involved in the splashing/spreading transition comes from the gas viscosity and is due to the lubrication regime holding beneath the drop at the impact. However, the variation of the dimensions of the entrapped bubble with the gas density at small Stokes numbers indicates that a correction due to gas inertia is also present. This is confirmed when the splashing/spreading transition is investigated: firstly we distinguish numerically for the first time two different splashing mechanisms, depending on whether a jet is ejected from the drop prior to the contact with the substrate or not, leading to the jet-splash and detachment-splash regimes respectively. Then, a phase diagram for the splashing/spreading transition is obtained by varying both the gas density and viscosity in the region of interest. There, the first-order incompressible lubrication dynamics is observed but with a clear correction due to the gas density, particularly present for small density ratios. Finally, we interpret the gas density dependence separating the two types of splash mechanisms as a Kelvin–Helmholtz-like instability, as suggested earlier (Kim et al. Reference Kim, Park, Lee, Kim, Kim and Kim2014; Liu et al. Reference Liu, Tan and Xu2015), that is enhanced when the gas density is increased, exhibiting a genuine splashing mechanism. For the transition between spreading and splashing, our numerics are in agreement with the model proposed previously (Mandre & Brenner Reference Mandre and Brenner2012; Riboux & Gordillo Reference Riboux and Gordillo2014): the Bernoulli pressure acting on the rapidly spreading liquid jet induces the suction of the liquid that can lift up the lamella when the gas density is high enough. Our results have thus helped to isolate purely inertial mechanisms that are at play in the splashing transition. However, their quantitative contributions with respect to other contributions coming from compressibility and/or non-continuum effects cannot be evaluated in the present study. Such numerical investigations would still be difficult to do for two reasons: firstly, we are not aware of any accurate numerical methods being able to deal simultaneously with two-phase flows with resolved interfaces, compressible dynamics and non-continuum effects. The method of Li (Reference Li2016) could be useful in that respect. Second, even if we have obtained good qualitative results, quantitative estimates of the different contributions to the splashing should eventually be performed for realistic impact parameters, something that is probably not too difficult to reach in the near future, given the rapid improvements of the numerical methods and computational power (Agbaglah et al. Reference Agbaglah, Delaux, Fuster, Hoepffner, Josserand, Popinet, Ray, Scardovelli and Zaleski2011).


