


1. Introduction
Fractured reservoirs play an immense role in many sub-surface flows; examples include oil and gas reservoirs (van Santvoort & Golombok Reference van Santvoort and Golombok2018), shale oil production (Chaudhary, Ehlig-Economides & Wattenbarger Reference Chaudhary, Ehlig-Economides and Wattenbarger2011), enhanced geothermal systems (Tester et al. Reference Tester, Anderson, Batchelor, Blackwell, DiPippo, Drake, Garnish, Livesay, Moore and Nichols2007), fresh water aquifers (Rudolph, Cherry & Farvolden Reference Rudolph, Cherry and Farvolden1991; Maclay Reference Maclay1995), CO $_2$ sequestration (Fu et al. Reference Fu, Settgast, Hao, Morris and Ryerson2017), etc. Various approaches have been developed to make numerical model predictions. The most accurate ones rely on representing individual fractures, either resolved (Matthäi & Belayneh Reference Matthäi and Belayneh2004) or as lower-dimensional manifolds (Karimi-Fard, Durlofsky & Aziz Reference Karimi-Fard, Durlofsky and Aziz2004; Hajibeygi, Karvounis & Jenny Reference Hajibeygi, Karvounis and Jenny2011a,Reference Hajibeygi, Karvounis and Jennyb). In the latter case, one refers to discrete fracture models (DFM). In the context of DFM, often conforming, unstructured grids are used (Karimi-Fard et al. Reference Karimi-Fard, Durlofsky and Aziz2004; Matthai, Mezentsev & Belayneh Reference Matthai, Mezentsev and Belayneh2005, Reference Matthai, Mezentsev and Belayneh2007a; Matthai et al. Reference Matthai, Geiger, Roberts, Paluszny, Belayneh, Burri, Mezentsev, Lu, Coumou, Driesner and Heinrich2007b; Coumou et al. Reference Coumou, Matthäi, Geiger and Driesner2008), which simplifies the coupling between fractures and matrix, but can result in extremely complex grids with unfavourable cell size ratios. Further, if also geomechanics with fracture propagation is considered, re-gridding becomes necessary, which renders simulations complicated and very expensive. Embedded DFM (EDFM), on the other hand, rely on non-conforming structured matrix grids with embedded fracture manifolds. Since the grid does not have to conform to the fractures, adding new fracture segments is very simple and cheap (Karvounis & Jenny Reference Karvounis and Jenny2016). One disadvantage is that transfer coefficients have to be modelled for each fracture segment/grid cell interaction (Li & Lee Reference Li and Lee2008). Further, in EDFMs there is no distinction between sub-cells being created, if a fracture intersects with a grid cell. This is an important issue in the case of displacement discontinuities due to shear failure and/or tensile opening and has been successfully addressed with the extended finite element method (Moes, Dolbow & Belytschko Reference Moes, Dolbow and Belytschko1999) and the extended finite volume method (Deb & Jenny Reference Deb and Jenny2017a,Reference Deb and Jennyb). In any case, simulations of detailed fractured reservoirs can become extremely expensive. Often, however, one is rather interested in the expected or mean flow than in that of a single realization. The brute force way to obtain mean quantities and other statistical moments is Monte Carlo (MC), where solutions of many independent fractured reservoir realizations are sampled. As the statistical error scales with one over the square root of the number of realizations, a large number of realizations is required for a proper MC study, which often is unaffordable. Although the cost of classical MC can dramatically be reduced with multi-level MC (Heinrich Reference Heinrich2001; Giles Reference Giles2008; Viswanathan et al. Reference Viswanathan, Hyman, Karra, O'Malley, Srinivasan, Hagberg and Srinivasan2018), as recently shown (Müller, Jenny & Meyer Reference Müller, Jenny and Meyer2013; Müller, Meyer & Jenny Reference Müller, Meyer and Jenny2014, Reference Müller, Meyer and Jenny2016; Viswanathan et al. Reference Viswanathan, Hyman, Karra, O'Malley, Srinivasan, Hagberg and Srinivasan2018), MC remains a very expensive approach. To avoid detailed fracture representations at all, homogenized and dual media descriptions have been proposed (Barenblatt, Zheltov & Kochina Reference Barenblatt, Zheltov and Kochina1960; Karimi-Fard, Gong & Durlofsky Reference Karimi-Fard, Gong and Durlofsky2006). There also exist hierarchical approaches with discrete representations of large fractures and homogenization of the small ones (Clemo & Smith Reference Clemo and Smith1997; Lee, Lough & Jensen Reference Lee, Lough and Jensen2001; Karvounis & Jenny Reference Karvounis and Jenny2016). Dual media descriptions treat the fluid in pores and fractures separately and model mass transfer with exchange terms. While very successful, they cannot properly describe phenomena below representative elementary volume (REV) scale, which easily can reach the same order as the problem size. However, particularly near boundaries and wells, it is important to account for sub-REV-scale effects. It is well known that the effective permeability of a block below REV scale with isolated fractures is a function of its size, and none of the existing homogenized models can predict such pre-asymptotic behaviour. For example Berre, Doster & Keilegavlen (Reference Berre, Doster and Keilegavlen2018) point out that ‘compared to the standard descriptions of a porous medium, fractures introduce intermediate length scales, but there may be no clear scale separation between the pore scale, fracture widths, fracture lengths and the macroscale of interest. Hence, the presence of fractures challenges the existence of a REV in porous-media modeling’. Note that numerical upscaling (Durlofsky Reference Durlofsky1991) can be regarded as a class of homogenization methods and faces similar issues. Recently, a non-local continuum flow model was introduced (Delgoshaie et al. Reference Delgoshaie, Meyer, Jenny and Tchelepi2015; Jenny & Meyer Reference Jenny and Meyer2017). The governing equation contains an integral term with a permeability kernel function, which has to be determined empirically. It was shown that in the limit of infinitely small kernel width this non-local model converges to the standard Darcy flow equation. By comparing with pore network results (Meyer & Gomolinski Reference Meyer and Gomolinski2019) could show that non-local boundary effects can accurately be captured by introducing a ‘geometric conductivity distribution’ which is similar to the boundary kernel in the present work. Chung et al. (Reference Chung, Efendiev, Leung, Vasilyeva and Wang2018) present a method with integral terms, but their objective is a different one, i.e. they describe a non-local upscaling framework in the context of multi-scale methods. In their case ‘non-local’ refers to employing oversampled regions to compute transfer functions. The aim is to get an accurate representation with a coarse resolution and not to compute the expected flow field as obtained from averaging over an infinite number of samples.
In this paper, a non-local multi-media description to capture mean flow and pressure at the sub-REV-scale is devised. This sub-REV model consists of coupled integral differential equations. The integral terms account for interaction of non-percolated fractures with the matrix and the boundaries, and kernel functions define the interaction range. Shape and support of these connectivity kernels depend on fracture size, orientation and aperture distribution. The devised model equations are very general, i.e. in principle they can describe mean flow in multi-dimensional reservoirs with percolated and isolated fractures of variable length and spatially varying fracture statistics. For the presented proof of concept studies, statistically one-dimensional flow, uniform fracture number density and a single fracture length are considered. It is shown how the model can be calibrated and it is remarkable that the only empirical information needed is the asymptotic flow rate. Comparisons with MC data show that the sub-REV model provides very accurate pressure and flow solutions for the whole range of domain sizes.
The paper is structured as follows. Section 2 introduces the sub-REV model equations for two media (isolated fractures and matrix). In § 3, to show that the model concept can account for more than two media, a third medium is added (percolated fractures). The numerical solution algorithms for MC and the model equations are presented in § 4, and results are shown and discussed in § 5. The paper closes with conclusions in § 6.
2. Governing equations
We consider incompressible fluid with constant viscosity in a homogeneous porous matrix with highly conductive, disconnected, embedded fractures. The goal is to derive equations, which describe expected flow and pressure in these two connected media, and which are also valid below REV length scales. For a single realization, Darcy's law together with mass conservation leads to the pressure (or flow) equation
 \begin{equation} \frac{\partial\phi}{\partial t} - \frac{\partial}{\partial x_i}\left(\frac{k}{\mu}\frac{\partial p}{\partial x_i}\right)=0, \end{equation}
where  $\phi$,
  $k$,
$k$,  $\mu$ and
  $p$ represent porosity, permeability, dynamic viscosity and pressure, respectively. The independent variables
  $x_i$ and
  $t$ denote spatial coordinates and time, and Einstein's summation convention is employed, wherever an index appears twice in a term. For the sake of generality, we introduce the dimensionless quantities
 \begin{equation} x^*=x\frac{1}{\lambda}{,}\quad t^*=t\frac{{\rm \Delta} p}{\mu}{,}\quad p^*=p\frac{1}{{\rm \Delta} p}\quad \textrm{and}\quad k^*=k\frac{1}{\lambda^2}, \end{equation}
where  $\lambda$ is a reference length scale and
  ${\rm \Delta} p$ a reference pressure difference. From now on, all expressions will be presented in terms of these dimensionless quantities, e.g. (2.1) is equivalent to
 \begin{equation} \frac{\partial\phi}{\partial t^*} - \frac{\partial}{\partial x^*_i}\left(k^*\frac{\partial p^*}{\partial x^*_i}\right)=0, \end{equation}
while the superscript  $*$ will be omitted for brevity. Mean pressure and porosity of a fracture are defined as
 \begin{equation} p_{f}(t) =\frac{1}{|\varOmega_{f}|}\int_{\varOmega_{f}}p(\boldsymbol{x}',t)\,\textrm{d}V(\boldsymbol{x}') \quad \textrm{and}\quad \phi_{f}(t) = \frac{1}{|\varOmega_{f}|}\int_{\varOmega_{f}}\phi(\boldsymbol{x}',t)\,\textrm{d}V(\boldsymbol{x}'), \end{equation}
respectively, where  $\varOmega _f$ is the fracture volume and
  $|\varOmega _f|$ its size (bold letters refer to vectors and letters with subscripts are components). From now on, for simplicity, we assume that
  $\phi$ is constant in time (incompressible media), i.e. the flow equation
 \begin{equation} \frac{\partial}{\partial x_i}\left(k\frac{\partial p}{\partial x_i}\right)=0, \end{equation}
is considered. By convention,  $p_f$ represents the average pressure of a fracture at its centre
  $\boldsymbol {x}_f$. Clearly, mass exchange between a fracture and the matrix is strongly influenced by the difference between
  $p_f$ and the matrix pressure in the vicinity. This justifies the approximation
 \begin{align} 0&=\int_{\varOmega}\hat{g}(\boldsymbol{x},\boldsymbol{x}')\left(\bar{p}_m(\boldsymbol{x}',t)- \bar{p}_f(\boldsymbol{x},t)\right)\textrm{d}V(\boldsymbol{x}')\nonumber\\ &\quad +\int_{\partial\varOmega}\hat{k}_f(\boldsymbol{x},\boldsymbol{x}') \frac{{p}_b(\boldsymbol{x}',t)-\bar{p}_f(\boldsymbol{x},t)}{|\boldsymbol{x}-\boldsymbol{x}'|}\, \textrm{d}A(\boldsymbol{x}') \end{align}
for the expected (average over many independent realizations) volume balance in those fractures with their centres at  $\boldsymbol {x}$; by convention, their expected pressure is represented by
 \begin{equation} \bar{p}_f(\boldsymbol{x},t)=\lim_{n\rightarrow\infty} \frac{\displaystyle \sum_{i=1}^n\delta(\boldsymbol{x}-\boldsymbol{x}_f^{(i)})p_f^{(i)}(t)}{\displaystyle \sum_{i=1}^n\delta(\boldsymbol{x}-\boldsymbol{x}_f^{(i)})}. \end{equation}
Note that  $n$ denotes the number of samples and the superscript
  $(i)$ a random realization. It is important to notice that
  $p_f$ is defined at one point (of one realization) and that
  $\bar {p}_f$ is a field quantity. More precisely,
  $\bar {p}_f(\boldsymbol {x})$ is the expectation of
  $p_f$, if a fracture has its centre at
  $\boldsymbol {x}$. Computational domain and its surface are denoted as
  $\varOmega$ and
  $\partial \varOmega$, respectively, and
  $\textrm {d}A$ is an infinitesimal surface element. The spatial integrals are crucial in order to honour that not only the local matrix pressure
  $\bar {p}_m(\boldsymbol {x},t)$ affects flow into and out of these fractures. More concretely, the first right-hand-side term accounts for non-local fluid exchange between fractures and matrix and the last term for direct connections between fractures and the domain boundary;
  $p_b$ denotes boundary pressure values. Note that
  $\hat {g}(\boldsymbol {x},\boldsymbol {x}')$ and
  $\hat {k}_f(\boldsymbol {x},\boldsymbol {x}')$ are kernel functions, which depend on fracture size, orientation and aperture distribution and have to be determined. Volume balance in the matrix is consistently described as
 \begin{align} 0&=\int_{\varOmega}\hat{g}(\boldsymbol{x}',\boldsymbol{x})\left(\bar{p}_f(\boldsymbol{x}',t)- \bar{p}_m(\boldsymbol{x},t)\right)\textrm{d}V(\boldsymbol{x}')\nonumber\\ &\quad +\int_{\varOmega_b}\hat{g}(\boldsymbol{x}',\boldsymbol{x})\left(p_b(\boldsymbol{x}',t)- \bar{p}_m(\boldsymbol{x},t)\right)\textrm{d}V(\boldsymbol{x}')\nonumber\\ &\quad +\frac{\partial}{\partial x_i}\left(\bar{k}_m \frac{\partial\bar{p}_m(\boldsymbol{x},t)}{\partial x_i}\right), \end{align}
where  $\bar {k}_m$ is the effective matrix permeability. The first two right-hand-side terms describe non-local fluid exchange with the embedded fractures. Purpose of the second right-hand-side term is to also account for fractures, which intersect with the computational domain, but whose centres lie in the ghost boundary domain
  $\varOmega _b$ outside of
  $\varOmega$; see figure 1. Note that
  $p_b(\boldsymbol {x},t)$ has to be specified as part of the boundary conditions. The last term in (2.8) accounts for Darcy flow. For simplicity, but without loss of generality, we now focus on one-dimensional problems, which can be described by the system
 \begin{align} 0&=\int_{x_l}^{x_r}\hat{g}(x,x')\left(\bar{p}_m(x',t)-\bar{p}_f(x,t)\right)\textrm{d}x' \nonumber\\ &\quad +\sum_{x'\in\{x_l,x_r\}}\hat{k}_f(x,x')\frac{{p}_b(x',t)-\bar{p}_f(x,t)}{|x-x'|} \end{align}
and
 \begin{align} 0&=\int_{x_l}^{x_r}\hat{g}(x',x)\left(\bar{p}_f(x',t)-\bar{p}_m(x,t)\right)\textrm{d}x'\nonumber\\ &\quad +\int_{-\infty}^{x_l}\hat{g}(x',x)\left({p}_b(x_l,t)-\bar{p}_m(x,t)\right)\textrm{d}x' \nonumber\\ &\quad +\int_{x_r}^{\infty}\hat{g}(x',x)\left({p}_b(x_r,t)-\bar{p}_m(x,t)\right)\textrm{d}x' \nonumber\\ &\quad +\frac{\partial}{\partial x}\left(\bar{k}_m\frac{\partial\bar{p}_m(x,t)}{\partial x}\right). \end{align}
\
Note that, in principle,  $\hat {g}(x,x')$ can be spatially dependent, but it is not in the cases presented and discussed in this paper. The first right-hand-side term of (2.10) accounts for fluid exchange between matrix and those fractures with their centres within the domain. The second and third right-hand-side terms account for exchange between matrix and all other fractures which intersect with the domain, but whose centres lie outside (corresponding to the second right-hand-side term in (2.8)). Note that these boundary terms do not appear in the fracture fluid balance equations (2.6) and (2.9), since only fractures with their centres inside the domain are considered there. On the other hand, the second terms in (2.6) and (2.9) account for direct connections of fracture centres with the boundary (in the case of fractures intersecting with the boundary), which are inversely proportional to the distance
  $|\boldsymbol {x}-\boldsymbol {x}'|$. The sketch in figure 2 illustrates statistically homogeneous rock samples with embedded fractures, in which mean flow from left to right is considered. Note that in the thin slice some fractures connect with both the left and right boundaries, which is not the case for the thick slice. This effect is accounted for in a statistical sense by the last term in (2.9). Integrating over the whole domain
  $\varOmega =[x_l,x_r]$ leads to
 \begin{equation} 0=u'(x_l) - u'(x_r) \end{equation}
with
 \begin{align} u'(x_l)&={-}\left.\bar{k}_m\frac{\partial\bar{p}_m(x,t)}{\partial x}\right|_{x_l} \nonumber\\ &\quad +\int_{x_l}^{x_r}\left(\int_{-\infty}^{x_l}\hat{g}(x',x)(p_b(x_l,t)-\bar{p}_m(x,t))\,\textrm{d}x' + \hat{k}_f(x,x_l)\frac{{p}_b(x_l,t)-\bar{p}_f(x,t)}{x-x_l}\right)\textrm{d}x \end{align}
and
 \begin{align} u'(x_r)&=\left. -
\bar{k}_m\frac{\partial\bar{p}_m(x,t)}{\partial
x}\right|_{x_r} \nonumber\\ &\quad
+\int_{x_l}^{x_r} \! \left(\!\int_{x_r}^{\infty}\hat{g}(x',x)(\bar{p}_m(x,t)-p_b(x_r,t))\,\textrm{d}x'
+
\hat{k}_f(x,x_r)\frac{\bar{p}_f(x,t)-{p}_b(x_r,t)}{x_r-x}\right)\textrm{d}x.
\end{align}
\begin{align} u'(x_r)&=\left. -
\bar{k}_m\frac{\partial\bar{p}_m(x,t)}{\partial
x}\right|_{x_r} \nonumber\\ &\quad
+\int_{x_l}^{x_r} \! \left(\!\int_{x_r}^{\infty}\hat{g}(x',x)(\bar{p}_m(x,t)-p_b(x_r,t))\,\textrm{d}x'
+
\hat{k}_f(x,x_r)\frac{\bar{p}_f(x,t)-{p}_b(x_r,t)}{x_r-x}\right)\textrm{d}x.
\end{align}Note that the total contributions of the first right-hand-side terms in (2.9) and (2.10) cancel out and that the expected volumetric flows per unit area across the left and right boundaries, i.e.
 \begin{equation} \mathbb{E}[u](x_l)=u'(x_l)+ \frac{{p}_b(x_l,t)-p_b(x_r,t)}{x_r-x_l}\left( \int_{-\infty}^{x_l}\hat{k}_f(x,x_r)\,\textrm{d}x + \int_{x_r}^{\infty}\hat{k}_f(x,x_l)\,\textrm{d}x \right) \end{equation}
and
 \begin{equation} \mathbb{E}[u](x_r)=u'(x_r)+ \frac{{p}_b(x_l,t)-p_b(x_r,t)}{x_r-x_l}\left( \int_{-\infty}^{x_l}\hat{k}_f(x,x_r)\,\textrm{d}x + \int_{x_r}^{\infty}\hat{k}_f(x,x_l)\,\textrm{d}x \right), \end{equation}
have to match. The operator  $\mathbb {E}[\cdot ]$ denotes expectation and
  $u$ is the volumetric flow per unit area. The last terms in (2.14) and (2.15) account for the flows through fractures which intersect with both boundaries, but whose centres lie outside of
  $\varOmega$. Note that the second right-hand-side terms of (2.14) and (2.15) quantify the flow through the fractures which are directly connected to both left and right boundaries. Obviously, they account for a large part of the increased overall flow rate in the case of short domains.

Figure 1. Sketch of a porous domain  $\varOmega$ (light grey) with isolated embedded fractures. The fuzzy dots indicate the fracture centres. The ghost boundary domain
  $\varOmega _b$ is shown in dark grey.

Figure 2. Illustration of statistically homogeneous rock samples with embedded fractures. The fuzzy dots mark the fracture centres.
3. Multiple media
So far, only cases with isolated embedded fractures have been discussed, but the model can easily be extended for more than two media, e.g. for a porous matrix with embedded isolated fractures and an embedded connected fracture network (percolated fractures). Note that, opposed to average flow through porous media with isolated fractures, average flow sampled from connected fracture networks can be described by a Darcy formulation with extra terms accounting for local exchange with the matrix. Similar as for dual media, one obtains averaged volume balance equations for the isolated fractures, the matrix and the fracture network; they read \begin{aligngroup}
 \begin{align}
0&=\int_{\varOmega}\hat{g}(\boldsymbol{x},\boldsymbol{x}')\left(\bar{p}_m(\boldsymbol{x}',t)-\bar{p}_f(\boldsymbol{x},t)\right)
\textrm{d}V(\boldsymbol{x}') \nonumber\\ &\quad
+\int_{\partial\varOmega}\hat{k}_f(\boldsymbol{x},\boldsymbol{x}')\frac{{p}_b(\boldsymbol{x}',t)-\bar{p}_f(\boldsymbol{x},t)}{|\boldsymbol{x}-\boldsymbol{x}'|}\,\textrm{d}A(\boldsymbol{x}'),\end{align}
\begin{align}
0&=\int_{\varOmega}\hat{g}(\boldsymbol{x},\boldsymbol{x}')\left(\bar{p}_m(\boldsymbol{x}',t)-\bar{p}_f(\boldsymbol{x},t)\right)
\textrm{d}V(\boldsymbol{x}') \nonumber\\ &\quad
+\int_{\partial\varOmega}\hat{k}_f(\boldsymbol{x},\boldsymbol{x}')\frac{{p}_b(\boldsymbol{x}',t)-\bar{p}_f(\boldsymbol{x},t)}{|\boldsymbol{x}-\boldsymbol{x}'|}\,\textrm{d}A(\boldsymbol{x}'),\end{align} \begin{align}
0&=\int_{\varOmega}\hat{g}(\boldsymbol{x}',\boldsymbol{x})\left(\bar{p}_f(\boldsymbol{x}',t)-\bar{p}_m(\boldsymbol{x},t)\right)\textrm{d}V(\boldsymbol{x}')\nonumber\\
&\quad + \int_{\varOmega_b}\hat{g}(\boldsymbol{x}',\boldsymbol{x})\left(p_b(\boldsymbol{x}',t)-\bar{p}_m(\boldsymbol{x},t)\right)
\textrm{d}V(\boldsymbol{x}')\nonumber\\
&\quad +\frac{\partial}{\partial x_i}\left(\bar{k}_m\frac{\partial\bar{p}_m(\boldsymbol{x},t)}{\partial x_i}\right) +\hat{c}(\boldsymbol{x})\left(\bar{p}_n(\boldsymbol{x},t)-\bar{p}_m(\boldsymbol{x},t)\right) , \end{align}
\begin{align}
0&=\int_{\varOmega}\hat{g}(\boldsymbol{x}',\boldsymbol{x})\left(\bar{p}_f(\boldsymbol{x}',t)-\bar{p}_m(\boldsymbol{x},t)\right)\textrm{d}V(\boldsymbol{x}')\nonumber\\
&\quad + \int_{\varOmega_b}\hat{g}(\boldsymbol{x}',\boldsymbol{x})\left(p_b(\boldsymbol{x}',t)-\bar{p}_m(\boldsymbol{x},t)\right)
\textrm{d}V(\boldsymbol{x}')\nonumber\\
&\quad +\frac{\partial}{\partial x_i}\left(\bar{k}_m\frac{\partial\bar{p}_m(\boldsymbol{x},t)}{\partial x_i}\right) +\hat{c}(\boldsymbol{x})\left(\bar{p}_n(\boldsymbol{x},t)-\bar{p}_m(\boldsymbol{x},t)\right) , \end{align}and
 \begin{equation} 0= \frac{\partial}{\partial x_i}\left(\bar{k}_n\frac{\partial\bar{p}_n(\boldsymbol{x},t)}{\partial x_i}\right) + \hat{c}(\boldsymbol{x})\left(\bar{p}_m(\boldsymbol{x},t)-\bar{p}_n(\boldsymbol{x},t)\right), \end{equation}
respectively. Note that  $\bar {p}_n$ is the expected pressure inside the connected fracture network,
  $\bar {k}_n$ the effective mean permeability and
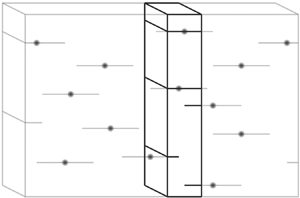
  $\hat {c}$ is a coefficient to quantify the exchange rate between matrix and fracture network. An illustration of such a medium is shown in figure 3. Note that it is straightforward to generalize the model for an arbitrary number of media, e.g. with networks of different scales, which are only weakly connected with each other and the matrix.

Figure 3. Sketch of a porous domain with isolated fractures and an embedded fracture network.
4. Numerical schemes and solution algorithms
In this section, for completeness, the numerical solution algorithms to solve the one-dimensional model equations and the two-dimensional flow equation (2.5) are outlined. In both cases finite-volume methods were employed, and the latter was used for Monte Carlo studies of fully resolved flow with random fractures, which then served to calibrate and test the model. Note that statistically one-dimensional, incompressible flow through rigid porous media with embedded isolated fractures is considered. It is important to mention that no claims are made regarding numerical accuracy or efficiency of the schemes presented in this section; they simply serve the purpose of this paper, i.e. to demonstrate how the model can be calibrated and how it performs.
4.1. Model equations
To solve the model equations (2.9) and (2.10), the domain  $\varOmega =[0,H_x]$ is discretized by an equidistant grid with
  $N$ cells of size
  $h_x=H_x/N$. A finite-volume method was employed where for each cell
  $\varOmega _I=[(I-1)h_x,Ih_x]$ (
 $I\in \{1,\ldots ,N\}$) the conditions
 \begin{equation} A_{f_I}P_{f_I}=\sum_{J=1}^{N}\left\{G_{m_{IJ}}P_{m_J}\right\} +B_{l_I}P_l+B_{r_I}P_r \end{equation}
and
 \begin{equation} A_{m_I}P_{m_I} =\sum_{J=1}^{N}\left\{G_{m_{JI}}P_{f_J}\right\} +C_{l_I}P_l +C_{r_I}P_r + K_m\left(P_{m_{I+1}}+P_{m_{I-1}}\right) \end{equation}
with
 \begin{gather} K_m=\frac{\bar{k}_m}{h_x^2}, \end{gather}
 \begin{gather}B_{l_I}=\frac{\hat{k}_f(x_I,x_l)}{x_I-x_l}, \end{gather}
 \begin{gather}B_{r_I}=\frac{\hat{k}_f(x_I,x_r)}{x_r-x_I}, \end{gather}
 \begin{gather}C_{l_I}=\int_{-\infty}^{x_l}{\hat{g}(x,x_I)}\,\textrm{d}x, \end{gather}
 \begin{gather}C_{r_I}=\int_{x_r}^{\infty}{\hat{g}(x,x_I)}\,\textrm{d}x, \end{gather}
 \begin{gather}G_{m_{IJ}}={\hat{g}(x_I,x_J)}h_x, \end{gather}
 \begin{gather}A_{f_I}=\sum_{J=1}^{N}\{G_{m_{IJ}}\} + B_{l_I} + B_{r_I}, \end{gather}
 \begin{gather}A_{m_I}=\sum_{J=1}^{N}\{G_{m_{JI}}\} + C_{l_I} + C_{r_I} + 2K_m, \end{gather}
 \begin{gather}P_{m_{0}}=P_l\quad \textrm{and}\quad P_{m_{N+1}} = P_r \end{gather}
are enforced. The Gauss Seidel algorithm is used as a linear solver, i.e. one obtains the solution from the iteration equations
 \begin{equation} P^{\nu+1}_{f_I} =\frac{1}{A_{f_I}}\left( \sum_{J=1}^{I-1}\left\{ G_{m_{IJ}}P_{m_J}^{\nu+1} \right\} + \sum_{J=I}^{N}\left\{ G_{m_{IJ}}P_{m_J}^\nu \right\} + B_{l_I}P_l + B_{r_I}P_r\right) \end{equation}
and
 \begin{align} P^{\nu+1}_{m_I}&=\frac{1}{A_{m_I}}\left( \sum_{J=1}^{I}\left\{G_{m_{JI}}P_{f_J}^{\nu+1} \right\} + \sum_{J=I+1}^{N}\left\{ G_{m_{JI}}P_{f_J}^\nu \right\} + C_{l_I}P_l + C_{r_I}P_r \right.\nonumber\\ &\quad \left.\vphantom{\sum_{J=1}^{I}}+K_m\left(P_{m_{I-1}}^{\nu+1}+P_{m_{I+1}}^{\nu}\right)\right), \end{align}
where  $P_l=p_b(0)$ and
  $P_r=p_b(H_x)$ are left and right boundary pressures. During each iteration
  $\nu +1$ the new pressure values
  $P_{m_I}^{\nu +1}$ and
  $P_{f_I}^{\nu +1}$ are computed in each cell in the order of the index
  $I$, and eventually, for
  $\nu \rightarrow \infty$, the solutions converge.
4.2. Darcy and continuity equations
To solve (2.5), the two-dimensional domain  $\varOmega =[0,H_x]\times [0,H_y]$ is discretized by an equidistant, Cartesian grid with
  $N\times M$ cells
  $\varOmega _{I,J}=[(I-1)h_x,Ih_x]\times [(J-1)h_y,Jh_y]$, where
  $h_x=H_x/N$ and
  $h_y=H_y/M$. A finite-volume method is applied, which leads to the constraints
 \begin{equation} A_{I,J}P_{I,J}=A_{I-1,J}P_{I-1,J}+A_{I+1,J}P_{I+1,J}+A_{I,J-1}P_{I,J-1}+A_{I,J+1}P_{I,J+1}. \end{equation}
For the coefficients, harmonic averaging of the adjacent cell permeability values is employed, i.e. they read
 \begin{gather} A_{I-1,J}=\frac{2 K_{I,J}K_{I-1,J}}{K_{I,J}+K_{I-1,J}} \frac{1}{h_x^2}, \end{gather}
 \begin{gather}A_{I+1,J}=\frac{2 K_{I,J}K_{I+1,J}}{K_{I,J}+K_{I+1,J}} \frac{1}{h_x^2}, \end{gather}
 \begin{gather}A_{I,J-1}=\frac{2 K_{I,J}K_{I,J-1}}{K_{I,J}+K_{I,J-1}} \frac{1}{h_y^2}, \end{gather}
 \begin{gather}A_{I,J+1}=\frac{2 K_{I,J}K_{I,J+1}}{K_{I,J}+K_{I,J+1}} \frac{1}{h_y^2} \end{gather}
and
 \begin{equation} A_{I,J}=A_{I-1,J}+A_{I+1,J}+A_{I,J-1}+A_{I,J+1}. \end{equation}
Note that for all Monte Carlo studies presented in this paper fractures are represented as horizontal pixel lines with numerical permeabilities of  $k^{numerical}_f=k_fa_f/h_y$, where
  $k_f$ and
  $a_f$ are fracture permeability and aperture, respectively. Periodic boundary conditions are applied in the direction of the second index (in the
  $y$-direction), i.e.
 \begin{equation} (P_{I,0},P_{I,M+1})=(P_{I,M},P_{I,1}) \end{equation}
and
 \begin{equation} (K_{I,0},K_{I,M+1})=(K_{I,M},K_{I,1}). \end{equation}
In the direction of the first index ( $x$-direction), either Dirichlet boundary conditions are applied, i.e.
 \begin{equation} (P_{0,J},P_{N+1,J})=(2P_l-P_{1,J},2P_r-P_{N,J}) \end{equation}
and
 \begin{equation} (K_{0,J},K_{N+1,J})=(K_{1,J},K_{N,J}), \end{equation}
or periodic boundary conditions with an imposed mean pressure gradient of  $-H_x^{-1}$, i.e.
 \begin{equation} (P_{0,J},P_{N+1,J})=(P_{N,J} + 1,P_{1,J} - 1) \end{equation}
and
 \begin{equation} (K_{0,J},K_{N+1,J})=(K_{N,J},K_{1,J}). \end{equation}
As for the model equations, the Gauss Seidel algorithm is used as a linear solver, i.e. the iteration equation
 \begin{equation} P^{\nu+1}_{I,J} =\frac{1}{A_{I,J}}\left( A_{I-1,J}P^{\nu+1}_{I-1,J}+A_{I+1,J}P^\nu_{I+1,J}+A_{I,J-1}P^{\nu+1}_{I,J-1}+A_{I,J+1}P^\nu_{I,J+1} \right) \end{equation}
is applied for all cells (of the order  $I=1\rightarrow N$ and
  $J=1\rightarrow M$), until all pressure values
  $P_{I,J}^{\nu +1}$ converge.
5. Numerical experiments
First in this section, it is shown how the model coefficients, namely  $\bar {k}_m$ and the kernel functions
  $\hat {k}_f$ and
  $\hat {g}$, are obtained. It is remarkable that the only empirical data needed for tuning are the asymptotic effective permeabilities, which here were obtained from Monte Carlo simulations. Then the calibrated model is applied to predict average pressure profiles and flow rates through fractured rock samples of variable size. Comparisons show that the model solutions are in very close agreement with the corresponding Monte Carlo data, which are composed of many solutions of (2.5) with independent realizations of the permeability field
  $k(\boldsymbol {x})$.
5.1. Test case
Statistically homogeneous fractured rock samples are considered, whereas all quantities are assumed to be constant in the  $z$-direction. Thus, for all the following Monte Carlo studies, the two-dimensional (2-D) domain
  $\varOmega =[0,H_x]\times [0,H_y]$ is used in place of the 3-D domain
  $\varOmega ^\textrm {3D}=[0,H_x]\times [0,H_y]\times [0,H_z=1]$. Further, all fractures are isolated, aligned with the mean flow (in the
  $x$-direction) and have the same length
  $l_f=0.25$. Stochasticity enters through the random fracture centre locations, i.e. for each Monte Carlo realization they were sampled from a uniform distribution with the specified density within a domain much larger than the one used for the computations. Fracture and matrix permeability are
  $k_f=2/a_f$ and
  $k_m=1$, respectively, where
  $a_f$ is the fracture aperture. The latter is assumed to be smaller than the grid resolution. Note that this implies that a single fracture is equally conductive as a pure matrix domain with
  $H_y=2$. Further, the mean fracture number density
  $\rho _f$ in the
  $x$–
$x$– $y$-plane is
  $50$. An illustration of the test case is shown in figure 2. The fracture centres are marked with fuzzy dots, and from the right figure, it becomes apparent that also some fractures with their centres outside of the domain have to be taken into account. To generate independent samples,
  $10(H_x+l_f)H_y\rho _f$ fracture centres
  $\boldsymbol {x}_f$ are randomly placed (uniform distribution) in the sampling domain
  $\varOmega ^{sample}=[-H_x-l_f/2,H_x+l_f/2]\times [0,10H_y]$. Note that
  $\varOmega ^{sample}$ is much larger than
  $\varOmega$, which is to properly account for fluctuations of the local fracture density. If periodic boundary conditions are applied in the
  $x$-direction, all fractures with
  $\boldsymbol {x}_f\notin \varOmega$ are rejected, and for each accepted fracture a pixel line of length
  $l_f/h_x$ with permeability
  $k^{numerical}_f=k_fa_f/h_y$ is created, whereas periodicity is assumed for all pixels outside of
  $\varOmega$. If Dirichlet boundary conditions are applied, the accepted fractures are those with
  $\boldsymbol {x}_f\in [-l_f/2,H_x+l_f/2]\times [0,H_y]$; see figure 4. Regarding resolution and domain size, it was found that
  $h_x=h_y=0.01$ and
  $H_y=0.5$ are sufficient. Further, converged average flow rates with periodic boundary conditions (in the
  $x$-direction with a unit pressure drop) were achieved with
  $H_x=1.5$; convergence studies were performed for lengths up to
  $H_x=2.5$ and widths up to
  $H_y=1$. The applied grid resolution also ensures that the fractures of length
  $l_f=0.25$ can exactly be represented by lines of
  $25$ cells. Pressure surface plots of two realizations with
  $H_x=1.5$ and
  $H_y=0.5$ with periodic (plus imposed pressure drop of
  ${\rm \Delta} p=p(0,y)-p(H_x,y)=1$) and Dirichlet boundary conditions in the
  $x$-direction are shown in figures 5(a) and 5(b), respectively.

Figure 4. Sketch of a slice. All fractures with centres in  $[-l_f/2,H_x+l_f/2]\times [0,H_y]$ intersect with either the left or right boundary.

Figure 5. Pressure surface plots of two realizations with ( $a$) periodic and (
 $b$) Dirichlet boundary conditions in the
  $x$-direction (with an imposed pressure drop of
  ${\rm \Delta} p=1$). In both cases periodic boundary conditions were applied in the
  $y$-direction.
To solve the 1-D model equations (2.9) and (2.10), the same grid resolution in the  $x$-direction was used. Next, it is explained how the model coefficients are obtained.
5.2. Model calibration
The proposed model relies on two kernel functions  $\hat {g}(x,x')$ and
  $\hat {k}_f(x,x')$, which reflect the size, orientation and aperture distribution of the fractures, and on the effective matrix permeability
  $\bar {k}_m(x)$. Here, for cases with constant fracture length
  $l_f$, the simple ansatz
 \begin{equation} \frac{\hat{g}(x,x')}{\bar{g}} = \frac{\hat{k}_f(x,x')}{\bar{k}_f}= \begin{cases} 1, & \textrm{if }|x-x'| < l_f/2\\ 0, & \textrm{else} \end{cases} \end{equation}
is used for the kernel functions; see figure 6. This leaves us with three model constants, i.e.  $\bar {k}_m$,
  $\bar {k}_f$ and
  $\bar {g}$ have to be determined in order to close the model equations (2.9) and (2.10).

Figure 6. Normalized kernel functions  $\hat {g}(x_f,x)/\bar {g}=\hat {k}_f(x_f,x)/\bar {k}_f$.
5.2.1. Effective matrix permeability
The effective matrix permeability  $\bar {k}_m$ can be derived from the expression
 \begin{align} \mathbb{E}[u_m](x)&={-}\frac{k_m}{H_y}\mathbb{E}\left[\int_0^{H_y}\left((k(x,y)=k_m)\frac{\partial p}{\partial x}\right)\textrm{d}y\right]\nonumber\\ &={-}(1-\rho_f l_f a_f)k_m\frac{\partial\bar{p}_m}{\partial x} \end{align}
for the mean flow per unit area through the matrix at any location  $x$. From (2.10) it becomes apparent that this flow has to match that predicted by the model, i.e.
 \begin{equation} \mathbb{E}[u_m](x)={-}\bar{k}_m\frac{\partial\bar{p}_m}{\partial x}, \end{equation}
and one obtains
 \begin{equation} \bar{k}_m=(1-\rho_f l_f a_f) k_m \end{equation}
for the effective matrix permeability. Note that the effective matrix permeability  $\bar {k}_m$ is smaller than
  $k_m$, since some of the volume is occupied by fractures (here each fracture has a volume of
  $l_fa_f$). For the following studies it was assumed that
  $a_f$ is extremely small such that
  $\rho _f l_f a_f\ll 1$, and thus
  $\bar {k}_m$ was set to
  $k_m$.
5.2.2. Effective fracture conductivity
To find the effective fracture conductivity  $\bar {k}_f$, flow through fractures in a very thin slice of thickness
  $H_x\ll l_f$ is considered; see figure 7. The average number of fractures connecting both the left and right boundaries is
  $\rho _f(l_f-H_x)H_y$, and therefore one can write
 \begin{equation} \mathbb{E}[u_f]\approx(l_f-H_x) \rho_fa_fk_f \frac{p_b(0)-p_b(H_x)}{H_x} \end{equation}
for the expected volumetric flow per unit area through the fractures. The model, on the other hand, predicts
 \begin{align} \mathbb{E}[u_f]&\approx\frac{p_b(0)-p_b(H_x)}{H_x}\left(\int_{H_x-l_f/2}^0\hat{k}_f(x,H_x)\, \textrm{d}x + \int_{0}^{l_f/2}\hat{k}_f(x,0)\,\textrm{d}x \right)\nonumber\\ &=(l_f-H_x)\bar{k}_f \frac{p_b(0)-p_b(H_x)}{H_x}, \end{align}
where the boundary conditions  $p_b(x)=p_b(0)$ and
  $p_b(x)=p_b(H_x)$ were applied for all
  $x\le 0$ and
  $x\ge H_x$, respectively. Finally, one obtains the simple relation
 \begin{equation} \bar{k}_f=\rho_fa_fk_f.\end{equation}
Figure 7. Sketch of a very thin slice. All fractures with their centres in  $[H_x-l_f/2,l_f/2]\times [0,H_y]$ intersect with both the left and right boundaries.
5.2.3. Effective exchange coefficient
The effective exchange coefficient  $\bar {g}$ can be determined based on the mean flow per unit area through the fractures in an infinitely large sample, which according to the model reads
 \begin{align} \mathbb{E}[u_f^\infty]&= \int_{-\infty}^0\int_0^\infty\hat{g}(x,x')\left(\bar{p}_f(x)-\bar{p}_m(x')\right) \textrm{d}x'\,\textrm{d}x\nonumber\\ &\quad +\int_{0}^\infty\int_{-\infty}^0\hat{g}(x,x')\left(\bar{p}_m(x')-\bar{p}_f(x)\right) \textrm{d}x'\,\textrm{d}x. \end{align}
Note that due to the absence of Dirichlet boundaries the term with  $\hat {k}_f$ is zero. With the ansatz (5.1) for the kernel function (depicted in figure 6) this expression simplifies to
 \begin{equation} \mathbb{E}[u_f^\infty]= 2\bar{g}\int_{{-}l_f/2}^0\int_0^{x+l_f/2}\left(\bar{p}_f(x)-\bar{p}_m(x')\right) \textrm{d}x'\,\textrm{d}x \end{equation}
and with  $\partial \bar {p}_m/\partial x=\nabla _x^\infty p$ one obtains
 \begin{align} \mathbb{E}[u_f^\infty]&={-}2\bar{g}\nabla_x^\infty p \int_{{-}l_f/2}^0\int_0^{x+l_f/2}\left(x'-x\right)\textrm{d}x'\,\textrm{d}x\nonumber\\ &={-}\bar{g}\frac{l_f^3\nabla_x^\infty p}{12}. \end{align}
Thus, the effective exchange coefficient can be calculated as
 \begin{equation} \bar{g}=\frac{12}{l_f^3}\frac{|\mathbb{E}[u_f^\infty]|}{|\nabla_x^\infty p|} .\end{equation}
To obtain  $\mathbb {E}[u_f^\infty ]$, a Monte Carlo study with periodic boundary conditions plus imposed mean pressure gradient of
  $\nabla _x^\infty p=-H_x^{-1}$ in the
  $x$-direction was performed. Domain size and grid resolution were chosen as described in § 5.1, i.e.
  $H_x=1.5$,
  $H_y=0.5$ and
  $h_x=h_y=0.01$. Numerical results of 1000 independent realizations were sampled, which resulted in
  $|\mathbb {E}[u_f^\infty ]|/|\nabla _x^\infty p|\approx 4.285$ with a statistical standard error of
  $0.1\,\%$.
As a result, the model coefficients used for the following comparative validation study are  $\bar {k}_m=1$,
  $\bar {k}_f=100$ and
  $\bar {g}=3290.88$.
5.3. Model validation
In order to obtain reference data for the model validation, Monte Carlo studies with Dirichlet boundary conditions at  $x=0$ and
  $x=H_x$, that is, with
  $p_b(0,y)=1$ and
  $p_b(H_x,y)=0$, and periodic boundary conditions in the
  $y$-direction were performed. Note that for the individual realizations of the Monte Carlo studies the permeability in the cells along the horizontal pixel lines representing fractures was set to
  $k_f^{numerical}=k_fa_f/h_y=200$ and in the cells representing the porous matrix it was
  $k_m^{numerical}=1$. However, the way the homogenized equations were derived is independent of the ratio
  $k_f^{numerical}/k_m^{numerical}$ and the model is not limited to high contrast or low contrast cases. Pressure solutions were computed for 5000 independent permeability fields, where each realization was generated as described in § 5.1. In all cases the agreement between model solutions and Monte Carlo is excellent. Note that the sharp steps in
  $\bar {p}_f$ at a distance of
  $l_f/2$ from the boundaries are characteristic for cases with a single fracture length, since all fractures within that distance are directly connected to the boundaries, while for all others the boundary pressure signal first has to bass through the matrix. Figure 8 shows profiles of expected matrix pressure
  $\bar {p}_m(x)$ (a,c,e) and expected fracture pressure
  $\bar {p}_f(x)$ (b,d,f) for domains with
  $H_x\in \{0.3,0.6,0.9\}$; symbols refer to Monte Carlo data and the solid lines to model solutions; the dotted lines will be addressed later. Note that
  $\bar {p}_f(x)$ refers to the expected pressure of fractures with their centres at location
  $x$. Figure 9(a) shows the normalized flows
  $\mathbb {E}[u](H_x)H_x$ obtained from Monte Carlo and the non-local model as functions of the slice thickness
  $H_x$. As expected, the effective conductance decreases with larger
  $H_x$; a similar behaviour was observed at a smaller scale for pore networks (Meyer & Gomolinski Reference Meyer and Gomolinski2019). Note, however, that they do not distinguish between different media, but applied the same framework as Delgoshaie et al. (Reference Delgoshaie, Meyer, Jenny and Tchelepi2015) and demonstrate how the parameters can be extracted from pore network data. For each
  $H_x\in \{0.1,0.2,0.3,0.4,0.5,0.6,0.7,0.8,0.9,1.0,1.5\}$, 1000 independent solutions were sampled; the statistical standard error of the normalized flows obtained from Monte Carlo is shown in figure 10. It can be observed that for very small and large
  $H_x$-values the model predictions compare very well with the Monte Carlo data. The discrepancies for
  $H_x\approx l_f$ can be attributed to the use of a constant
  $\bar {g}$, the ansatz with piecewise constant kernel functions and of course the intrinsic simplifications made for the model derivation. Next, the effect of the former is investigated. It is argued that fluid exchange between fractures and matrix near the Dirichlet boundaries is underestimated (in comparison to the domain centre), which suggests using higher
  $\bar {g}$ values in the vicinity of such domain boundaries. Similar non-local effects were observed in pore network studies Meyer & Gomolinski (Reference Meyer and Gomolinski2019). The approach followed here to correct boundary effects not accounted for by the second right-hand-side term in (2.8) is inspired by elliptic relaxation models used to describe turbulent flows. There, the goal is a similar one, i.e. to distinguish between the flow dynamics near walls and in free shear flow regions; mainly due to wall blocking effects. Elliptic relaxation models can account for such non-local wall effects in a very elegant way. In the case considered here, the constant
  $\bar {g}$ value is replaced by
  $\tilde {g}(x)$, which is the solution of the elliptic differential equation
 \begin{equation} \left(1-\left(\frac{l_f}{2}\right)^2\frac{\partial^2}{\partial x\partial x}\right)\tilde{g}=\bar{g}, \end{equation}
with the Dirichlet boundary condition  $\tilde {g}(0)=\tilde {g}(H_x)=\tilde {g}^{boundary}$. In the statistically one-dimensional case, its analytic solution is
 \begin{equation} \tilde{g}(x)= \bar{g} + \frac {(\tilde{g}^{boundary}-\bar{g})\left({\exp}({2x/l_f})+\exp({2(H_x-x)/l_f})\right)} {1+\exp({2H_x/l_f})}, \end{equation}
but in general, e.g. for most 2-D and 3-D problems, (5.12) has to be solved numerically. Note that (5.12) ensures that  $\tilde {g}(x)$ relaxes towards
  $\bar {g}$ away from the boundaries, whereas the spatial correlation length scale is of the order of
  $l_f/2$, which seems to be an obvious choice. The elliptic equation (5.12) also reflects the elliptic nature of the flow problem (see (2.5)). For the cases investigated so far, it was empirically found that the best match with Monte Carlo data is obtained with
  $\tilde {g}^{boundary}=1.25\bar {g}$. Figure 9(b) shows the obtained normalized flow rates as a function of
  $H_x$, and it can be observed that the match with the Monte Carlo reference data is excellent. One can also see that the corresponding pressure profiles shown in figure 8 (dashed lines) are in slightly better agreement with the Monte Carlo reference than those obtained without elliptic relaxation. Note, however, that elliptic relaxation only leads to a noticeable improvement if
  $H_x\approx l_f$; otherwise, the agreement is already very good without elliptic relaxation.

Figure 8. (a,c,e) Profiles of expected matrix pressure  $\bar {p}_m(x)$; (b,d,f) expected fracture pressure
  $\bar {p}_f(x)$ (representing the pressures of fractures with their centres at location
  $x$) for
  $H_x\in \{0.3,0.6,0.6\}$. Lines represent model predictions and symbols Monte Carlo data.

Figure 9. Normalized flow  $\mathbb {E}[u]H_x$ computed with the non-local model for different domain sizes in comparison with the Monte Carlo data. Left without and right with elliptic relaxation of
  $\tilde {g}(x)$.

Figure 10. Statistical standard error of the normalized flow  $\mathbb {E}[u]H_x$ obtained from Monte Carlo with 1000 realizations for each
  $H_x$-value.
Regarding the cost of solving the homogenized equations, one has to distinguish between preprocessing and the actual simulations; the former is necessary to obtain closed expressions for  $\hat {g}$,
  $\hat {k}_f$ and
  $\bar {k}_m$, and the latter to obtain
  $\bar {p}_m$ and
  $\bar {p}_f$. Compared to Monte Carlo solving the homogenized integral equations with a known parameter set is very cheap, that is, only one realization has to be computed and only mean variations need to be spatially resolved. The only extra cost results from the discretization of the integral terms, which leads to a broader stencil and a linear system with a fuller matrix. The preprocessing step typically required Monte Carlo with a stationary (statistically homogeneous) setting, but once determined the same kernels can be used for any non-stationary setting with the same statistical fracture distribution. For the cases discussed in the paper the kernel shape (for both
  $\hat {g}$ and
  $\hat {k}_f$) is very simple; as shown in figure 6. This shape will change, however, if more complicated fracture length, aperture and orientation distributions are to be considered, which is a subject of future research. Here, the magnitude of
  $\hat {k}_f$, i.e.
  $\bar {k}_f$ is analytically determined according to (5.7). The magnitude of
  $\hat {g}$, i.e.
  $\bar {g}$, is determined based on (5.11), which requires us to empirically determine
  $\mathbb {E}[u_f^\infty ]$. Therefore, a Monte Carlo study (consisting of
  $1000$ realizations) with an imposed mean pressure gradient in the
  $x$-direction of
  $\nabla _x^\infty p=-H_x^{-1}$ was performed.
6. Conclusions
A sub-REV continuum model to compute expected pressure and flow rates in porous media with embedded, isolated fractures was devised. Different than other multi-media formulations, non-local fracture/matrix interactions and boundary effects are taken into account via integral terms. One of the key ideas is to collapse isolated fractures to a point at their centre and to account for the fracture length distribution by a spatial kernel function with corresponding support. Similarly, kernel functions account for connections of such fractures to the domain boundaries. In principle, the derived model equations can describe multi-dimensional problems with arbitrary, spatially varying fracture size distributions. Moreover, an extension has been presented, which accounts for three media, that is, besides matrix and isolated fractures, also a connected network of percolated fractures is considered. It is straight forward to extend this formulation for an arbitrary number of media, e.g. to distinguish between fracture families of different scales, which are only weakly connected with each other and the matrix. For a proof of concept study, statistically one-dimensional numerical studies with uniformly distributed fractures of the same length were conducted. It is remarkable that the only empirical information needed for calibration is the mean asymptotic flow rate, which here was obtained from Monte Carlo of resolved flow computations through very large domains. The sub-REV model predictions of fracture and matrix pressure profiles, and most importantly, the flow rates as functions of the domain size, are in excellent agreement with the corresponding Monte Carlo data. The small discrepancies in the flow rates for domain sizes of the order of a fracture length can be corrected with an elliptic relaxation (motivated by boundary effects not taken into account otherwise) of the fracture/matrix exchange coefficient. Future steps will include validation studies with more complex reservoirs involving wells and realistic fracture size and aperture distributions; there calibration will be much more difficult.
Acknowledgements
The author thanks D. W. Meyer (ETH Zurich) for numerous discussions and his constructive feedback. Also many thanks to the reviewers, whose constructive comments helped to improve the clarity of the paper.
Declaration of interests
The author reports no conflict of interest.


