1 Introduction
It has long been recognized that turbulent flows contain regions of considerable spatio-temporal coherence, embedded in disorganized background motions. Following the increasingly common observation of such coherent structures in experiments and simulations, they have often been attributed a prominent role in signature aspects of turbulence, including the intermittent nature of the fluctuations and the cascade of energy. However, their precise topology, scaling properties, dynamics and overall significance remain the subject of intense debate. These questions represent the focus of the present study, specifically in the context of homogeneous turbulence. The body of relevant literature is vast, and in the following we survey only selected themes.
Early experimental investigations of the fine-scale fluctuations (characterized via velocity gradients) suggested that turbulence is populated by compact vortical structures (Batchelor & Townsend Reference Batchelor and Townsend1949; Kuo & Corrsin Reference Kuo and Corrsin1971). This was later confirmed by visualizations (Douady, Couder & Brachet Reference Douady, Couder and Brachet1991) and direct numerical simulations (DNS) of homogeneous isotropic turbulence (Siggia Reference Siggia1981; Kerr Reference Kerr1985). These appeared populated by long tubular filaments of intense vorticity, whose spottiness could account for the intermittent nature of the velocity gradients (She, Jackson & Orszag Reference She, Jackson and Orszag1991; She & Leveque Reference She and Leveque1994; Jiménez & Wray Reference Jiménez and Wray1998). The seminal study of Jiménez et al. (Reference Jiménez, Wray, Saffman and Rogallo1993) established that the filament diameter and length are of the order of the Kolmogorov and integral scale of the turbulence, respectively (although the recent work of Elsinga et al. (Reference Elsinga, Ishihara, Goudar, da Silva and Hunt2017) indicates their length also scales in Kolmogorov units). Some authors, stressing that vortex filaments are long-lived, attributed them great significance in the turbulence dynamics (She, Jackson & Orszag Reference She, Jackson and Orszag1990), while others saw them as inactive debris from the fragmentation of larger structures such as vortex sheets (Jiménez et al. Reference Jiménez, Wray, Saffman and Rogallo1993).
The distribution of strain rate, which determines the local dissipation of turbulent kinetic energy, is also known to be highly intermittent (Batchelor & Townsend Reference Batchelor and Townsend1949; Landau & Lifshitz Reference Landau and Lifshitz1959), an observation with far-reaching implications, which eventually led Kolmogorov to refine his original similarity theory (Kolmogorov Reference Kolmogorov1941) in order to include the variability of dissipation (Kolmogorov Reference Kolmogorov1962). The topology of high-dissipation regions is less clear compared to high-enstrophy regions, but these have often been described as sheets of Kolmogorov length thickness surrounding the vortex tubes (e.g. Vincent & Meneguzzi Reference Vincent and Meneguzzi1994; Ganapathisubramani, Lakshminarasimhan & Clemens Reference Ganapathisubramani, Lakshminarasimhan and Clemens2008; Bermejo-Moreno, Pullin & Horiuti Reference Bermejo-Moreno, Pullin and Horiuti2009). The mutual nonlinear interaction of enstrophy and dissipation is evident from their presence in each other’s transport equations (Tsinober Reference Tsinober2001) and is crucial to the structure and evolution of three-dimensional turbulence (Lüthi, Tsinober & Kinzelbach Reference Lüthi, Tsinober and Kinzelbach2005; Buxton & Ganapathisubramani Reference Buxton and Ganapathisubramani2010). Despite their universal nature, some aspects of this dynamics is likely dependent on the Reynolds number
![]() $Re_{\unicode[STIX]{x1D706}}$
(based on the Taylor microscale,
$Re_{\unicode[STIX]{x1D706}}$
(based on the Taylor microscale,
![]() $\unicode[STIX]{x1D706}$
), at least before sufficiently high values are reached. Recent DNS at higher
$\unicode[STIX]{x1D706}$
), at least before sufficiently high values are reached. Recent DNS at higher
![]() $Re_{\unicode[STIX]{x1D706}}$
than before possible (of order
$Re_{\unicode[STIX]{x1D706}}$
than before possible (of order
![]() $10^{3}$
) indicated that events of extremely high enstrophy and dissipation are often concurrent and collocated (Yeung, Donzis & Sreenivasan Reference Yeung, Donzis and Sreenivasan2012; Yeung, Zhai & Sreenivasan Reference Yeung, Zhai and Sreenivasan2015), and that the spatial organization of the coherent structures display qualitative changes with increasing
$10^{3}$
) indicated that events of extremely high enstrophy and dissipation are often concurrent and collocated (Yeung, Donzis & Sreenivasan Reference Yeung, Donzis and Sreenivasan2012; Yeung, Zhai & Sreenivasan Reference Yeung, Zhai and Sreenivasan2015), and that the spatial organization of the coherent structures display qualitative changes with increasing
![]() $Re_{\unicode[STIX]{x1D706}}$
(Elsinga et al.
Reference Elsinga, Ishihara, Goudar, da Silva and Hunt2017).
$Re_{\unicode[STIX]{x1D706}}$
(Elsinga et al.
Reference Elsinga, Ishihara, Goudar, da Silva and Hunt2017).
The evolution and interplay of enstrophy and strain rate appear essential to the inviscid stretching, deformation, and ultimate breakdown of large eddies into smaller ones. This cascade of energy was first pictured by Richardson (Reference Richardson1920) and Obukhov (Reference Obukhov1941) as local in space (i.e. a process pertaining to spatially localized eddies that shrink, grow, merge or split), and then famously theorized by Kolmogorov (Reference Kolmogorov1941) as being local in scale (the energy being transferred from eddies of a certain size to those immediately smaller). For high enough Reynolds numbers, the range of cascading scales is expected to be sufficiently wide to admit a self-similar description, and indeed various phenomenological models based on scale-invariant (fractal and multi-fractal) frameworks have been proposed (Mandelbrot Reference Mandelbrot1974; Paris & Frisch Reference Paris and Frisch1985; Meneveau & Sreenivasan Reference Meneveau and Sreenivasan1991). Individual coherent structures in homogeneous turbulence were also shown to possess fractal features, both in their shape and spatial organization (Moisy & Jiménez Reference Moisy and Jiménez2004). Indeed, while most cascade models follow Kolmogorov’s view of a local-in-scale process (Biferale Reference Biferale2003), other studies maintained Richardson’s original perspective and focused on the physical space, often in a Lagrangian framework. Among them, Meneveau & Lund (Reference Meneveau and Lund1994) followed the evolution of a blob of fluid and its turbulent kinetic energy, confirming the picture of a forward cascade towards smaller scales and quantifying its temporal rate. Goto (Reference Goto2008) described a mechanism by which pairs of vortex tubes stretch smaller nearby vortices. Yang, Pullin & Bermejo-Moreno (Reference Yang, Pullin and Bermejo-Moreno2010) characterized Lagrangian structures using differential-geometry descriptors and suggested that their shape became independent from initial conditions after an eddy turnover time. Leung, Swaminathan & Davidson (Reference Leung, Swaminathan and Davidson2012) used a bandpass filtering procedure and confirmed that axial stretching of tubular structures acts to transfer energy across eddies of different sizes. Cardesa, Vela-Martín & Jiménez (Reference Cardesa, Vela-Martín and Jiménez2017) leveraged the algorithm introduced by Lozano-Durán & Jiménez (Reference Lozano-Durán and Jiménez2014) to track coherent structures and showed that, on average, eddies of a given scale are born from eddies twice as large and die while giving birth to eddies twice as small.
While the classic theory of Kolmogorov (Reference Kolmogorov1941) remains the most successful and influential model of turbulence phenomenology, it is also known to have severe limitations. Partly, as mentioned, these come from neglecting the intermittency of the velocity fields, which significantly affect the scaling of the moments of velocity differences (Sreenivasan & Antonia Reference Sreenivasan and Antonia1997). Partly, they are due to the assumption of a local and unidirectional cascade, ignoring non-local effects that may lead to ‘direct and bidirectional coupling between large and small scales’ (Tsinober Reference Tsinober2001). While in three-dimensional turbulence the flux of energy to smaller scales dominates on average, sizeable backscatter of energy from smaller to larger scales was detected both in scale space (e.g. via filtering techniques relevant to sub-grid-scale modelling, Piomelli et al.
Reference Piomelli, Cabot, Moin and Sangsan1991; Aoyama et al.
Reference Aoyama, Ishihara, Kaneda, Yokokawa, Itakura and Uno2005) and in physical space (Lozano-Durán & Jiménez Reference Lozano-Durán and Jiménez2014; Cardesa et al.
Reference Cardesa, Vela-Martín and Jiménez2017). These have important implications for modelling, especially via large-eddy simulations (Meneveau & Katz Reference Meneveau and Katz2000). In fact, recent experimental (Gomes-Fernandes, Ganapathisubramani & Vassilicos Reference Gomes-Fernandes, Ganapathisubramani and Vassilicos2015) and numerical (Alves Portela et al.
Reference Alves Portela, Papadakis and Vassilicos2017) studies of near-wake turbulence found that inverse energy fluxes can even dominate the ensemble-averaged statistics along specific orientations in scale space. As for the issue of locality, Yeung & Brasseur (Reference Yeung and Brasseur1991) found that high wavenumbers are affected by low-wavenumber anisotropic forcing because of non-local triadic interactions. In homogeneous and isotropic flows, the net transfer remains mostly local due to significant cancellations among the non-local interactions (Domaradzki & Carati Reference Domaradzki and Carati2007; Cardesa et al.
Reference Cardesa, Vela-Martín, Dong and Jiménez2015). Still, multiple research groups observed coupling between distant scales. Vortex filaments were observed to generate from shear layer structures, allowing for direct energy transfer between distant scales (Vincent & Meneguzzi Reference Vincent and Meneguzzi1994; Ishihara, Kaneda & Hunt Reference Ishihara, Kaneda and Hunt2013; Hunt et al.
Reference Hunt, Ishihara, Worth and Kaneda2014; Elsinga et al.
Reference Elsinga, Ishihara, Goudar, da Silva and Hunt2017). Several studies reported that large-scale anisotropy was reflected on the dissipative scales even at relatively high
![]() $Re_{\unicode[STIX]{x1D706}}$
(Shen & Warhaft Reference Shen and Warhaft2000; Antonia, Zhou & Romano Reference Antonia, Zhou and Romano2002; Ouellette et al.
Reference Ouellette, Xu, Bourgoin and Bodenschatz2006, among others; see Carter & Coletti Reference Carter and Coletti2017 for a recent review of the literature on this subject). Chien, Blum & Voth (Reference Chien, Blum and Voth2013) used an oscillating-grid system to demonstrate that fluctuations of the energy input left their footprint on all scales down to the dissipative range. In the last decade, several turbulent boundary layer studies described the amplitude modulation of the near-wall motions by those in the outer region (Hutchins & Marusic Reference Hutchins and Marusic2007; Chung & McKeon Reference Chung and McKeon2010; Guala, Metzger & McKeon Reference Guala, Metzger and McKeon2010; Ganapathisubramani et al.
Reference Ganapathisubramani, Hutchins, Monty, Chung and Marusic2012). Recently Buxton & Ganapathisubramani (Reference Buxton and Ganapathisubramani2014) and Fiscaletti et al. (Reference Fiscaletti, Attili, Bisetti and Elsinga2016) showed that a correlation between the amplitude of distant scales manifested itself also in turbulent mixing layers.
$Re_{\unicode[STIX]{x1D706}}$
(Shen & Warhaft Reference Shen and Warhaft2000; Antonia, Zhou & Romano Reference Antonia, Zhou and Romano2002; Ouellette et al.
Reference Ouellette, Xu, Bourgoin and Bodenschatz2006, among others; see Carter & Coletti Reference Carter and Coletti2017 for a recent review of the literature on this subject). Chien, Blum & Voth (Reference Chien, Blum and Voth2013) used an oscillating-grid system to demonstrate that fluctuations of the energy input left their footprint on all scales down to the dissipative range. In the last decade, several turbulent boundary layer studies described the amplitude modulation of the near-wall motions by those in the outer region (Hutchins & Marusic Reference Hutchins and Marusic2007; Chung & McKeon Reference Chung and McKeon2010; Guala, Metzger & McKeon Reference Guala, Metzger and McKeon2010; Ganapathisubramani et al.
Reference Ganapathisubramani, Hutchins, Monty, Chung and Marusic2012). Recently Buxton & Ganapathisubramani (Reference Buxton and Ganapathisubramani2014) and Fiscaletti et al. (Reference Fiscaletti, Attili, Bisetti and Elsinga2016) showed that a correlation between the amplitude of distant scales manifested itself also in turbulent mixing layers.
Most of the studies cited above, like numerous others focused on these themes, leveraged the ability of DNS to provide fine-grained details for all quantities of interest. While today these can rival with the highest
![]() $Re_{\unicode[STIX]{x1D706}}$
achieved in laboratory, they remain extremely computationally expensive. Moreover, the resolution requirements for reproducing the fine-scale features of intermittent events are more stringent compared to traditional criteria based on the average dissipation (Bermejo-Moreno et al.
Reference Bermejo-Moreno, Pullin and Horiuti2009; Yeung et al.
Reference Yeung, Zhai and Sreenivasan2015). Experimental investigations remain essential, but the information is usually measured with finite accuracy and at a limited number of locations. Single-point measurements (e.g. by hot-wire, which account for the bulk of the available experimental results) rely on Taylor’s hypothesis, the limitations of which are well known (Zaman & Hussain Reference Zaman and Hussain1981; Del Álamo & Jiménez Reference Del Álamo and Jiménez2009; Fiscaletti, Ganapathisubramani & Elsinga Reference Fiscaletti, Ganapathisubramani and Elsinga2015). This assumption is not required by particle-based techniques such as particle image velocimetry (PIV) and particle tracking velocimetry (PTV). Recently these have greatly improved their capabilities thanks to progress in imaging hardware and processing, and can now yield three-dimensional velocities with high accuracy (Westerweel, Elsinga & Adrian Reference Westerweel, Elsinga and Adrian2013; Discetti & Coletti Reference Discetti and Coletti2018). Three-dimensional PTV has provided significant insight in Lagrangian dynamics (Voth et al.
Reference Voth, la Porta, Crawford, Alexander and Bodenschatz2002; Lüthi et al.
Reference Lüthi, Tsinober and Kinzelbach2005; Xu et al.
Reference Xu, Pumir, Falkovich, Bodenschatz, Shats, Xia, Francois and Boffetta2014, among others), but seeding density limitations usually prevent retrieval of spatial fields. Tomographic PIV provides volumetric measurements and has enabled detailed examination of the full velocity-gradient tensor (Elsinga & Marusic Reference Elsinga and Marusic2010; Lawson & Dawson Reference Lawson and Dawson2015; Buxton, Breda & Chen Reference Buxton, Breda and Chen2017), but this is challenging at high Reynolds numbers due to resolution limits. The latest advances in tomographic PTV (Schanz, Gesemann & Schröder Reference Schanz, Gesemann and Schröder2016) appear to overcome such limitations, but have not been applied to fundamental turbulence research yet. Two-dimensional (2-D) PIV has proved capable of retrieving in-plane velocity fields with wide dynamic spatial range (needed to cover distant scales) down to the Kolmogorov length, even for relatively high Reynolds numbers (De Silva et al.
Reference De Silva, Gnanamanickam, Atkinson, Buchmann, Hutchins, Soria and Marusic2014; Fiscaletti, Westerweel & Elsinga Reference Fiscaletti, Westerweel and Elsinga2014; Saw et al.
Reference Saw, Kuzzay, Faranda, Guittonneau, Daviaud, Wiertel-Gasquet, Padilla and Dubrulle2016, Reference Saw, Debue, Kuzzay, Daviaud and Dubrulle2018; Carter & Coletti Reference Carter and Coletti2017). While two-dimensional sections of three-dimensional flows can be misleading (Perry & Chong Reference Perry and Chong1994), the in-plane components can provide important physical insight on the topology of high-enstrophy and dissipation structures (Fiscaletti et al.
Reference Fiscaletti, Westerweel and Elsinga2014; Saw et al.
Reference Saw, Kuzzay, Faranda, Guittonneau, Daviaud, Wiertel-Gasquet, Padilla and Dubrulle2016) and via the reduced velocity-gradient tensor (Cardesa et al.
Reference Cardesa, Mistry, Gan and Dawson2013; Rabey, Wynn & Buxton Reference Rabey, Wynn and Buxton2015).
$Re_{\unicode[STIX]{x1D706}}$
achieved in laboratory, they remain extremely computationally expensive. Moreover, the resolution requirements for reproducing the fine-scale features of intermittent events are more stringent compared to traditional criteria based on the average dissipation (Bermejo-Moreno et al.
Reference Bermejo-Moreno, Pullin and Horiuti2009; Yeung et al.
Reference Yeung, Zhai and Sreenivasan2015). Experimental investigations remain essential, but the information is usually measured with finite accuracy and at a limited number of locations. Single-point measurements (e.g. by hot-wire, which account for the bulk of the available experimental results) rely on Taylor’s hypothesis, the limitations of which are well known (Zaman & Hussain Reference Zaman and Hussain1981; Del Álamo & Jiménez Reference Del Álamo and Jiménez2009; Fiscaletti, Ganapathisubramani & Elsinga Reference Fiscaletti, Ganapathisubramani and Elsinga2015). This assumption is not required by particle-based techniques such as particle image velocimetry (PIV) and particle tracking velocimetry (PTV). Recently these have greatly improved their capabilities thanks to progress in imaging hardware and processing, and can now yield three-dimensional velocities with high accuracy (Westerweel, Elsinga & Adrian Reference Westerweel, Elsinga and Adrian2013; Discetti & Coletti Reference Discetti and Coletti2018). Three-dimensional PTV has provided significant insight in Lagrangian dynamics (Voth et al.
Reference Voth, la Porta, Crawford, Alexander and Bodenschatz2002; Lüthi et al.
Reference Lüthi, Tsinober and Kinzelbach2005; Xu et al.
Reference Xu, Pumir, Falkovich, Bodenschatz, Shats, Xia, Francois and Boffetta2014, among others), but seeding density limitations usually prevent retrieval of spatial fields. Tomographic PIV provides volumetric measurements and has enabled detailed examination of the full velocity-gradient tensor (Elsinga & Marusic Reference Elsinga and Marusic2010; Lawson & Dawson Reference Lawson and Dawson2015; Buxton, Breda & Chen Reference Buxton, Breda and Chen2017), but this is challenging at high Reynolds numbers due to resolution limits. The latest advances in tomographic PTV (Schanz, Gesemann & Schröder Reference Schanz, Gesemann and Schröder2016) appear to overcome such limitations, but have not been applied to fundamental turbulence research yet. Two-dimensional (2-D) PIV has proved capable of retrieving in-plane velocity fields with wide dynamic spatial range (needed to cover distant scales) down to the Kolmogorov length, even for relatively high Reynolds numbers (De Silva et al.
Reference De Silva, Gnanamanickam, Atkinson, Buchmann, Hutchins, Soria and Marusic2014; Fiscaletti, Westerweel & Elsinga Reference Fiscaletti, Westerweel and Elsinga2014; Saw et al.
Reference Saw, Kuzzay, Faranda, Guittonneau, Daviaud, Wiertel-Gasquet, Padilla and Dubrulle2016, Reference Saw, Debue, Kuzzay, Daviaud and Dubrulle2018; Carter & Coletti Reference Carter and Coletti2017). While two-dimensional sections of three-dimensional flows can be misleading (Perry & Chong Reference Perry and Chong1994), the in-plane components can provide important physical insight on the topology of high-enstrophy and dissipation structures (Fiscaletti et al.
Reference Fiscaletti, Westerweel and Elsinga2014; Saw et al.
Reference Saw, Kuzzay, Faranda, Guittonneau, Daviaud, Wiertel-Gasquet, Padilla and Dubrulle2016) and via the reduced velocity-gradient tensor (Cardesa et al.
Reference Cardesa, Mistry, Gan and Dawson2013; Rabey, Wynn & Buxton Reference Rabey, Wynn and Buxton2015).
In the present study, we examine the small-scale features of a homogeneous anisotropic turbulent flow in the range
![]() $Re_{\unicode[STIX]{x1D706}}\approx 300{-}500$
using two-dimensional PIV data. We first examine the small-scale structure of the turbulence as permitted by planar measurements, showing results consistent with previous studies where the full 3-D topology was characterized. We then investigate the correlation between strain rate and enstrophy at small scales with velocity fluctuations at larger scales. Finally, we look at the inter-scale transfer of energy, providing some complementary insight with respect to previous results mostly obtained from DNS and pointwise measurements. The new contributions of the present work, which will be put in the context of the considered Reynolds number, are the following. It is shown that there is strong interaction between distant scales, with a clear amplitude modulation between scales that to date had been reported only in convective shear flows. The influence of the large-scale energy input is felt most strongly by the smallest scales, which is at odds with universality arguments. The nonlinear transfer of energy is found to be a combination of forward and inverse cascade in different sectors of scale space, a feature that so far had only been noticed in non-equilibrium flows. It is also shown that the states of the flow characterized by intense and weak turbulence activity contribute very differently to the cascade process. These findings would not be derivable from standard simulations of homogeneous turbulence. While the planar nature of the measurements affects the quantitative results, it is not expected to qualitatively alter the conclusions. This is partly because the incompleteness of the measurable information is alleviated by the assumption of statistical axisymmetry – an assumption corroborated by a large body of literature as discussed below. The paper is organized as follows. The experimental apparatus and methodology are briefly described in § 2. In § 3 we analyse the enstrophy and strain-rate fields and the individual structures educted from them. In § 4 we consider the correlation between the small-scale and large-scale turbulence activity. In § 5 we investigate the energy transfer in scale space. In § 6 we summarize and discuss the results, and give an outlook for future work.
$Re_{\unicode[STIX]{x1D706}}\approx 300{-}500$
using two-dimensional PIV data. We first examine the small-scale structure of the turbulence as permitted by planar measurements, showing results consistent with previous studies where the full 3-D topology was characterized. We then investigate the correlation between strain rate and enstrophy at small scales with velocity fluctuations at larger scales. Finally, we look at the inter-scale transfer of energy, providing some complementary insight with respect to previous results mostly obtained from DNS and pointwise measurements. The new contributions of the present work, which will be put in the context of the considered Reynolds number, are the following. It is shown that there is strong interaction between distant scales, with a clear amplitude modulation between scales that to date had been reported only in convective shear flows. The influence of the large-scale energy input is felt most strongly by the smallest scales, which is at odds with universality arguments. The nonlinear transfer of energy is found to be a combination of forward and inverse cascade in different sectors of scale space, a feature that so far had only been noticed in non-equilibrium flows. It is also shown that the states of the flow characterized by intense and weak turbulence activity contribute very differently to the cascade process. These findings would not be derivable from standard simulations of homogeneous turbulence. While the planar nature of the measurements affects the quantitative results, it is not expected to qualitatively alter the conclusions. This is partly because the incompleteness of the measurable information is alleviated by the assumption of statistical axisymmetry – an assumption corroborated by a large body of literature as discussed below. The paper is organized as follows. The experimental apparatus and methodology are briefly described in § 2. In § 3 we analyse the enstrophy and strain-rate fields and the individual structures educted from them. In § 4 we consider the correlation between the small-scale and large-scale turbulence activity. In § 5 we investigate the energy transfer in scale space. In § 6 we summarize and discuss the results, and give an outlook for future work.
2 Apparatus and methodology
2.1 Homogeneous turbulence chamber
The experimental apparatus used in this study was presented and qualified in Carter et al. (Reference Carter, Petersen, Amili and Coletti2016) and Carter & Coletti (Reference Carter and Coletti2017), and only a brief description will be given here. It consists of a
![]() $5~\text{m}^{3}$
transparent chamber in which two identical panels facing each other issue 256 turbulent air jets. The latter are individually actuated in random sequence, following the timing algorithm proposed by Variano & Cowen (Reference Variano and Cowen2008) and implemented in a similar water facility by Bellani & Variano (Reference Bellani and Variano2014). A region of approximately homogeneous turbulence with almost zero mean shear and negligible mean flow is generated at the centre of the chamber over a volume of approximately
$5~\text{m}^{3}$
transparent chamber in which two identical panels facing each other issue 256 turbulent air jets. The latter are individually actuated in random sequence, following the timing algorithm proposed by Variano & Cowen (Reference Variano and Cowen2008) and implemented in a similar water facility by Bellani & Variano (Reference Bellani and Variano2014). A region of approximately homogeneous turbulence with almost zero mean shear and negligible mean flow is generated at the centre of the chamber over a volume of approximately
![]() $0.5\times 0.7\times 0.4~\text{m}^{3}$
. The Reynolds number can be tuned by adjusting the average firing time of the jets (
$0.5\times 0.7\times 0.4~\text{m}^{3}$
. The Reynolds number can be tuned by adjusting the average firing time of the jets (
![]() $\unicode[STIX]{x1D707}_{on}$
), as increasing the latter leads to an increase of both the integral length scale and the root mean square (r.m.s.) velocity fluctuations.
$\unicode[STIX]{x1D707}_{on}$
), as increasing the latter leads to an increase of both the integral length scale and the root mean square (r.m.s.) velocity fluctuations.
Several features of the facility make it well suited for investigating turbulence structure and energy transfer dynamics. First, the size of the homogeneous region is substantially greater than the integral scales of the flow, which allows for the natural development of the energy cascade without major effects of the boundary conditions. The achievable Reynolds number (
![]() $Re_{\unicode[STIX]{x1D706}}\approx 500$
) is sufficient for the development of an inertial subrange (Ishihara, Gotoh & Kaneda Reference Ishihara, Gotoh and Kaneda2009). In addition, the lack of mean velocity gradients simplifies the physics at the large scales, removing shear-production mechanisms (Mydlarski & Warhaft Reference Mydlarski and Warhaft1996; Biferale & Toschi Reference Biferale and Toschi2001). The large degree of homogeneity allows us to neglect the effect of spatial gradients on the turbulent kinetic energy transfer. Finally, the lack of mean flow is beneficial for the PIV accuracy, as the full dynamic range is associated with the turbulent fluctuations.
$Re_{\unicode[STIX]{x1D706}}\approx 500$
) is sufficient for the development of an inertial subrange (Ishihara, Gotoh & Kaneda Reference Ishihara, Gotoh and Kaneda2009). In addition, the lack of mean velocity gradients simplifies the physics at the large scales, removing shear-production mechanisms (Mydlarski & Warhaft Reference Mydlarski and Warhaft1996; Biferale & Toschi Reference Biferale and Toschi2001). The large degree of homogeneity allows us to neglect the effect of spatial gradients on the turbulent kinetic energy transfer. Finally, the lack of mean flow is beneficial for the PIV accuracy, as the full dynamic range is associated with the turbulent fluctuations.
2.2 Experimental data set
We analyse measurements from the data set presented by Carter & Coletti (Reference Carter and Coletti2017). Briefly, planar PIV is performed along the
![]() $x_{1}$
–
$x_{1}$
–
![]() $x_{2}$
symmetry plane at the centre of the chamber, where
$x_{2}$
symmetry plane at the centre of the chamber, where
![]() $x_{1}$
is the direction along the jet axis and
$x_{1}$
is the direction along the jet axis and
![]() $x_{2}$
is vertical. The flow is seeded with
$x_{2}$
is vertical. The flow is seeded with
![]() $1{-}2~\unicode[STIX]{x03BC}\text{m}$
oil droplets, illuminated by a 532 nm Nd:YAG laser and imaged by a 4 megapixel CCD camera with a 200 mm Nikon lens, yielding a field of view of 4.7 cm by 4.7 cm. Velocity fields are processed using an iterative cross-correlation algorithm, with final interrogation windows of 32 pixel
$1{-}2~\unicode[STIX]{x03BC}\text{m}$
oil droplets, illuminated by a 532 nm Nd:YAG laser and imaged by a 4 megapixel CCD camera with a 200 mm Nikon lens, yielding a field of view of 4.7 cm by 4.7 cm. Velocity fields are processed using an iterative cross-correlation algorithm, with final interrogation windows of 32 pixel
![]() $\times$
32 pixel and 50 % overlap. The final vector spacing corresponds to
$\times$
32 pixel and 50 % overlap. The final vector spacing corresponds to
![]() ${\sim}1.5\unicode[STIX]{x1D702}$
, which is sufficient to resolve the dissipative scales of motion (Hearst et al.
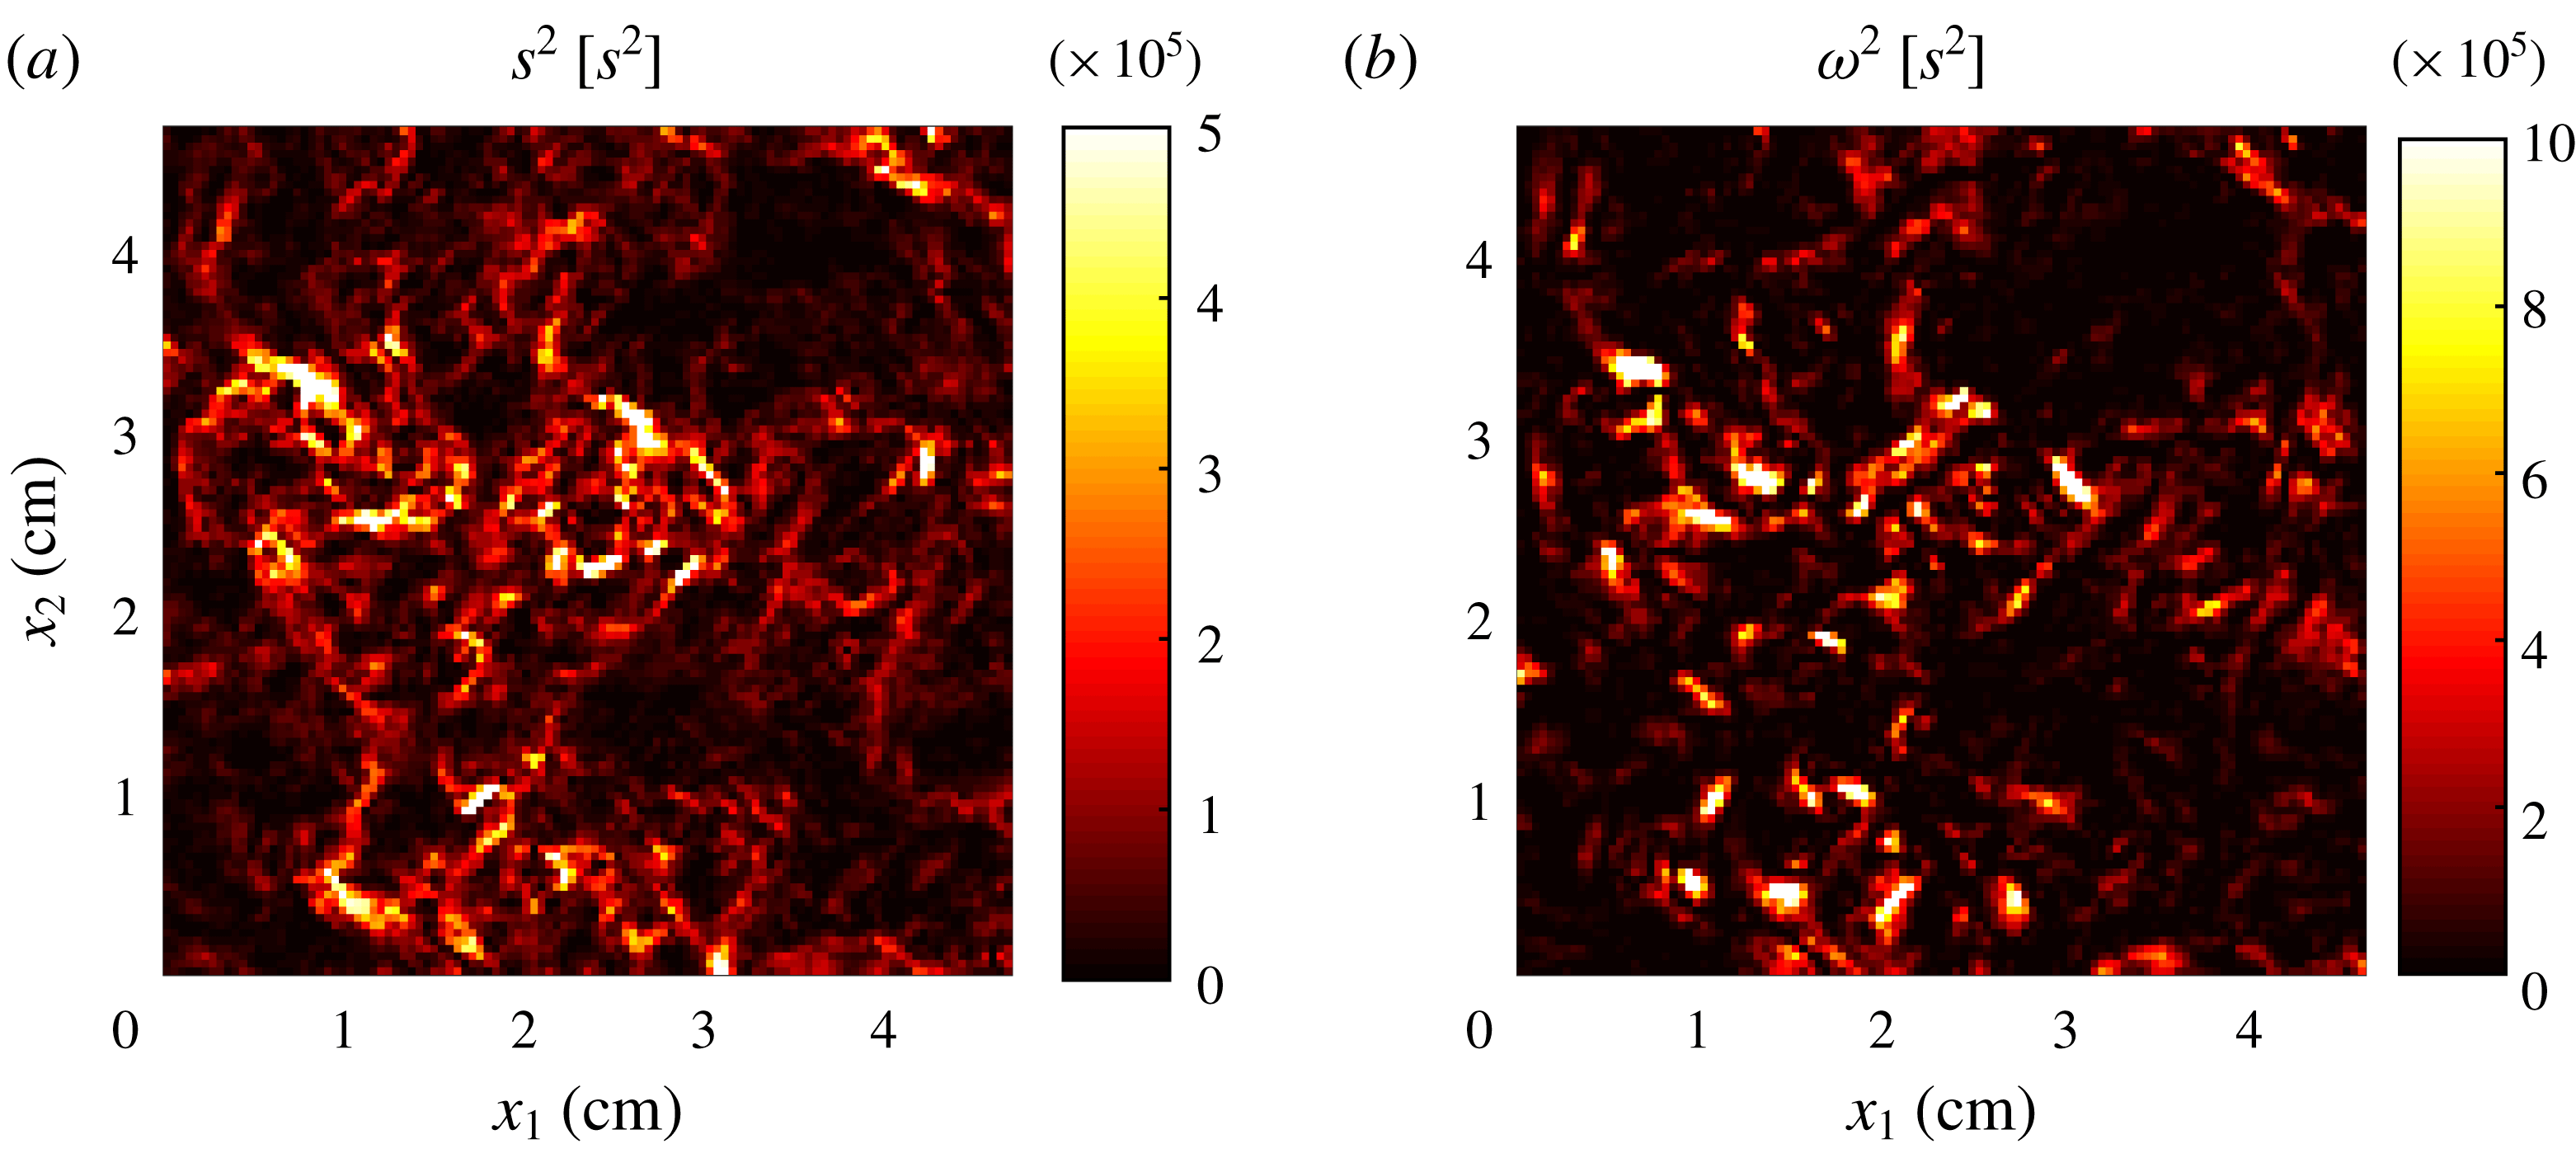
Reference Hearst, Buxton, Ganapathisubramani and Lavoie2012). Spatial derivatives are calculated with a second-order central difference scheme, after applying a Gaussian filter with kernel width matching the interrogation window size. For each case, 2000 uncorrelated realizations are acquired at 7.25 Hz. Figure 1 displays the strain-rate and enstrophy fields (see (3.3) and (3.4) in the following section) for one sample realization at
${\sim}1.5\unicode[STIX]{x1D702}$
, which is sufficient to resolve the dissipative scales of motion (Hearst et al.
Reference Hearst, Buxton, Ganapathisubramani and Lavoie2012). Spatial derivatives are calculated with a second-order central difference scheme, after applying a Gaussian filter with kernel width matching the interrogation window size. For each case, 2000 uncorrelated realizations are acquired at 7.25 Hz. Figure 1 displays the strain-rate and enstrophy fields (see (3.3) and (3.4) in the following section) for one sample realization at
![]() $Re_{\unicode[STIX]{x1D706}}=496$
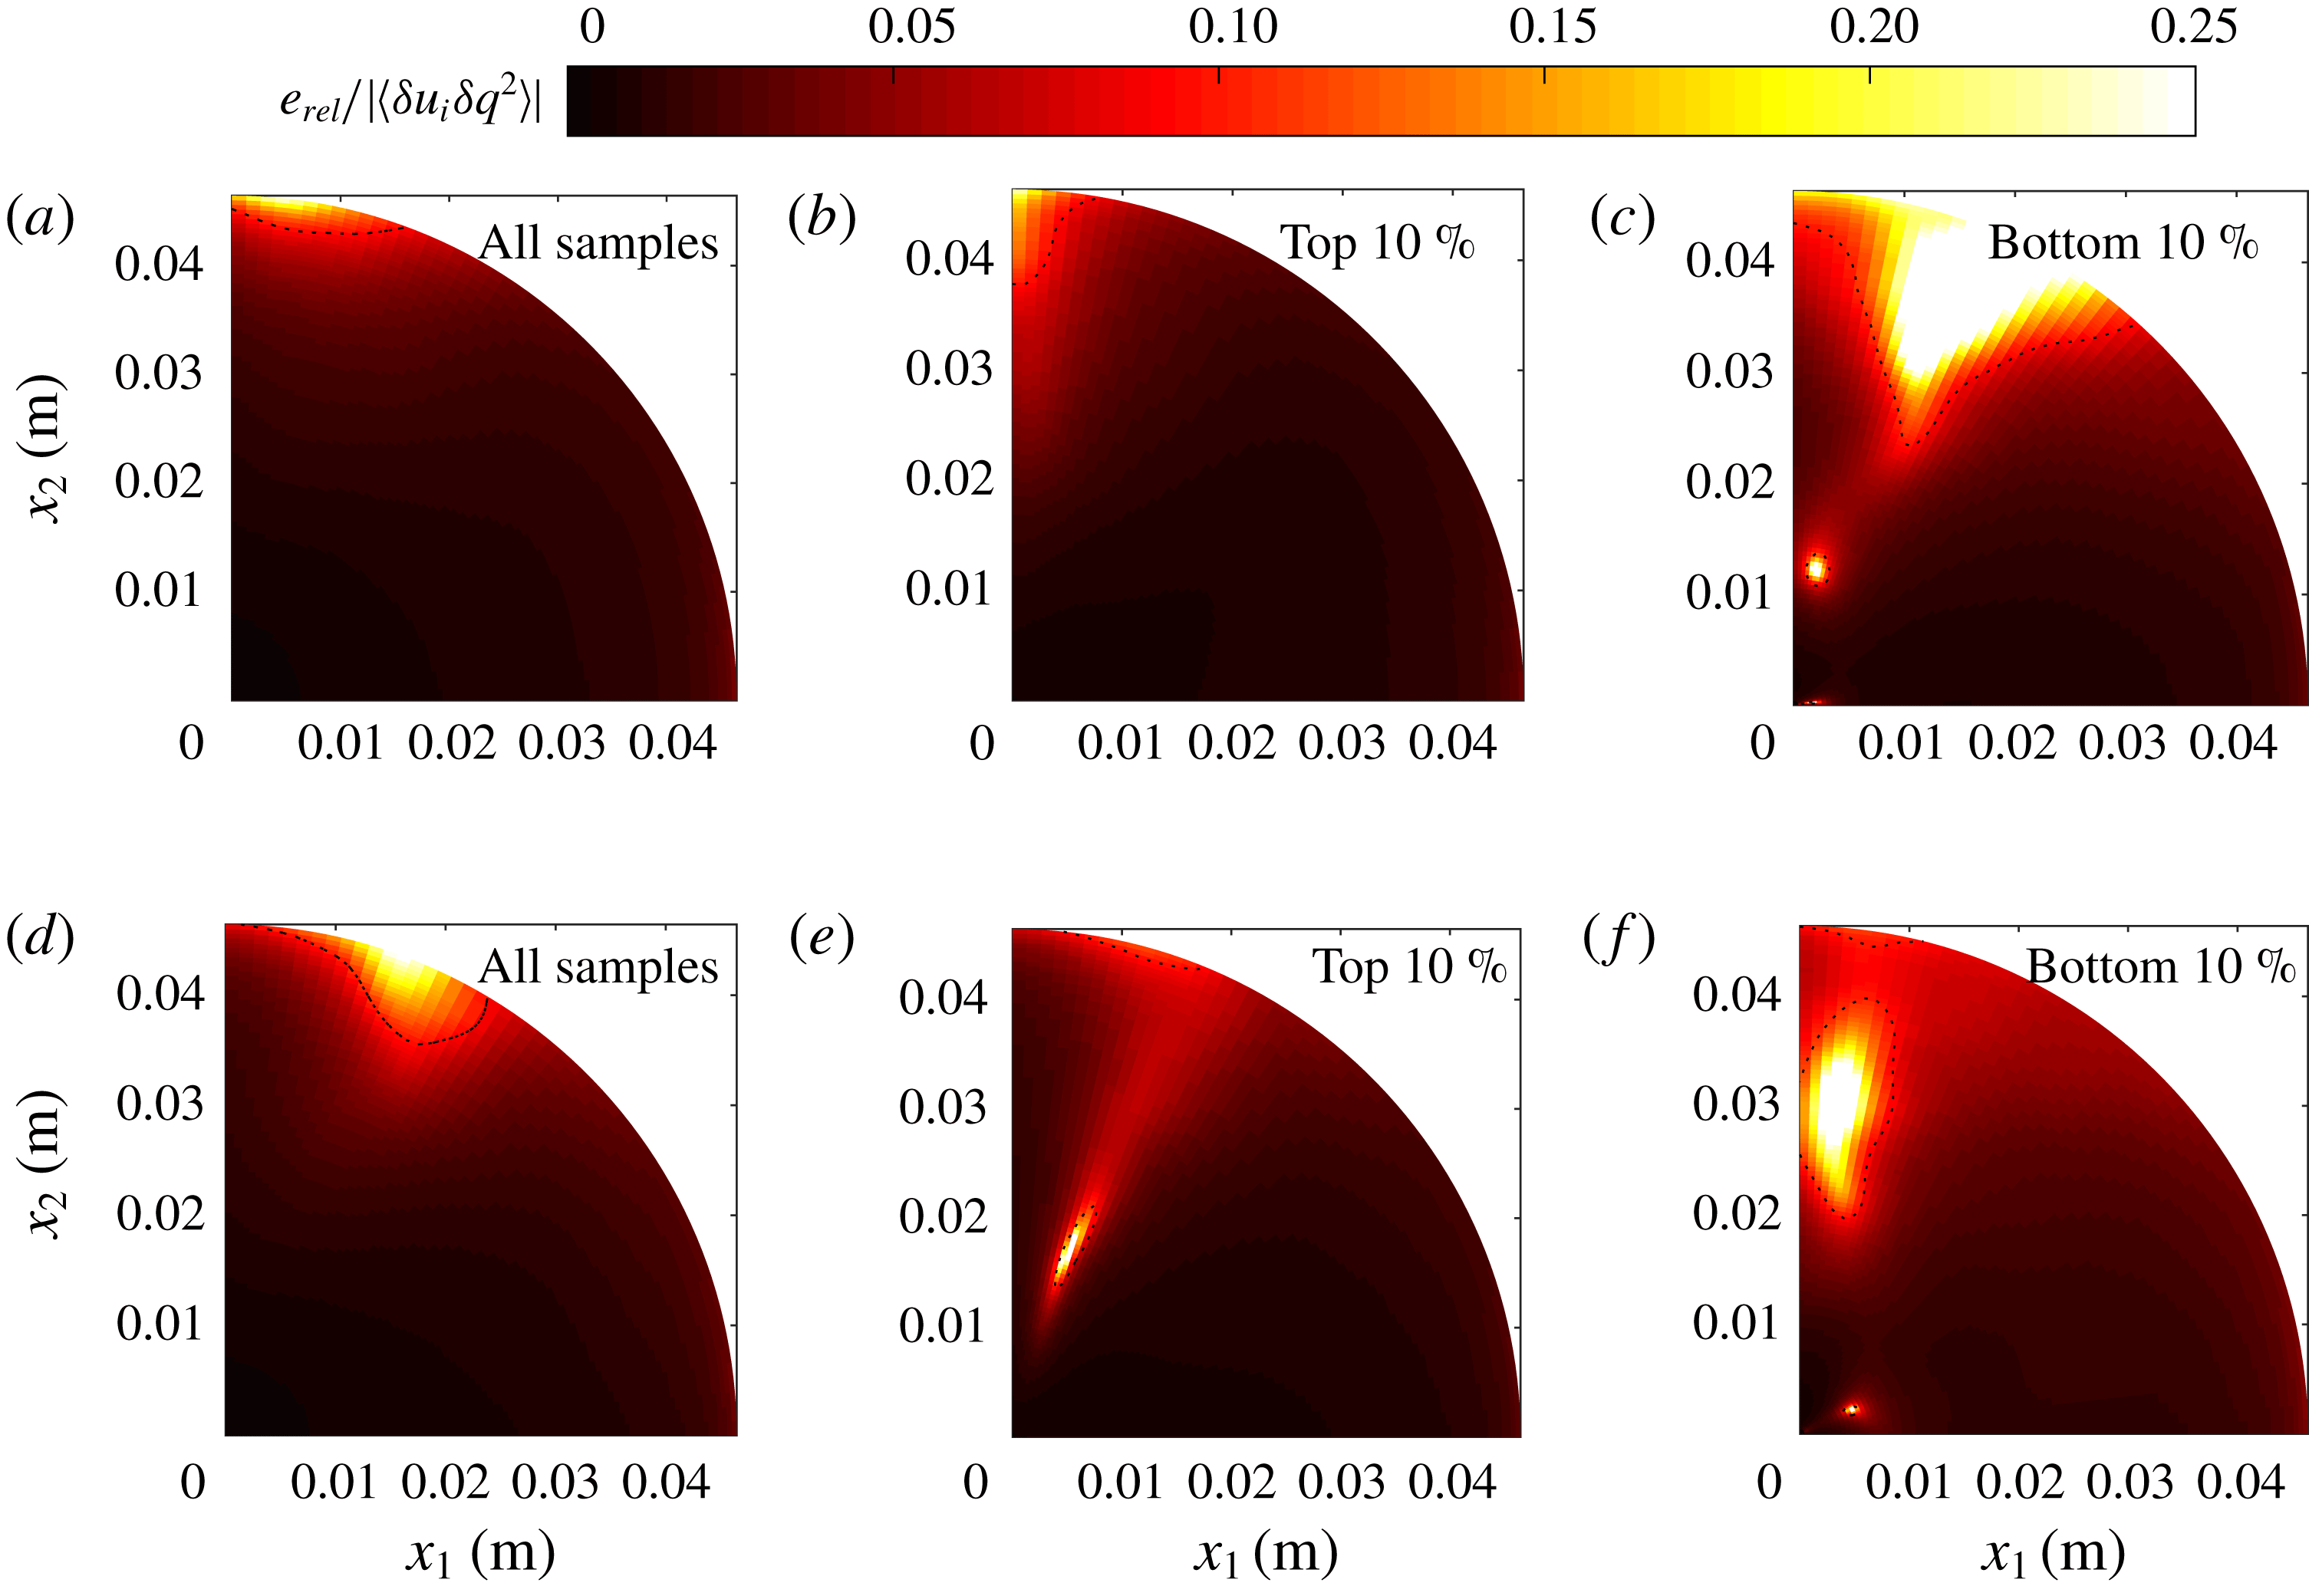
. Both fields exhibit high spatial intermittency, with long and corrugated structures of high strain and more compact but still complex structures of high enstrophy. In the following, we will discuss how this is consistent with the view of the fine-scale structure of turbulence gained by previous experiments and simulations.
$Re_{\unicode[STIX]{x1D706}}=496$
. Both fields exhibit high spatial intermittency, with long and corrugated structures of high strain and more compact but still complex structures of high enstrophy. In the following, we will discuss how this is consistent with the view of the fine-scale structure of turbulence gained by previous experiments and simulations.

Figure 1. Strain rate (a) and enstrophy (b) from an instantaneous flow realization sample at
![]() $Re_{\unicode[STIX]{x1D706}}=496$
. The colour bar range in (a) has its maximum at approximately 30 times the overall mean strain rate.
$Re_{\unicode[STIX]{x1D706}}=496$
. The colour bar range in (a) has its maximum at approximately 30 times the overall mean strain rate.
Table 1. Basic turbulence statistics for the four investigated flow configurations. The r.m.s. velocity
![]() $u^{\prime }$
and the longitudinal integral scale
$u^{\prime }$
and the longitudinal integral scale
![]() $L_{L}$
are based on weighted averages between directions
$L_{L}$
are based on weighted averages between directions
![]() $x_{1}$
and
$x_{1}$
and
![]() $x_{2}$
(Carter & Coletti Reference Carter and Coletti2017). See text for definition of Taylor microscale Reynolds number
$x_{2}$
(Carter & Coletti Reference Carter and Coletti2017). See text for definition of Taylor microscale Reynolds number
![]() $Re_{\unicode[STIX]{x1D706}}$
.
$Re_{\unicode[STIX]{x1D706}}$
.

Basic flow statistics for the four considered cases are reported in table 1. The large-scale quantities (such as the integral length scale and r.m.s. velocity) are based on separate measurements performed under the same jet-firing conditions on a larger field of view (27 cm by 27 cm), also presented in Carter & Coletti (Reference Carter and Coletti2017). The integral scale
![]() $L_{L}$
is obtained using a weighted average between the longitudinal integral lengths scales along directions
$L_{L}$
is obtained using a weighted average between the longitudinal integral lengths scales along directions
![]() $x_{1}$
and
$x_{1}$
and
![]() $x_{2}$
as described by Carter et al. (Reference Carter, Petersen, Amili and Coletti2016). The planar symmetry results in large-scale anisotropy, quantified by the ratio
$x_{2}$
as described by Carter et al. (Reference Carter, Petersen, Amili and Coletti2016). The planar symmetry results in large-scale anisotropy, quantified by the ratio
![]() $u_{1}^{\prime }/u_{2}^{\prime }$
(here and in the following, the subscript
$u_{1}^{\prime }/u_{2}^{\prime }$
(here and in the following, the subscript
![]() $i$
is used for the component along direction
$i$
is used for the component along direction
![]() $x_{i}$
, and the prime denotes r.m.s. quantities). For the considered range of jet-firing parameters, increasing
$x_{i}$
, and the prime denotes r.m.s. quantities). For the considered range of jet-firing parameters, increasing
![]() $\unicode[STIX]{x1D707}_{on}$
leads to an increase in both
$\unicode[STIX]{x1D707}_{on}$
leads to an increase in both
![]() $Re_{\unicode[STIX]{x1D706}}$
and the anisotropy ratio
$Re_{\unicode[STIX]{x1D706}}$
and the anisotropy ratio
![]() $u_{1}^{\prime }/u_{2}^{\prime }$
. The relationship between the two quantities is approximately linear, thus any trend with
$u_{1}^{\prime }/u_{2}^{\prime }$
. The relationship between the two quantities is approximately linear, thus any trend with
![]() $Re_{\unicode[STIX]{x1D706}}$
in our data implies a similar trend with
$Re_{\unicode[STIX]{x1D706}}$
in our data implies a similar trend with
![]() $u_{1}^{\prime }/u_{2}^{\prime }$
. The anisotropy persists to the fine scales, with second-order moments of the velocity gradients consistent with axisymmetric turbulence (Carter & Coletti Reference Carter and Coletti2017). We thus calculate the mean dissipation directly from the measured velocity gradients using the axisymmetric relation by George & Hussein (Reference George and Hussein1991):
$u_{1}^{\prime }/u_{2}^{\prime }$
. The anisotropy persists to the fine scales, with second-order moments of the velocity gradients consistent with axisymmetric turbulence (Carter & Coletti Reference Carter and Coletti2017). We thus calculate the mean dissipation directly from the measured velocity gradients using the axisymmetric relation by George & Hussein (Reference George and Hussein1991):
where
![]() $\unicode[STIX]{x1D622}_{ij}=\unicode[STIX]{x2202}u_{i}/\unicode[STIX]{x2202}x_{j}$
are the components of the velocity-gradient tensor and the brackets denote the ensemble average over space and time. This estimate of the dissipation agrees well with that based on the second-order structure function (Carter et al.
Reference Carter, Petersen, Amili and Coletti2016) and is used to calculate the Kolmogorov length scale
$\unicode[STIX]{x1D622}_{ij}=\unicode[STIX]{x2202}u_{i}/\unicode[STIX]{x2202}x_{j}$
are the components of the velocity-gradient tensor and the brackets denote the ensemble average over space and time. This estimate of the dissipation agrees well with that based on the second-order structure function (Carter et al.
Reference Carter, Petersen, Amili and Coletti2016) and is used to calculate the Kolmogorov length scale
![]() $\unicode[STIX]{x1D702}=(\unicode[STIX]{x1D708}^{3}/\unicode[STIX]{x1D716})^{1/4}$
and time scale
$\unicode[STIX]{x1D702}=(\unicode[STIX]{x1D708}^{3}/\unicode[STIX]{x1D716})^{1/4}$
and time scale
![]() $\unicode[STIX]{x1D70F}_{\unicode[STIX]{x1D702}}=(\unicode[STIX]{x1D708}/\unicode[STIX]{x1D716})^{1/2}$
, where
$\unicode[STIX]{x1D70F}_{\unicode[STIX]{x1D702}}=(\unicode[STIX]{x1D708}/\unicode[STIX]{x1D716})^{1/2}$
, where
![]() $\unicode[STIX]{x1D708}$
is the kinematic viscosity of air. The Taylor microscale is defined as
$\unicode[STIX]{x1D708}$
is the kinematic viscosity of air. The Taylor microscale is defined as
![]() $\unicode[STIX]{x1D706}=\sqrt{15u^{\prime 2}/\unicode[STIX]{x1D716}}$
, from which
$\unicode[STIX]{x1D706}=\sqrt{15u^{\prime 2}/\unicode[STIX]{x1D716}}$
, from which
![]() $Re_{\unicode[STIX]{x1D706}}=u^{\prime }\unicode[STIX]{x1D706}/\unicode[STIX]{x1D708}$
. Because small-scale isotropy is not satisfied in the present flow, these definitions of
$Re_{\unicode[STIX]{x1D706}}=u^{\prime }\unicode[STIX]{x1D706}/\unicode[STIX]{x1D708}$
. Because small-scale isotropy is not satisfied in the present flow, these definitions of
![]() $\unicode[STIX]{x1D706}$
and
$\unicode[STIX]{x1D706}$
and
![]() $Re_{\unicode[STIX]{x1D706}}$
are regarded as conventional.
$Re_{\unicode[STIX]{x1D706}}$
are regarded as conventional.
3 Structure of strain rate and enstrophy
3.1 Strain-rate and enstrophy fields
We first characterize the spatial structure of the strain-rate and enstrophy fields, defined as the symmetric and anti-symmetric parts of the velocity-gradient tensor
![]() $\unicode[STIX]{x1D63C}$
. In matrix notation,
$\unicode[STIX]{x1D63C}$
. In matrix notation,
for which the (squared) strain-rate and enstrophy are, respectively,
where
![]() $\unicode[STIX]{x1D714}=\unicode[STIX]{x1D735}\times \boldsymbol{u}$
is the vorticity vector. From the planar PIV data we can only determine the four components in the upper-left
$\unicode[STIX]{x1D714}=\unicode[STIX]{x1D735}\times \boldsymbol{u}$
is the vorticity vector. From the planar PIV data we can only determine the four components in the upper-left
![]() $2\times 2$
block of the full
$2\times 2$
block of the full
![]() $3\times 3$
velocity-gradient tensor. As mentioned above, this partial information is not sufficient to fully describe the flow topology. Still, as will be shown, the turbulence structure captured by the 2-D fields is at least consistent with the results of previous experiments and simulations containing the full 3-D information.
$3\times 3$
velocity-gradient tensor. As mentioned above, this partial information is not sufficient to fully describe the flow topology. Still, as will be shown, the turbulence structure captured by the 2-D fields is at least consistent with the results of previous experiments and simulations containing the full 3-D information.
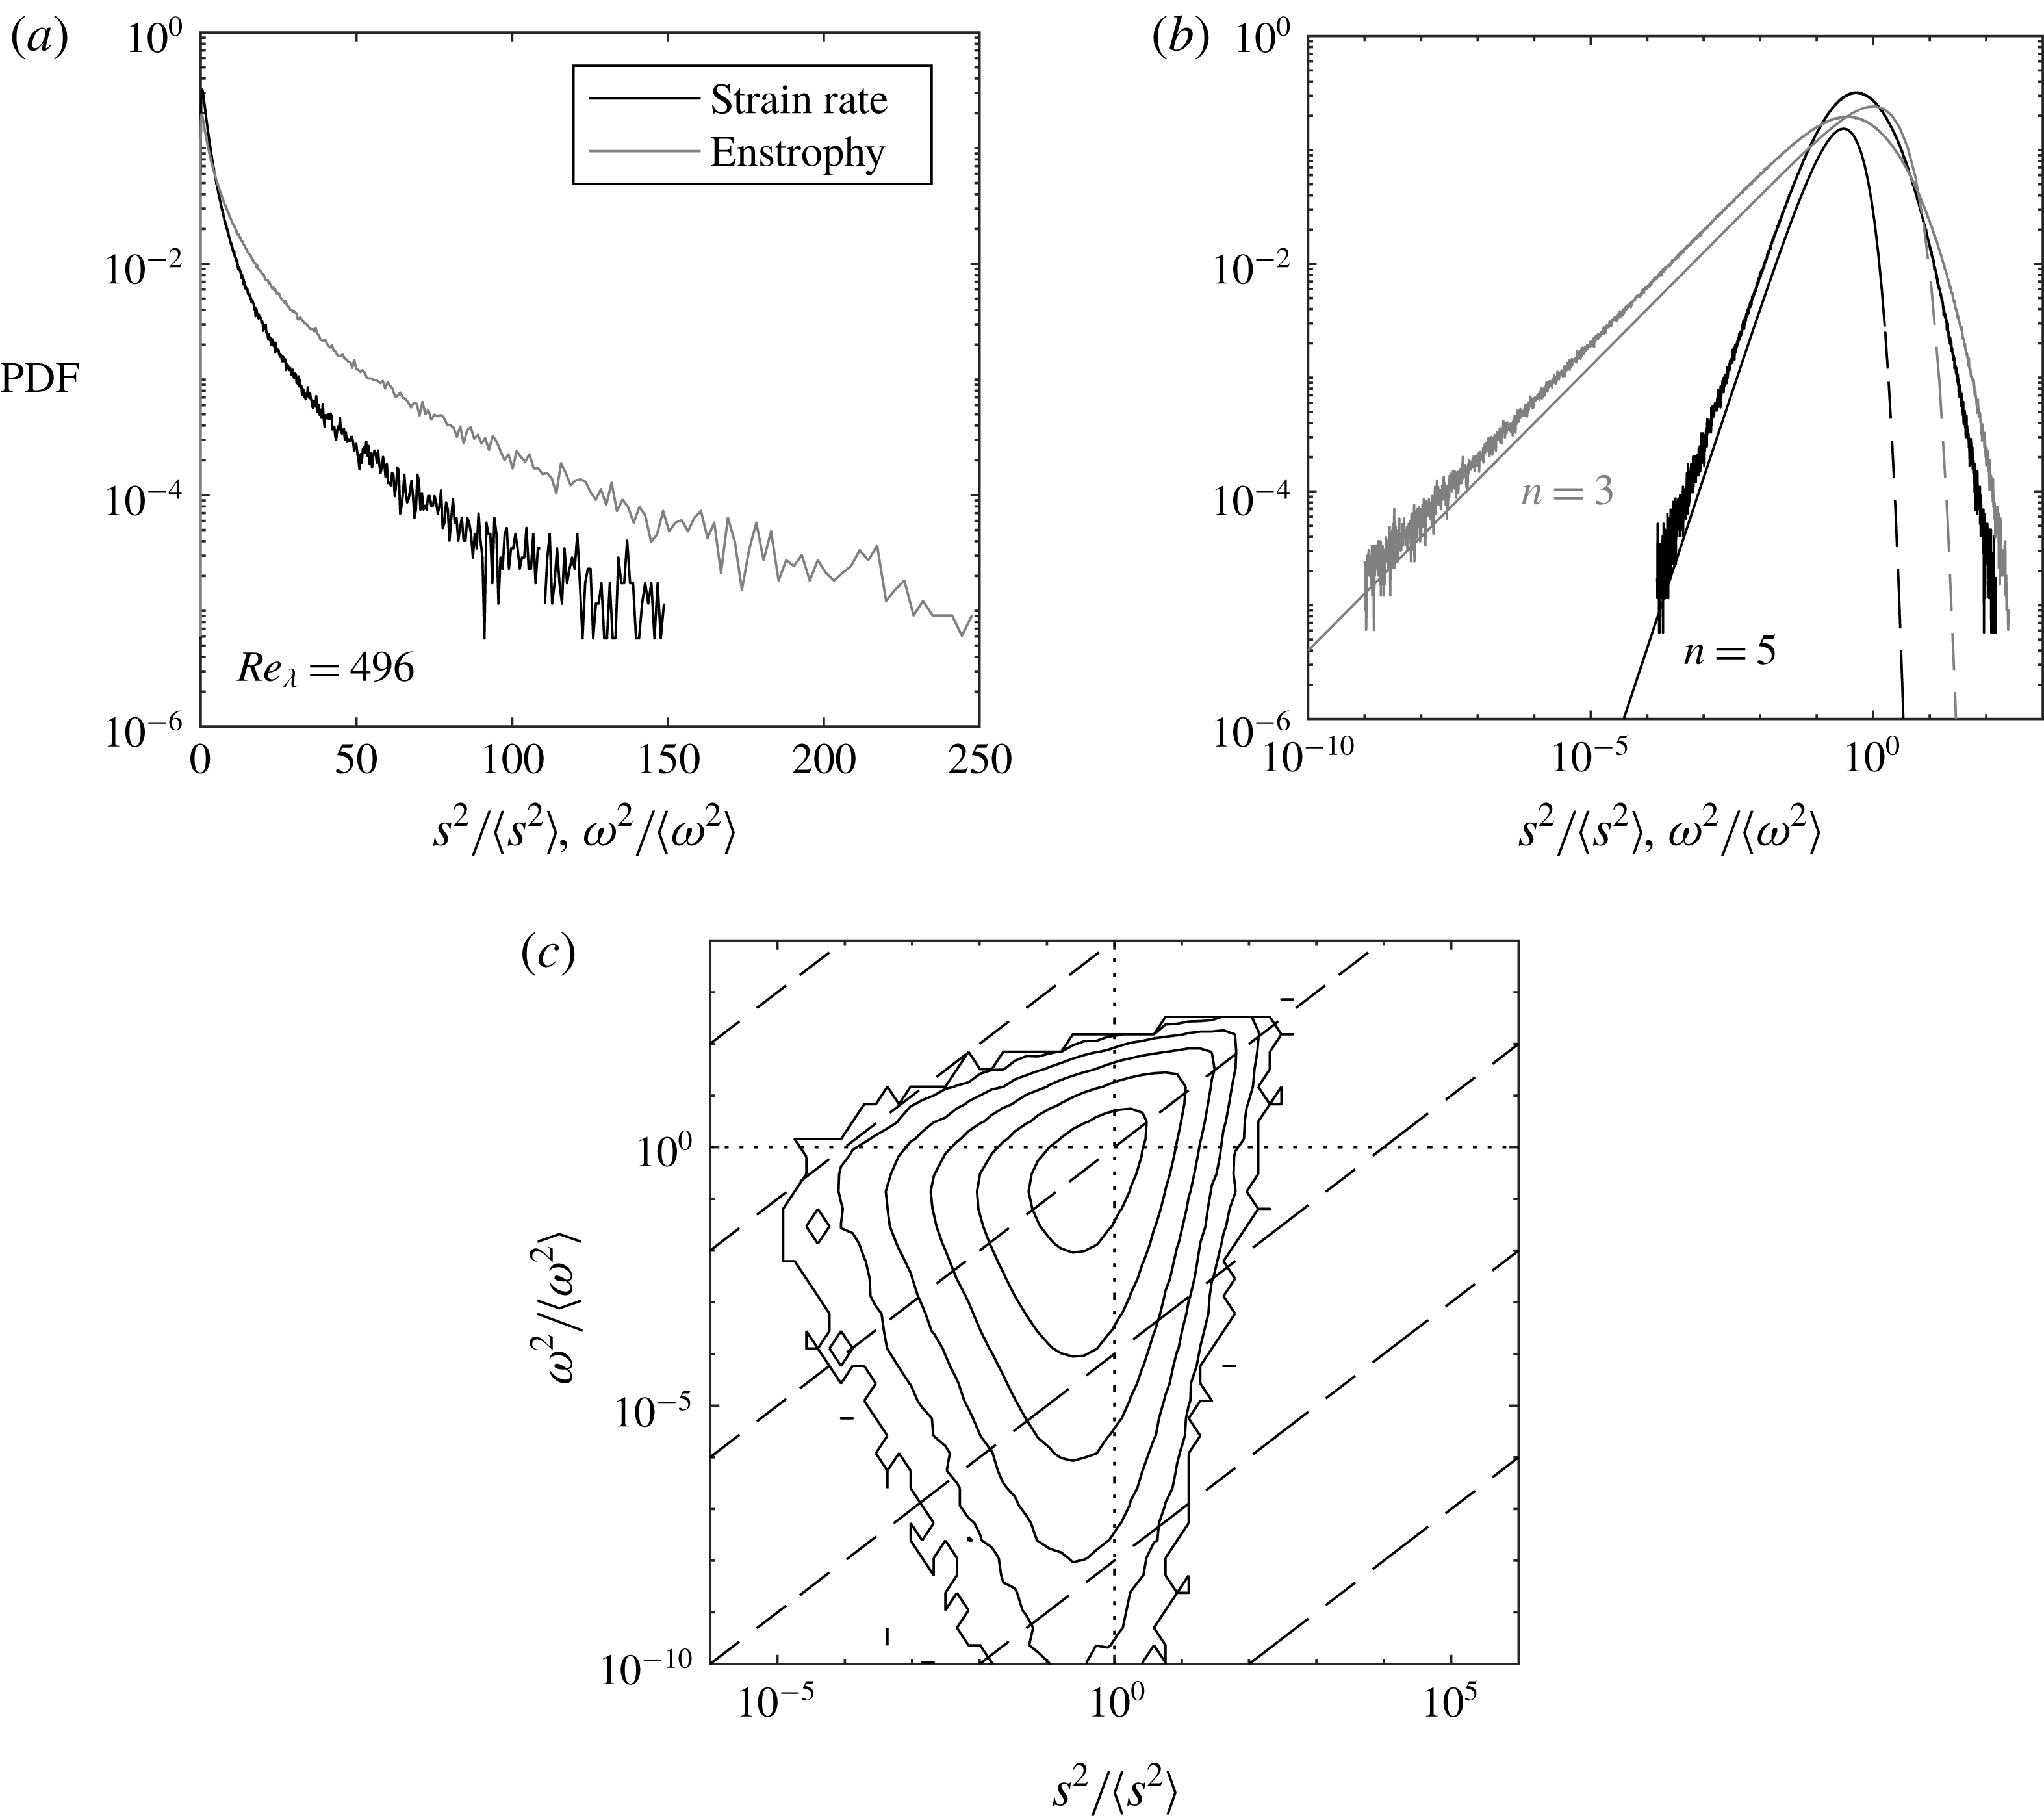
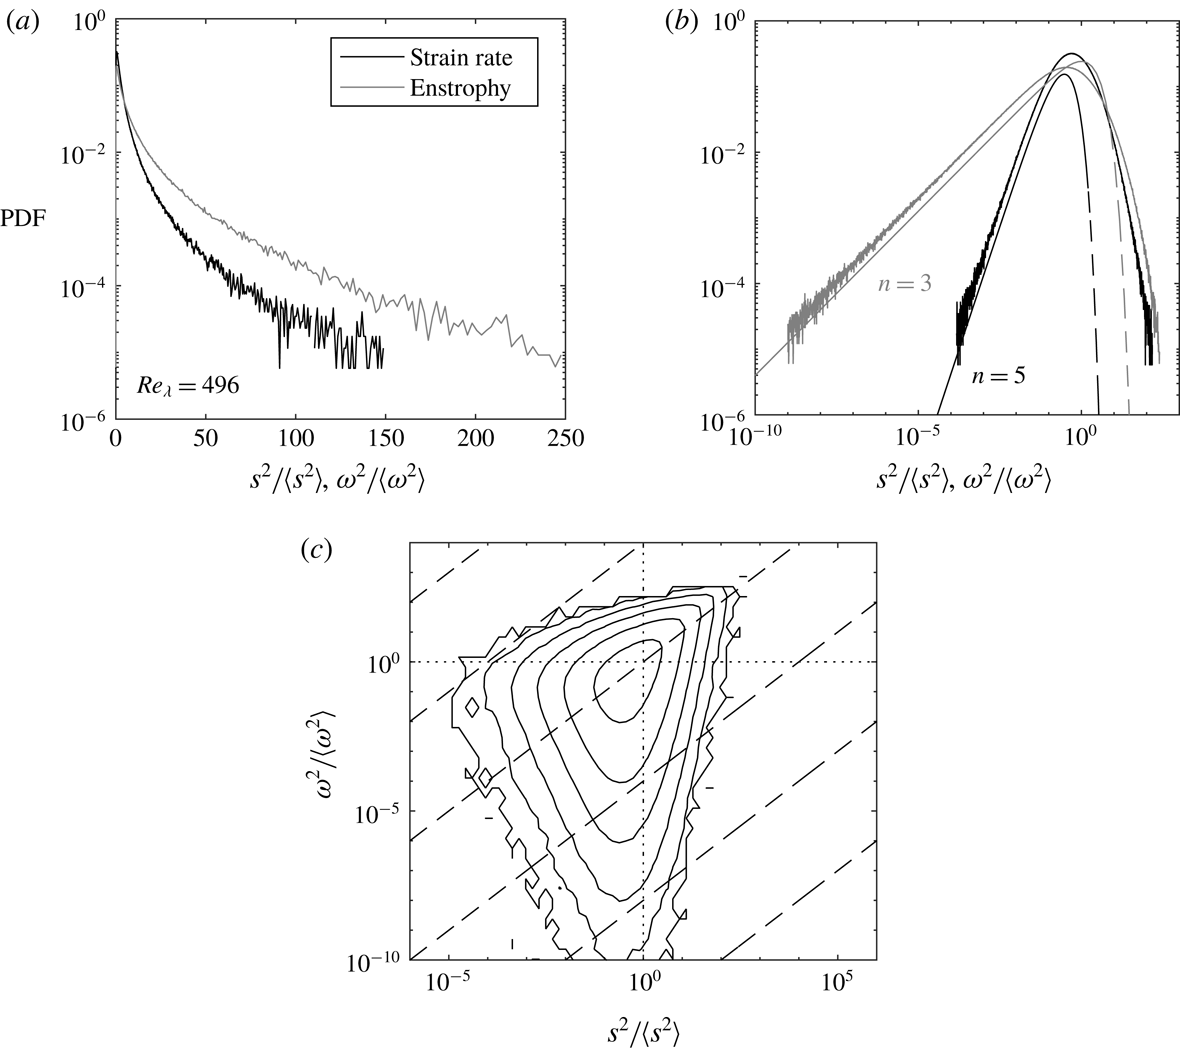
Figure 2. Strain rate and enstrophy PDF in semilog (a) and log–log (b) coordinates for the case
![]() $Re_{\unicode[STIX]{x1D706}}=496$
with dashed lines corresponding to chi-squared distributions of order 3 and 5. These are offset to the right for clarity, and otherwise overlap with the left tails of the experimental data corresponding to weak values of strain rate and enstrophy. The joint PDF is shown in (c) with contours ranging between
$Re_{\unicode[STIX]{x1D706}}=496$
with dashed lines corresponding to chi-squared distributions of order 3 and 5. These are offset to the right for clarity, and otherwise overlap with the left tails of the experimental data corresponding to weak values of strain rate and enstrophy. The joint PDF is shown in (c) with contours ranging between
![]() $10^{-1}$
(inner) and
$10^{-1}$
(inner) and
![]() $10^{-6}$
(outer) by decade, the dashed lines have slope 1, and the dotted lines are through
$10^{-6}$
(outer) by decade, the dashed lines have slope 1, and the dotted lines are through
![]() $s^{2}/\langle s^{2}\rangle =1$
and
$s^{2}/\langle s^{2}\rangle =1$
and
![]() $\unicode[STIX]{x1D714}^{2}/\langle \unicode[STIX]{x1D714}^{2}\rangle =1$
.
$\unicode[STIX]{x1D714}^{2}/\langle \unicode[STIX]{x1D714}^{2}\rangle =1$
.
In figure 2 we plot the probability density functions (PDFs) of
![]() $s^{2}$
and
$s^{2}$
and
![]() $\unicode[STIX]{x1D714}^{2}$
for
$\unicode[STIX]{x1D714}^{2}$
for
![]() $Re_{\unicode[STIX]{x1D706}}=496$
(qualitatively similar to the other cases). In panel (a) the abscissa is linear, highlighting the long tails indicative of strong intermittency. As expected, the intermittent behaviour is more pronounced for enstrophy than for strain rate (Kerr Reference Kerr1985; Chen, Sreenivasan & Nelkin Reference Chen, Sreenivasan and Nelkin1997). In panel (b) the same PDFs are plotted in log–log scale, revealing long straight tails that characterize the small values of both quantities. The probability of low-intensity events is likely overestimated in the two-dimensional measurements compared to the three-dimensional fields (Ganapathisubramani et al.
Reference Ganapathisubramani, Lakshminarasimhan and Clemens2008). However, these long tails were also identified by the DNS of Yeung et al. (Reference Yeung, Donzis and Sreenivasan2012), who argued they correspond to samples close to the Gaussian core of the velocity-gradient PDFs. Such events are expected to follow chi-square distributions, which describe the behaviour of sum-of-squares of normal random variables. In particular, by continuity, weak enstrophy and weak dissipation events should follow chi-square distributions of order three and five, respectively. The present data are in excellent agreement with these theoretical curves (dashed lines in figure 2
b). Extremely small
$Re_{\unicode[STIX]{x1D706}}=496$
(qualitatively similar to the other cases). In panel (a) the abscissa is linear, highlighting the long tails indicative of strong intermittency. As expected, the intermittent behaviour is more pronounced for enstrophy than for strain rate (Kerr Reference Kerr1985; Chen, Sreenivasan & Nelkin Reference Chen, Sreenivasan and Nelkin1997). In panel (b) the same PDFs are plotted in log–log scale, revealing long straight tails that characterize the small values of both quantities. The probability of low-intensity events is likely overestimated in the two-dimensional measurements compared to the three-dimensional fields (Ganapathisubramani et al.
Reference Ganapathisubramani, Lakshminarasimhan and Clemens2008). However, these long tails were also identified by the DNS of Yeung et al. (Reference Yeung, Donzis and Sreenivasan2012), who argued they correspond to samples close to the Gaussian core of the velocity-gradient PDFs. Such events are expected to follow chi-square distributions, which describe the behaviour of sum-of-squares of normal random variables. In particular, by continuity, weak enstrophy and weak dissipation events should follow chi-square distributions of order three and five, respectively. The present data are in excellent agreement with these theoretical curves (dashed lines in figure 2
b). Extremely small
![]() $\unicode[STIX]{x1D714}^{2}$
events are relatively common (and more frequent than extremely small
$\unicode[STIX]{x1D714}^{2}$
events are relatively common (and more frequent than extremely small
![]() $s^{2}$
events), which is consistent with the phenomenological picture that large-enstrophy areas are isolated and surrounded by large regions of low vorticity (Jiménez et al.
Reference Jiménez, Wray, Saffman and Rogallo1993; Yeung et al.
Reference Yeung, Donzis and Sreenivasan2012).
$s^{2}$
events), which is consistent with the phenomenological picture that large-enstrophy areas are isolated and surrounded by large regions of low vorticity (Jiménez et al.
Reference Jiménez, Wray, Saffman and Rogallo1993; Yeung et al.
Reference Yeung, Donzis and Sreenivasan2012).
In the DNS data of Yeung et al. (Reference Yeung, Donzis and Sreenivasan2012) the right tails of the PDFs for both enstrophy and dissipation approach one another at high Reynolds number, supporting theoretical arguments that extreme values of both quantities should scale in a similar manner (Nelkin Reference Nelkin1999; Chevillard & Meneveau Reference Chevillard and Meneveau2007). This effect, however, is fully apparent only for fluctuations thousands of times higher than the mean (Yeung et al.
Reference Yeung, Zhai and Sreenivasan2015), and therefore it is not surprising that our data do not show this tendency in the PDFs. On the other hand, Yeung et al. (Reference Yeung, Donzis and Sreenivasan2012) also show that the joint PDF (JPDF) of dissipation and enstrophy has an increasingly symmetric and pointy shape in the first quadrant at high
![]() $Re_{\unicode[STIX]{x1D706}}$
(see their figure 3b). The JPDF of
$Re_{\unicode[STIX]{x1D706}}$
(see their figure 3b). The JPDF of
![]() $s^{2}$
and
$s^{2}$
and
![]() $\unicode[STIX]{x1D714}^{2}$
for our data reproduce this pattern (figure 2
c) well, confirming that the most intense fluctuations of both quantities tend to occur simultaneously (see also Worth & Nickels Reference Worth and Nickels2011).
$\unicode[STIX]{x1D714}^{2}$
for our data reproduce this pattern (figure 2
c) well, confirming that the most intense fluctuations of both quantities tend to occur simultaneously (see also Worth & Nickels Reference Worth and Nickels2011).
In the following we will devote significant attention to regions of high strain rate and high enstrophy. As a first way of probing the size of such regions, we evaluate the spatial coherence of the
![]() $s^{2}$
and
$s^{2}$
and
![]() $\unicode[STIX]{x1D714}^{2}$
fields via the spatial autocorrelation functions:
$\unicode[STIX]{x1D714}^{2}$
fields via the spatial autocorrelation functions:
which in homogeneous flows depend on the separation vector
![]() $\boldsymbol{r}$
and not on the position
$\boldsymbol{r}$
and not on the position
![]() $\boldsymbol{x}$
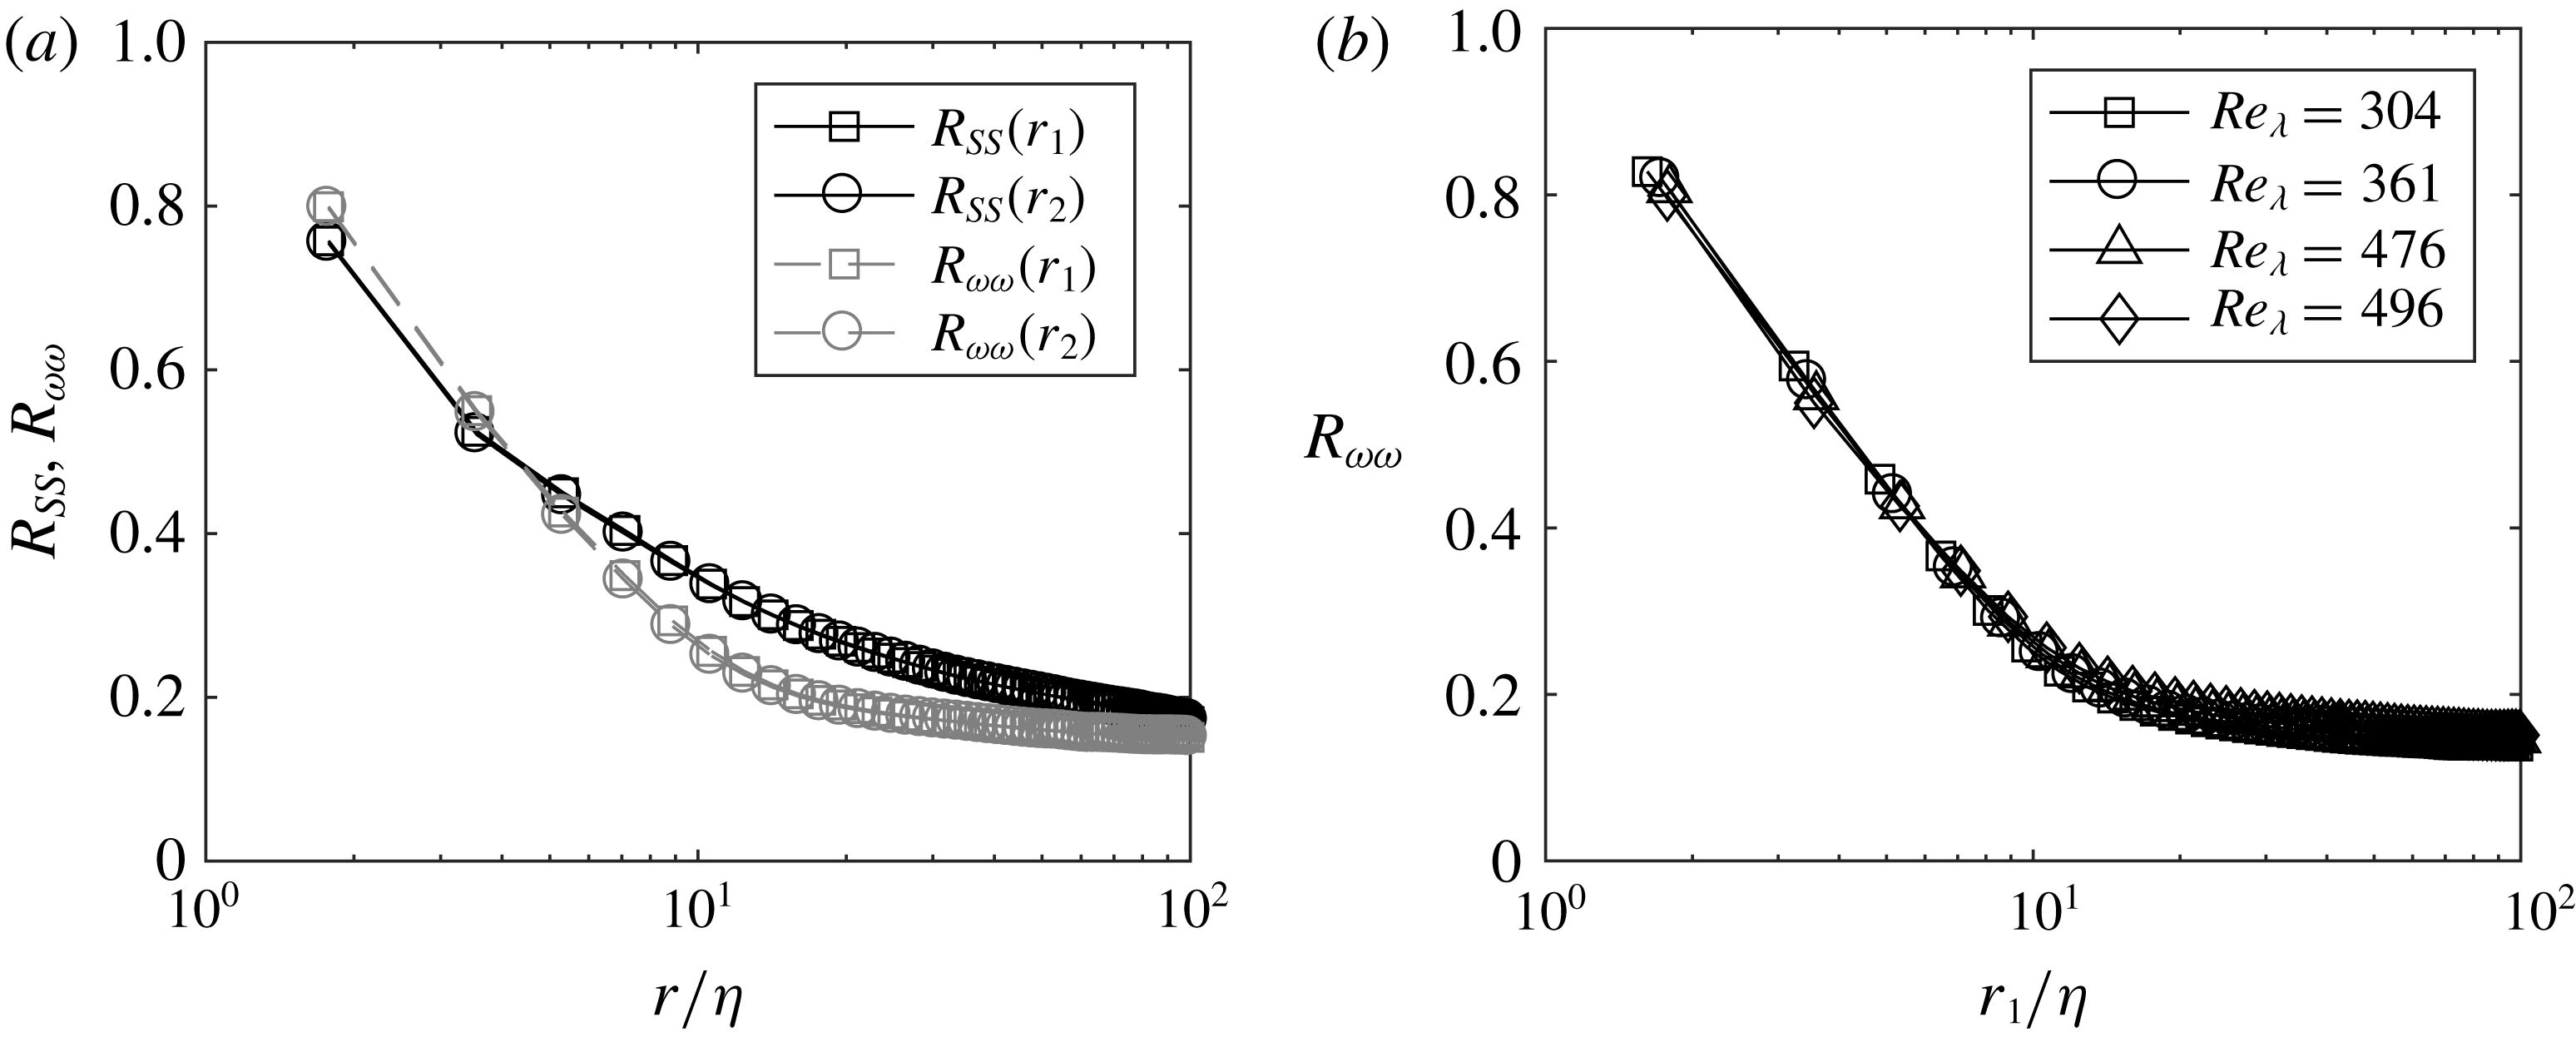
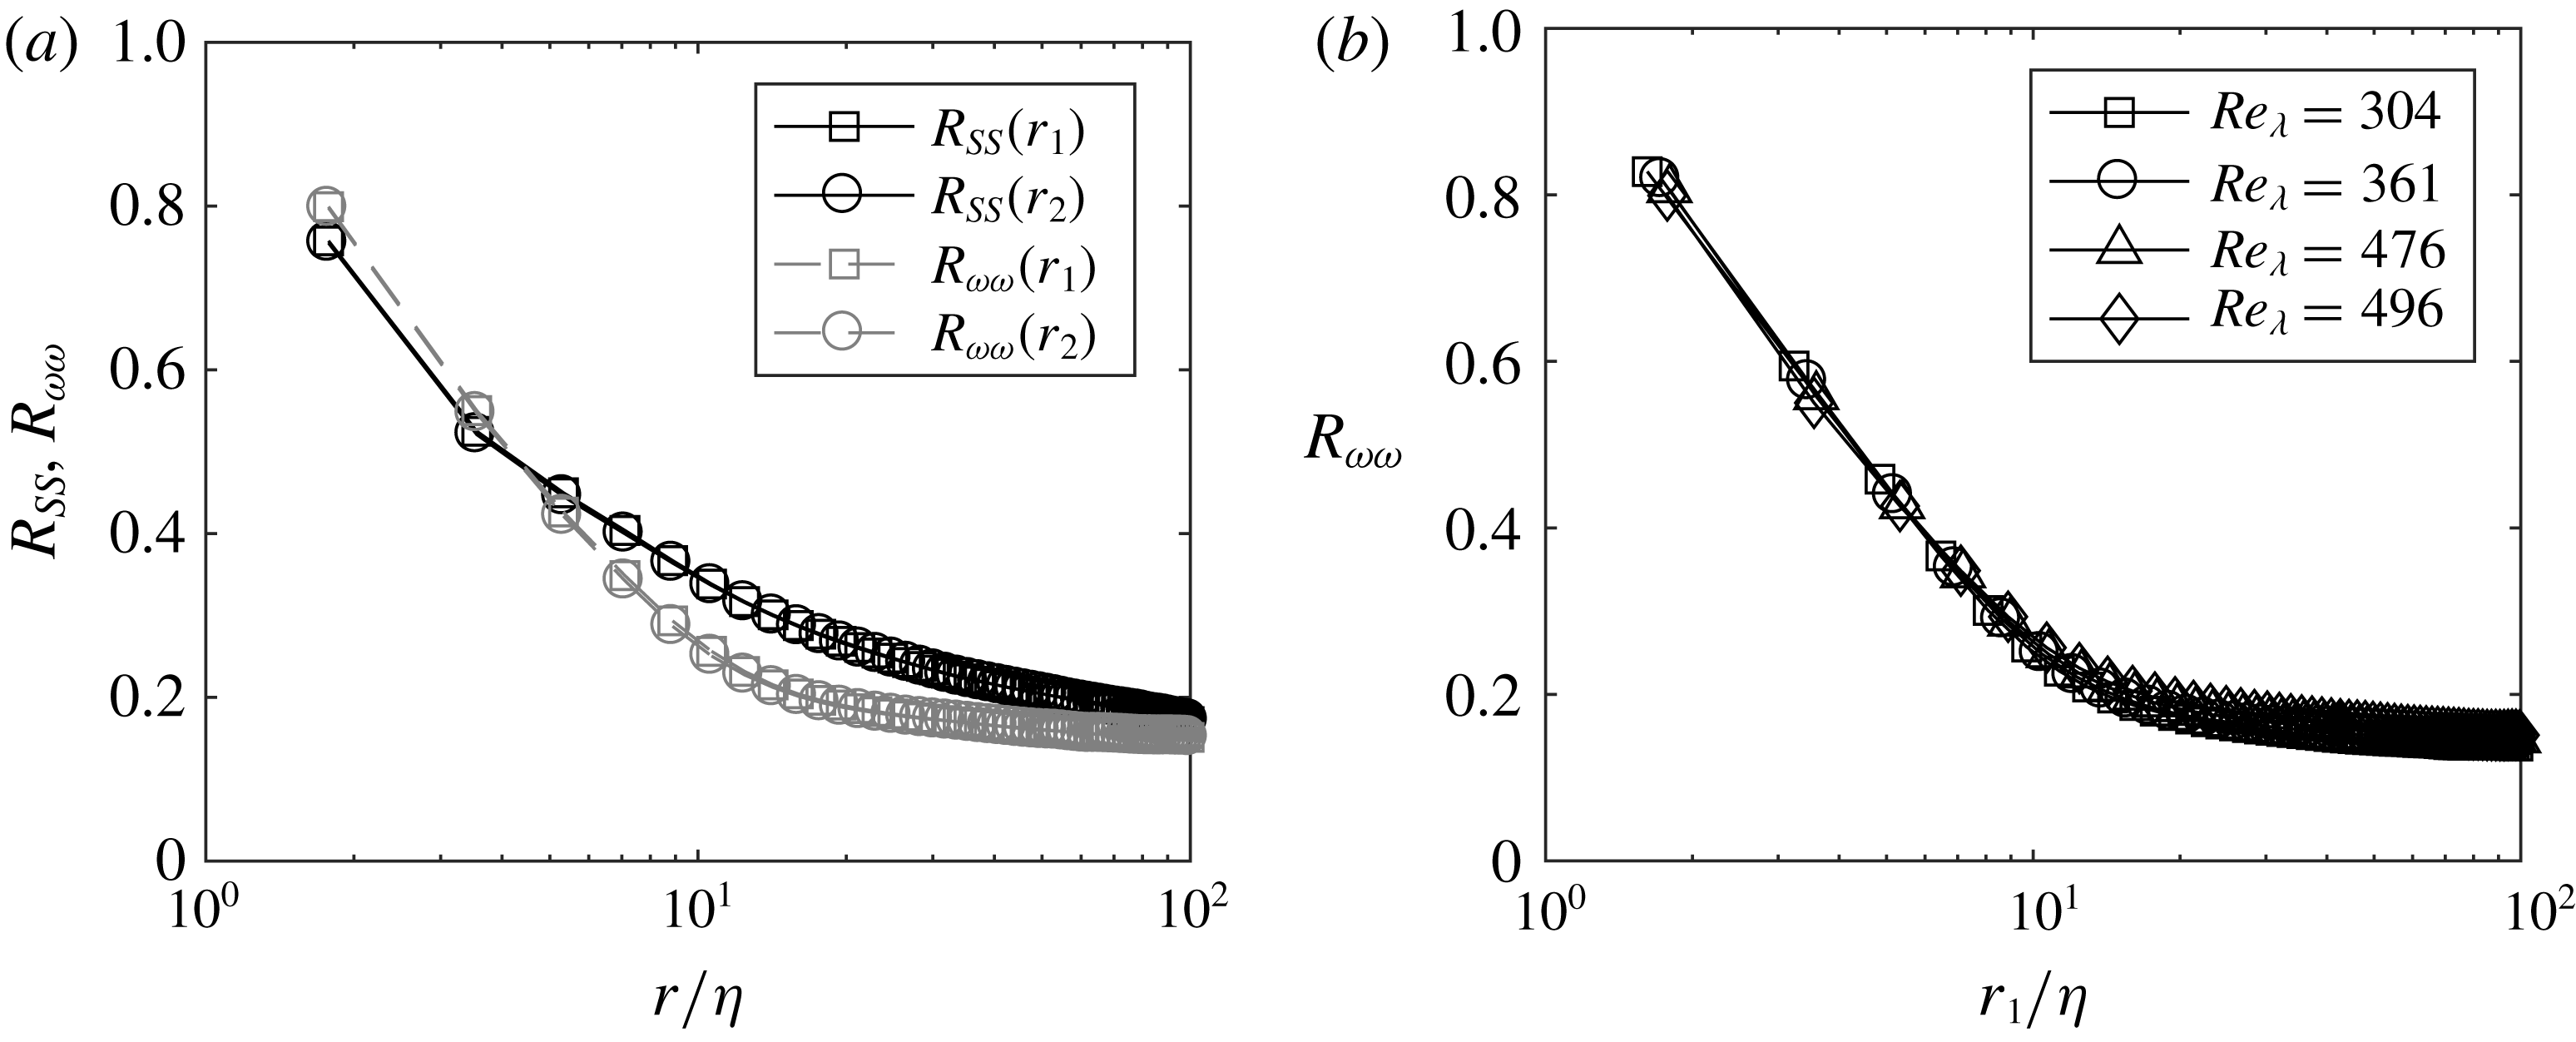
. Figure 3 shows both functions (normalized by the space–time variance of the respective fields) with separations along both
$\boldsymbol{x}$
. Figure 3 shows both functions (normalized by the space–time variance of the respective fields) with separations along both
![]() $x_{1}$
and
$x_{1}$
and
![]() $x_{2}$
(normalized by
$x_{2}$
(normalized by
![]() $\unicode[STIX]{x1D702}$
), for the representative
$\unicode[STIX]{x1D702}$
), for the representative
![]() $Re_{\unicode[STIX]{x1D706}}=496$
case. Despite the large-scale anisotropy, no measurable difference is found based on the orientation of
$Re_{\unicode[STIX]{x1D706}}=496$
case. Despite the large-scale anisotropy, no measurable difference is found based on the orientation of
![]() $\boldsymbol{r}$
. As both functions approximate an exponential decay for separations smaller than
$\boldsymbol{r}$
. As both functions approximate an exponential decay for separations smaller than
![]() $O(10\unicode[STIX]{x1D702})$
, we define characteristic lengths as the separations at which the normalized curves drop to
$O(10\unicode[STIX]{x1D702})$
, we define characteristic lengths as the separations at which the normalized curves drop to
![]() $1/e$
. As they are based on spatial autocorrelations, these scales should be interpreted as approximate rather than precise estimates of the size of individual structures. This yields a length scale of
$1/e$
. As they are based on spatial autocorrelations, these scales should be interpreted as approximate rather than precise estimates of the size of individual structures. This yields a length scale of
![]() ${\sim}10\unicode[STIX]{x1D702}$
for high-strain regions and
${\sim}10\unicode[STIX]{x1D702}$
for high-strain regions and
![]() ${\sim}7\unicode[STIX]{x1D702}$
for high-enstrophy regions. The latter is consistent with filaments of intense vorticity reported to have diameters between
${\sim}7\unicode[STIX]{x1D702}$
for high-enstrophy regions. The latter is consistent with filaments of intense vorticity reported to have diameters between
![]() $4\unicode[STIX]{x1D702}$
and
$4\unicode[STIX]{x1D702}$
and
![]() $10\unicode[STIX]{x1D702}$
(Jiménez et al.
Reference Jiménez, Wray, Saffman and Rogallo1993; Ishihara et al.
Reference Ishihara, Kaneda and Hunt2013). Strong dissipative regions have also been described as having thickness of order
$10\unicode[STIX]{x1D702}$
(Jiménez et al.
Reference Jiménez, Wray, Saffman and Rogallo1993; Ishihara et al.
Reference Ishihara, Kaneda and Hunt2013). Strong dissipative regions have also been described as having thickness of order
![]() ${\sim}10\unicode[STIX]{x1D702}$
, but with a sheet-like rather than tubular shape (Moisy & Jiménez Reference Moisy and Jiménez2004; Ganapathisubramani et al.
Reference Ganapathisubramani, Lakshminarasimhan and Clemens2008). Both
${\sim}10\unicode[STIX]{x1D702}$
, but with a sheet-like rather than tubular shape (Moisy & Jiménez Reference Moisy and Jiménez2004; Ganapathisubramani et al.
Reference Ganapathisubramani, Lakshminarasimhan and Clemens2008). Both
![]() $R_{SS}$
and
$R_{SS}$
and
![]() $R_{\unicode[STIX]{x1D714}\unicode[STIX]{x1D714}}$
exhibit long tails with significant level of correlation (above
$R_{\unicode[STIX]{x1D714}\unicode[STIX]{x1D714}}$
exhibit long tails with significant level of correlation (above
![]() $0.1$
over the entire measurement window). This appears consistent with the dual-scale nature of the high-enstrophy tubes and high-dissipation sheets, which were found to have length/width of the order of the integral scale (Jiménez et al.
Reference Jiménez, Wray, Saffman and Rogallo1993; Ganapathisubramani et al.
Reference Ganapathisubramani, Lakshminarasimhan and Clemens2008). The correlation levels for strain rate are significantly higher than for enstrophy, which is also consistent with the accepted topological picture: the imaging plane is more likely to cut through large portions of high-dissipation sheets than through long sections of vortex tubes parallel to it. Higher tails of
$0.1$
over the entire measurement window). This appears consistent with the dual-scale nature of the high-enstrophy tubes and high-dissipation sheets, which were found to have length/width of the order of the integral scale (Jiménez et al.
Reference Jiménez, Wray, Saffman and Rogallo1993; Ganapathisubramani et al.
Reference Ganapathisubramani, Lakshminarasimhan and Clemens2008). The correlation levels for strain rate are significantly higher than for enstrophy, which is also consistent with the accepted topological picture: the imaging plane is more likely to cut through large portions of high-dissipation sheets than through long sections of vortex tubes parallel to it. Higher tails of
![]() $R_{SS}$
were also found in the PIV measurements of Fiscaletti et al. (Reference Fiscaletti, Westerweel and Elsinga2014) in a turbulent jet.
$R_{SS}$
were also found in the PIV measurements of Fiscaletti et al. (Reference Fiscaletti, Westerweel and Elsinga2014) in a turbulent jet.
In figure 3(b) we show a comparison of
![]() $R_{\unicode[STIX]{x1D714}\unicode[STIX]{x1D714}}$
for the different
$R_{\unicode[STIX]{x1D714}\unicode[STIX]{x1D714}}$
for the different
![]() $Re_{\unicode[STIX]{x1D706}}$
cases, showing good collapse of all curves especially at small separations. This is consistent with the expected Kolmogorov scaling of the thickness of the vorticity filaments, which has been shown to apply not only to homogeneous turbulence (Jiménez et al.
Reference Jiménez, Wray, Saffman and Rogallo1993) but also boundary layers (Herpin et al.
Reference Herpin, Stanislas, Foucaut and Coudert2013). Similar levels of collapse are found for
$Re_{\unicode[STIX]{x1D706}}$
cases, showing good collapse of all curves especially at small separations. This is consistent with the expected Kolmogorov scaling of the thickness of the vorticity filaments, which has been shown to apply not only to homogeneous turbulence (Jiménez et al.
Reference Jiménez, Wray, Saffman and Rogallo1993) but also boundary layers (Herpin et al.
Reference Herpin, Stanislas, Foucaut and Coudert2013). Similar levels of collapse are found for
![]() $R_{SS}$
(not shown).
$R_{SS}$
(not shown).
A widespread view of the small-scale turbulence structure is one in which tubular vortices are flanked by high-strain regions (Kerr Reference Kerr1985; Vincent & Meneguzzi Reference Vincent and Meneguzzi1994; Cadot, Douady & Couder Reference Cadot, Douady and Couder1995; Ganapathisubramani et al.
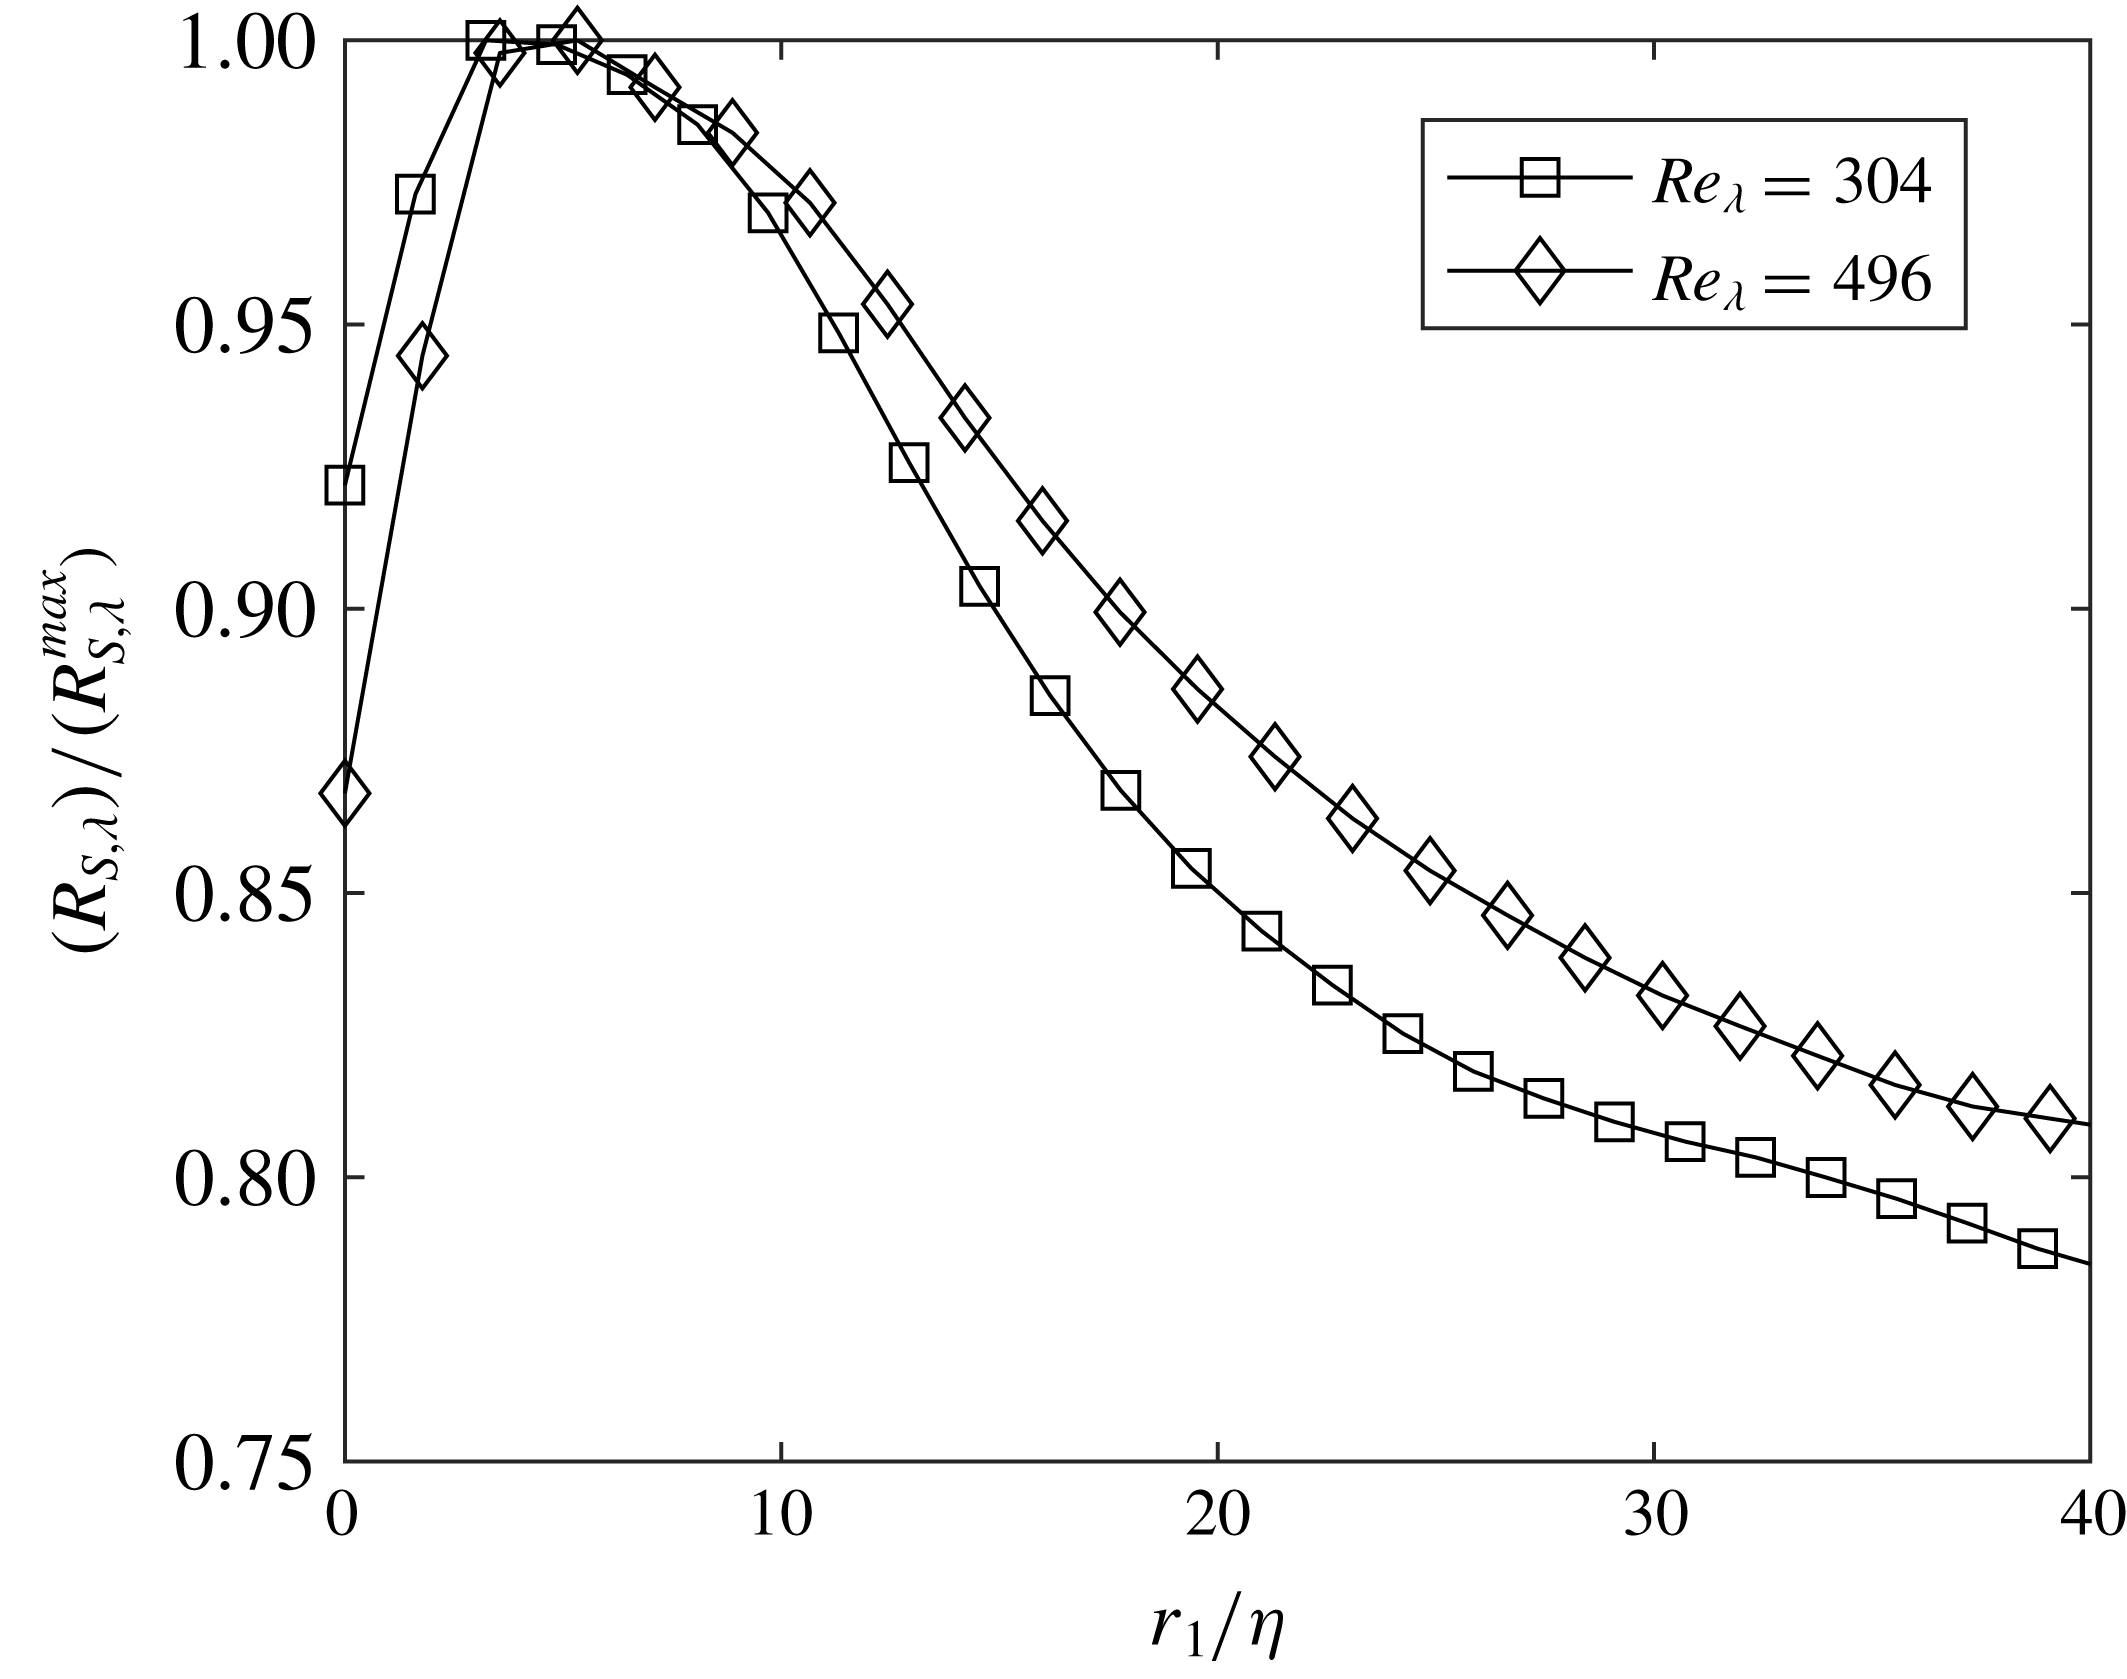
Reference Ganapathisubramani, Lakshminarasimhan and Clemens2008; Worth & Nickels Reference Worth and Nickels2011; Lawson & Dawson Reference Lawson and Dawson2015). The mutual distance between the regions of strain and rotation is probed here by calculating the cross-correlation between
![]() $s^{2}$
and the swirling strength
$s^{2}$
and the swirling strength
![]() $\unicode[STIX]{x1D706}_{ci}$
, defined as the imaginary part of the complex eigenvalue of the local velocity-gradient tensor (Zhou et al.
Reference Zhou, Adrian, Balachandar and Kendall1999):
$\unicode[STIX]{x1D706}_{ci}$
, defined as the imaginary part of the complex eigenvalue of the local velocity-gradient tensor (Zhou et al.
Reference Zhou, Adrian, Balachandar and Kendall1999):
Here
![]() $\unicode[STIX]{x1D706}_{ci}$
is used in place of enstrophy as it identifies regions of fluid rotation without being affected by local shear. As they are based on 2-D velocity fields, regions of high swirling strength are interpreted as vortices of axis almost perpendicular to the measurement plane. The cross-correlation (normalized by its maximum value) is plotted in figure 4 for
$\unicode[STIX]{x1D706}_{ci}$
is used in place of enstrophy as it identifies regions of fluid rotation without being affected by local shear. As they are based on 2-D velocity fields, regions of high swirling strength are interpreted as vortices of axis almost perpendicular to the measurement plane. The cross-correlation (normalized by its maximum value) is plotted in figure 4 for
![]() $Re_{\unicode[STIX]{x1D706}}=304$
and
$Re_{\unicode[STIX]{x1D706}}=304$
and
![]() $496$
, showing a peak at separations of
$496$
, showing a peak at separations of
![]() $4$
–
$4$
–
![]() $5\unicode[STIX]{x1D702}$
. This is smaller than the
$5\unicode[STIX]{x1D702}$
. This is smaller than the
![]() ${\sim}9\unicode[STIX]{x1D702}$
separation in a similar plot obtained by Fiscaletti et al. (Reference Fiscaletti, Westerweel and Elsinga2014) in a turbulent jet; but it is consistent with the study of Elsinga et al. (Reference Elsinga, Ishihara, Goudar, da Silva and Hunt2017) who performed conditional averaging in the strain eigenframe of homogeneous isotropic turbulence, and found vortical structures with cores located
${\sim}9\unicode[STIX]{x1D702}$
separation in a similar plot obtained by Fiscaletti et al. (Reference Fiscaletti, Westerweel and Elsinga2014) in a turbulent jet; but it is consistent with the study of Elsinga et al. (Reference Elsinga, Ishihara, Goudar, da Silva and Hunt2017) who performed conditional averaging in the strain eigenframe of homogeneous isotropic turbulence, and found vortical structures with cores located
![]() $4\unicode[STIX]{x1D702}$
from the maximum peak of dissipation. Yeung et al. (Reference Yeung, Zhai and Sreenivasan2015) reported examples of extreme dissipation and enstrophy events occurring at distances of
$4\unicode[STIX]{x1D702}$
from the maximum peak of dissipation. Yeung et al. (Reference Yeung, Zhai and Sreenivasan2015) reported examples of extreme dissipation and enstrophy events occurring at distances of
![]() $2$
–
$2$
–
![]() $3\unicode[STIX]{x1D702}$
from each other.
$3\unicode[STIX]{x1D702}$
from each other.
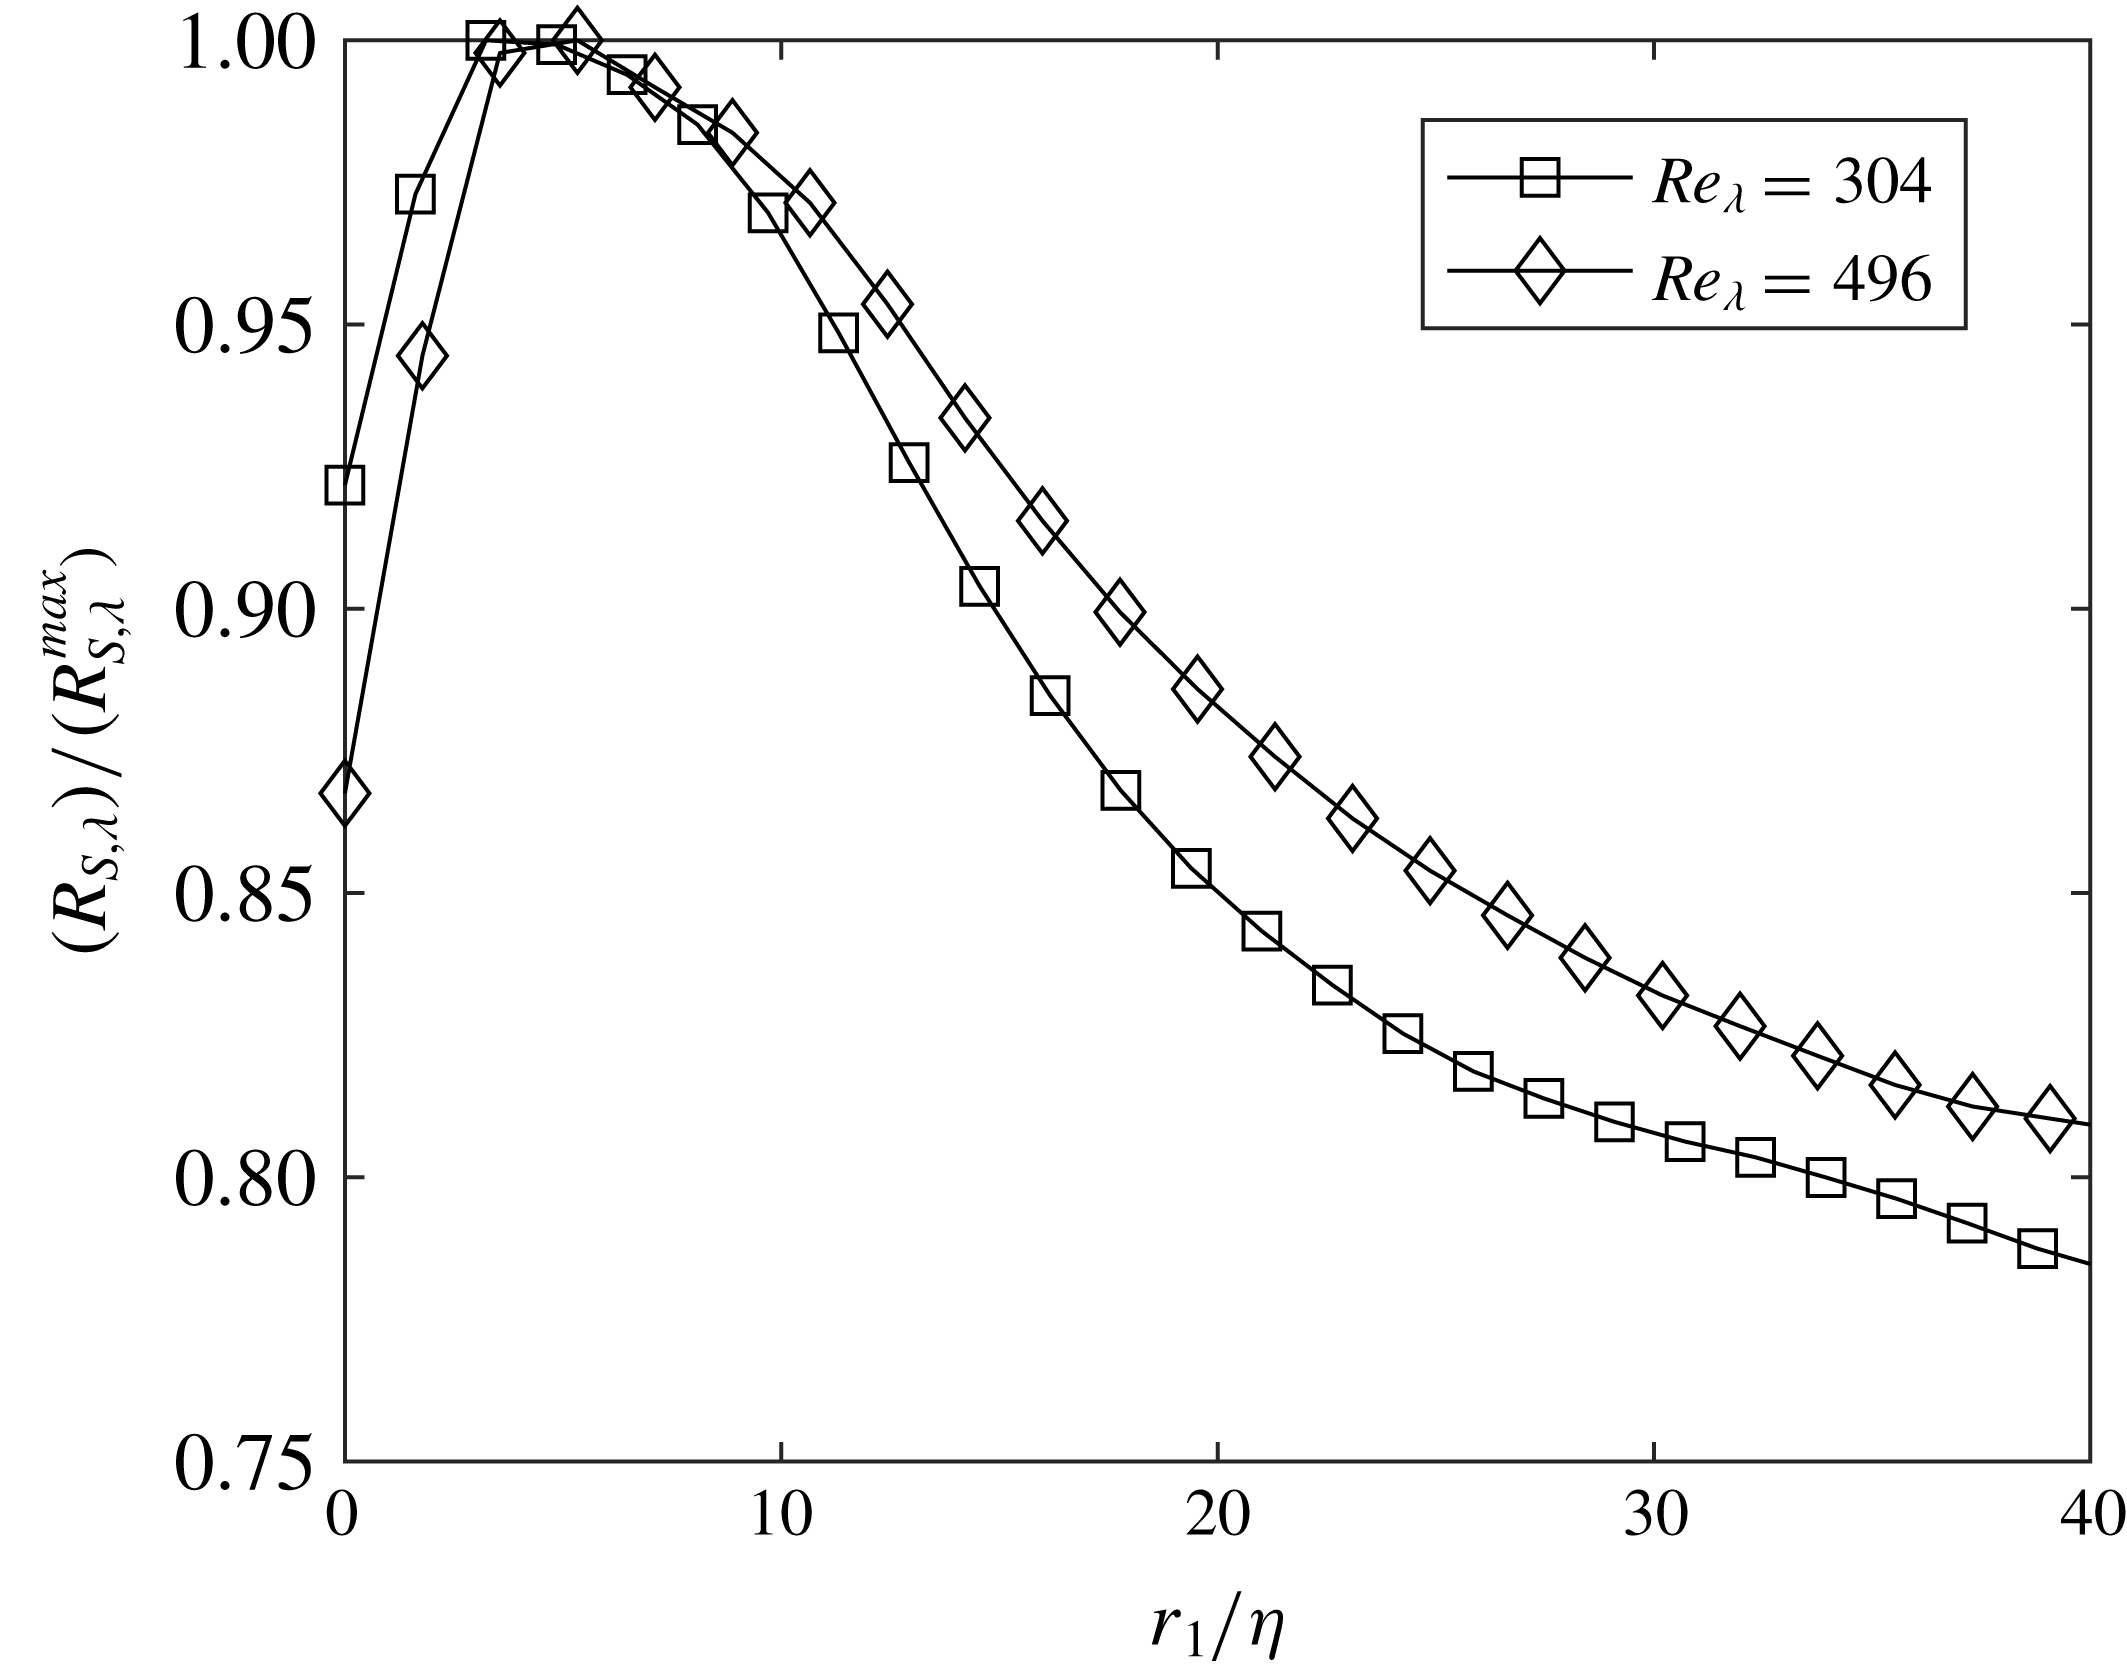
Figure 4. Correlation coefficient between strain rate and swirling strength for
![]() $Re_{\unicode[STIX]{x1D706}}=304$
(squares) and
$Re_{\unicode[STIX]{x1D706}}=304$
(squares) and
![]() $Re_{\unicode[STIX]{x1D706}}=496$
(diamonds).
$Re_{\unicode[STIX]{x1D706}}=496$
(diamonds).
3.2 Individual structures of high strain rate and high enstrophy
The balance between rate of strain and enstrophy is often visualized using
![]() $Q$
, the second invariant of the velocity-gradient tensor, which can be written as (e.g. Soria et al.
Reference Soria, Sondergaard, Cantwell, Chong and Perry1994)
$Q$
, the second invariant of the velocity-gradient tensor, which can be written as (e.g. Soria et al.
Reference Soria, Sondergaard, Cantwell, Chong and Perry1994)
where
Lawson & Dawson (Reference Lawson and Dawson2015) recently gave a remarkable example of how the
![]() $Q$
field, and in particular the topology of regions with
$Q$
field, and in particular the topology of regions with
![]() $Q>0$
(rotation-dominated) and
$Q>0$
(rotation-dominated) and
![]() $Q<0$
(strain-dominated), can be used to describe fundamental fine-scale turbulence dynamics. Here we utilize the 2-D version of these quantities to define two sets of discrete structures: those characterized by high enstrophy and those characterized by high strain. We first define thresholds
$Q<0$
(strain-dominated), can be used to describe fundamental fine-scale turbulence dynamics. Here we utilize the 2-D version of these quantities to define two sets of discrete structures: those characterized by high enstrophy and those characterized by high strain. We first define thresholds
![]() $\unicode[STIX]{x1D70F}_{\unicode[STIX]{x1D714}}$
and
$\unicode[STIX]{x1D70F}_{\unicode[STIX]{x1D714}}$
and
![]() $\unicode[STIX]{x1D70F}_{s}$
such that connected regions that satisfy
$\unicode[STIX]{x1D70F}_{s}$
such that connected regions that satisfy
![]() $Q_{\unicode[STIX]{x1D714}}>\unicode[STIX]{x1D70F}_{\unicode[STIX]{x1D714}}\langle Q_{\unicode[STIX]{x1D714}}\rangle$
and
$Q_{\unicode[STIX]{x1D714}}>\unicode[STIX]{x1D70F}_{\unicode[STIX]{x1D714}}\langle Q_{\unicode[STIX]{x1D714}}\rangle$
and
![]() $Q_{S}<\unicode[STIX]{x1D70F}_{S}\langle Q_{S}\rangle$
are identified as high-enstrophy and high-strain objects, respectively (which we will refer to as
$Q_{S}<\unicode[STIX]{x1D70F}_{S}\langle Q_{S}\rangle$
are identified as high-enstrophy and high-strain objects, respectively (which we will refer to as
![]() $Q_{\unicode[STIX]{x1D714}}$
structures and
$Q_{\unicode[STIX]{x1D714}}$
structures and
![]() $Q_{S}$
structures). In order to choose appropriate thresholds, we analyse the percolation behaviour of the structures, as first proposed by Moisy & Jiménez (Reference Moisy and Jiménez2004) in their study in homogeneous turbulence. The procedure was later applied to coherent structures in several configurations, including channel flows (Lozano-Durán, Flores & Jiménez Reference Lozano-Durán, Flores and Jiménez2012) and free shear flows (Dong et al.
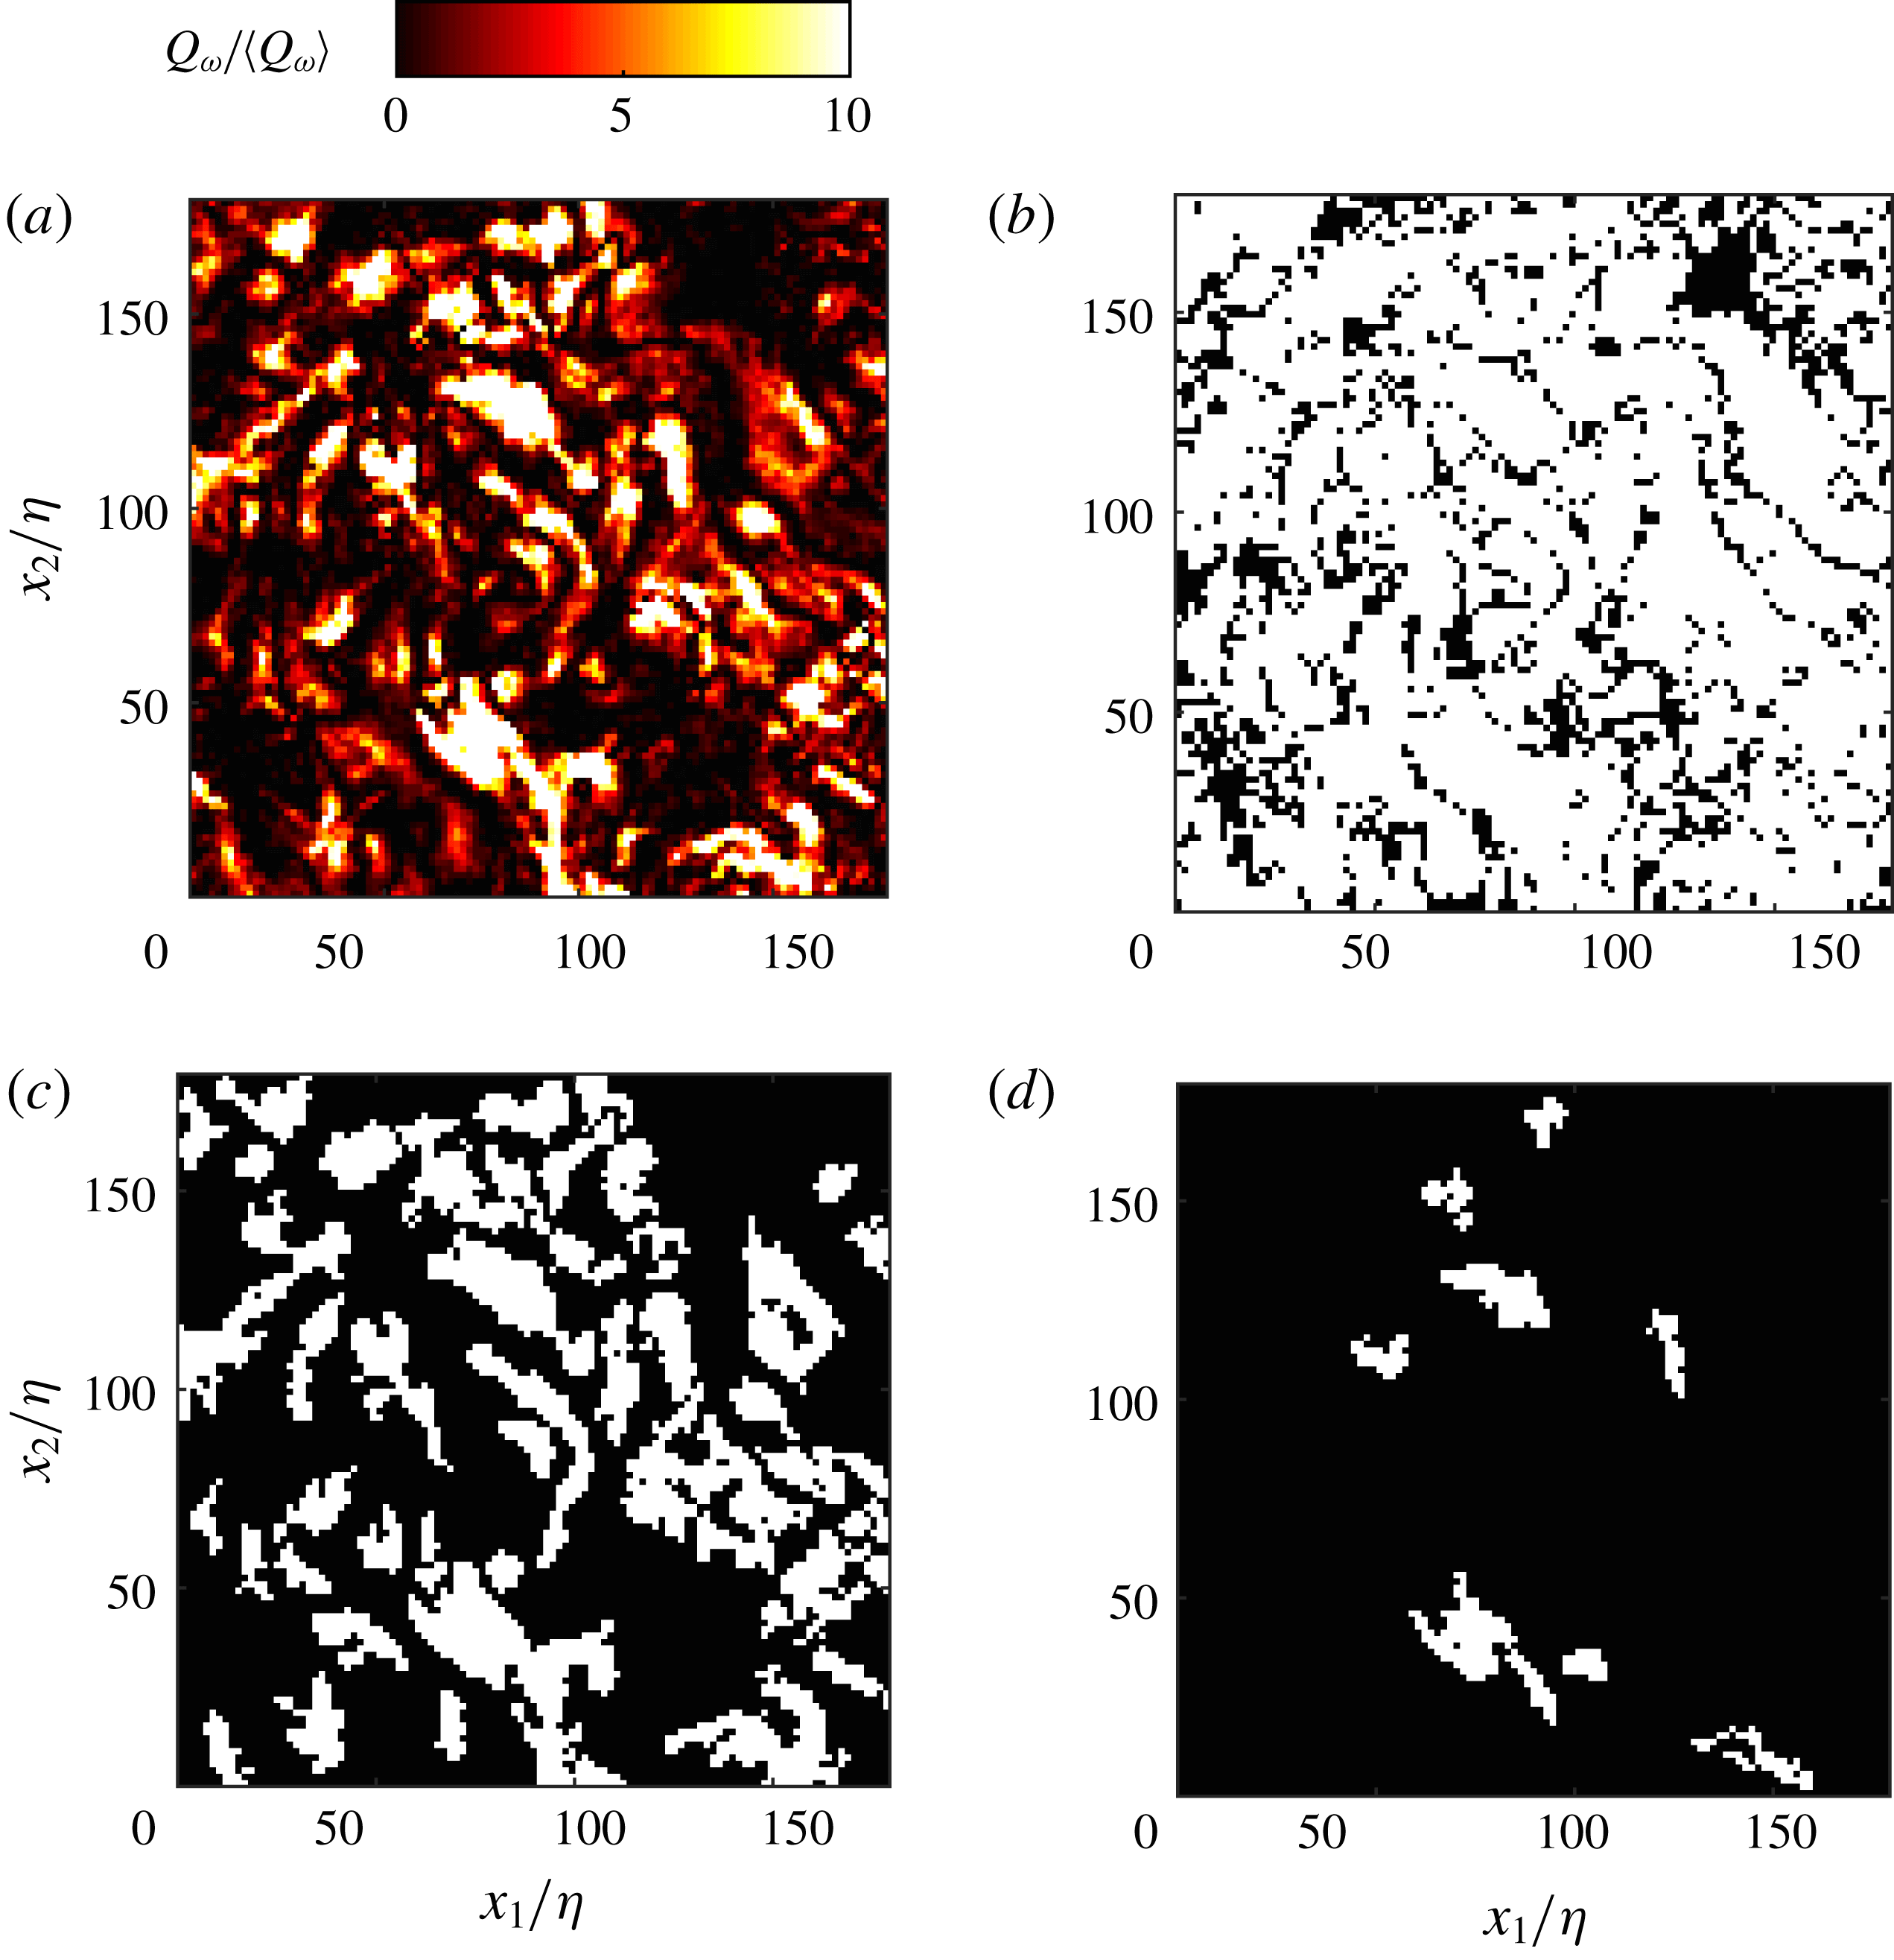
Reference Dong, Lozano-Durán, Sekimoto and Jiménez2017). For high values of the threshold, we expect to find a few small objects within the field of view, which grow in size and in number as the threshold is reduced. As the latter is further lowered, the objects start to merge, thus their number decreases until a single macro-structure occupies the entire domain. Figure 5 illustrates this behaviour in a sample realization at
$Q_{S}$
structures). In order to choose appropriate thresholds, we analyse the percolation behaviour of the structures, as first proposed by Moisy & Jiménez (Reference Moisy and Jiménez2004) in their study in homogeneous turbulence. The procedure was later applied to coherent structures in several configurations, including channel flows (Lozano-Durán, Flores & Jiménez Reference Lozano-Durán, Flores and Jiménez2012) and free shear flows (Dong et al.
Reference Dong, Lozano-Durán, Sekimoto and Jiménez2017). For high values of the threshold, we expect to find a few small objects within the field of view, which grow in size and in number as the threshold is reduced. As the latter is further lowered, the objects start to merge, thus their number decreases until a single macro-structure occupies the entire domain. Figure 5 illustrates this behaviour in a sample realization at
![]() $Re_{\unicode[STIX]{x1D706}}=304$
, with the
$Re_{\unicode[STIX]{x1D706}}=304$
, with the
![]() $Q_{\unicode[STIX]{x1D714}}$
field binarized by a range of threshold levels. We disregard objects that touch the border of the field of view, as their full spatial extent could be underestimated. This selection criterion may bias the detection towards smaller objects, but it was verified that none of the conclusions drawn were qualitatively affected by it.
$Q_{\unicode[STIX]{x1D714}}$
field binarized by a range of threshold levels. We disregard objects that touch the border of the field of view, as their full spatial extent could be underestimated. This selection criterion may bias the detection towards smaller objects, but it was verified that none of the conclusions drawn were qualitatively affected by it.
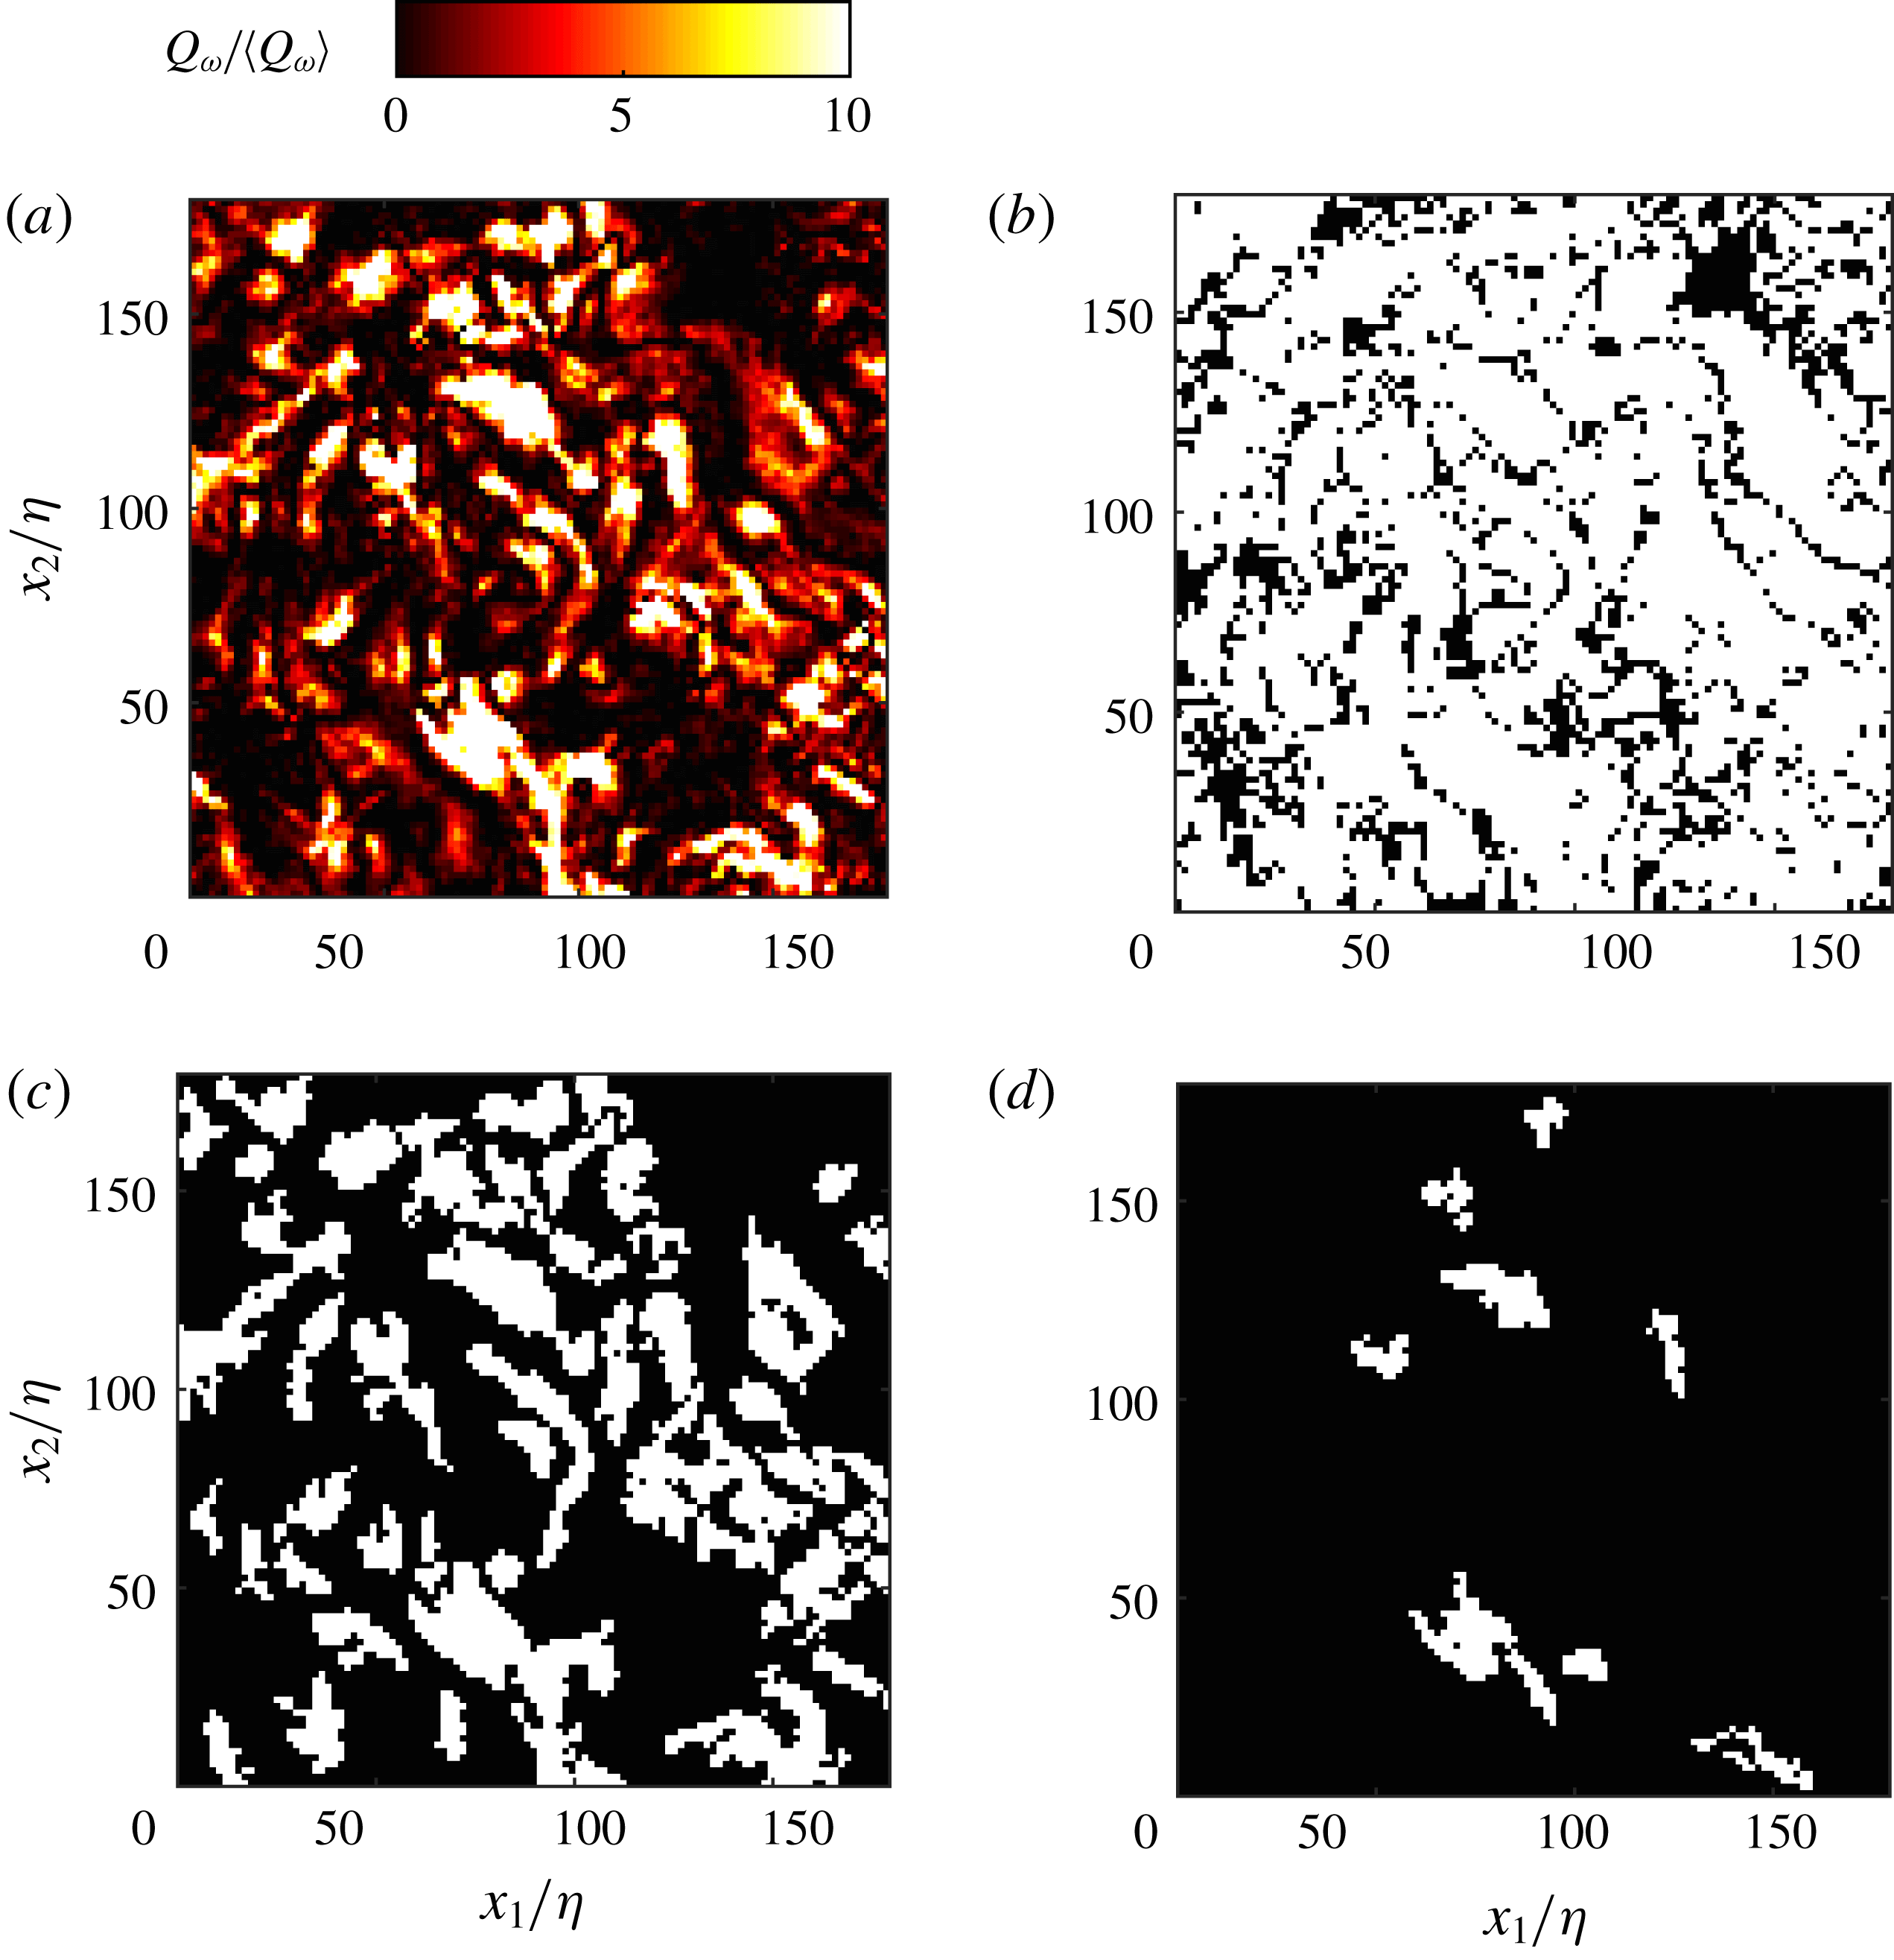
Figure 5. Normalized instantaneous
![]() $Q_{\unicode[STIX]{x1D714}}$
field (a) with resulting binary fields at thresholds
$Q_{\unicode[STIX]{x1D714}}$
field (a) with resulting binary fields at thresholds
![]() $\unicode[STIX]{x1D70F}=0.1$
(b),
$\unicode[STIX]{x1D70F}=0.1$
(b),
![]() $\unicode[STIX]{x1D70F}=2.0$
(c) and
$\unicode[STIX]{x1D70F}=2.0$
(c) and
![]() $\unicode[STIX]{x1D70F}=10$
(d) for a sample at
$\unicode[STIX]{x1D70F}=10$
(d) for a sample at
![]() $Re_{\unicode[STIX]{x1D706}}=304$
.
$Re_{\unicode[STIX]{x1D706}}=304$
.
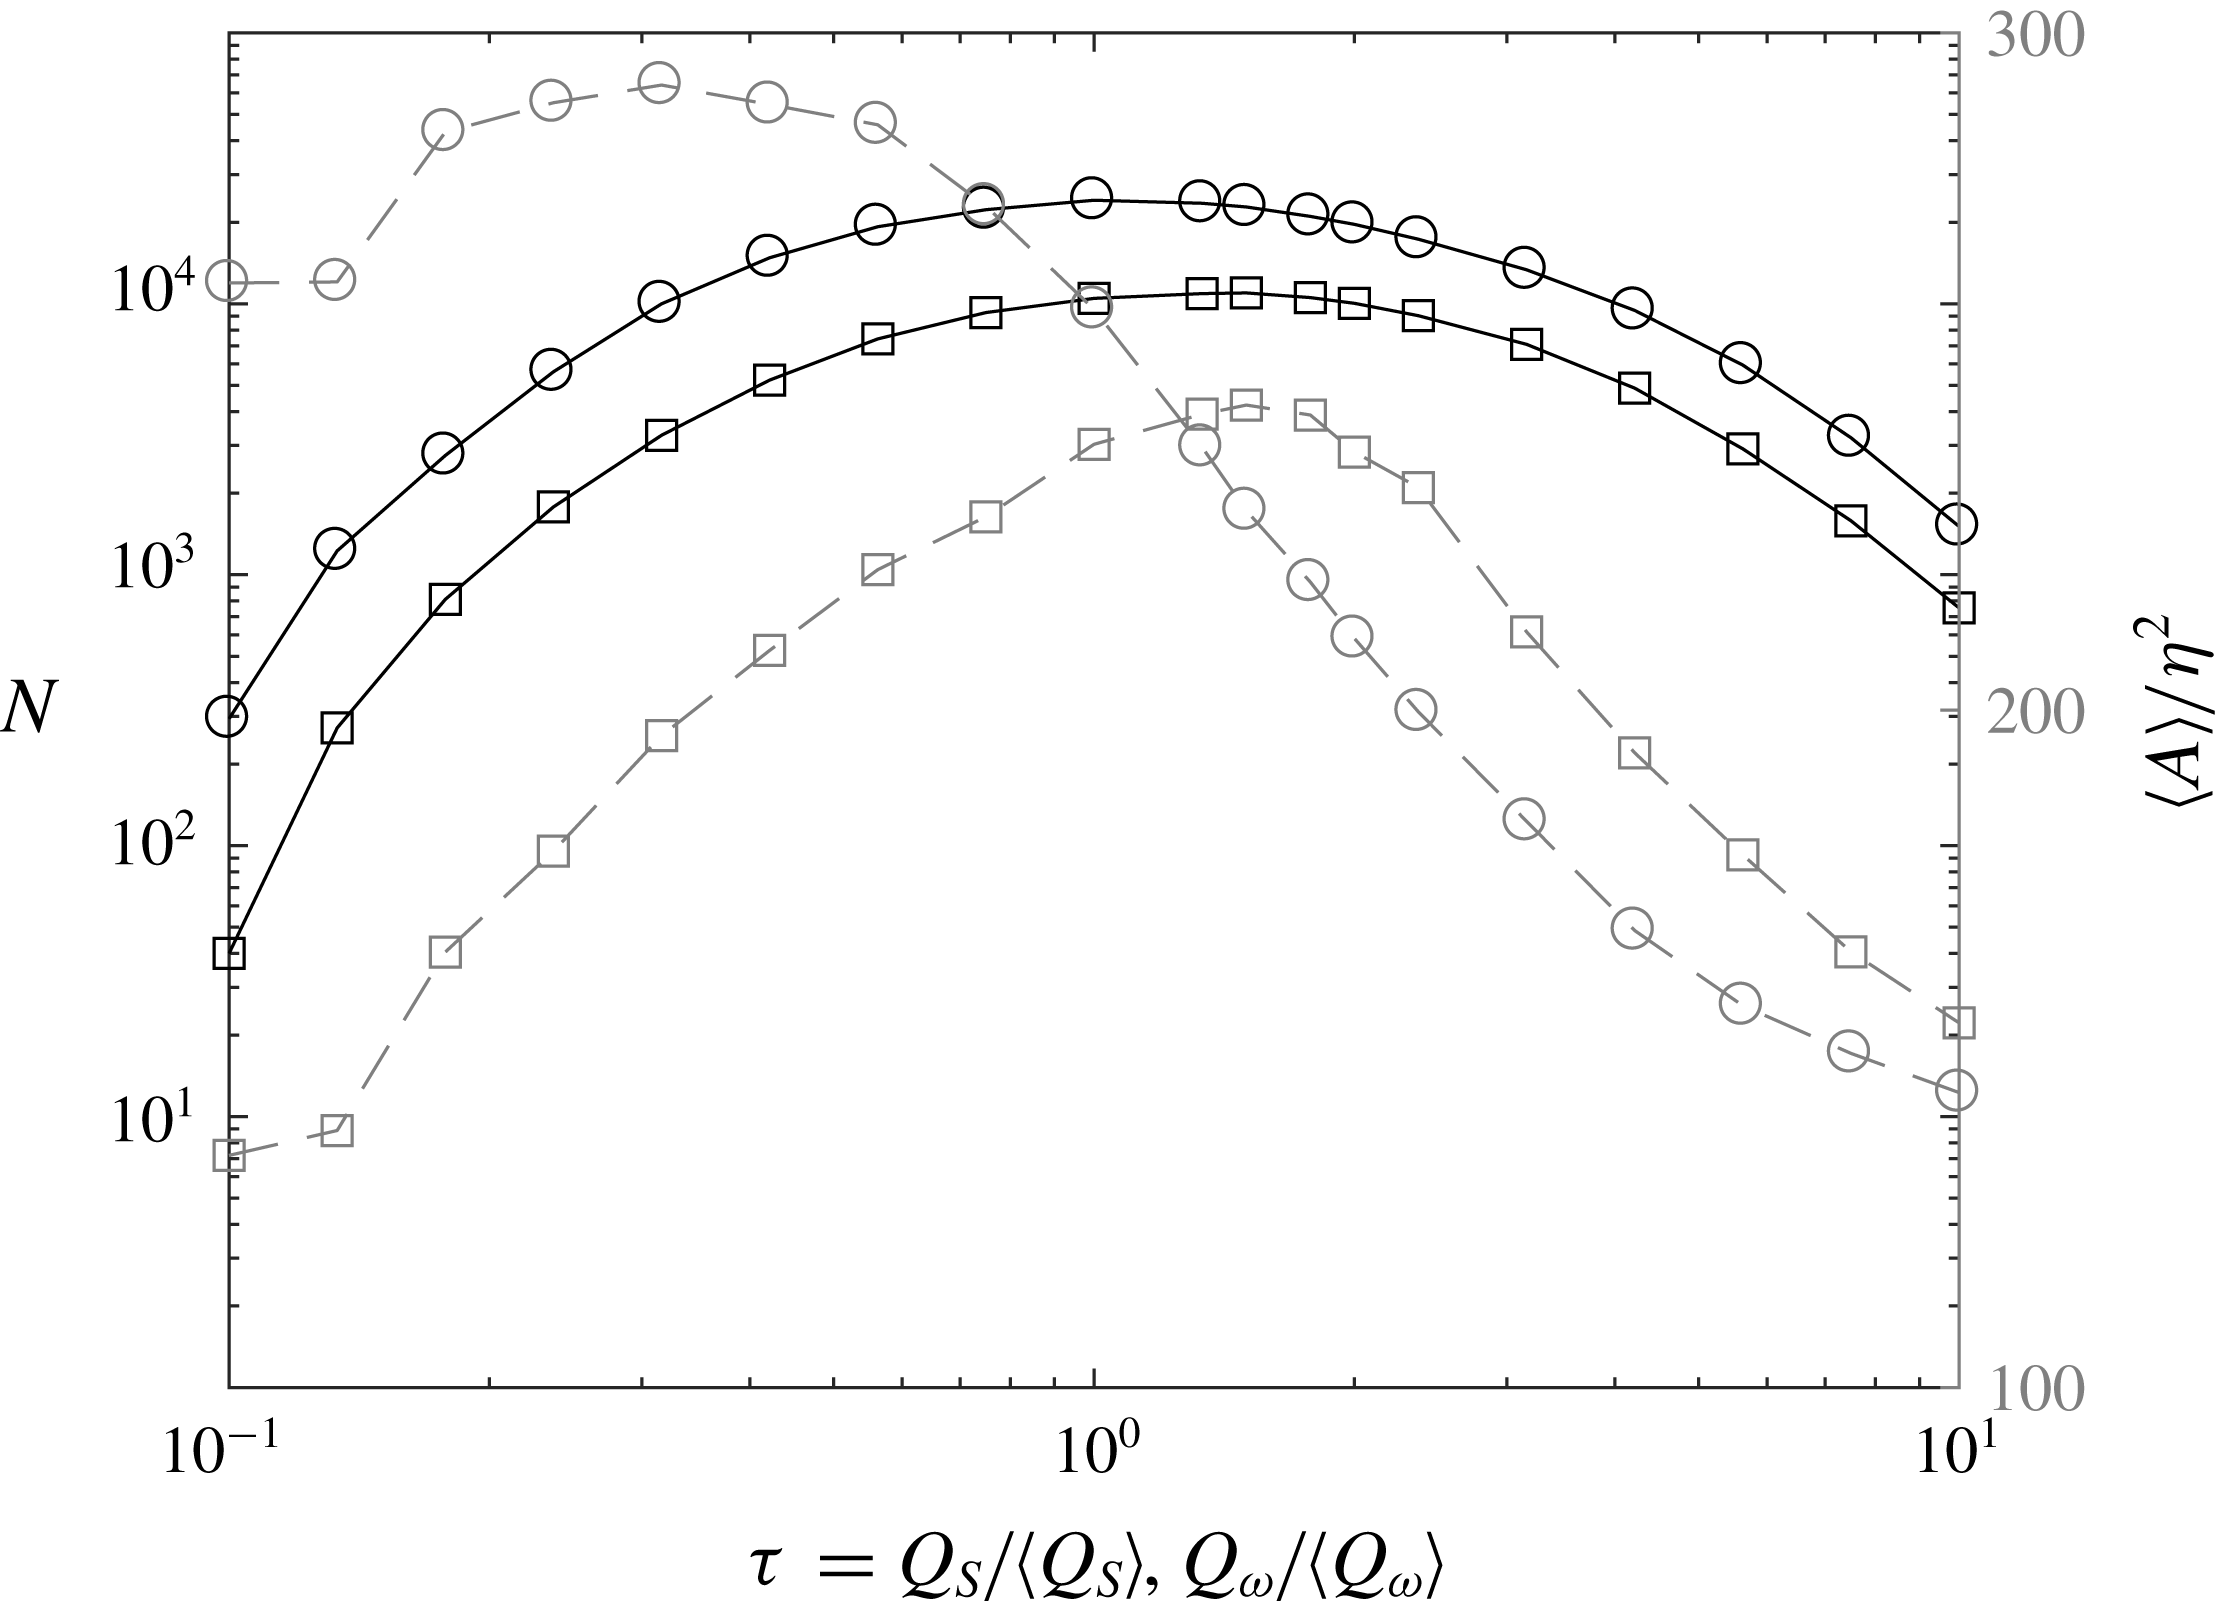
Figure 6 shows the percolation diagram of both types of structures for the
![]() $Re_{\unicode[STIX]{x1D706}}=496$
case, plotting the total number of identified objects and their average area (normalized by the Kolmogorov unit area
$Re_{\unicode[STIX]{x1D706}}=496$
case, plotting the total number of identified objects and their average area (normalized by the Kolmogorov unit area
![]() $\unicode[STIX]{x1D702}^{2}$
) as a function of the threshold value. The other
$\unicode[STIX]{x1D702}^{2}$
) as a function of the threshold value. The other
![]() $Re_{\unicode[STIX]{x1D706}}$
cases give similar results. The high-enstrophy objects follow the expected trend, with the maximum number of identified structures occurring in the middle of the percolation crisis (i.e. the threshold range over which the average structure size drops steeply). The average area of the high-strain objects displays a non-monotonic trend, due to several large structures touching the image borders and being discarded for low values of
$Re_{\unicode[STIX]{x1D706}}$
cases give similar results. The high-enstrophy objects follow the expected trend, with the maximum number of identified structures occurring in the middle of the percolation crisis (i.e. the threshold range over which the average structure size drops steeply). The average area of the high-strain objects displays a non-monotonic trend, due to several large structures touching the image borders and being discarded for low values of
![]() $\unicode[STIX]{x1D70F}_{S}$
; their number, however, follows a similar trend to the high-enstrophy objects. Therefore, we choose for simplicity
$\unicode[STIX]{x1D70F}_{S}$
; their number, however, follows a similar trend to the high-enstrophy objects. Therefore, we choose for simplicity
![]() $\unicode[STIX]{x1D70F}_{\unicode[STIX]{x1D714}}=\unicode[STIX]{x1D70F}_{S}=\unicode[STIX]{x1D70F}$
. Various values are considered, and the results are qualitatively similar in the range
$\unicode[STIX]{x1D70F}_{\unicode[STIX]{x1D714}}=\unicode[STIX]{x1D70F}_{S}=\unicode[STIX]{x1D70F}$
. Various values are considered, and the results are qualitatively similar in the range
![]() $2\leqslant \unicode[STIX]{x1D70F}\leqslant 6$
. Taking the maximization of the number of objects as a criterion for choosing the threshold (Lozano-Durán et al.
Reference Lozano-Durán, Flores and Jiménez2012), we select
$2\leqslant \unicode[STIX]{x1D70F}\leqslant 6$
. Taking the maximization of the number of objects as a criterion for choosing the threshold (Lozano-Durán et al.
Reference Lozano-Durán, Flores and Jiménez2012), we select
![]() $\unicode[STIX]{x1D70F}=2$
. Because we aim to describe the structure topology, in the following analysis we discard objects comprising less than 25 grid cells (the grid being defined by the velocity vector spacing). This corresponds to
$\unicode[STIX]{x1D70F}=2$
. Because we aim to describe the structure topology, in the following analysis we discard objects comprising less than 25 grid cells (the grid being defined by the velocity vector spacing). This corresponds to
![]() ${\sim}80\unicode[STIX]{x1D702}^{2}$
, roughly the area of a circle of radius
${\sim}80\unicode[STIX]{x1D702}^{2}$
, roughly the area of a circle of radius
![]() $5\unicode[STIX]{x1D702}$
. While smaller objects may be dynamically significant, the results are only weakly dependent on this limit, and we find that the conclusions remain essentially unchanged lowering the threshold down to 16 grid cells.
$5\unicode[STIX]{x1D702}$
. While smaller objects may be dynamically significant, the results are only weakly dependent on this limit, and we find that the conclusions remain essentially unchanged lowering the threshold down to 16 grid cells.
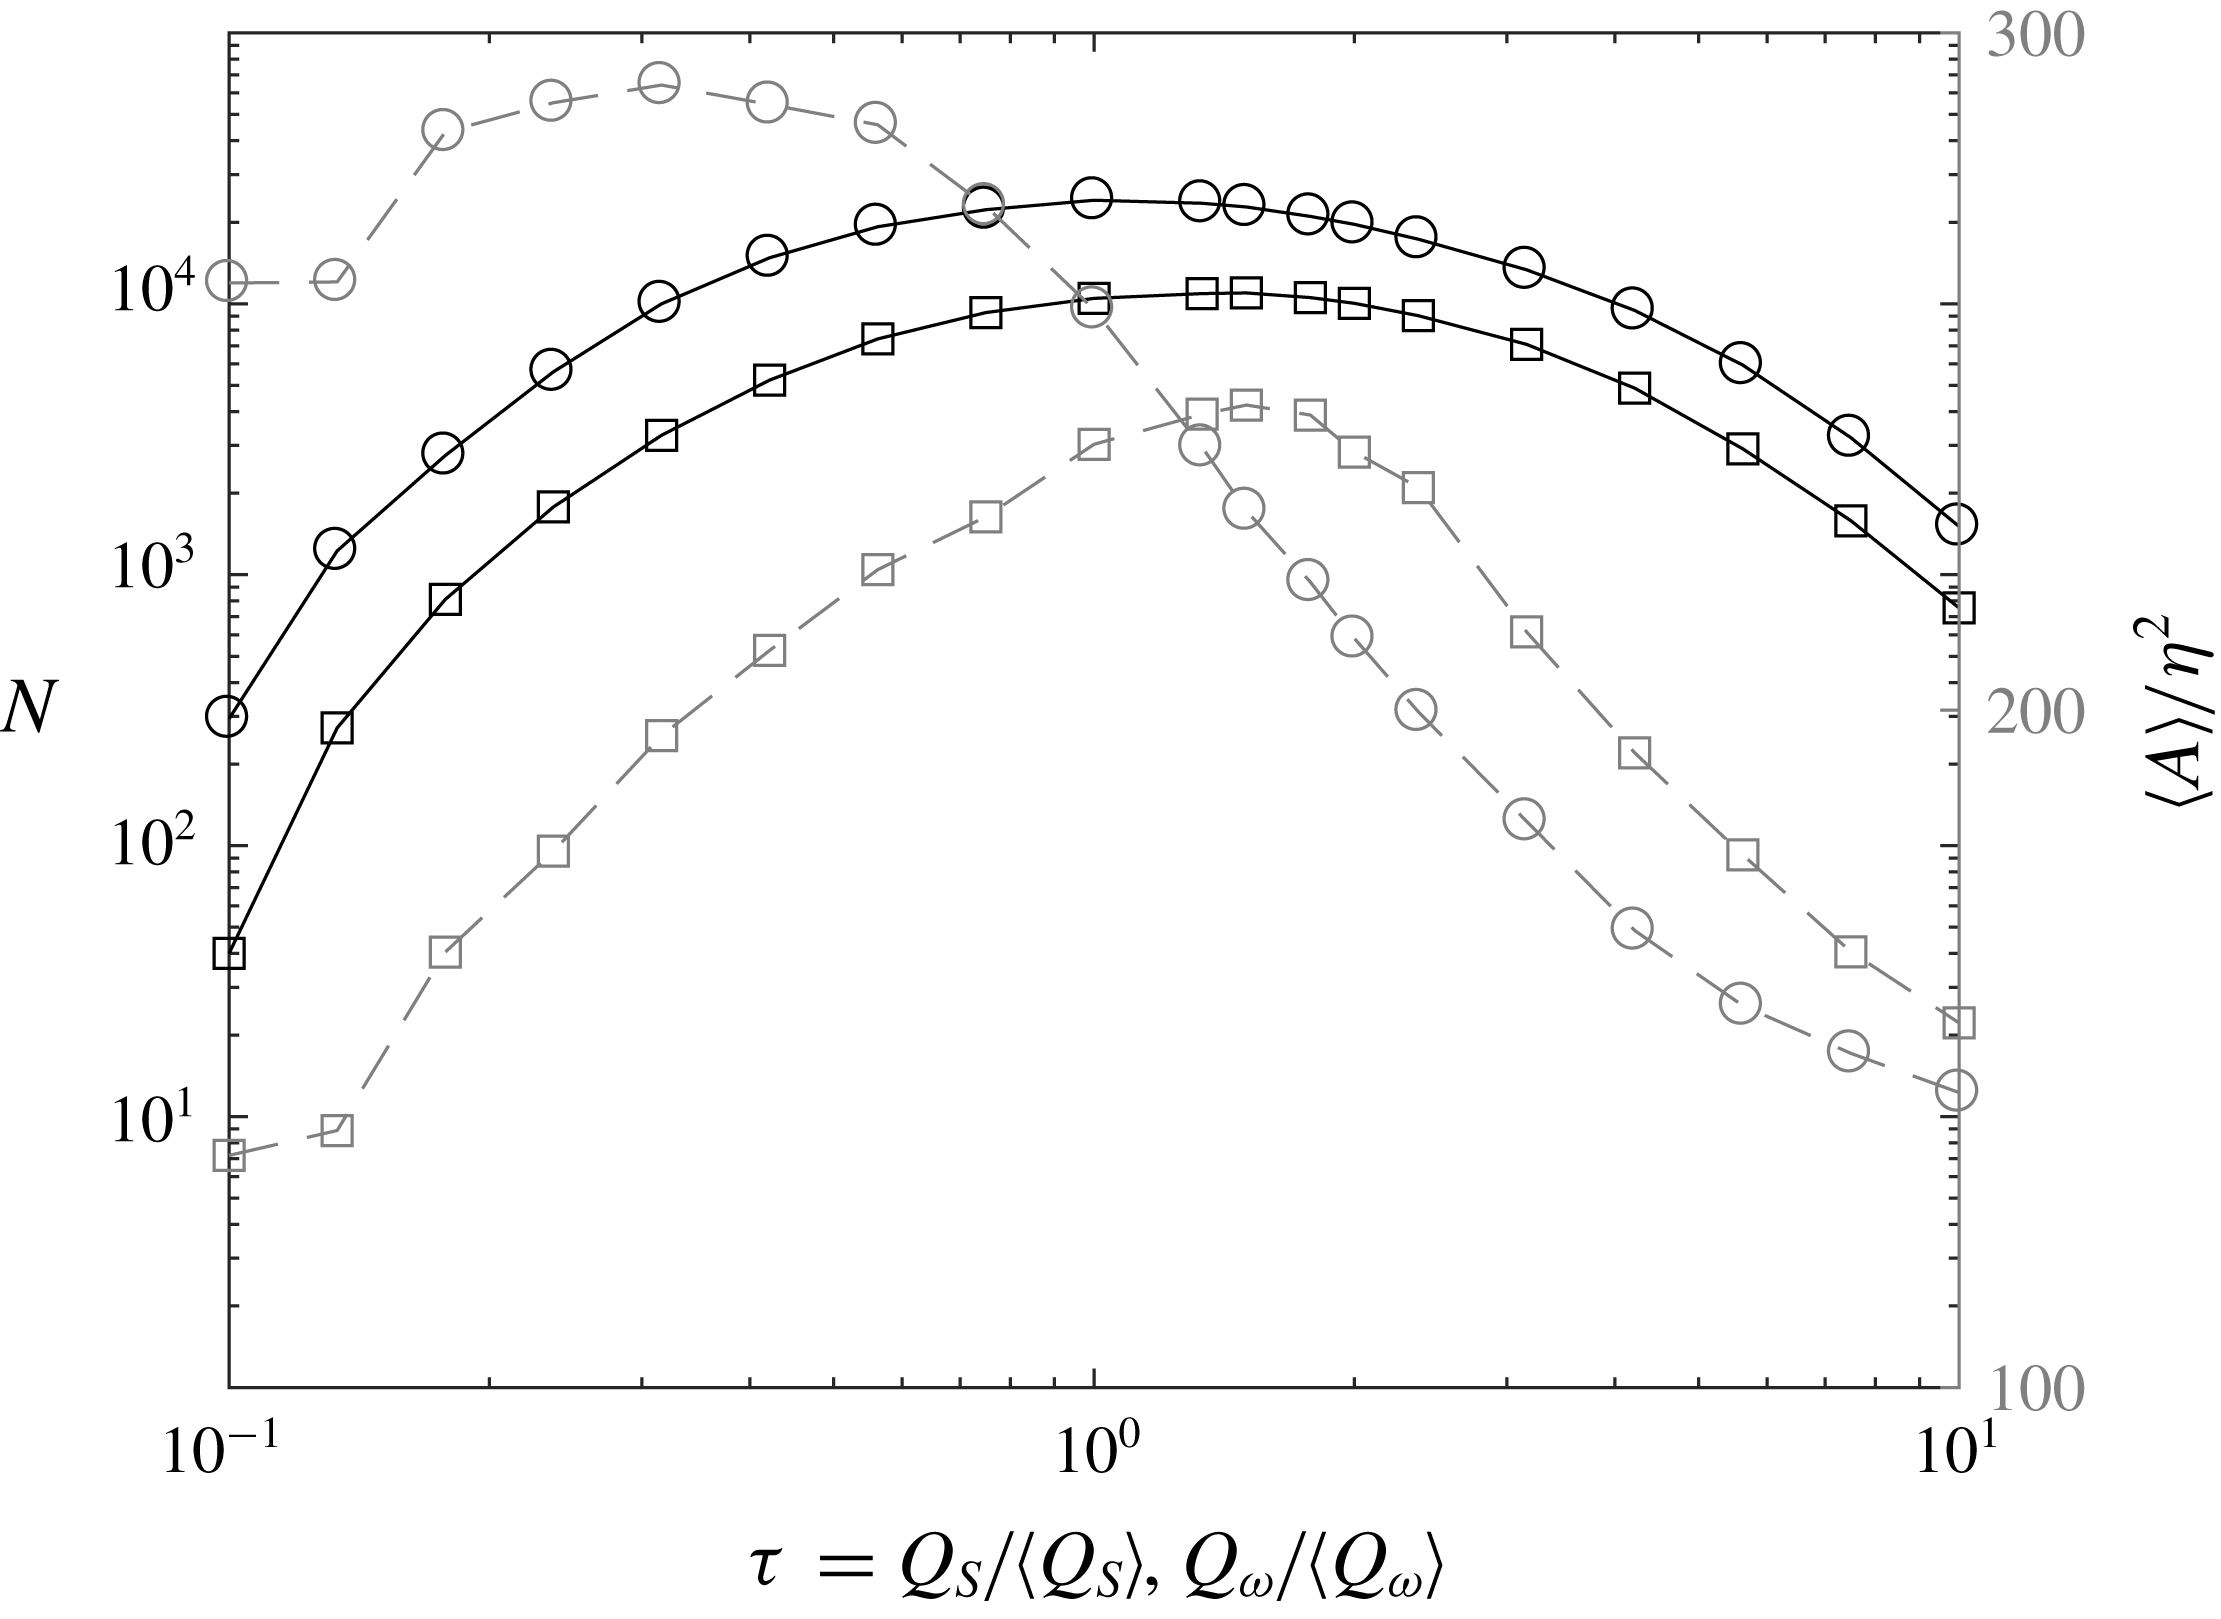
Figure 6. Percolation diagram for the case
![]() $Re_{\unicode[STIX]{x1D706}}=496$
, with the total number of structures (solid, logarithmic scale) and the mean area (dashed, linear scale) for
$Re_{\unicode[STIX]{x1D706}}=496$
, with the total number of structures (solid, logarithmic scale) and the mean area (dashed, linear scale) for
![]() $Q_{S}$
(squares) and
$Q_{S}$
(squares) and
![]() $Q_{\unicode[STIX]{x1D714}}$
(circles) structures.
$Q_{\unicode[STIX]{x1D714}}$
(circles) structures.
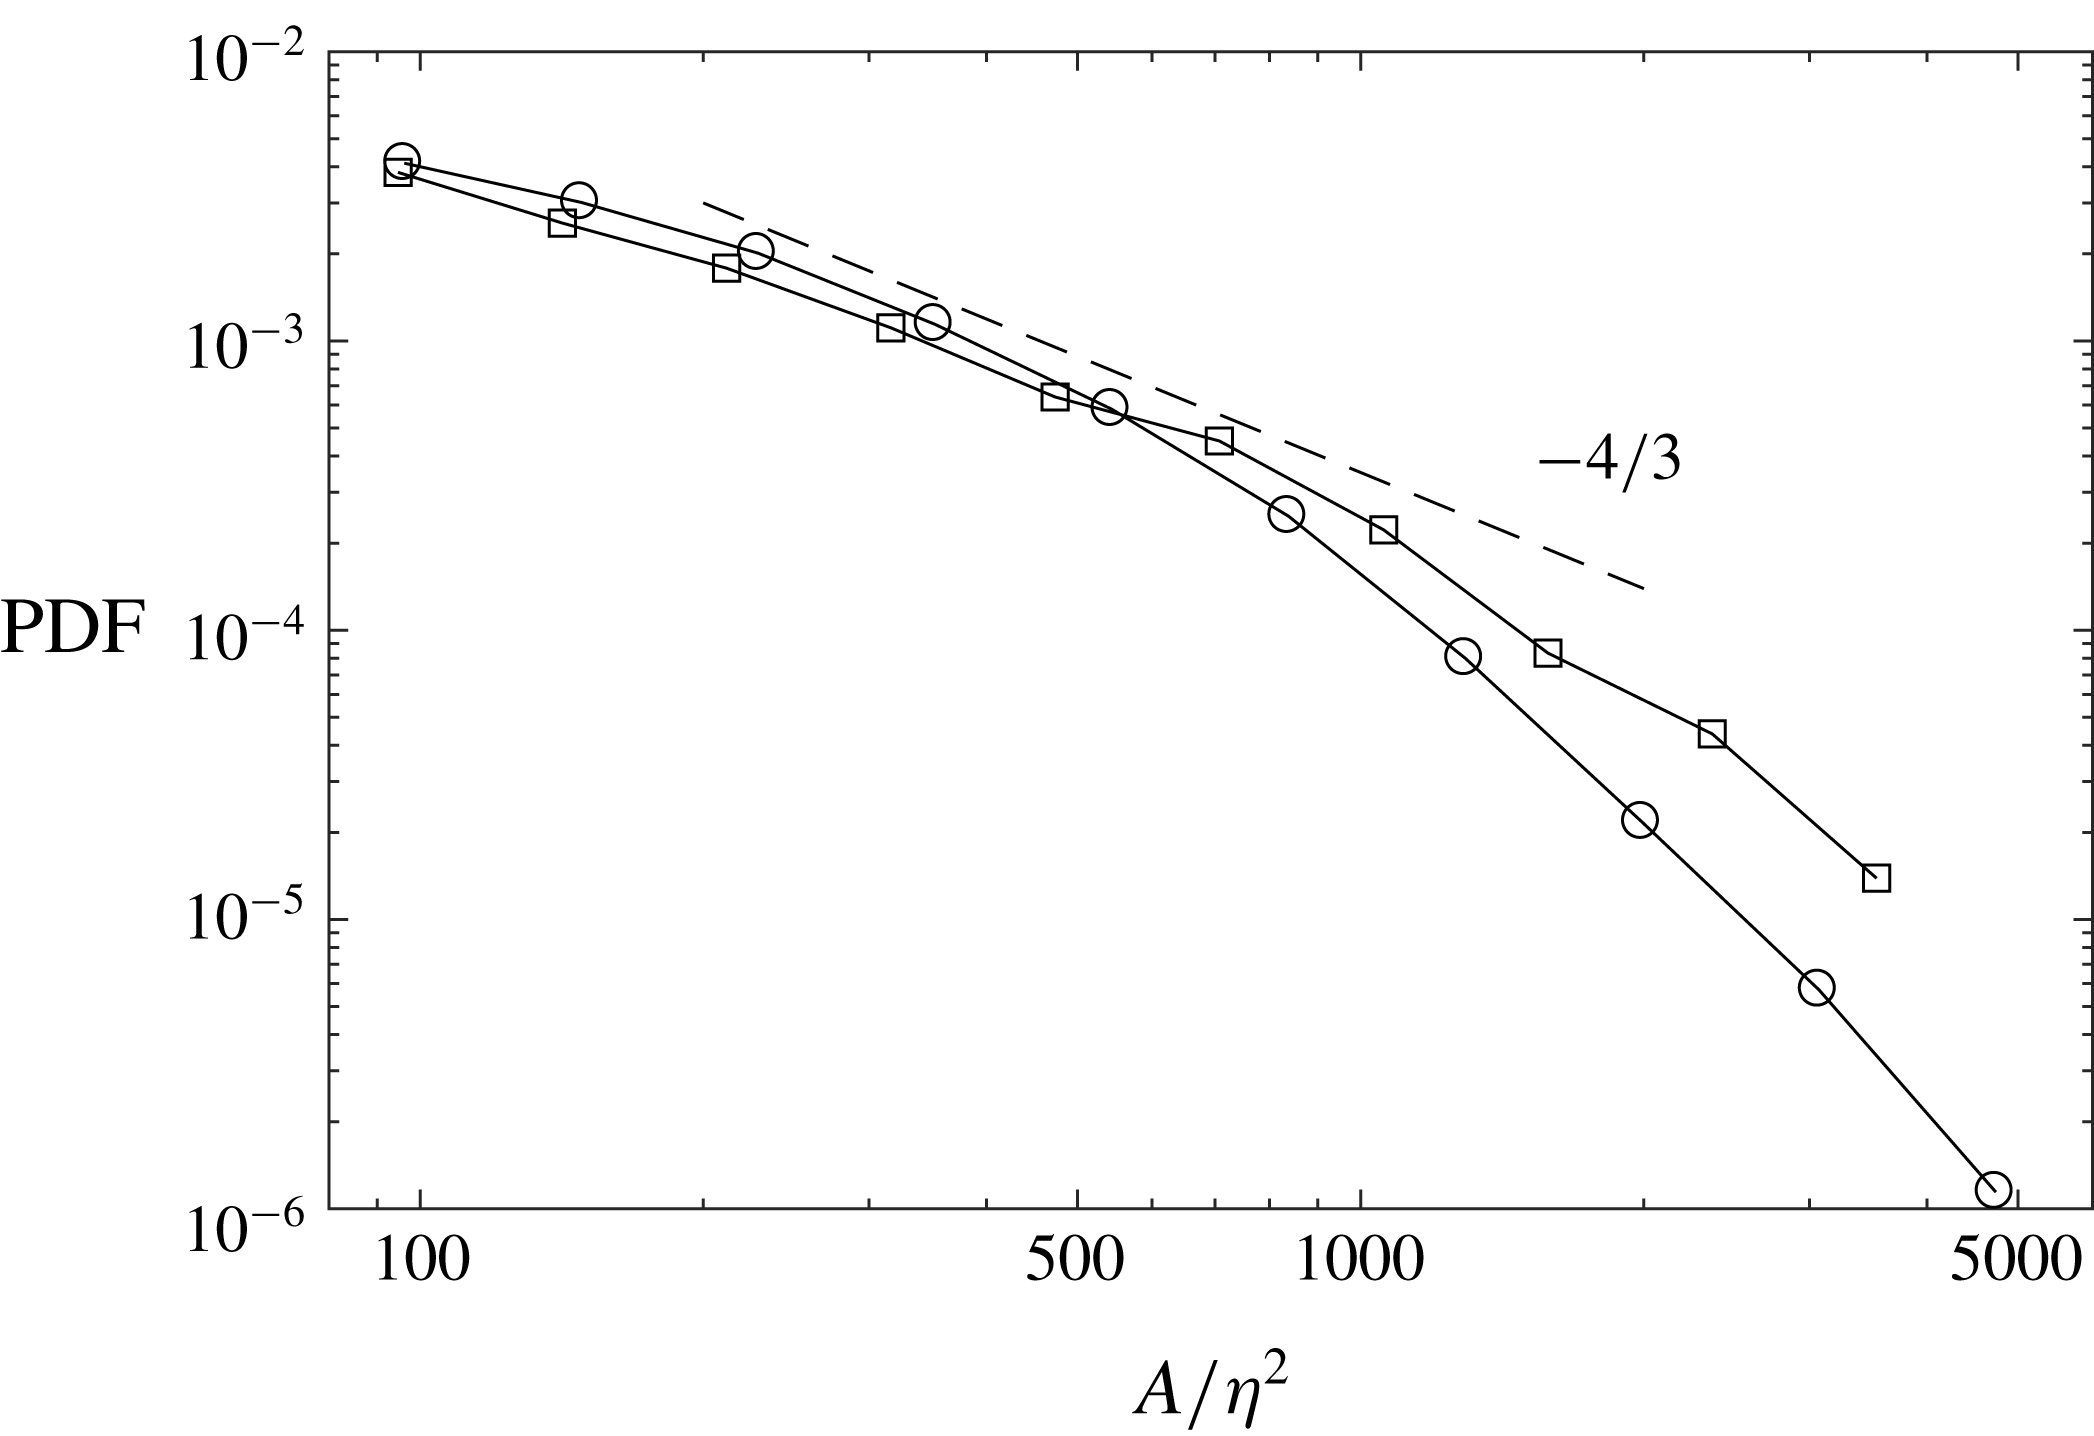
Figure 7 displays the probability distribution of the normalized object areas
![]() $A/\unicode[STIX]{x1D702}^{2}$
, for the representative case
$A/\unicode[STIX]{x1D702}^{2}$
, for the representative case
![]() $Re_{\unicode[STIX]{x1D706}}=496$
. The distributions for both
$Re_{\unicode[STIX]{x1D706}}=496$
. The distributions for both
![]() $Q_{\unicode[STIX]{x1D714}}$
and
$Q_{\unicode[STIX]{x1D714}}$
and
![]() $Q_{S}$
structures approximate, although over a limited size range, a power-law decay
$Q_{S}$
structures approximate, although over a limited size range, a power-law decay
![]() $P(A)\sim A^{-\unicode[STIX]{x1D6FC}}$
, with
$P(A)\sim A^{-\unicode[STIX]{x1D6FC}}$
, with
![]() $\unicode[STIX]{x1D6FC}\approx 4/3$
(such a size range was found to be somewhat extended when including objects touching the border). This suggests self-similarity in the structure shape, possibly associated with the scale-invariant properties of the turbulent field (Sreenivasan Reference Sreenivasan1991; Moisy & Jiménez Reference Moisy and Jiménez2004). Moisy & Jiménez (Reference Moisy and Jiménez2004) considered the volume PDFs for three-dimensional structures of intense strain and enstrophy, and found power-law decays with
$\unicode[STIX]{x1D6FC}\approx 4/3$
(such a size range was found to be somewhat extended when including objects touching the border). This suggests self-similarity in the structure shape, possibly associated with the scale-invariant properties of the turbulent field (Sreenivasan Reference Sreenivasan1991; Moisy & Jiménez Reference Moisy and Jiménez2004). Moisy & Jiménez (Reference Moisy and Jiménez2004) considered the volume PDFs for three-dimensional structures of intense strain and enstrophy, and found power-law decays with
![]() $\unicode[STIX]{x1D6FC}\approx 2$
for both. As will be discussed later, the relation between the scale-invariant exponents of 3-D objects and their corresponding 2-D cross-sections is not trivial.
$\unicode[STIX]{x1D6FC}\approx 2$
for both. As will be discussed later, the relation between the scale-invariant exponents of 3-D objects and their corresponding 2-D cross-sections is not trivial.
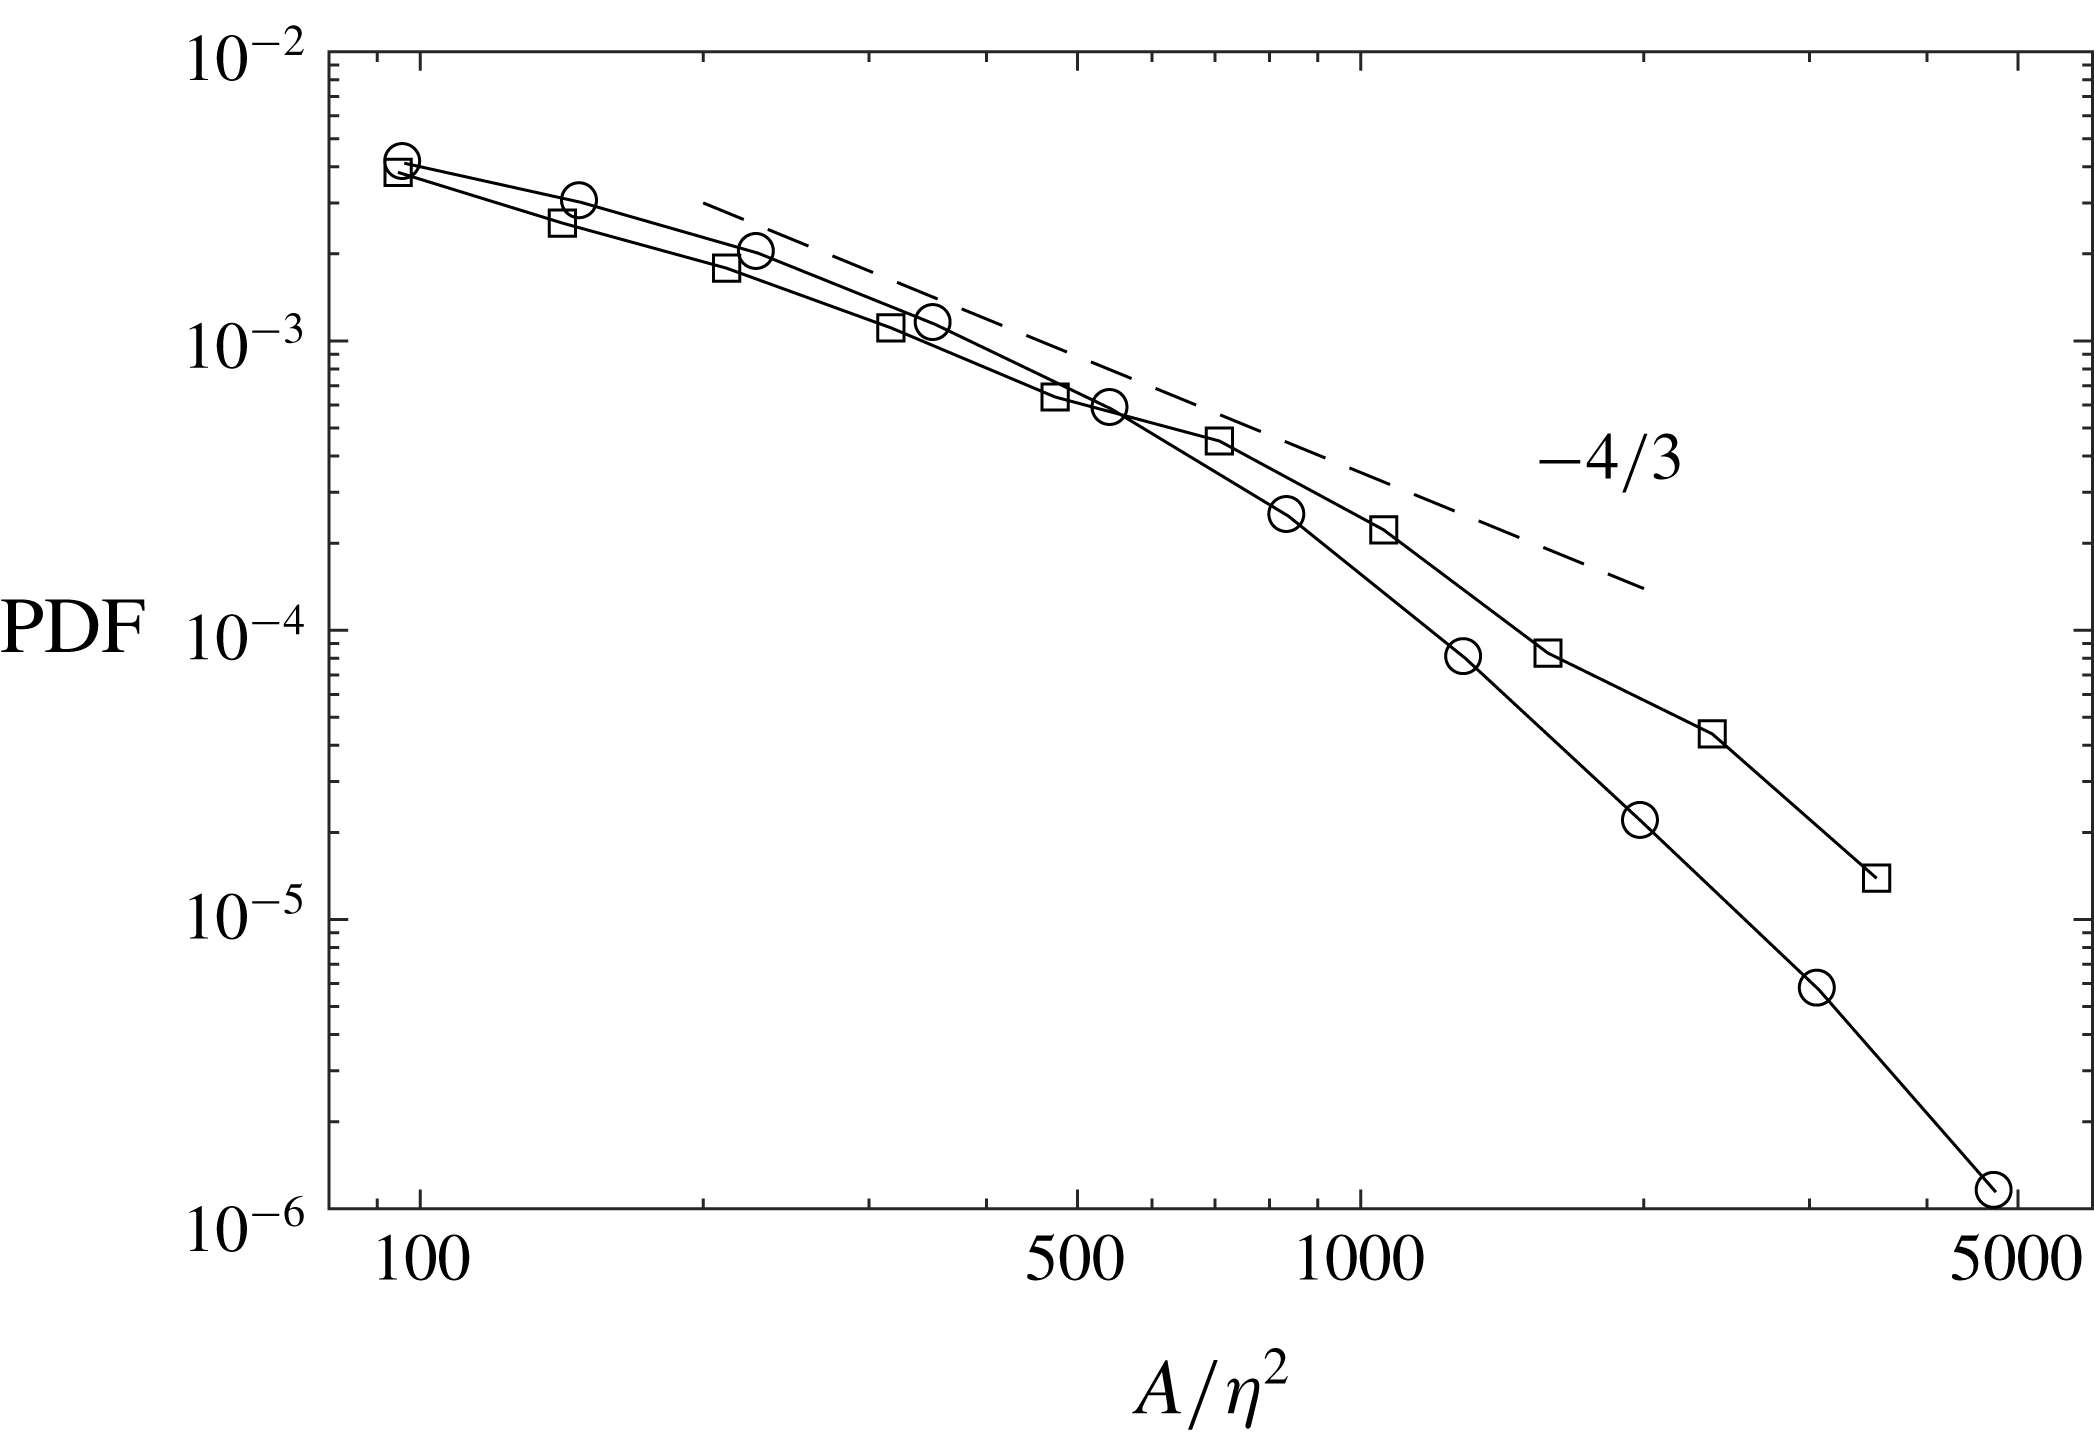
Figure 7. PDF of structure areas for
![]() $Re_{\unicode[STIX]{x1D706}}=496$
in log–log coordinates for
$Re_{\unicode[STIX]{x1D706}}=496$
in log–log coordinates for
![]() $Q_{S}$
(squares) and
$Q_{S}$
(squares) and
![]() $Q_{\unicode[STIX]{x1D714}}$
(circles) structures. The dashed line corresponds to a power law with exponent
$Q_{\unicode[STIX]{x1D714}}$
(circles) structures. The dashed line corresponds to a power law with exponent
![]() $-4/3$
.
$-4/3$
.
In order to characterize the physical size of the intense structures, we consider the inner and outer dimensions
![]() $R_{1}$
and
$R_{1}$
and
![]() $R_{2}$
, i.e. the side length of the largest inscribed and the smallest circumscribed squares, respectively. These were previously used to describe 3-D coherent structures and their 2-D cross-sections in various turbulent flows (Catrakis & Dimotakis Reference Catrakis and Dimotakis1996; Moisy & Jiménez Reference Moisy and Jiménez2004; Lozano-Durán et al.
Reference Lozano-Durán, Flores and Jiménez2012; Dong et al.
Reference Dong, Lozano-Durán, Sekimoto and Jiménez2017). Figure 8(a,b) displays the distributions of
$R_{2}$
, i.e. the side length of the largest inscribed and the smallest circumscribed squares, respectively. These were previously used to describe 3-D coherent structures and their 2-D cross-sections in various turbulent flows (Catrakis & Dimotakis Reference Catrakis and Dimotakis1996; Moisy & Jiménez Reference Moisy and Jiménez2004; Lozano-Durán et al.
Reference Lozano-Durán, Flores and Jiménez2012; Dong et al.
Reference Dong, Lozano-Durán, Sekimoto and Jiménez2017). Figure 8(a,b) displays the distributions of
![]() $R_{1}$
for
$R_{1}$
for
![]() $Q_{S}$
and
$Q_{S}$
and
![]() $Q_{\unicode[STIX]{x1D714}}$
structures, respectively. The inner dimension is a measure of the thickness of the branches forming each object, and as such is not expected to be strongly biased by the fact that the objects are sections of 3-D structures. The values are narrowly distributed around
$Q_{\unicode[STIX]{x1D714}}$
structures, respectively. The inner dimension is a measure of the thickness of the branches forming each object, and as such is not expected to be strongly biased by the fact that the objects are sections of 3-D structures. The values are narrowly distributed around
![]() $2$
–
$2$
–
![]() $4\unicode[STIX]{x1D702}$
for both object types, with no discernible dependence on the Reynolds number. This is consistent with the expected Kolmogorov scaling of high-enstrophy tubes and high-dissipation sheets (Jiménez et al.
Reference Jiménez, Wray, Saffman and Rogallo1993; Ganapathisubramani et al.
Reference Ganapathisubramani, Lakshminarasimhan and Clemens2008; Herpin et al.
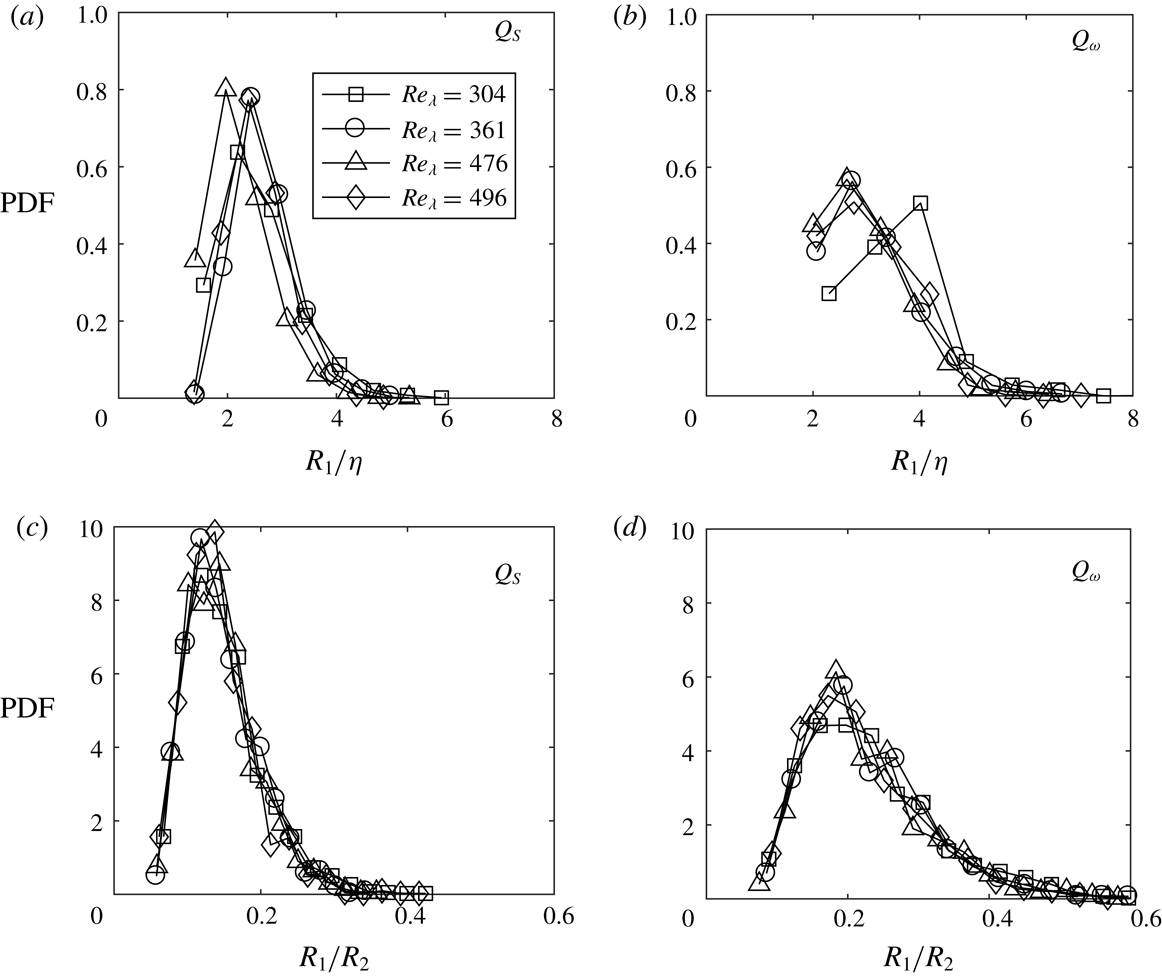
Reference Herpin, Stanislas, Foucaut and Coudert2013), and agrees with our estimates from the autocorrelation plots (figure 3). Moreover, the absence of specific trends (e.g. with the size of the structures) corroborates the observation of Lozano-Durán et al. (Reference Lozano-Durán, Flores and Jiménez2012) and Dong et al. (Reference Dong, Lozano-Durán, Sekimoto and Jiménez2017) that even large coherent structures are essentially clusters of thin branches with dissipative-scale thickness.
$4\unicode[STIX]{x1D702}$
for both object types, with no discernible dependence on the Reynolds number. This is consistent with the expected Kolmogorov scaling of high-enstrophy tubes and high-dissipation sheets (Jiménez et al.
Reference Jiménez, Wray, Saffman and Rogallo1993; Ganapathisubramani et al.
Reference Ganapathisubramani, Lakshminarasimhan and Clemens2008; Herpin et al.
Reference Herpin, Stanislas, Foucaut and Coudert2013), and agrees with our estimates from the autocorrelation plots (figure 3). Moreover, the absence of specific trends (e.g. with the size of the structures) corroborates the observation of Lozano-Durán et al. (Reference Lozano-Durán, Flores and Jiménez2012) and Dong et al. (Reference Dong, Lozano-Durán, Sekimoto and Jiménez2017) that even large coherent structures are essentially clusters of thin branches with dissipative-scale thickness.
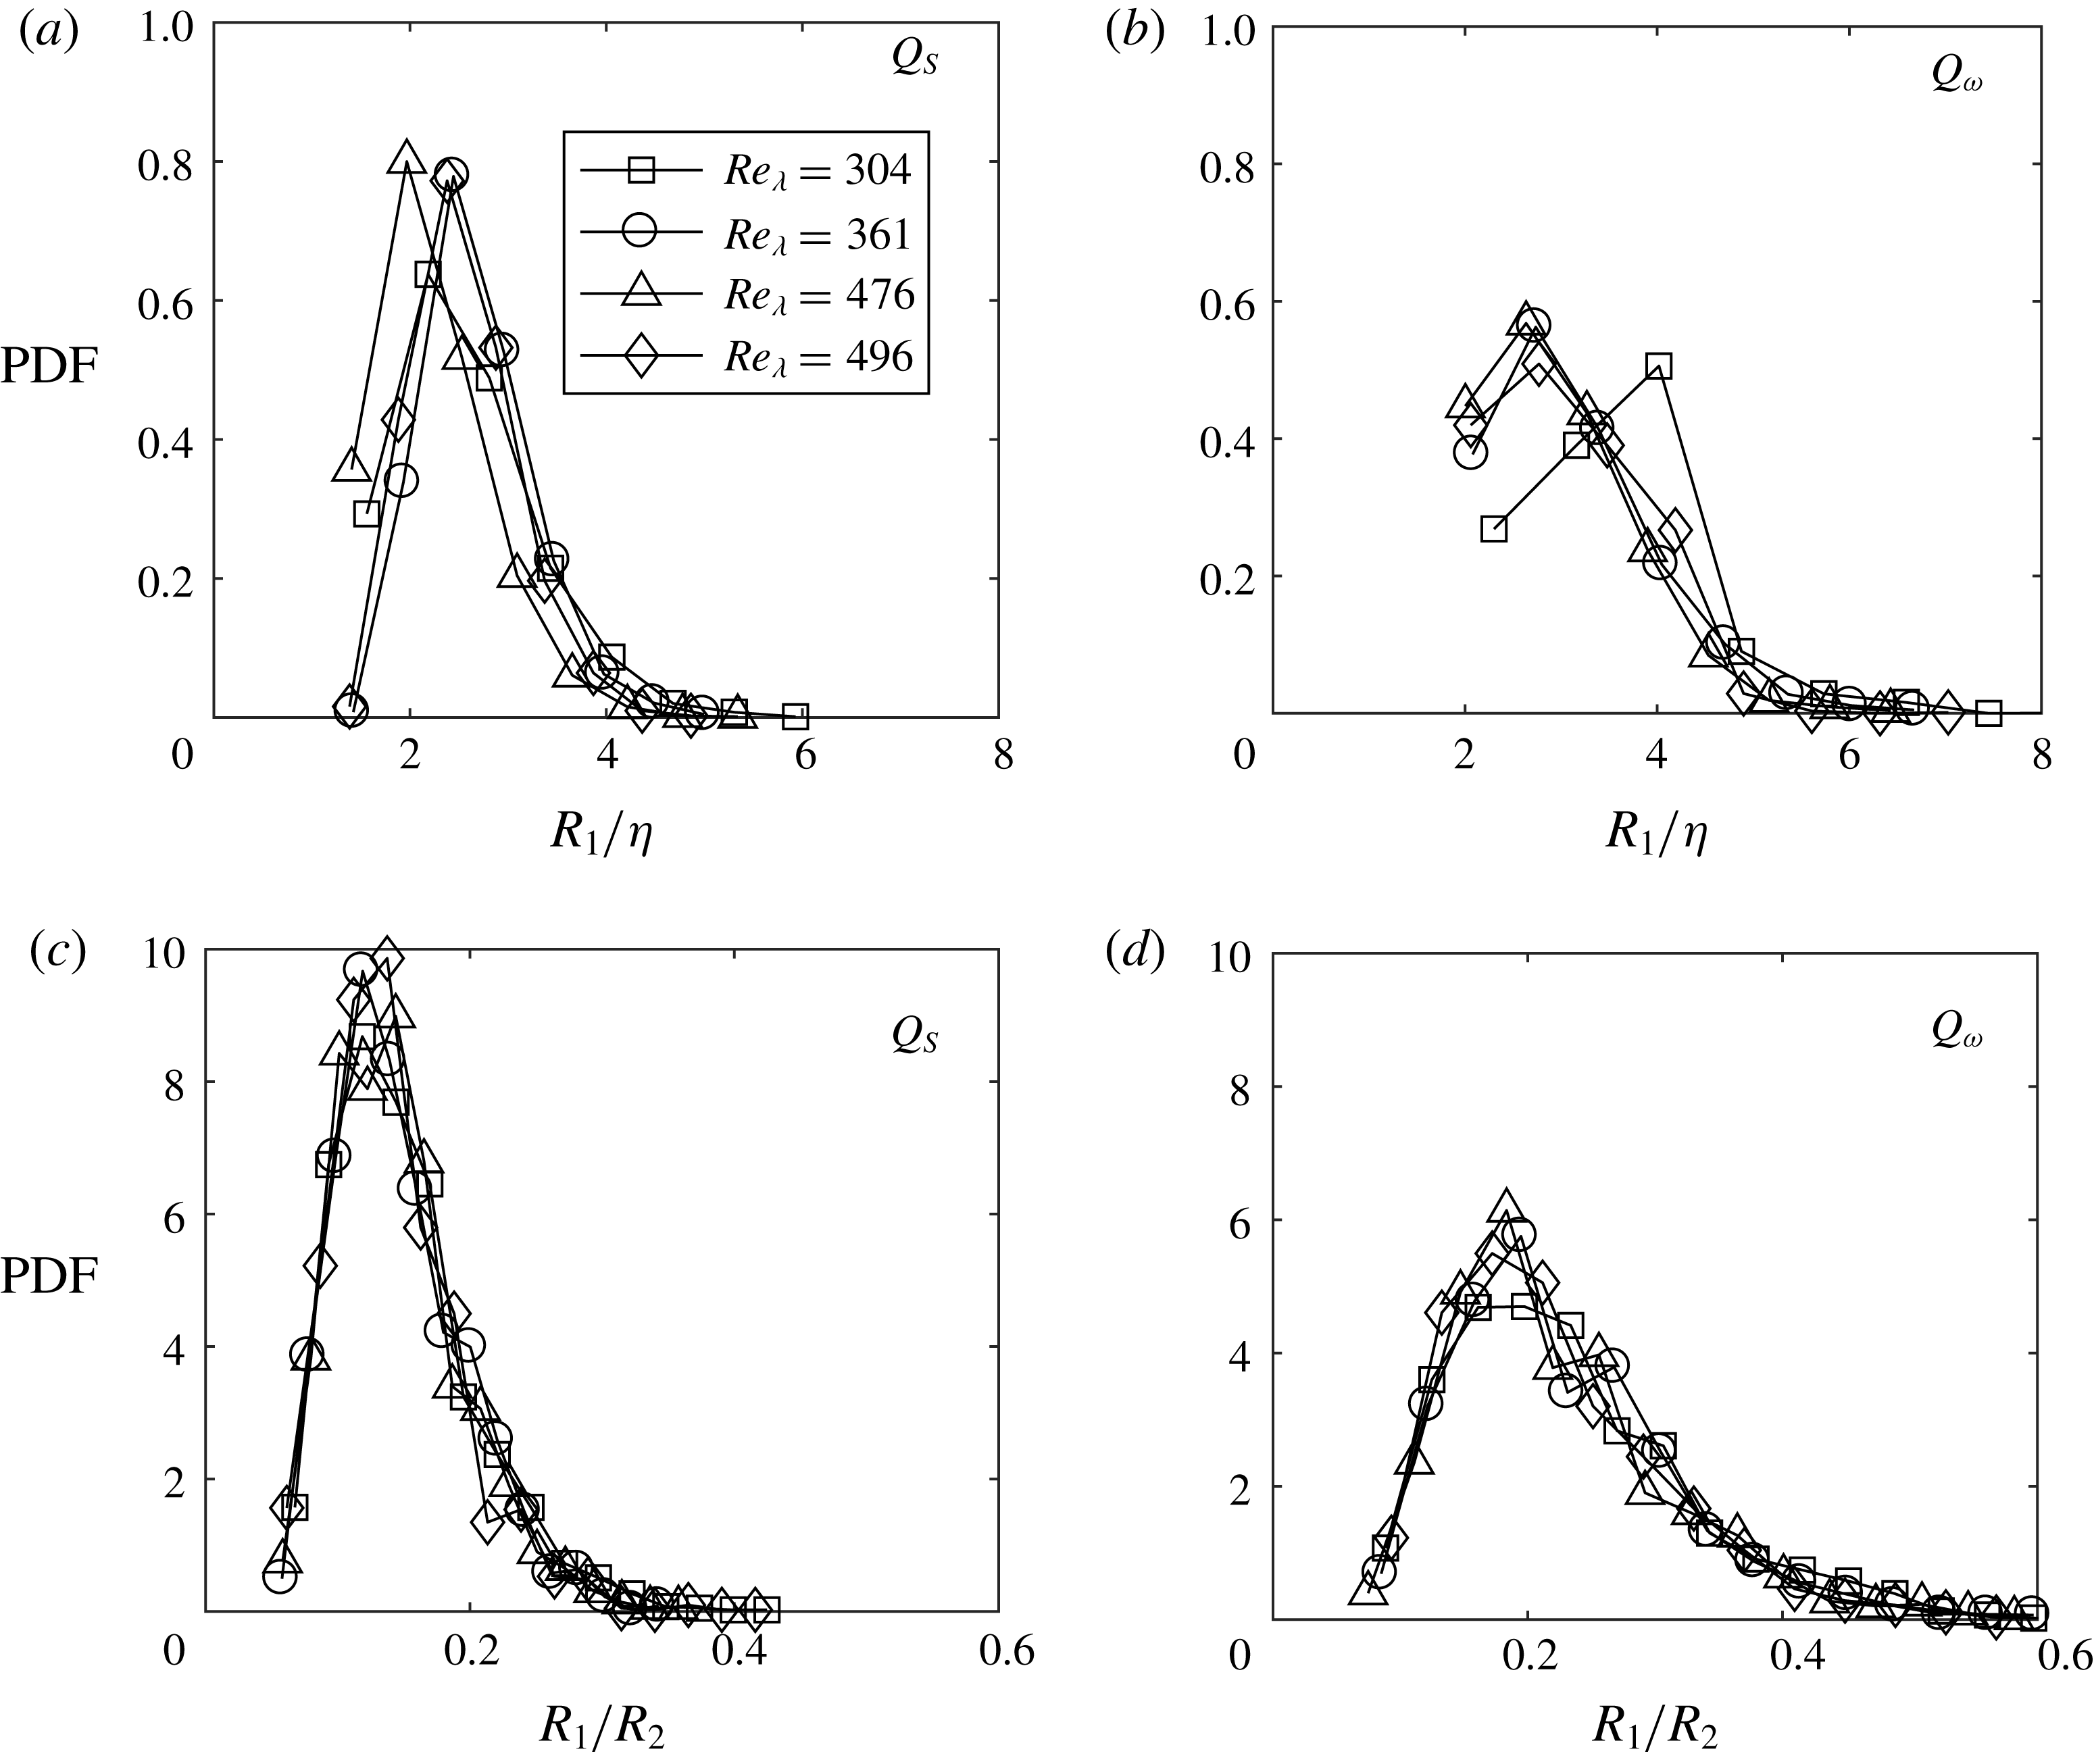
Figure 8. PDFs of the largest inscribing square side length
![]() $R_{1}/\unicode[STIX]{x1D702}$
for
$R_{1}/\unicode[STIX]{x1D702}$
for
![]() $Q_{S}$
(a) and
$Q_{S}$
(a) and
![]() $Q_{\unicode[STIX]{x1D714}}$
(b) structures. (c,d) PDFs of the ratio of
$Q_{\unicode[STIX]{x1D714}}$
(b) structures. (c,d) PDFs of the ratio of
![]() $R_{1}$
to the smallest circumscribing square side length
$R_{1}$
to the smallest circumscribing square side length
![]() $R_{2}$
for
$R_{2}$
for
![]() $Re_{\unicode[STIX]{x1D706}}=496$
.
$Re_{\unicode[STIX]{x1D706}}=496$
.
Although the quantitative measurement of the structure outer dimensions may be biased by the 2-D nature of the experiments, it is still instructive to compare the ratio
![]() $R_{1}/R_{2}$
for
$R_{1}/R_{2}$
for
![]() $Q_{\unicode[STIX]{x1D714}}$
and
$Q_{\unicode[STIX]{x1D714}}$
and
![]() $Q_{S}$
structures and for different
$Q_{S}$
structures and for different
![]() $Re_{\unicode[STIX]{x1D706}}$
. Figure 8(c,d) indicates that high-strain objects are more elongated, while high-enstrophy objects are more compact. This is consistent with the former being cuts through sheet-like structures, and the latter being cuts through tubular structures (Fiscaletti et al.
Reference Fiscaletti, Westerweel and Elsinga2014). Again, no influence of the Reynolds number can be seen in the present range.
$Re_{\unicode[STIX]{x1D706}}$
. Figure 8(c,d) indicates that high-strain objects are more elongated, while high-enstrophy objects are more compact. This is consistent with the former being cuts through sheet-like structures, and the latter being cuts through tubular structures (Fiscaletti et al.
Reference Fiscaletti, Westerweel and Elsinga2014). Again, no influence of the Reynolds number can be seen in the present range.
Despite the flow anisotropy, the intense structures show no preferential orientation in the measurement plane. This is tested using two methods. In the first one, an ellipse is fitted to the outline of each identified object. In the second method, the axes of gyration of the object are calculated using the
![]() $Q$
values as weights. Neither the ellipse axes nor the axes of gyration show preferential alignment in the
$Q$
values as weights. Neither the ellipse axes nor the axes of gyration show preferential alignment in the
![]() $x_{1}$
–
$x_{1}$
–
![]() $x_{2}$
plane (not shown). Previous studies in homogeneous turbulent shear flows showed that high-vorticity filaments tend to align approximately with the direction of mean extensive strain (Rogers & Moin Reference Rogers and Moin1987). Here the lack of preferential alignment likely reflects the negligible mean shear/strain.
$x_{2}$
plane (not shown). Previous studies in homogeneous turbulent shear flows showed that high-vorticity filaments tend to align approximately with the direction of mean extensive strain (Rogers & Moin Reference Rogers and Moin1987). Here the lack of preferential alignment likely reflects the negligible mean shear/strain.
As noted above, figure 2 strongly suggests that the intense strain and enstrophy events are often concurrent. To quantify the extent to which they overlap, we consider the intersections of
![]() $Q_{\unicode[STIX]{x1D714}}$
and
$Q_{\unicode[STIX]{x1D714}}$
and
![]() $Q_{S}$
structures. Figure 9 shows a sample realization with outlines of high-strain and high-enstrophy objects in blue and red, respectively, and the overlap areas shaded in grey. The overlap area fractions are calculated for each object of both classes and plotted as PDFs in figure 9(b) for all investigated
$Q_{S}$
structures. Figure 9 shows a sample realization with outlines of high-strain and high-enstrophy objects in blue and red, respectively, and the overlap areas shaded in grey. The overlap area fractions are calculated for each object of both classes and plotted as PDFs in figure 9(b) for all investigated
![]() $Re_{\unicode[STIX]{x1D706}}$
. The PDFs only concern structures with an overlap of 10 % or more of their area, which are approximately 45 % of the total. The
$Re_{\unicode[STIX]{x1D706}}$
. The PDFs only concern structures with an overlap of 10 % or more of their area, which are approximately 45 % of the total. The
![]() $Q_{\unicode[STIX]{x1D714}}$
structures tend to have significantly greater fractions of their area overlapping with
$Q_{\unicode[STIX]{x1D714}}$
structures tend to have significantly greater fractions of their area overlapping with
![]() $Q_{S}$
structures than vice versa. This supports the view that regions of high dissipation often surround the cores of high-vorticity tubes. Yeung et al. (Reference Yeung, Zhai and Sreenivasan2015) also showed how the highest enstrophy regions are often subsumed by high-dissipation envelopes. There does not appear to be a trend with Reynolds number within the range considered here.
$Q_{S}$
structures than vice versa. This supports the view that regions of high dissipation often surround the cores of high-vorticity tubes. Yeung et al. (Reference Yeung, Zhai and Sreenivasan2015) also showed how the highest enstrophy regions are often subsumed by high-dissipation envelopes. There does not appear to be a trend with Reynolds number within the range considered here.

Figure 9. (a) Instantaneous thresholded
![]() $Q$
field (a) for the case
$Q$
field (a) for the case
![]() $Re_{\unicode[STIX]{x1D706}}=496$
and
$Re_{\unicode[STIX]{x1D706}}=496$
and
![]() $\unicode[STIX]{x1D70F}=2$
. Outlines for strain rate (blue) and enstrophy (red) with overlap (grey). (b) PDFs of overlap fraction for strain-rate structures (black) and enstrophy (grey). The symbols are for each case, with
$\unicode[STIX]{x1D70F}=2$
. Outlines for strain rate (blue) and enstrophy (red) with overlap (grey). (b) PDFs of overlap fraction for strain-rate structures (black) and enstrophy (grey). The symbols are for each case, with
![]() $Re_{\unicode[STIX]{x1D706}}=304$
(squares),
$Re_{\unicode[STIX]{x1D706}}=304$
(squares),
![]() $361$
(circles),
$361$
(circles),
![]() $476$
(triangles) and
$476$
(triangles) and
![]() $496$
(diamonds).
$496$
(diamonds).
The complex shape of the intense structures can be characterized by their fractal dimension using the box-counting method. This was previously applied to turbulent coherent structures, for example by Moisy & Jiménez (Reference Moisy and Jiménez2004) and Lozano-Durán et al. (Reference Lozano-Durán, Flores and Jiménez2012), and to clusters of inertial particle in turbulence by Baker et al. (Reference Baker, Frankel, Mani and Coletti2017). Each two-dimensional object is circumscribed within a square which is divided into non-overlapping squares of side
![]() $R$
. The number
$R$
. The number
![]() $N$
of squares having some overlap with the object is a decreasing function of
$N$
of squares having some overlap with the object is a decreasing function of
![]() $R$
. If
$R$
. If
![]() $N(R)$
follows a power law
$N(R)$
follows a power law
![]() $N\sim R^{-D}$
over a range of
$N\sim R^{-D}$
over a range of
![]() $R$
, the exponent
$R$
, the exponent
![]() $D$
is interpreted as the fractal dimension of the object. Larger structures provide a wider scale range, hence more robust estimates of
$D$
is interpreted as the fractal dimension of the object. Larger structures provide a wider scale range, hence more robust estimates of
![]() $D$
. Figure 10 shows plots
$D$
. Figure 10 shows plots
![]() $N(R)$
for the 100 largest
$N(R)$
for the 100 largest
![]() $Q_{S}$
and
$Q_{S}$
and
![]() $Q_{\unicode[STIX]{x1D714}}$
structures for the representative case
$Q_{\unicode[STIX]{x1D714}}$
structures for the representative case
![]() $Re_{\unicode[STIX]{x1D706}}=496$
, with a clear power-law behaviour over more than one decade. Over the box length range
$Re_{\unicode[STIX]{x1D706}}=496$
, with a clear power-law behaviour over more than one decade. Over the box length range
![]() $2<R/\unicode[STIX]{x1D702}<28$
, we find fractal dimensions
$2<R/\unicode[STIX]{x1D702}<28$
, we find fractal dimensions
![]() $D_{S}\approx D_{\unicode[STIX]{x1D714}}\approx 1.46$
for the 100 largest high-strain and high-enstrophy objects, respectively. For 3-D structures (and using similar thresholds) Moisy & Jiménez (Reference Moisy and Jiménez2004) reported
$D_{S}\approx D_{\unicode[STIX]{x1D714}}\approx 1.46$
for the 100 largest high-strain and high-enstrophy objects, respectively. For 3-D structures (and using similar thresholds) Moisy & Jiménez (Reference Moisy and Jiménez2004) reported
![]() $D_{S}\approx 1.75$
and
$D_{S}\approx 1.75$
and
![]() $D_{\unicode[STIX]{x1D714}}\approx 1.65$
(although they reported a decreasing trend of
$D_{\unicode[STIX]{x1D714}}\approx 1.65$
(although they reported a decreasing trend of
![]() $D_{\unicode[STIX]{x1D714}}$
with increasing thresholds). The fractal dimension of a 3-D object (
$D_{\unicode[STIX]{x1D714}}$
with increasing thresholds). The fractal dimension of a 3-D object (
![]() $D_{3D}$
) and that of its 2-D cross-section (
$D_{3D}$
) and that of its 2-D cross-section (
![]() $D_{2D}$
) are often considered related by the additive rule
$D_{2D}$
) are often considered related by the additive rule
![]() $D_{3D}=D_{2D}+1$
(Mandelbrot Reference Mandelbrot1982). This usually applies to scale-invariant boundaries, such as the turbulent/non-turbulent interface (Sreenivasan & Meneveau Reference Sreenivasan and Meneveau1986; de Silva et al.
Reference de Silva, Philip, Chauhan, Meneveau and Marusic2013), but is not generally valid for the area/volume of fractal objects if the third direction is not homogeneous (Tang & Marangoni Reference Tang and Marangoni2006). Analyses of crystal aggregates rather suggest
$D_{3D}=D_{2D}+1$
(Mandelbrot Reference Mandelbrot1982). This usually applies to scale-invariant boundaries, such as the turbulent/non-turbulent interface (Sreenivasan & Meneveau Reference Sreenivasan and Meneveau1986; de Silva et al.
Reference de Silva, Philip, Chauhan, Meneveau and Marusic2013), but is not generally valid for the area/volume of fractal objects if the third direction is not homogeneous (Tang & Marangoni Reference Tang and Marangoni2006). Analyses of crystal aggregates rather suggest
![]() $D_{3D}=S\cdot D_{2D}$
, with the factor
$D_{3D}=S\cdot D_{2D}$
, with the factor
![]() $S\approx 1.3{-}1.5$
(Tang & Marangoni Reference Tang and Marangoni2006; Schmitt & Heymsfield Reference Schmitt and Heymsfield2010), which supports the argument of Schmitt & Heymsfield (Reference Schmitt and Heymsfield2010) that
$S\approx 1.3{-}1.5$
(Tang & Marangoni Reference Tang and Marangoni2006; Schmitt & Heymsfield Reference Schmitt and Heymsfield2010), which supports the argument of Schmitt & Heymsfield (Reference Schmitt and Heymsfield2010) that
![]() $D_{3D}/3=D_{2D}/2$
for isotropic structures. The comparison of our results with Moisy & Jiménez (Reference Moisy and Jiménez2004) is consistent with this view. Beside the exact value of the fractal dimension, it is apparent that the intense structures identified in our data possess a largely scale-invariant topology.
$D_{3D}/3=D_{2D}/2$
for isotropic structures. The comparison of our results with Moisy & Jiménez (Reference Moisy and Jiménez2004) is consistent with this view. Beside the exact value of the fractal dimension, it is apparent that the intense structures identified in our data possess a largely scale-invariant topology.
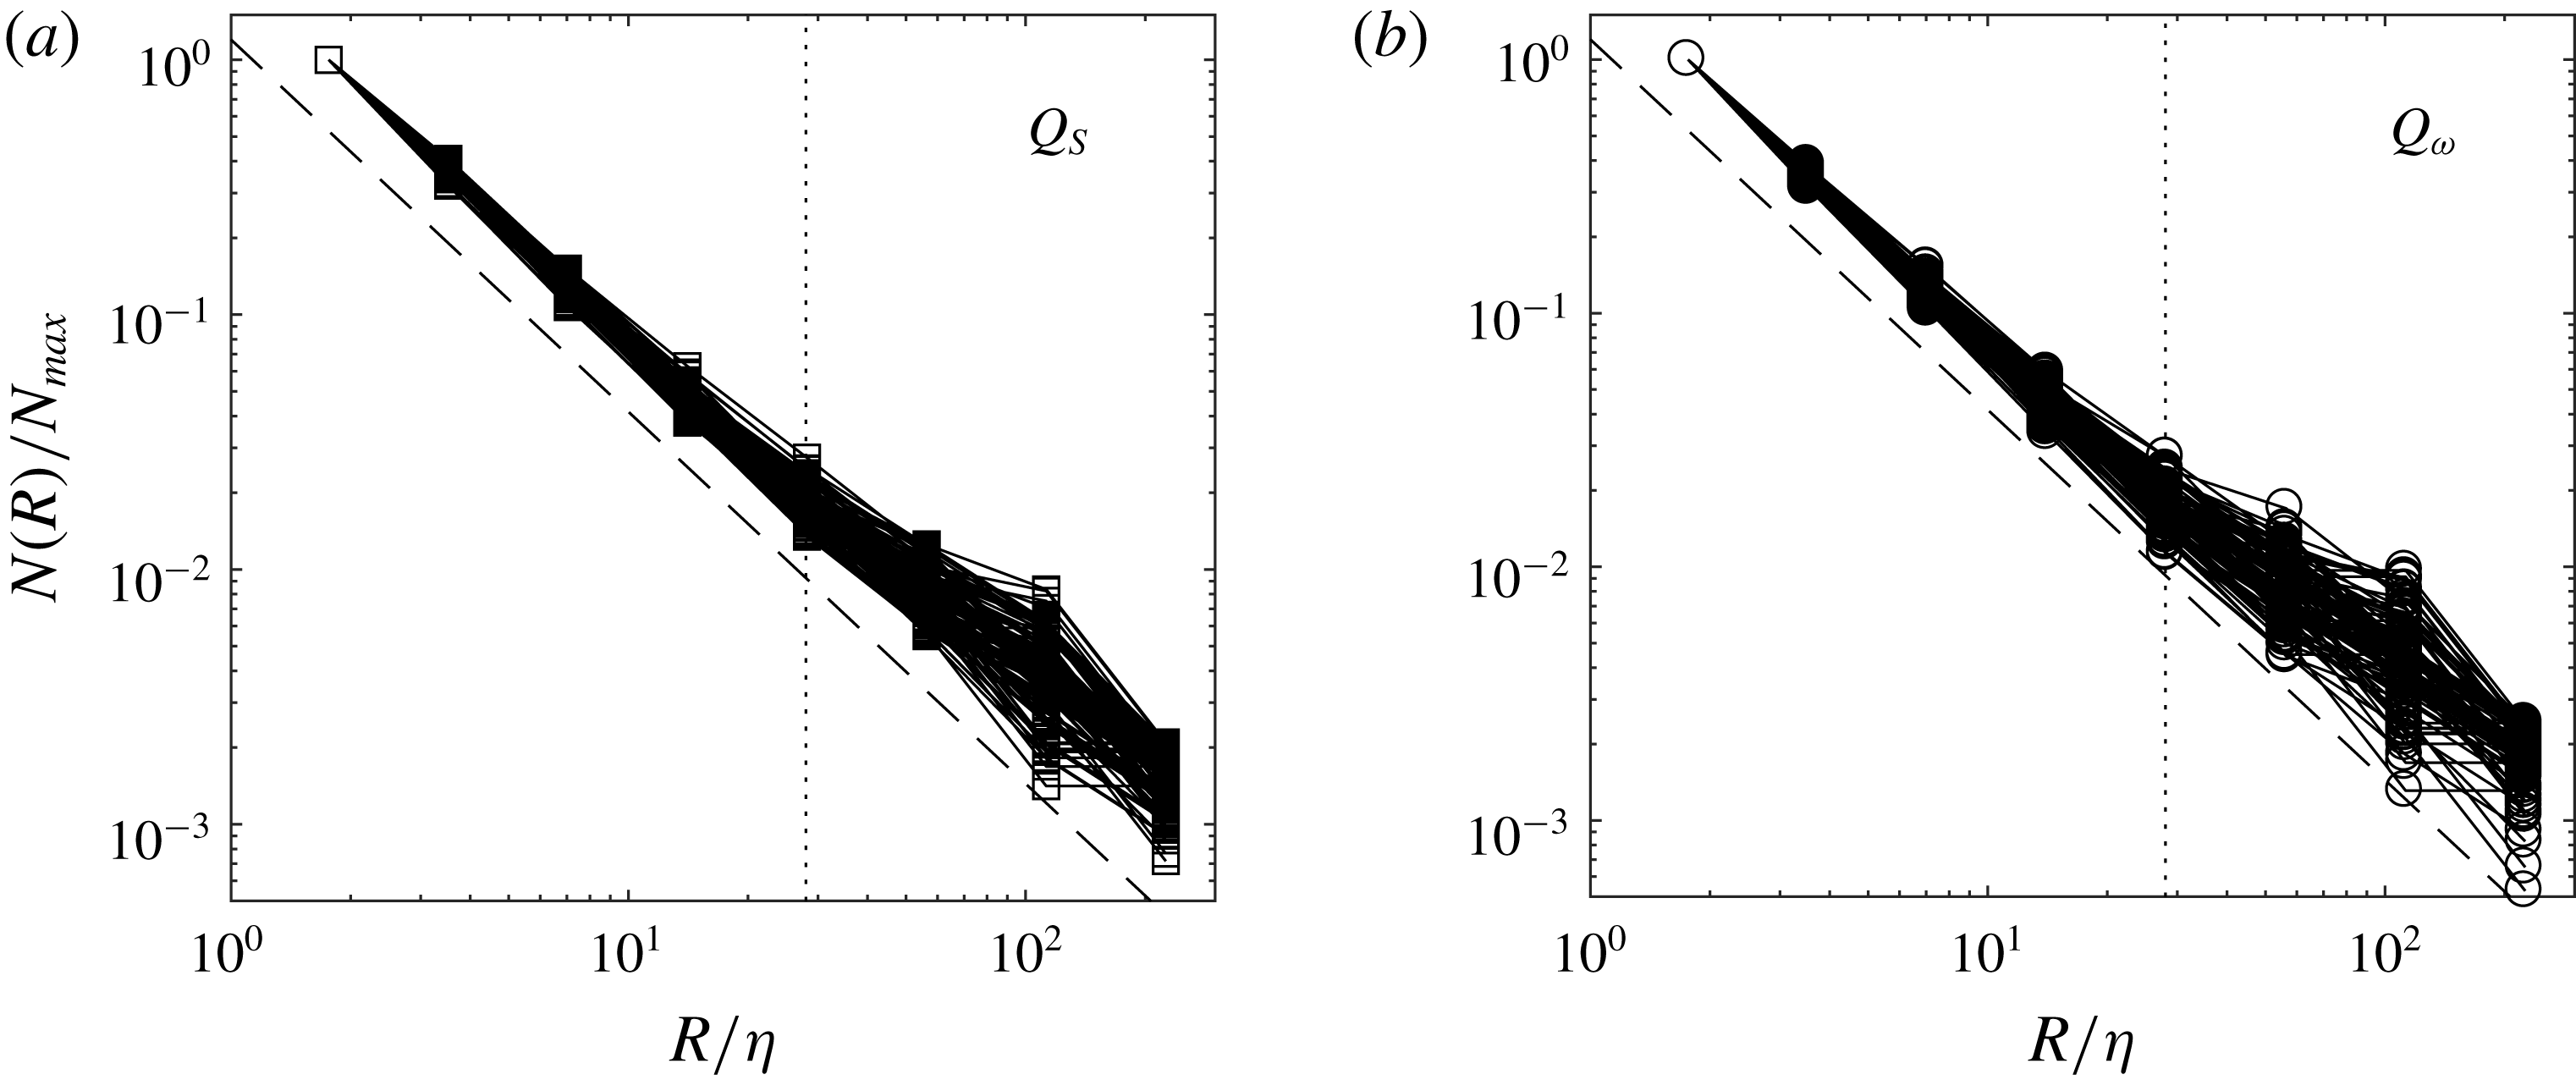
Figure 10. Normalized box counts for the 100 largest strain-rate structures (a) and enstrophy structures (b) for the case
![]() $Re_{\unicode[STIX]{x1D706}}=496$
. The dashed lines indicate power laws of
$Re_{\unicode[STIX]{x1D706}}=496$
. The dashed lines indicate power laws of
![]() $R^{-1.46}$
, with the dotted line at the upper limit for evaluating the box-counting dimensions.
$R^{-1.46}$
, with the dotted line at the upper limit for evaluating the box-counting dimensions.
4 Scale interaction
4.1 Correlation between large-scale and small-scale motion
After characterizing the fine-scale structures of the flow in the previous section, we investigate whether (and how) they correlate with the large-scale turbulence activity. We first apply the approach used by Fiscaletti et al. (Reference Fiscaletti, Attili, Bisetti and Elsinga2016) in their DNS study of a mixing layer, adapting it to our planar measurements. A set of points
![]() $(\tilde{x_{1}},\tilde{x_{2}})$
is defined over a grid of resolution
$(\tilde{x_{1}},\tilde{x_{2}})$
is defined over a grid of resolution
![]() $\unicode[STIX]{x1D706}$
covering the domain. For each realization, the small-scale activity is represented at each of these points by the spatial r.m.s. of the vorticity,
$\unicode[STIX]{x1D706}$
covering the domain. For each realization, the small-scale activity is represented at each of these points by the spatial r.m.s. of the vorticity,
 $$\begin{eqnarray}A(\tilde{x_{1}},\tilde{x_{2}})=\sqrt{\frac{1}{N}\mathop{\sum }_{i=1}^{N}[(\unicode[STIX]{x1D714}_{i}-\bar{\unicode[STIX]{x1D714}})^{2}]},\end{eqnarray}$$
where
![]() $\unicode[STIX]{x1D714}_{i}$
is the out-of-plane vorticity at the
$\unicode[STIX]{x1D714}_{i}$
is the out-of-plane vorticity at the
![]() $i$
th measurement point within the square centred at
$i$
th measurement point within the square centred at
![]() $(\tilde{x_{1}},\tilde{x_{2}})$
, and the overbar indicates averaging over the
$(\tilde{x_{1}},\tilde{x_{2}})$
, and the overbar indicates averaging over the
![]() $N$
points in each square (
$N$
points in each square (
![]() $N\approx 800$
, depending on the Reynolds number). (We choose this definition to be consistent with Fiscaletti et al. (Reference Fiscaletti, Attili, Bisetti and Elsinga2016), but we remark that using strain instead of vorticity yields analogous conclusions.) We examine the correlation of
$N\approx 800$
, depending on the Reynolds number). (We choose this definition to be consistent with Fiscaletti et al. (Reference Fiscaletti, Attili, Bisetti and Elsinga2016), but we remark that using strain instead of vorticity yields analogous conclusions.) We examine the correlation of
![]() $A$
with the large-scale velocity fluctuations and large-scale velocity gradients. The former are defined as the difference between the locally averaged (overbar) and the ensemble-averaged (bracketed) velocities, for each in-plane component:
$A$
with the large-scale velocity fluctuations and large-scale velocity gradients. The former are defined as the difference between the locally averaged (overbar) and the ensemble-averaged (bracketed) velocities, for each in-plane component:
where we consider absolute values because positive and negative fluctuations around the negligible mean flow are equivalent. To construct the large-scale velocity gradients, we apply a Gaussian filter of width
![]() $\unicode[STIX]{x1D706}$
to obtain the velocity components
$\unicode[STIX]{x1D706}$
to obtain the velocity components
![]() $U_{L,1}$
and
$U_{L,1}$
and
![]() $U_{L,2}$
, and use a central difference scheme to calculate
$U_{L,2}$
, and use a central difference scheme to calculate
Only the shear components of the gradients are included, which are verified to be the dominant ones. The choice of the Taylor microscale to separate small and large scales finds some conceptual basis on the dissipation spectrum peaking at a wavelength close to
![]() $\unicode[STIX]{x1D706}$
(Fiscaletti et al.
Reference Fiscaletti, Attili, Bisetti and Elsinga2016) and was shown to be an appropriate cut-off by Buxton & Ganapathisubramani (Reference Buxton and Ganapathisubramani2014). In the present flow,
$\unicode[STIX]{x1D706}$
(Fiscaletti et al.
Reference Fiscaletti, Attili, Bisetti and Elsinga2016) and was shown to be an appropriate cut-off by Buxton & Ganapathisubramani (Reference Buxton and Ganapathisubramani2014). In the present flow,
![]() $\unicode[STIX]{x1D706}$
is 35–40 times larger than
$\unicode[STIX]{x1D706}$
is 35–40 times larger than
![]() $\unicode[STIX]{x1D702}$
and 10–15 times smaller than
$\unicode[STIX]{x1D702}$
and 10–15 times smaller than
![]() $L$
.
$L$
.
Figure 11 presents, for the representative case at
![]() $Re_{\unicode[STIX]{x1D706}}=496$
, plots of the small-scale vorticity normalized by its mean value and conditioned on the large-scale velocity fluctuations and velocity gradients. Both types of conditioning show a degree of correlation: intense small-scale vorticity is concurrent to both large-scale velocity fluctuations and large-scale velocity gradients. This is consistent with early (Bandyopadhyay & Hussain Reference Bandyopadhyay and Hussain1984) and several more recent studies in turbulent shear flows (Hutchins & Marusic Reference Hutchins and Marusic2007; Chung & McKeon Reference Chung and McKeon2010; Guala et al.
Reference Guala, Metzger and McKeon2010; Buxton & Ganapathisubramani Reference Buxton and Ganapathisubramani2014; Fiscaletti et al.
Reference Fiscaletti, Attili, Bisetti and Elsinga2016), but to the best of our knowledge this is the first time that such coupling is reported in shear-less homogeneous turbulence. A strong large-scale/small-scale interaction in the present flow is consistent with our finding that the anisotropy, imposed at the energy-injection scales by the jet arrays, propagates through the dissipation range (Carter & Coletti Reference Carter and Coletti2017).
$Re_{\unicode[STIX]{x1D706}}=496$
, plots of the small-scale vorticity normalized by its mean value and conditioned on the large-scale velocity fluctuations and velocity gradients. Both types of conditioning show a degree of correlation: intense small-scale vorticity is concurrent to both large-scale velocity fluctuations and large-scale velocity gradients. This is consistent with early (Bandyopadhyay & Hussain Reference Bandyopadhyay and Hussain1984) and several more recent studies in turbulent shear flows (Hutchins & Marusic Reference Hutchins and Marusic2007; Chung & McKeon Reference Chung and McKeon2010; Guala et al.
Reference Guala, Metzger and McKeon2010; Buxton & Ganapathisubramani Reference Buxton and Ganapathisubramani2014; Fiscaletti et al.
Reference Fiscaletti, Attili, Bisetti and Elsinga2016), but to the best of our knowledge this is the first time that such coupling is reported in shear-less homogeneous turbulence. A strong large-scale/small-scale interaction in the present flow is consistent with our finding that the anisotropy, imposed at the energy-injection scales by the jet arrays, propagates through the dissipation range (Carter & Coletti Reference Carter and Coletti2017).
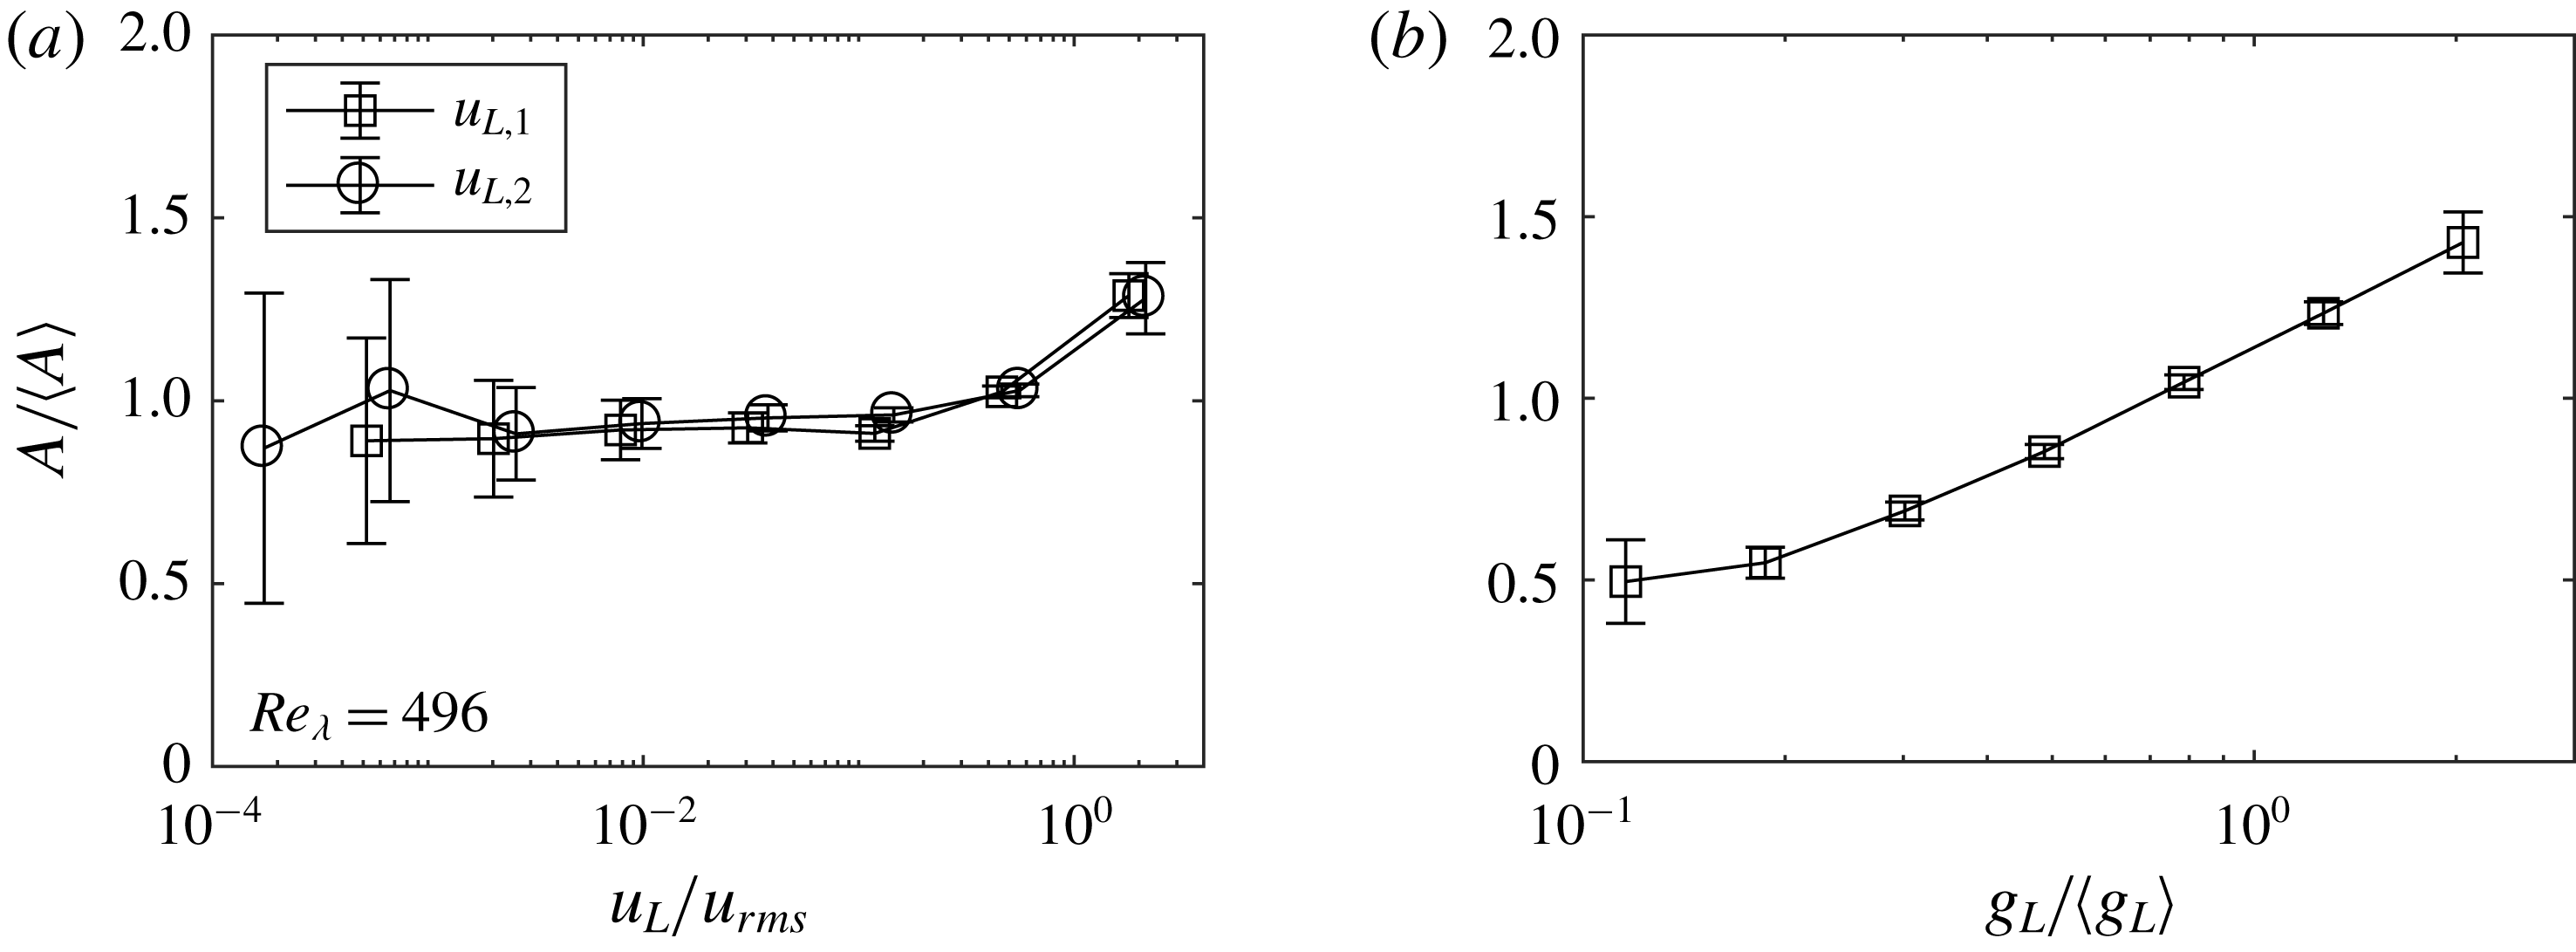
Figure 11. Normalized small-scale vorticity
![]() $A/\langle A\rangle$
conditioned on (a) the large-scale velocity fluctuation
$A/\langle A\rangle$
conditioned on (a) the large-scale velocity fluctuation
![]() $u_{L,1}$
(squares) and
$u_{L,1}$
(squares) and
![]() $u_{L,2}$
(circles) and (b) the large-scale velocity gradients for the case
$u_{L,2}$
(circles) and (b) the large-scale velocity gradients for the case
![]() $Re_{\unicode[STIX]{x1D706}}=496$
.
$Re_{\unicode[STIX]{x1D706}}=496$
.
Comparing panels (a) and (b) in figure 11, it is also clear that the small-scale activity is more clearly correlated with the coarse-grained velocity gradients than with the velocity fluctuations, in agreement with Fiscaletti et al. (Reference Fiscaletti, Attili, Bisetti and Elsinga2016). We calculate the correlation coefficient:
where
![]() $\Vert \Box \Vert$
denotes the length norm (i.e. the sum of the element magnitudes). The ensemble-averaged values are
$\Vert \Box \Vert$
denotes the length norm (i.e. the sum of the element magnitudes). The ensemble-averaged values are
![]() $R_{gA}=0.64$
for
$R_{gA}=0.64$
for
![]() $Re_{\unicode[STIX]{x1D706}}=304$
and
$Re_{\unicode[STIX]{x1D706}}=304$
and
![]() $361$
, and
$361$
, and
![]() $R_{gA}=0.7$
for
$R_{gA}=0.7$
for
![]() $Re_{\unicode[STIX]{x1D706}}=476$
and
$Re_{\unicode[STIX]{x1D706}}=476$
and
![]() $496$
. Because the correlation is between simultaneous small-scale and large-scale signals, it is a measure of a direct mutual influence, rather than the result of a multi-step cascade process. Fiscaletti et al. (Reference Fiscaletti, Attili, Bisetti and Elsinga2016) found that
$496$
. Because the correlation is between simultaneous small-scale and large-scale signals, it is a measure of a direct mutual influence, rather than the result of a multi-step cascade process. Fiscaletti et al. (Reference Fiscaletti, Attili, Bisetti and Elsinga2016) found that
![]() $R_{gA}$
was uniformly close to unity across the mixing layer they investigated. A lower correlation coefficient here is likely a consequence of the 2-D nature of the measurements. Indeed Fiscaletti et al. (Reference Fiscaletti, Attili, Bisetti and Elsinga2016) showed that using a large-scale gradient signal based on a reduced number of shear terms caused a substantial drop in the correlation coefficient.
$R_{gA}$
was uniformly close to unity across the mixing layer they investigated. A lower correlation coefficient here is likely a consequence of the 2-D nature of the measurements. Indeed Fiscaletti et al. (Reference Fiscaletti, Attili, Bisetti and Elsinga2016) showed that using a large-scale gradient signal based on a reduced number of shear terms caused a substantial drop in the correlation coefficient.
Voth and co-workers utilized another approach to investigate the interaction between large and small scales, which consists of conditioning the velocity structure functions on the concurrent large-scale velocity fluctuation (Blum et al.
Reference Blum, Bewley, Bodenschatz, Gibert, Gylfason, Mydlarski, Voth, Xu and Yeung2011; Chien et al.
Reference Chien, Blum and Voth2013). In particular, they considered the longitudinal second-order structure function
![]() $\langle \unicode[STIX]{x1D6FF}q^{2}\rangle =\langle [(u(\boldsymbol{x}+\boldsymbol{r})-u(\boldsymbol{x}))\boldsymbol{\cdot }\boldsymbol{r}/|\boldsymbol{r}|]^{2}\rangle$
, and studied the effect of conditioning them on the velocity sum
$\langle \unicode[STIX]{x1D6FF}q^{2}\rangle =\langle [(u(\boldsymbol{x}+\boldsymbol{r})-u(\boldsymbol{x}))\boldsymbol{\cdot }\boldsymbol{r}/|\boldsymbol{r}|]^{2}\rangle$
, and studied the effect of conditioning them on the velocity sum
![]() $\sum u=[u(\boldsymbol{x}+\boldsymbol{r})+u(\boldsymbol{x})]$
, taken as a measure of the instantaneous large-scale velocity. In doing so they isolated the effect of large-scale intermittency, i.e. the fluctuations in the energy input, as opposed to the small-scale intermittency that classically refers to the extreme events in the dissipation range that lead to anomalous scaling (Sreenivasan & Antonia Reference Sreenivasan and Antonia1997). It was found that, in several examples of turbulent flows displaying homogeneity over a substantial range of scales, the structure functions had larger values when the large-scale velocity was large. The behaviour did not depend on the choice of the components used for the velocity sum, indicating it was not caused by a kinematic correlation between sums and differences of the same measurements (Blum et al.
Reference Blum, Bewley, Bodenschatz, Gibert, Gylfason, Mydlarski, Voth, Xu and Yeung2011). Here, in order to avoid ambiguities related to the choice of the velocity components, we consider the energy
$\sum u=[u(\boldsymbol{x}+\boldsymbol{r})+u(\boldsymbol{x})]$
, taken as a measure of the instantaneous large-scale velocity. In doing so they isolated the effect of large-scale intermittency, i.e. the fluctuations in the energy input, as opposed to the small-scale intermittency that classically refers to the extreme events in the dissipation range that lead to anomalous scaling (Sreenivasan & Antonia Reference Sreenivasan and Antonia1997). It was found that, in several examples of turbulent flows displaying homogeneity over a substantial range of scales, the structure functions had larger values when the large-scale velocity was large. The behaviour did not depend on the choice of the components used for the velocity sum, indicating it was not caused by a kinematic correlation between sums and differences of the same measurements (Blum et al.
Reference Blum, Bewley, Bodenschatz, Gibert, Gylfason, Mydlarski, Voth, Xu and Yeung2011). Here, in order to avoid ambiguities related to the choice of the velocity components, we consider the energy
![]() $\langle \unicode[STIX]{x1D6FF}q^{2}\rangle =\langle \unicode[STIX]{x1D6FF}u_{i}\unicode[STIX]{x1D6FF}u_{i}\rangle$
, which we approximate as
$\langle \unicode[STIX]{x1D6FF}q^{2}\rangle =\langle \unicode[STIX]{x1D6FF}u_{i}\unicode[STIX]{x1D6FF}u_{i}\rangle$
, which we approximate as
![]() $\langle \unicode[STIX]{x1D6FF}u_{1}^{2}\rangle +2\langle \unicode[STIX]{x1D6FF}u_{2}^{2}\rangle$
assuming axisymmetry (e.g. Gomes-Fernandes et al.
Reference Gomes-Fernandes, Ganapathisubramani and Vassilicos2015), and condition on the energy sum
$\langle \unicode[STIX]{x1D6FF}u_{1}^{2}\rangle +2\langle \unicode[STIX]{x1D6FF}u_{2}^{2}\rangle$
assuming axisymmetry (e.g. Gomes-Fernandes et al.
Reference Gomes-Fernandes, Ganapathisubramani and Vassilicos2015), and condition on the energy sum
![]() $\sum q=|\sum u_{1}|+2|\sum u_{2}|$
. These are plotted in figure 12(a,b) for separations along
$\sum q=|\sum u_{1}|+2|\sum u_{2}|$
. These are plotted in figure 12(a,b) for separations along
![]() $x_{1}$
and
$x_{1}$
and
![]() $x_{2}$
, respectively, and confirm the findings by Voth and co-workers. The same qualitative results are obtained when using different velocity components, and do not depend on the Reynolds number within the considered range.
$x_{2}$
, respectively, and confirm the findings by Voth and co-workers. The same qualitative results are obtained when using different velocity components, and do not depend on the Reynolds number within the considered range.
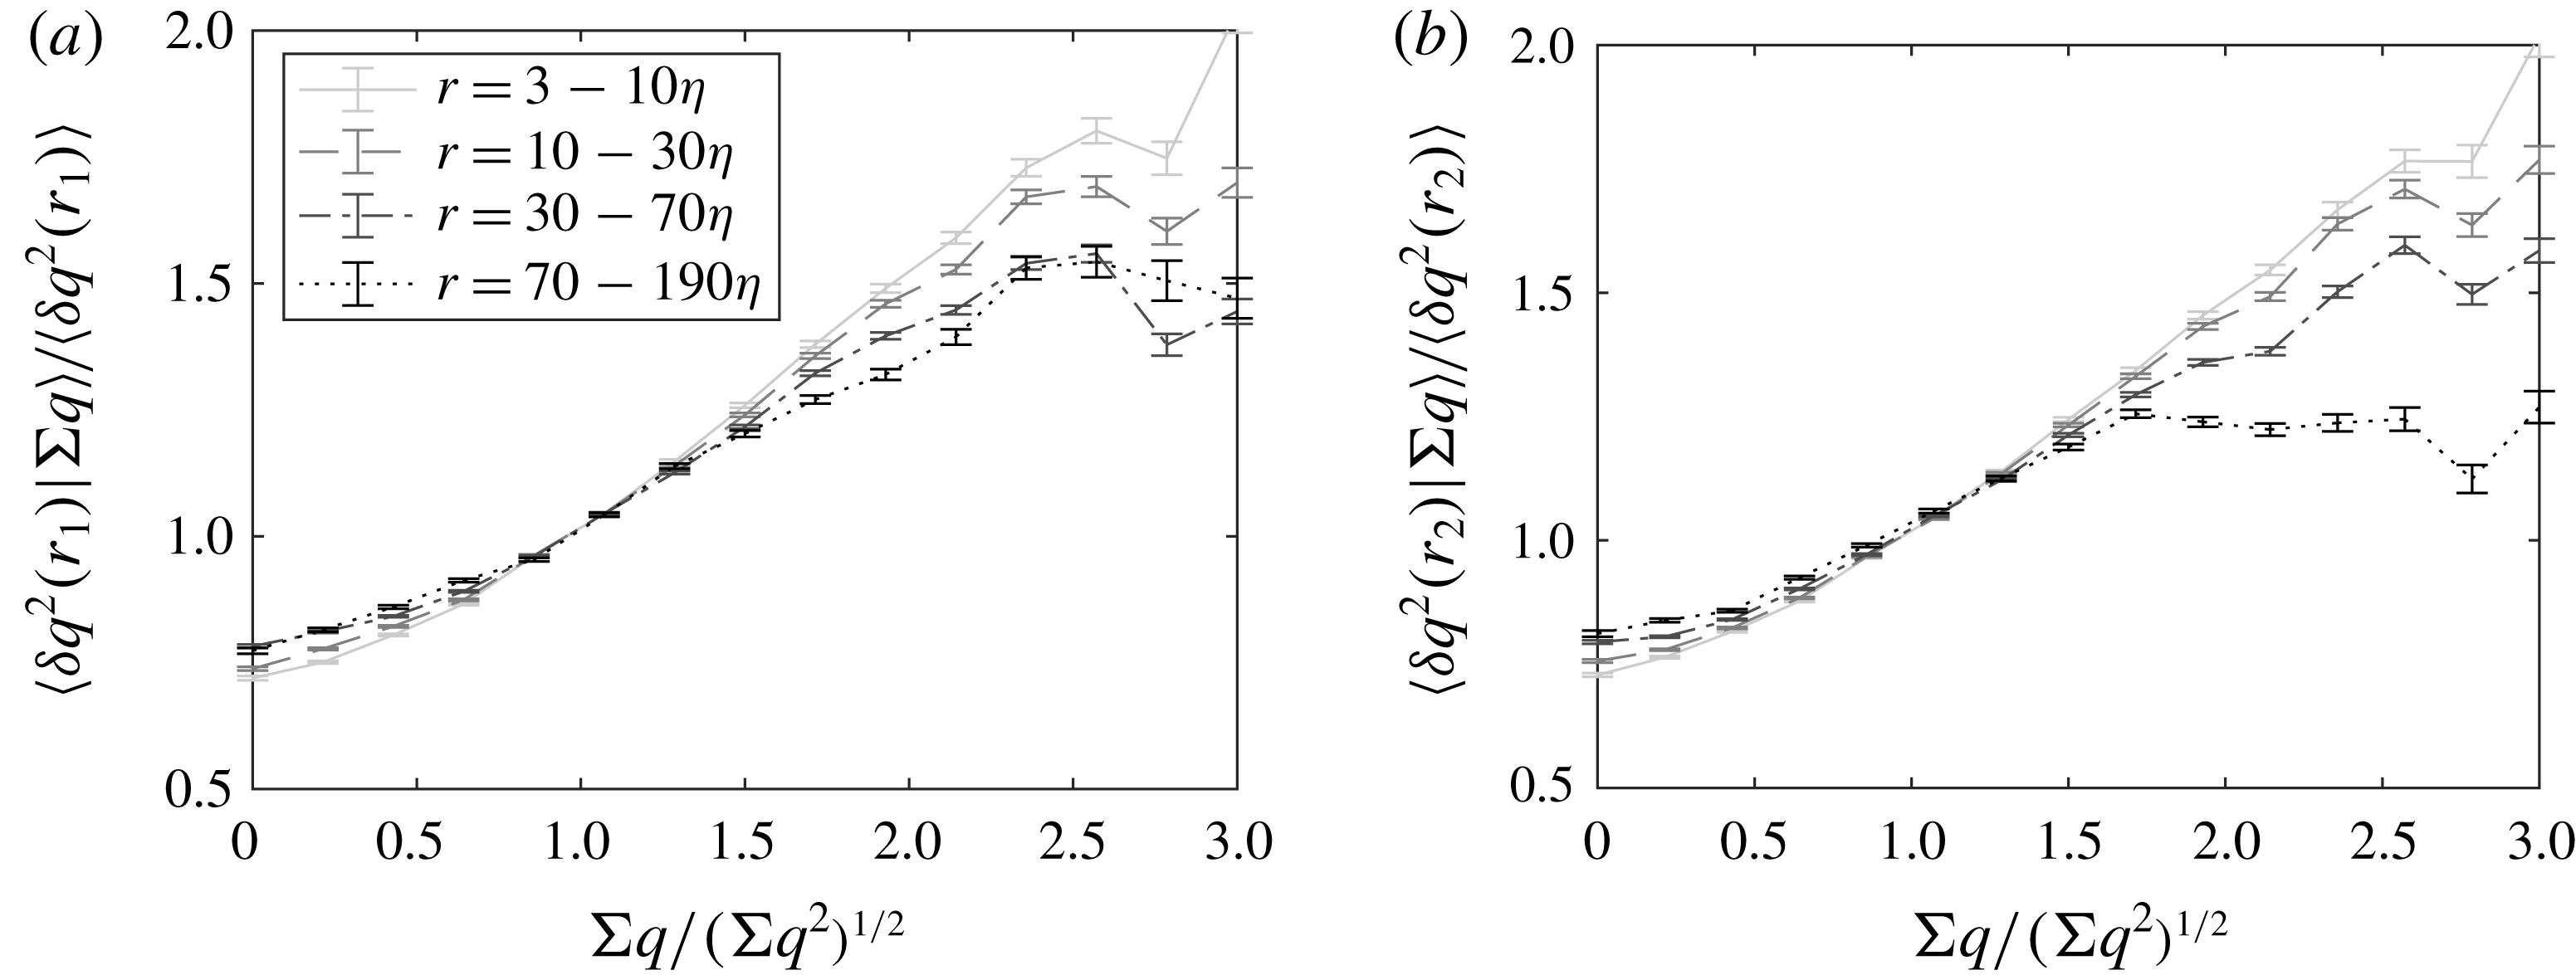
Figure 12. Energy structure function conditioned on the large-scale velocity sum (as defined in the text) along direction
![]() $x_{1}$
(a) and
$x_{1}$
(a) and
![]() $x_{2}$
(b) for the case
$x_{2}$
(b) for the case
![]() $Re_{\unicode[STIX]{x1D706}}=496$
.
$Re_{\unicode[STIX]{x1D706}}=496$
.
Blum et al. (Reference Blum, Bewley, Bodenschatz, Gibert, Gylfason, Mydlarski, Voth, Xu and Yeung2011) found that passive grid turbulence was the exception within the palette of turbulent flows they considered (which also included forced DNS simulations, active-grid turbulence, and various types of zero-mean-flow stirred tanks), as it did not show significant dependence of the structure functions on the large-scale velocity. For this, they offered two possible explanations. First, they observed that the passive grid turbulence was homogeneous over a larger range of scales, and thus hypothesized that the lack of homogeneity in the other cases could cause sweeping of fluid with uneven energy into the detection region, leading to the observed dependence. The present results do not support this explanation, since the present flow has a large degree of homogeneity over a region much larger than the integral scale (Carter et al. Reference Carter, Petersen, Amili and Coletti2016). Alternatively, Blum et al. (Reference Blum, Bewley, Bodenschatz, Gibert, Gylfason, Mydlarski, Voth, Xu and Yeung2011) suggested that the large-scale dependence would be stronger if significant energy is present over scales larger than the integral one. This is likely to be the case in the present system (as in any stirred-flow chamber), where the largest scales can only be bounded by the size of the apparatus.
The use of kinetic energy instead of velocity components amplifies an effect already noticed (though only in some cases, and much weaker) by Blum et al. (Reference Blum, Bewley, Bodenschatz, Gibert, Gylfason, Mydlarski, Voth, Xu and Yeung2011) and Chien et al. (Reference Chien, Blum and Voth2013): the dependence on the large scales is stronger for smaller separations. This is in contrast with the notion of the small scales approaching universality (Kolmogorov Reference Kolmogorov1941). Blum et al. (Reference Blum, Bewley, Bodenschatz, Gibert, Gylfason, Mydlarski, Voth, Xu and Yeung2011) already noticed that variations in the energy input would cause the dissipation length scales to fluctuate, which could explain this behaviour. Taken together, these results point to a strong influence of the variability in the energy input, with significant cross-talk between relatively distant scales of motion.
4.2 Hyperactive and sleeping states of turbulence
Irrespective of the forcing mechanism, the energy at the large scales (inertial and above) is expected to have significant fluctuations, which cannot be completely smoothed by mixing (Meneveau & Sreenivasan Reference Meneveau and Sreenivasan1991; Mouri et al. Reference Mouri, Takaoka, Hori and Kawashima2006). These are reflected in variations of the dissipation rate over similar scales, compromising small-scale universality (Landau & Lifshitz Reference Landau and Lifshitz1959; Chien et al. Reference Chien, Blum and Voth2013). Following this classic train of thought, in this section we explore the variability of the small-scale turbulence activity, in connection to the large scales.
As a simple way of evaluating fluctuations over inertial scales, we perform spatial averages over the field of view (the length of which is about
![]() $200\unicode[STIX]{x1D702}$
or
$200\unicode[STIX]{x1D702}$
or
![]() ${\approx}L_{L}/3$
), and consider the variability within each data set. In figure 13 we present the magnitude of spatially averaged enstrophy in each of the 2000 realizations acquired at
${\approx}L_{L}/3$
), and consider the variability within each data set. In figure 13 we present the magnitude of spatially averaged enstrophy in each of the 2000 realizations acquired at
![]() $Re_{\unicode[STIX]{x1D706}}=496$
, sorted in decreasing order. The shape of the curve simply reflects that the spatially averaged enstrophy varies within the realization set as a random function. Inset in the plot are markers corresponding to the displayed snapshots of the enstrophy fields at various percentiles, illustrating the large differences between instantaneous realizations of the flow. Defining arbitrary thresholds at the 10th and 90th percentiles, in the following we will refer to the bottom 10 % realizations (in terms of enstrophy levels) as sleeping states, and the top 10 % as hyperactive states. We remark that these terms refer to instantaneous levels of small-scale activity, and not to any temporal persistence of such states, which could not be evaluated with the present measurements. The sleeping samples include snapshots with a spatially averaged enstrophy
$Re_{\unicode[STIX]{x1D706}}=496$
, sorted in decreasing order. The shape of the curve simply reflects that the spatially averaged enstrophy varies within the realization set as a random function. Inset in the plot are markers corresponding to the displayed snapshots of the enstrophy fields at various percentiles, illustrating the large differences between instantaneous realizations of the flow. Defining arbitrary thresholds at the 10th and 90th percentiles, in the following we will refer to the bottom 10 % realizations (in terms of enstrophy levels) as sleeping states, and the top 10 % as hyperactive states. We remark that these terms refer to instantaneous levels of small-scale activity, and not to any temporal persistence of such states, which could not be evaluated with the present measurements. The sleeping samples include snapshots with a spatially averaged enstrophy
![]() $\overline{\unicode[STIX]{x1D714}^{2}}\leqslant 0.35\langle \unicode[STIX]{x1D714}^{2}\rangle$
, while in the hyperactive samples
$\overline{\unicode[STIX]{x1D714}^{2}}\leqslant 0.35\langle \unicode[STIX]{x1D714}^{2}\rangle$
, while in the hyperactive samples
![]() $\overline{\unicode[STIX]{x1D714}^{2}}\geqslant 1.85\langle \unicode[STIX]{x1D714}^{2}\rangle$
. The definition is heuristic; the thresholds are chosen as trade-offs to isolate strongly and weakly turbulent states, while keeping a sufficient number of samples for statistical analysis. The conclusions we will draw, however, are fairly insensitive to the exact threshold levels, as verified by testing top/bottom limits between 5 and 20 %. For all investigated Reynolds numbers, using strain rate instead of enstrophy leads to a very similar shape of the distribution, and almost identical sorting of the snapshots.
$\overline{\unicode[STIX]{x1D714}^{2}}\geqslant 1.85\langle \unicode[STIX]{x1D714}^{2}\rangle$
. The definition is heuristic; the thresholds are chosen as trade-offs to isolate strongly and weakly turbulent states, while keeping a sufficient number of samples for statistical analysis. The conclusions we will draw, however, are fairly insensitive to the exact threshold levels, as verified by testing top/bottom limits between 5 and 20 %. For all investigated Reynolds numbers, using strain rate instead of enstrophy leads to a very similar shape of the distribution, and almost identical sorting of the snapshots.
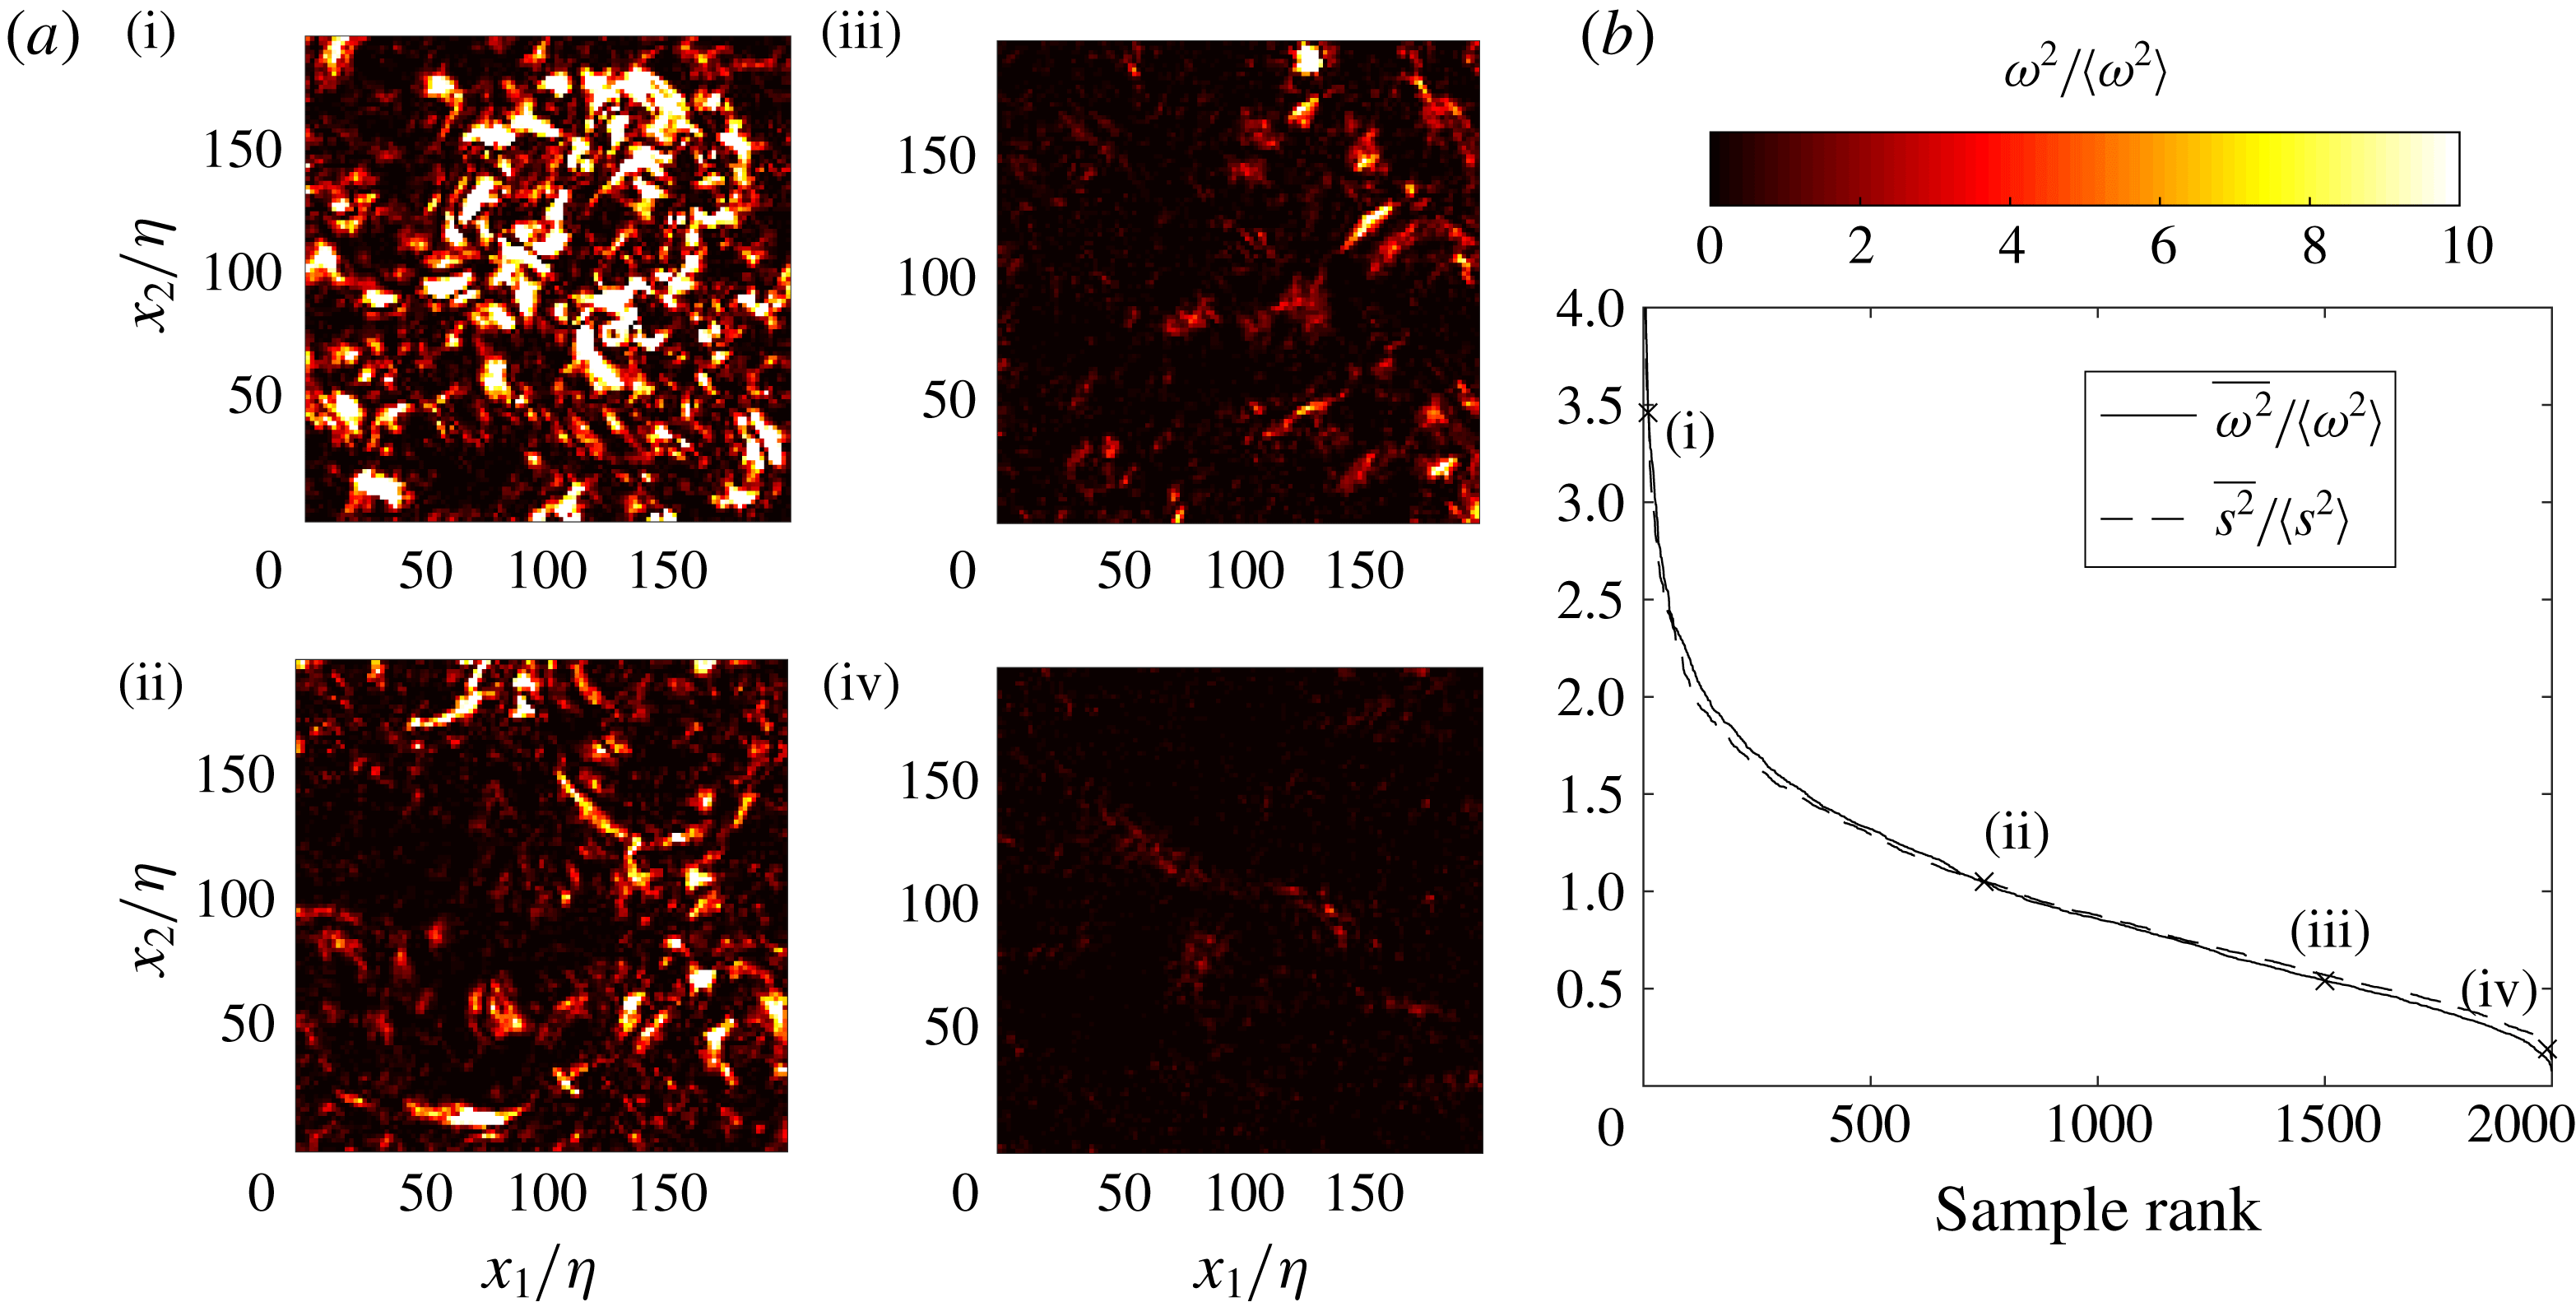
Figure 13. Spatially averaged enstrophy and strain rate ranked from largest to smallest (b) and sample enstrophy fields at the indicated level ranks (a) illustrating the appearance of fields ranging from hyperactive to sleeping for the case
![]() $Re_{\unicode[STIX]{x1D706}}=496$
.
$Re_{\unicode[STIX]{x1D706}}=496$
.
Naturally, the hyperactive states typically include a large number of intense small-scale events: e.g. for the case at
![]() $Re_{\unicode[STIX]{x1D706}}=496$
each such state contains, on average, approximately sixteen
$Re_{\unicode[STIX]{x1D706}}=496$
each such state contains, on average, approximately sixteen
![]() $Q_{\unicode[STIX]{x1D714}}$
structures and six
$Q_{\unicode[STIX]{x1D714}}$
structures and six
![]() $Q_{S}$
structures. On the other hand, the sleeping states contain one
$Q_{S}$
structures. On the other hand, the sleeping states contain one
![]() $Q_{\unicode[STIX]{x1D714}}$
structure in every two samples and one
$Q_{\unicode[STIX]{x1D714}}$
structure in every two samples and one
![]() $Q_{S}$
structure in every four samples, on average. The results in § 4.1 also indicate that intense small-scale activity is highly correlated with simultaneous large-scale activity. Therefore, we expect the realizations characterized by high enstrophy to also display strong coarse-grained velocity gradients, and vice versa. Figure 14 shows, for the representative case
$Q_{S}$
structure in every four samples, on average. The results in § 4.1 also indicate that intense small-scale activity is highly correlated with simultaneous large-scale activity. Therefore, we expect the realizations characterized by high enstrophy to also display strong coarse-grained velocity gradients, and vice versa. Figure 14 shows, for the representative case
![]() $Re_{\unicode[STIX]{x1D706}}=496$
, the PDF of
$Re_{\unicode[STIX]{x1D706}}=496$
, the PDF of
![]() $g_{L}$
for all 2000 realizations, and compares it with PDFs of the hyperactive and sleeping subsets. The large-scale velocity gradients are typically much stronger for the former and much weaker for the latter. In the next section, we shall demonstrate how the sleeping and hyperactive states are also associated with very different dynamics of inter-scale energy transfer.
$g_{L}$
for all 2000 realizations, and compares it with PDFs of the hyperactive and sleeping subsets. The large-scale velocity gradients are typically much stronger for the former and much weaker for the latter. In the next section, we shall demonstrate how the sleeping and hyperactive states are also associated with very different dynamics of inter-scale energy transfer.
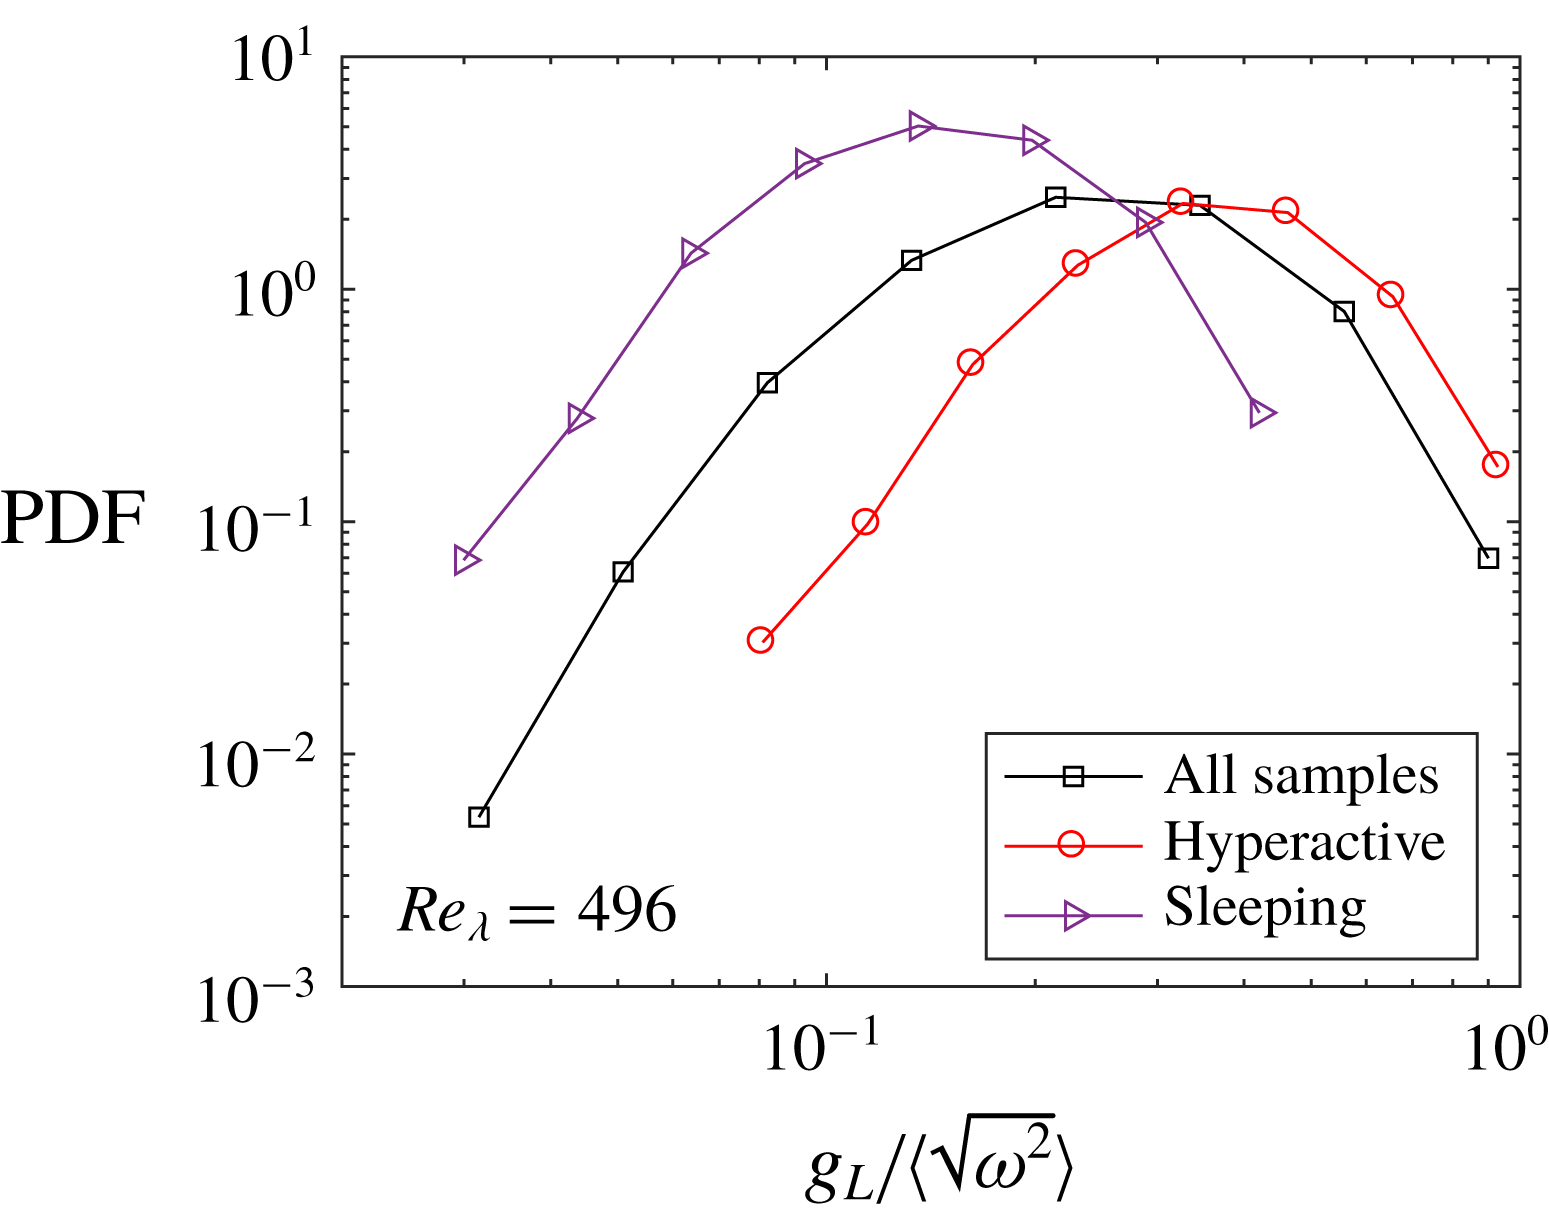
Figure 14. Distribution of the large-scale velocity gradient normalized by the small-scale r.m.s. vorticity for all samples (squares), hyperactive samples (circles) and sleeping samples (triangles).
The present classification of flow states bears resemblance to the active/hibernating phases associated with strong/weak wall shear stresses in channel flows over transitional and weakly turbulent regimes, as identified by Graham (Reference Graham2014) in the context of drag reduction. Those, in turn, resemble the quiescent and bursting phases identified by Jiménez & Moin (Reference Jiménez and Moin1991) in minimal channel flow units, which were shown to display similar temporal variabilities to randomly chosen sub-domains in larger simulations (Jiménez Reference Jiménez2012). The present flow is homogeneous and highly turbulent, thus the analogy with low Reynolds number wall-bounded flows is qualitative.
We note that the high temporal variability within our data sets is not specific to the jet-firing forcing: this is approximately steady over the acquisition time, the velocity fluctuations are Gaussian with no detectable temporal frequency content, and the high-order moments of the velocity gradients are in close agreement with grid turbulence results at similar
![]() $Re_{\unicode[STIX]{x1D706}}$
(Carter et al.
Reference Carter, Petersen, Amili and Coletti2016; Carter & Coletti Reference Carter and Coletti2017). On the other hand, the specific distribution of enstrophy (and dissipation) among different realizations is expected to depend on the size of the measurement domain. Our field of view is limited to about one third of the integral scale, thus the dynamics in it tends to be spatially correlated. This may enhance the differences between hyperactive and sleeping states, compared to larger windows where the spatial average would include regions with very different levels of activity. Still, as reminded above, fluctuations over inertial scales are inherent to the turbulence dynamics, and therefore the results are expected to depend only weakly on the details of our definition.
$Re_{\unicode[STIX]{x1D706}}$
(Carter et al.
Reference Carter, Petersen, Amili and Coletti2016; Carter & Coletti Reference Carter and Coletti2017). On the other hand, the specific distribution of enstrophy (and dissipation) among different realizations is expected to depend on the size of the measurement domain. Our field of view is limited to about one third of the integral scale, thus the dynamics in it tends to be spatially correlated. This may enhance the differences between hyperactive and sleeping states, compared to larger windows where the spatial average would include regions with very different levels of activity. Still, as reminded above, fluctuations over inertial scales are inherent to the turbulence dynamics, and therefore the results are expected to depend only weakly on the details of our definition.
5 Scale-to-scale energy transfer
The previous section painted the picture of a complex interaction among the turbulent energy at different scales. However, the correlation-based tools we have utilized so far do not provide information on the dynamics of such interaction. The aim of the present section is to describe the average inter-scale energy transfer in the present flow, by analysing the structure function
![]() $\langle \unicode[STIX]{x1D6FF}q^{2}\rangle$
and its evolution equation. We first summarize the theoretical context in which the results will be presented.
$\langle \unicode[STIX]{x1D6FF}q^{2}\rangle$
and its evolution equation. We first summarize the theoretical context in which the results will be presented.
5.1 Kármán–Howarth–Monin equation
We leverage the framework of the generalized Kármán–Howarth equation, i.e. the evolution equation for the second-order structure function, first derived by von Kármán & Howarth (Reference von Kármán and Howarth1938) for homogeneous isotropic turbulence, and later extended to account for inhomogeneity and anisotropy (Monin & Yaglom Reference Monin, Yaglom and Lumley1975; Hill Reference Hill2002). This is sometimes termed the Kármán–Howarth–Monin equation (Frisch Reference Frisch1995) or Kármán–Howarth–Monin–Hill equation (Vassilicos and co-workers), and has been recently used in experimental and numerical studies to probe the magnitude, direction and orientation of the inter-scale energy flux in a variety of flows (Lamriben, Cortet & Moisy Reference Lamriben, Cortet and Moisy2011; Danaila, Antonia & Burattini Reference Danaila, Antonia and Burattini2012; Gomes-Fernandes et al.
Reference Gomes-Fernandes, Ganapathisubramani and Vassilicos2015; Valente & Vassilicos Reference Valente and Vassilicos2015; Alves Portela et al.
Reference Alves Portela, Papadakis and Vassilicos2017). Briefly, given two points
![]() $\boldsymbol{x}=\boldsymbol{X}+\boldsymbol{r}/2$
and
$\boldsymbol{x}=\boldsymbol{X}+\boldsymbol{r}/2$
and
![]() $\boldsymbol{x}^{\prime }=\boldsymbol{X}-\boldsymbol{r}/2$
, one considers the differences in mean velocity, fluctuating velocity, and pressure:
$\boldsymbol{x}^{\prime }=\boldsymbol{X}-\boldsymbol{r}/2$
, one considers the differences in mean velocity, fluctuating velocity, and pressure:
![]() $\unicode[STIX]{x1D6FF}U_{i}\equiv U_{i}-U_{i}^{\prime }$
,
$\unicode[STIX]{x1D6FF}U_{i}\equiv U_{i}-U_{i}^{\prime }$
,
![]() $\unicode[STIX]{x1D6FF}u_{i}\equiv u_{i}-u_{i}^{\prime }$
and
$\unicode[STIX]{x1D6FF}u_{i}\equiv u_{i}-u_{i}^{\prime }$
and
![]() $\unicode[STIX]{x1D6FF}p\equiv p-p^{\prime }$
, respectively. Moving to the coordinate system attached to the midpoint
$\unicode[STIX]{x1D6FF}p\equiv p-p^{\prime }$
, respectively. Moving to the coordinate system attached to the midpoint
![]() $\boldsymbol{X}$
and separation
$\boldsymbol{X}$
and separation
![]() $\boldsymbol{r}$
, one derives (Hill Reference Hill1997, Reference Hill2002; Danaila et al.
Reference Danaila, Antonia and Burattini2012)
$\boldsymbol{r}$
, one derives (Hill Reference Hill1997, Reference Hill2002; Danaila et al.
Reference Danaila, Antonia and Burattini2012)
 $$\begin{eqnarray}\displaystyle & & \displaystyle \frac{\unicode[STIX]{x2202}\langle \unicode[STIX]{x1D6FF}q^{2}\rangle }{\unicode[STIX]{x2202}t}+\left(\frac{U_{k}+U_{k}^{\prime }}{2}\right)\frac{\unicode[STIX]{x2202}\langle \unicode[STIX]{x1D6FF}q^{2}\rangle }{\unicode[STIX]{x2202}X_{k}}+\frac{\unicode[STIX]{x2202}\langle \unicode[STIX]{x1D6FF}u_{k}\unicode[STIX]{x1D6FF}q^{2}\rangle }{\unicode[STIX]{x2202}r_{k}}+\frac{\unicode[STIX]{x2202}\langle \unicode[STIX]{x1D6FF}U_{k}\unicode[STIX]{x1D6FF}q^{2}\rangle }{\unicode[STIX]{x2202}r_{k}}\nonumber\\ \displaystyle & & \displaystyle \quad =-2\langle \unicode[STIX]{x1D6FF}u_{i}\unicode[STIX]{x1D6FF}u_{k}\rangle \frac{\unicode[STIX]{x2202}\unicode[STIX]{x1D6FF}U_{i}}{\unicode[STIX]{x2202}r_{k}}-\langle (u_{k}+u_{k}^{\prime })\unicode[STIX]{x1D6FF}u_{i}\rangle \frac{\unicode[STIX]{x2202}\unicode[STIX]{x1D6FF}U_{i}}{\unicode[STIX]{x2202}X_{k}}-\frac{\unicode[STIX]{x2202}}{\unicode[STIX]{x2202}X_{k}}\left(\frac{\langle (u_{k}+u_{k}^{\prime })\unicode[STIX]{x1D6FF}q^{2}\rangle }{2}\right)-\frac{2}{\unicode[STIX]{x1D70C}}\frac{\unicode[STIX]{x2202}\langle \unicode[STIX]{x1D6FF}u_{k}\unicode[STIX]{x1D6FF}p\rangle }{\unicode[STIX]{x2202}X_{k}}\nonumber\\ \displaystyle & & \displaystyle \qquad +\,\unicode[STIX]{x1D708}\left[2\frac{\unicode[STIX]{x2202}^{2}}{\unicode[STIX]{x2202}r_{k}^{2}}+\frac{1}{2}\frac{\unicode[STIX]{x2202}^{2}}{\unicode[STIX]{x2202}X_{k}^{2}}\right]\langle \unicode[STIX]{x1D6FF}q^{2}\rangle -2\unicode[STIX]{x1D708}\left[\left\langle \left(\frac{\unicode[STIX]{x2202}u_{i}}{\unicode[STIX]{x2202}x_{k}}\right)^{2}\right\rangle +\left\langle \left(\frac{\unicode[STIX]{x2202}u_{i}^{\prime }}{\unicode[STIX]{x2202}x_{k}^{\prime }}\right)^{2}\right\rangle \right]+\langle \unicode[STIX]{x1D6FF}u_{k}\unicode[STIX]{x1D6FF}f\rangle .\end{eqnarray}$$
On the left-hand side, we have the unsteady term, the mean flow advection term, and the nonlinear and linear inter-scale transfer rates. The first two terms on the right-hand side describe the turbulence production by mean flow gradients, followed by terms representing the turbulent transport, the diffusion by viscosity in scale space and physical space, the dissipation rate of turbulent kinetic energy, and the energy input/forcing (for details on each term see Gomes-Fernandes et al.
Reference Gomes-Fernandes, Ganapathisubramani and Vassilicos2015; Valente & Vassilicos Reference Valente and Vassilicos2015; Alves Portela et al.
Reference Alves Portela, Papadakis and Vassilicos2017). Here we focus on the nonlinear inter-scale energy transfer
![]() $4\unicode[STIX]{x1D6F1}=(\unicode[STIX]{x2202}\langle \unicode[STIX]{x1D6FF}u_{k}\unicode[STIX]{x1D6FF}q^{2}\rangle )/(\unicode[STIX]{x2202}r_{k})$
, i.e. the scale-space divergence of the energy flux, the latter being embodied by the third-order structure function
$4\unicode[STIX]{x1D6F1}=(\unicode[STIX]{x2202}\langle \unicode[STIX]{x1D6FF}u_{k}\unicode[STIX]{x1D6FF}q^{2}\rangle )/(\unicode[STIX]{x2202}r_{k})$
, i.e. the scale-space divergence of the energy flux, the latter being embodied by the third-order structure function
![]() $\langle \unicode[STIX]{x1D6FF}u_{k}\unicode[STIX]{x1D6FF}q^{2}(r)\rangle$
. This describes how the nonlinear interactions redistribute the energy
$\langle \unicode[STIX]{x1D6FF}u_{k}\unicode[STIX]{x1D6FF}q^{2}(r)\rangle$
. This describes how the nonlinear interactions redistribute the energy
![]() $\langle \unicode[STIX]{x1D6FF}q^{2}\rangle$
within scale space, and in locally homogeneous turbulence
$\langle \unicode[STIX]{x1D6FF}q^{2}\rangle$
within scale space, and in locally homogeneous turbulence
![]() $\unicode[STIX]{x1D6F1}$
is expected to balance the two-point average dissipation rate
$\unicode[STIX]{x1D6F1}$
is expected to balance the two-point average dissipation rate
![]() $\unicode[STIX]{x1D716}_{r}=\unicode[STIX]{x1D708}/2[\langle (\unicode[STIX]{x2202}u_{i}/\unicode[STIX]{x2202}x_{k})^{2}\rangle +\langle (\unicode[STIX]{x2202}u_{i}^{\prime }/\unicode[STIX]{x2202}x_{k}^{\prime })^{2}\rangle ]=(\unicode[STIX]{x1D716}+\unicode[STIX]{x1D716}^{\prime })/2$
over the inertial range. This
$\unicode[STIX]{x1D716}_{r}=\unicode[STIX]{x1D708}/2[\langle (\unicode[STIX]{x2202}u_{i}/\unicode[STIX]{x2202}x_{k})^{2}\rangle +\langle (\unicode[STIX]{x2202}u_{i}^{\prime }/\unicode[STIX]{x2202}x_{k}^{\prime })^{2}\rangle ]=(\unicode[STIX]{x1D716}+\unicode[STIX]{x1D716}^{\prime })/2$
over the inertial range. This
![]() $\unicode[STIX]{x1D6F1}$
–
$\unicode[STIX]{x1D6F1}$
–
![]() $\unicode[STIX]{x1D716}$
equilibrium is at the core of the Richardson–Kolmogorov cascade (see Vassilicos Reference Vassilicos2015, for a recent review on the subject). The balance can be made more specific considering that, in spherical coordinates, only the radial component of the nonlinear transfer
$\unicode[STIX]{x1D716}$
equilibrium is at the core of the Richardson–Kolmogorov cascade (see Vassilicos Reference Vassilicos2015, for a recent review on the subject). The balance can be made more specific considering that, in spherical coordinates, only the radial component of the nonlinear transfer
![]() $\unicode[STIX]{x1D6F1}_{r}=(1/4)1/r^{2}(\unicode[STIX]{x2202}/\unicode[STIX]{x2202}r)(r^{2}\langle \unicode[STIX]{x1D6FF}u_{r}\unicode[STIX]{x1D6FF}q^{2}(r)\rangle )$
makes a net contribution to the transport of energy across scales. Thus, the average of
$\unicode[STIX]{x1D6F1}_{r}=(1/4)1/r^{2}(\unicode[STIX]{x2202}/\unicode[STIX]{x2202}r)(r^{2}\langle \unicode[STIX]{x1D6FF}u_{r}\unicode[STIX]{x1D6FF}q^{2}(r)\rangle )$
makes a net contribution to the transport of energy across scales. Thus, the average of
![]() $\unicode[STIX]{x1D6F1}_{r}$
over all solid angles is expected to be negative (corresponding to energy cascading from larger to smaller scales) for all separations, and to balance the dissipation rate over the inertial range. Recent experimental and numerical studies indicate that, in non-homogeneous and non-isotropic flows such as the turbulent near-wake past grids and obstacles, simultaneous forward (towards smaller scales) and inverse (towards larger scales) transfers of energy can occur simultaneously in different directions, although the global forward cascade is respected (Gomes-Fernandes et al.
Reference Gomes-Fernandes, Ganapathisubramani and Vassilicos2015; Alves Portela et al.
Reference Alves Portela, Papadakis and Vassilicos2017).
$\unicode[STIX]{x1D6F1}_{r}$
over all solid angles is expected to be negative (corresponding to energy cascading from larger to smaller scales) for all separations, and to balance the dissipation rate over the inertial range. Recent experimental and numerical studies indicate that, in non-homogeneous and non-isotropic flows such as the turbulent near-wake past grids and obstacles, simultaneous forward (towards smaller scales) and inverse (towards larger scales) transfers of energy can occur simultaneously in different directions, although the global forward cascade is respected (Gomes-Fernandes et al.
Reference Gomes-Fernandes, Ganapathisubramani and Vassilicos2015; Alves Portela et al.
Reference Alves Portela, Papadakis and Vassilicos2017).
5.2 Inter-scale energy transfer
We make simplifications consistent with the assumption of axisymmetry (Carter & Coletti Reference Carter and Coletti2017). In particular, following Gomes-Fernandes et al. (Reference Gomes-Fernandes, Ganapathisubramani and Vassilicos2015), we calculate the second-order and third-order structure functions as
![]() $\langle \unicode[STIX]{x1D6FF}q^{2}\rangle =\langle \unicode[STIX]{x1D6FF}u_{1}^{2}\rangle +2\langle \unicode[STIX]{x1D6FF}u_{2}^{2}\rangle$
and
$\langle \unicode[STIX]{x1D6FF}q^{2}\rangle =\langle \unicode[STIX]{x1D6FF}u_{1}^{2}\rangle +2\langle \unicode[STIX]{x1D6FF}u_{2}^{2}\rangle$
and
![]() $\langle \unicode[STIX]{x1D6FF}u_{i}\unicode[STIX]{x1D6FF}q^{2}\rangle =\langle \unicode[STIX]{x1D6FF}u_{i}\unicode[STIX]{x1D6FF}u_{1}^{2}\rangle +2\langle \unicode[STIX]{x1D6FF}u_{i}\unicode[STIX]{x1D6FF}u_{2}^{2}\rangle$
, respectively. However, this assumption is not restrictive in that the qualitative conclusions we will draw do not depend on the type of weighted summation used to calculate the energy structure function. We examine the results in scale space using spherical coordinates
$\langle \unicode[STIX]{x1D6FF}u_{i}\unicode[STIX]{x1D6FF}q^{2}\rangle =\langle \unicode[STIX]{x1D6FF}u_{i}\unicode[STIX]{x1D6FF}u_{1}^{2}\rangle +2\langle \unicode[STIX]{x1D6FF}u_{i}\unicode[STIX]{x1D6FF}u_{2}^{2}\rangle$
, respectively. However, this assumption is not restrictive in that the qualitative conclusions we will draw do not depend on the type of weighted summation used to calculate the energy structure function. We examine the results in scale space using spherical coordinates
![]() $(r,\unicode[STIX]{x1D703},\unicode[STIX]{x1D719})$
of zenith direction
$(r,\unicode[STIX]{x1D703},\unicode[STIX]{x1D719})$
of zenith direction
![]() $x_{1}$
, with
$x_{1}$
, with
![]() $\unicode[STIX]{x1D703}$
the polar angle between the separation vector
$\unicode[STIX]{x1D703}$
the polar angle between the separation vector
![]() $\boldsymbol{r}$
and the
$\boldsymbol{r}$
and the
![]() $x_{1}$
direction, and
$x_{1}$
direction, and
![]() $\unicode[STIX]{x1D719}$
the homogeneous azimuthal angle. The statistics are computed in Cartesian coordinates and bi-linearly interpolated onto a polar grid corresponding to the
$\unicode[STIX]{x1D719}$
the homogeneous azimuthal angle. The statistics are computed in Cartesian coordinates and bi-linearly interpolated onto a polar grid corresponding to the
![]() $\unicode[STIX]{x1D719}=0$
plane, comprising 112 radial separations and 56 solid angles between
$\unicode[STIX]{x1D719}=0$
plane, comprising 112 radial separations and 56 solid angles between
![]() $\unicode[STIX]{x1D703}=0$
(parallel to
$\unicode[STIX]{x1D703}=0$
(parallel to
![]() $x_{1}$
) and
$x_{1}$
) and
![]() $\unicode[STIX]{x1D703}=\unicode[STIX]{x03C0}/2$
(parallel to
$\unicode[STIX]{x1D703}=\unicode[STIX]{x03C0}/2$
(parallel to
![]() $x_{2}$
). In figure 15 we show maps of the structure functions in the
$x_{2}$
). In figure 15 we show maps of the structure functions in the
![]() $(r_{1},r_{2})$
scale space (
$(r_{1},r_{2})$
scale space (
![]() $r_{i}$
denoting separations in direction
$r_{i}$
denoting separations in direction
![]() $x_{i}$
) for
$x_{i}$
) for
![]() $Re_{\unicode[STIX]{x1D706}}=361$
and
$Re_{\unicode[STIX]{x1D706}}=361$
and
![]() $496$
. These two cases illustrate the influence of varying anisotropy ratio (see table 1) although, as already discussed, the simultaneous change in Reynolds number does not allow us to isolate the effect. The turbulent kinetic energy appears distributed with approximate spherical symmetry, despite anisotropy at the largest scales (Batchelor & Stewart Reference Batchelor and Stewart1950). The iso-lines of
$496$
. These two cases illustrate the influence of varying anisotropy ratio (see table 1) although, as already discussed, the simultaneous change in Reynolds number does not allow us to isolate the effect. The turbulent kinetic energy appears distributed with approximate spherical symmetry, despite anisotropy at the largest scales (Batchelor & Stewart Reference Batchelor and Stewart1950). The iso-lines of
![]() $\langle \unicode[STIX]{x1D6FF}q^{2}\rangle$
depart from circularity for increasing large-scale anisotropy (figure 15
a,b), although the effect is small compared to the variation of individual velocity components (Carter & Coletti Reference Carter and Coletti2017). The third-order structure functions are more interesting. Figure 15(c,d) presents vectors oriented along the energy flux, overlaid onto contours of its magnitude. In locally isotropic turbulence that follows a classic equilibrium cascade, all vectors strictly point radially inward. Instead, in the present anisotropic flow the nonlinear interactions produce a significant redistribution of energy not only across different scales, but also within spherical shells. Moreover, there appears to be a sizeable region of scale space, approximately aligned with the radial direction
$\langle \unicode[STIX]{x1D6FF}q^{2}\rangle$
depart from circularity for increasing large-scale anisotropy (figure 15
a,b), although the effect is small compared to the variation of individual velocity components (Carter & Coletti Reference Carter and Coletti2017). The third-order structure functions are more interesting. Figure 15(c,d) presents vectors oriented along the energy flux, overlaid onto contours of its magnitude. In locally isotropic turbulence that follows a classic equilibrium cascade, all vectors strictly point radially inward. Instead, in the present anisotropic flow the nonlinear interactions produce a significant redistribution of energy not only across different scales, but also within spherical shells. Moreover, there appears to be a sizeable region of scale space, approximately aligned with the radial direction
![]() $r_{2}$
, where the flux is pointing towards larger scales.
$r_{2}$
, where the flux is pointing towards larger scales.
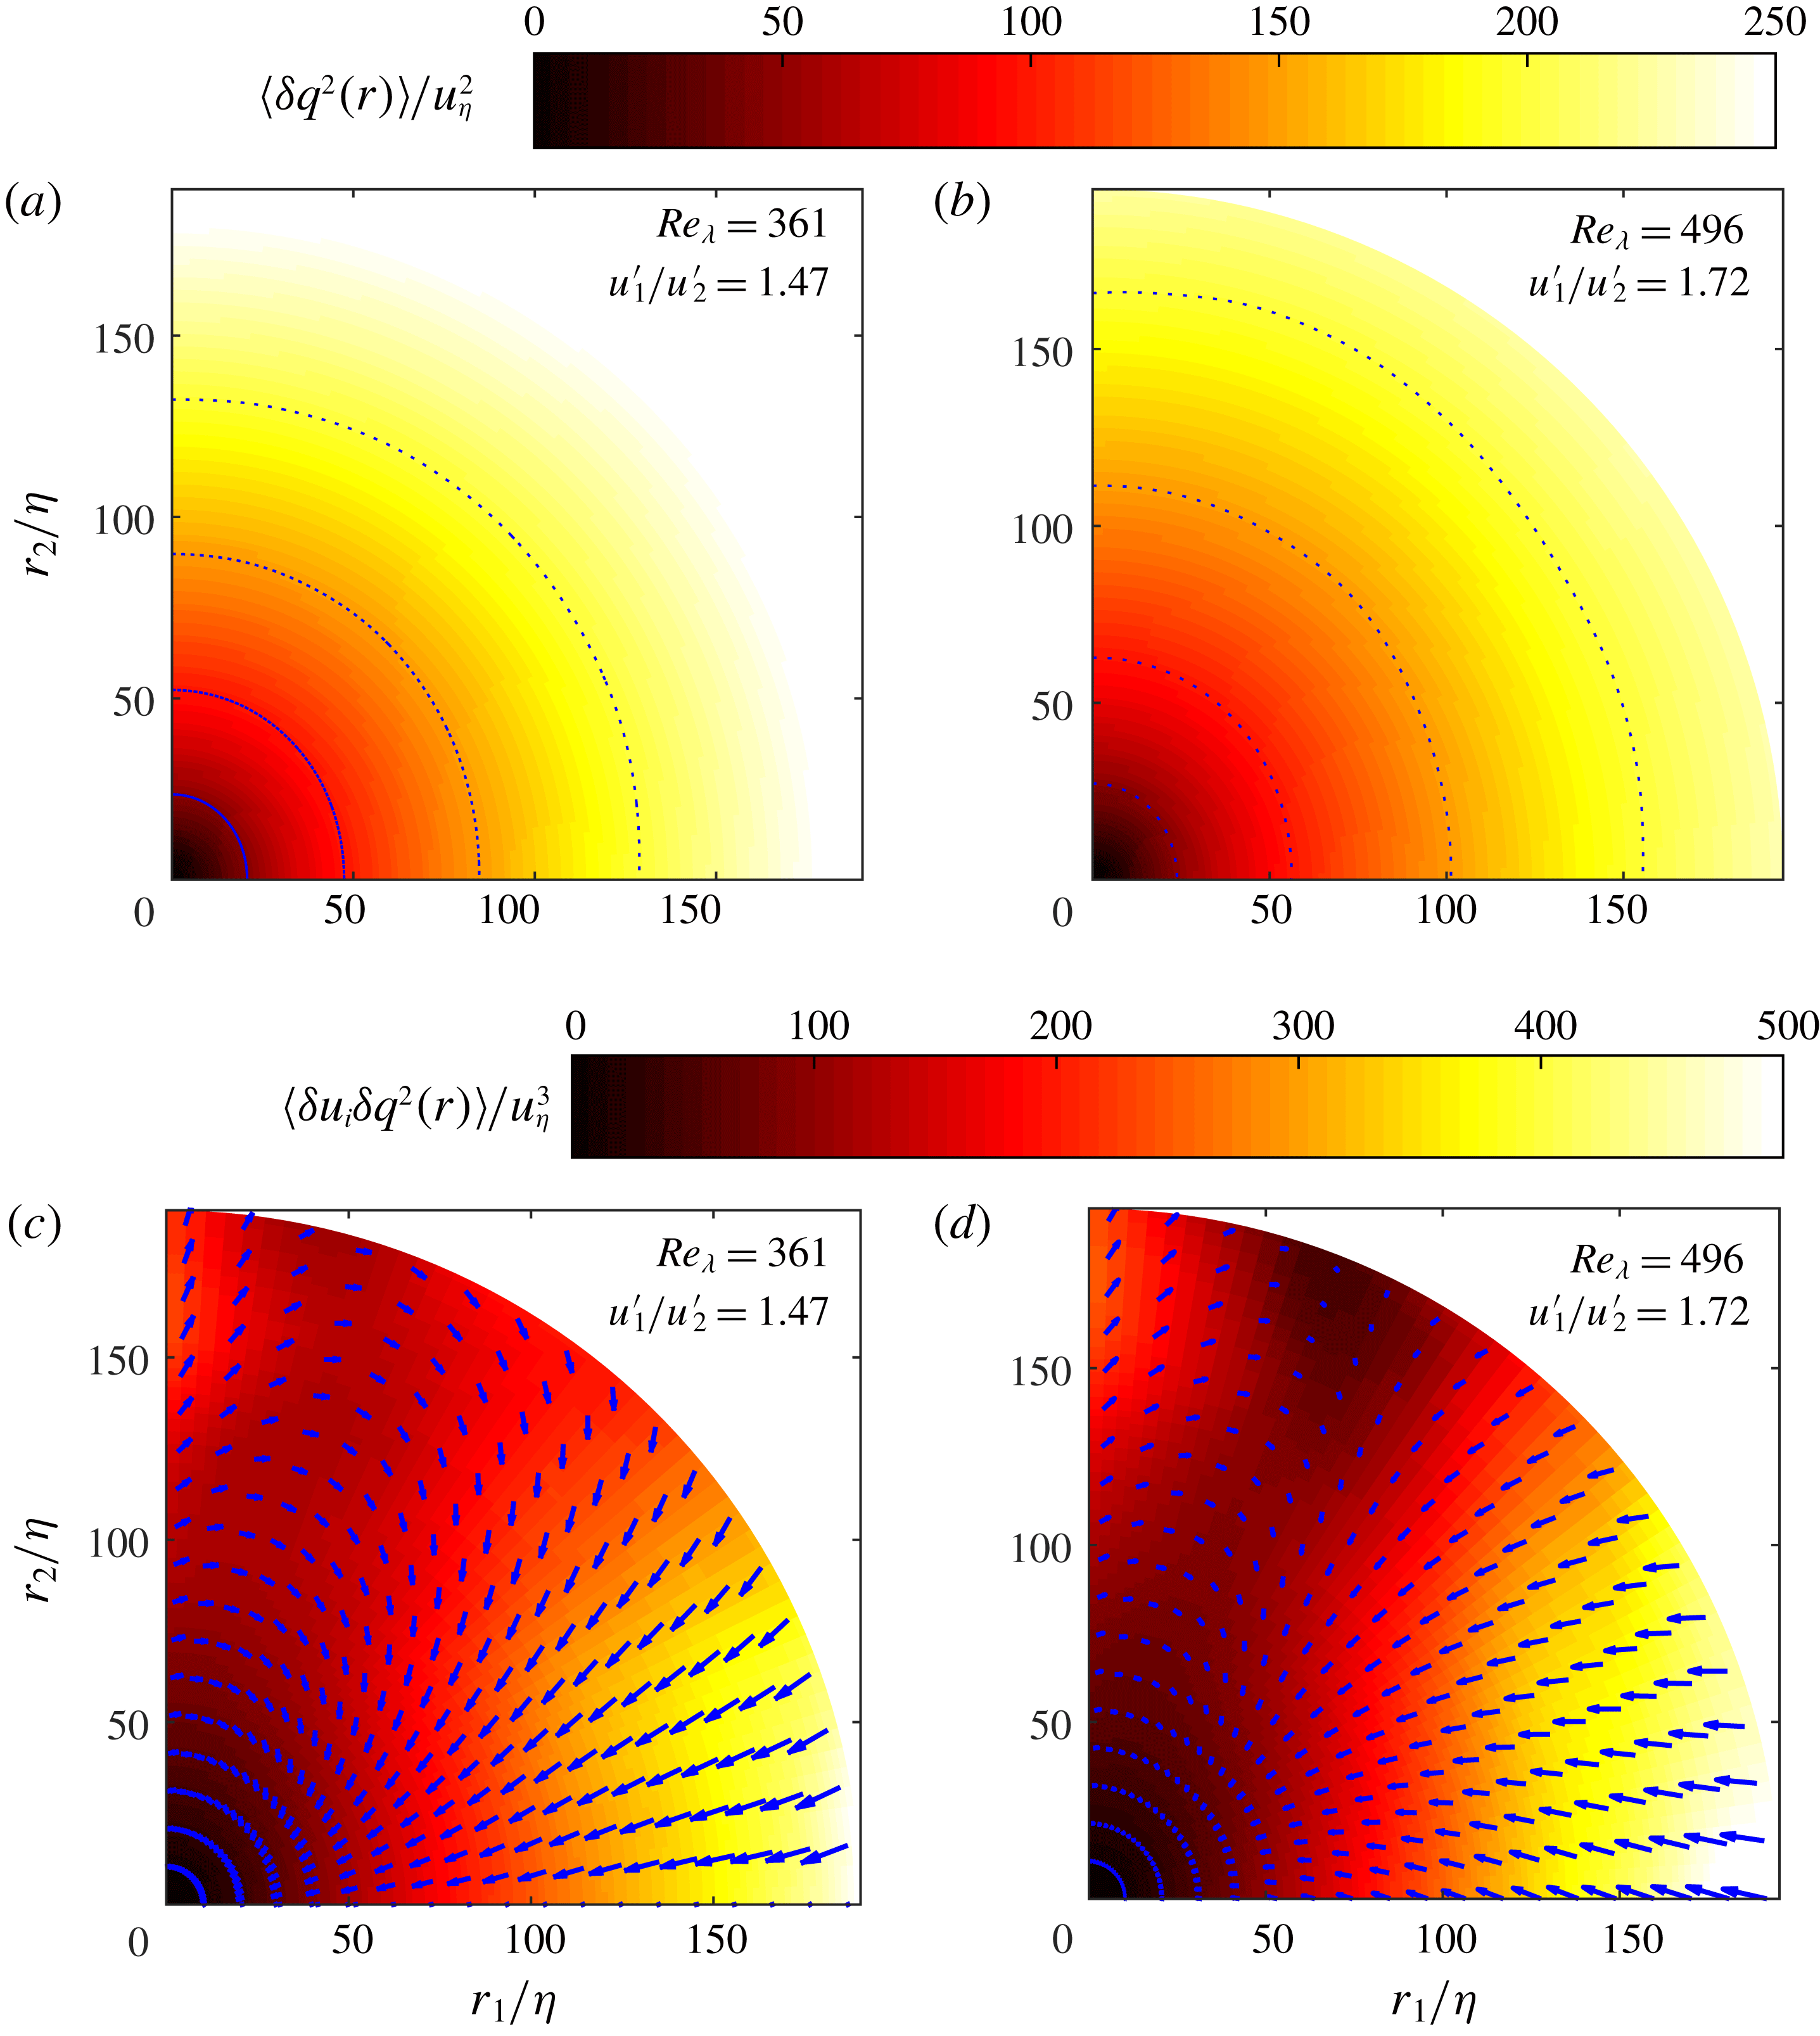
Figure 15. (a,b) Normalized second-order structure functions
![]() $\langle \unicode[STIX]{x1D6FF}q^{2}\rangle /u_{\unicode[STIX]{x1D702}}^{2}$
with dotted lines along 50, 100, 150 and 200. (c,d) Third-order structure functions
$\langle \unicode[STIX]{x1D6FF}q^{2}\rangle /u_{\unicode[STIX]{x1D702}}^{2}$
with dotted lines along 50, 100, 150 and 200. (c,d) Third-order structure functions
![]() $\langle \unicode[STIX]{x1D6FF}u_{i}\unicode[STIX]{x1D6FF}q^{2}\rangle /u_{\unicode[STIX]{x1D702}}^{3}$
coloured by magnitude for two cases.
$\langle \unicode[STIX]{x1D6FF}u_{i}\unicode[STIX]{x1D6FF}q^{2}\rangle /u_{\unicode[STIX]{x1D702}}^{3}$
coloured by magnitude for two cases.
The latter observation suggests the possibility, within a portion of scale space, of a backscatter of energy from smaller to larger scales. As discussed in Alves Portela et al. (Reference Alves Portela, Papadakis and Vassilicos2017), the third-order structure function pointing outward is not a sufficient condition for the energy to be cascading from small to large scales; an additional condition is
![]() $\unicode[STIX]{x1D6F1}_{r}$
being positive, i.e. the inter-scale energy being transferred in the same direction. Figure 16(a,b) shows, for the case
$\unicode[STIX]{x1D6F1}_{r}$
being positive, i.e. the inter-scale energy being transferred in the same direction. Figure 16(a,b) shows, for the case
![]() $Re_{\unicode[STIX]{x1D706}}=361$
, the radial components of the third-order structure function, side by side with the nonlinear energy transfer rate. The scale-space distributions of both quantities mirror each other, confirming the co-existence of both forward and inverse nonlinear cascades of energy, over polar angles smaller and larger than
$Re_{\unicode[STIX]{x1D706}}=361$
, the radial components of the third-order structure function, side by side with the nonlinear energy transfer rate. The scale-space distributions of both quantities mirror each other, confirming the co-existence of both forward and inverse nonlinear cascades of energy, over polar angles smaller and larger than
![]() $\unicode[STIX]{x1D703}\approx 50^{\circ }$
, respectively. This coexistence of opposing cascades is found in all considered cases, as well as the non-zero polar flux. The latter appears to be the consequence of the anisotropy breaking the spherical symmetry. The magnitude of the energy cascade is, on average, substantially larger in the sector characterized by forward energy transfer, suggesting that the classic cascade from large to small scales dominates. This is confirmed in figure 16(c), where we plot the polar average of
$\unicode[STIX]{x1D703}\approx 50^{\circ }$
, respectively. This coexistence of opposing cascades is found in all considered cases, as well as the non-zero polar flux. The latter appears to be the consequence of the anisotropy breaking the spherical symmetry. The magnitude of the energy cascade is, on average, substantially larger in the sector characterized by forward energy transfer, suggesting that the classic cascade from large to small scales dominates. This is confirmed in figure 16(c), where we plot the polar average of
![]() $\unicode[STIX]{x1D6F1}_{r}$
, normalized by the dissipation rate, as a function of separation for all cases. The radial transfer of energy is strictly negative, indicating a predominantly forward cascade, for all separations. For the higher
$\unicode[STIX]{x1D6F1}_{r}$
, normalized by the dissipation rate, as a function of separation for all cases. The radial transfer of energy is strictly negative, indicating a predominantly forward cascade, for all separations. For the higher
![]() $Re_{\unicode[STIX]{x1D706}}$
cases, the ratio
$Re_{\unicode[STIX]{x1D706}}$
cases, the ratio
![]() $\unicode[STIX]{x1D6F1}_{r}/\unicode[STIX]{x1D716}_{r}$
is of order one for separations larger than about
$\unicode[STIX]{x1D6F1}_{r}/\unicode[STIX]{x1D716}_{r}$
is of order one for separations larger than about
![]() $50\unicode[STIX]{x1D702}$
, which roughly corresponds to the inertial range (Carter & Coletti Reference Carter and Coletti2017), indicating that the expected equilibrium cascade behaviour is retrieved. The oscillations are partly due to lack of statistical convergence due to the limited sample size, which at the larger separations can account for approximately 20 % uncertainty in the third-order structure function: see appendix A.
$50\unicode[STIX]{x1D702}$
, which roughly corresponds to the inertial range (Carter & Coletti Reference Carter and Coletti2017), indicating that the expected equilibrium cascade behaviour is retrieved. The oscillations are partly due to lack of statistical convergence due to the limited sample size, which at the larger separations can account for approximately 20 % uncertainty in the third-order structure function: see appendix A.
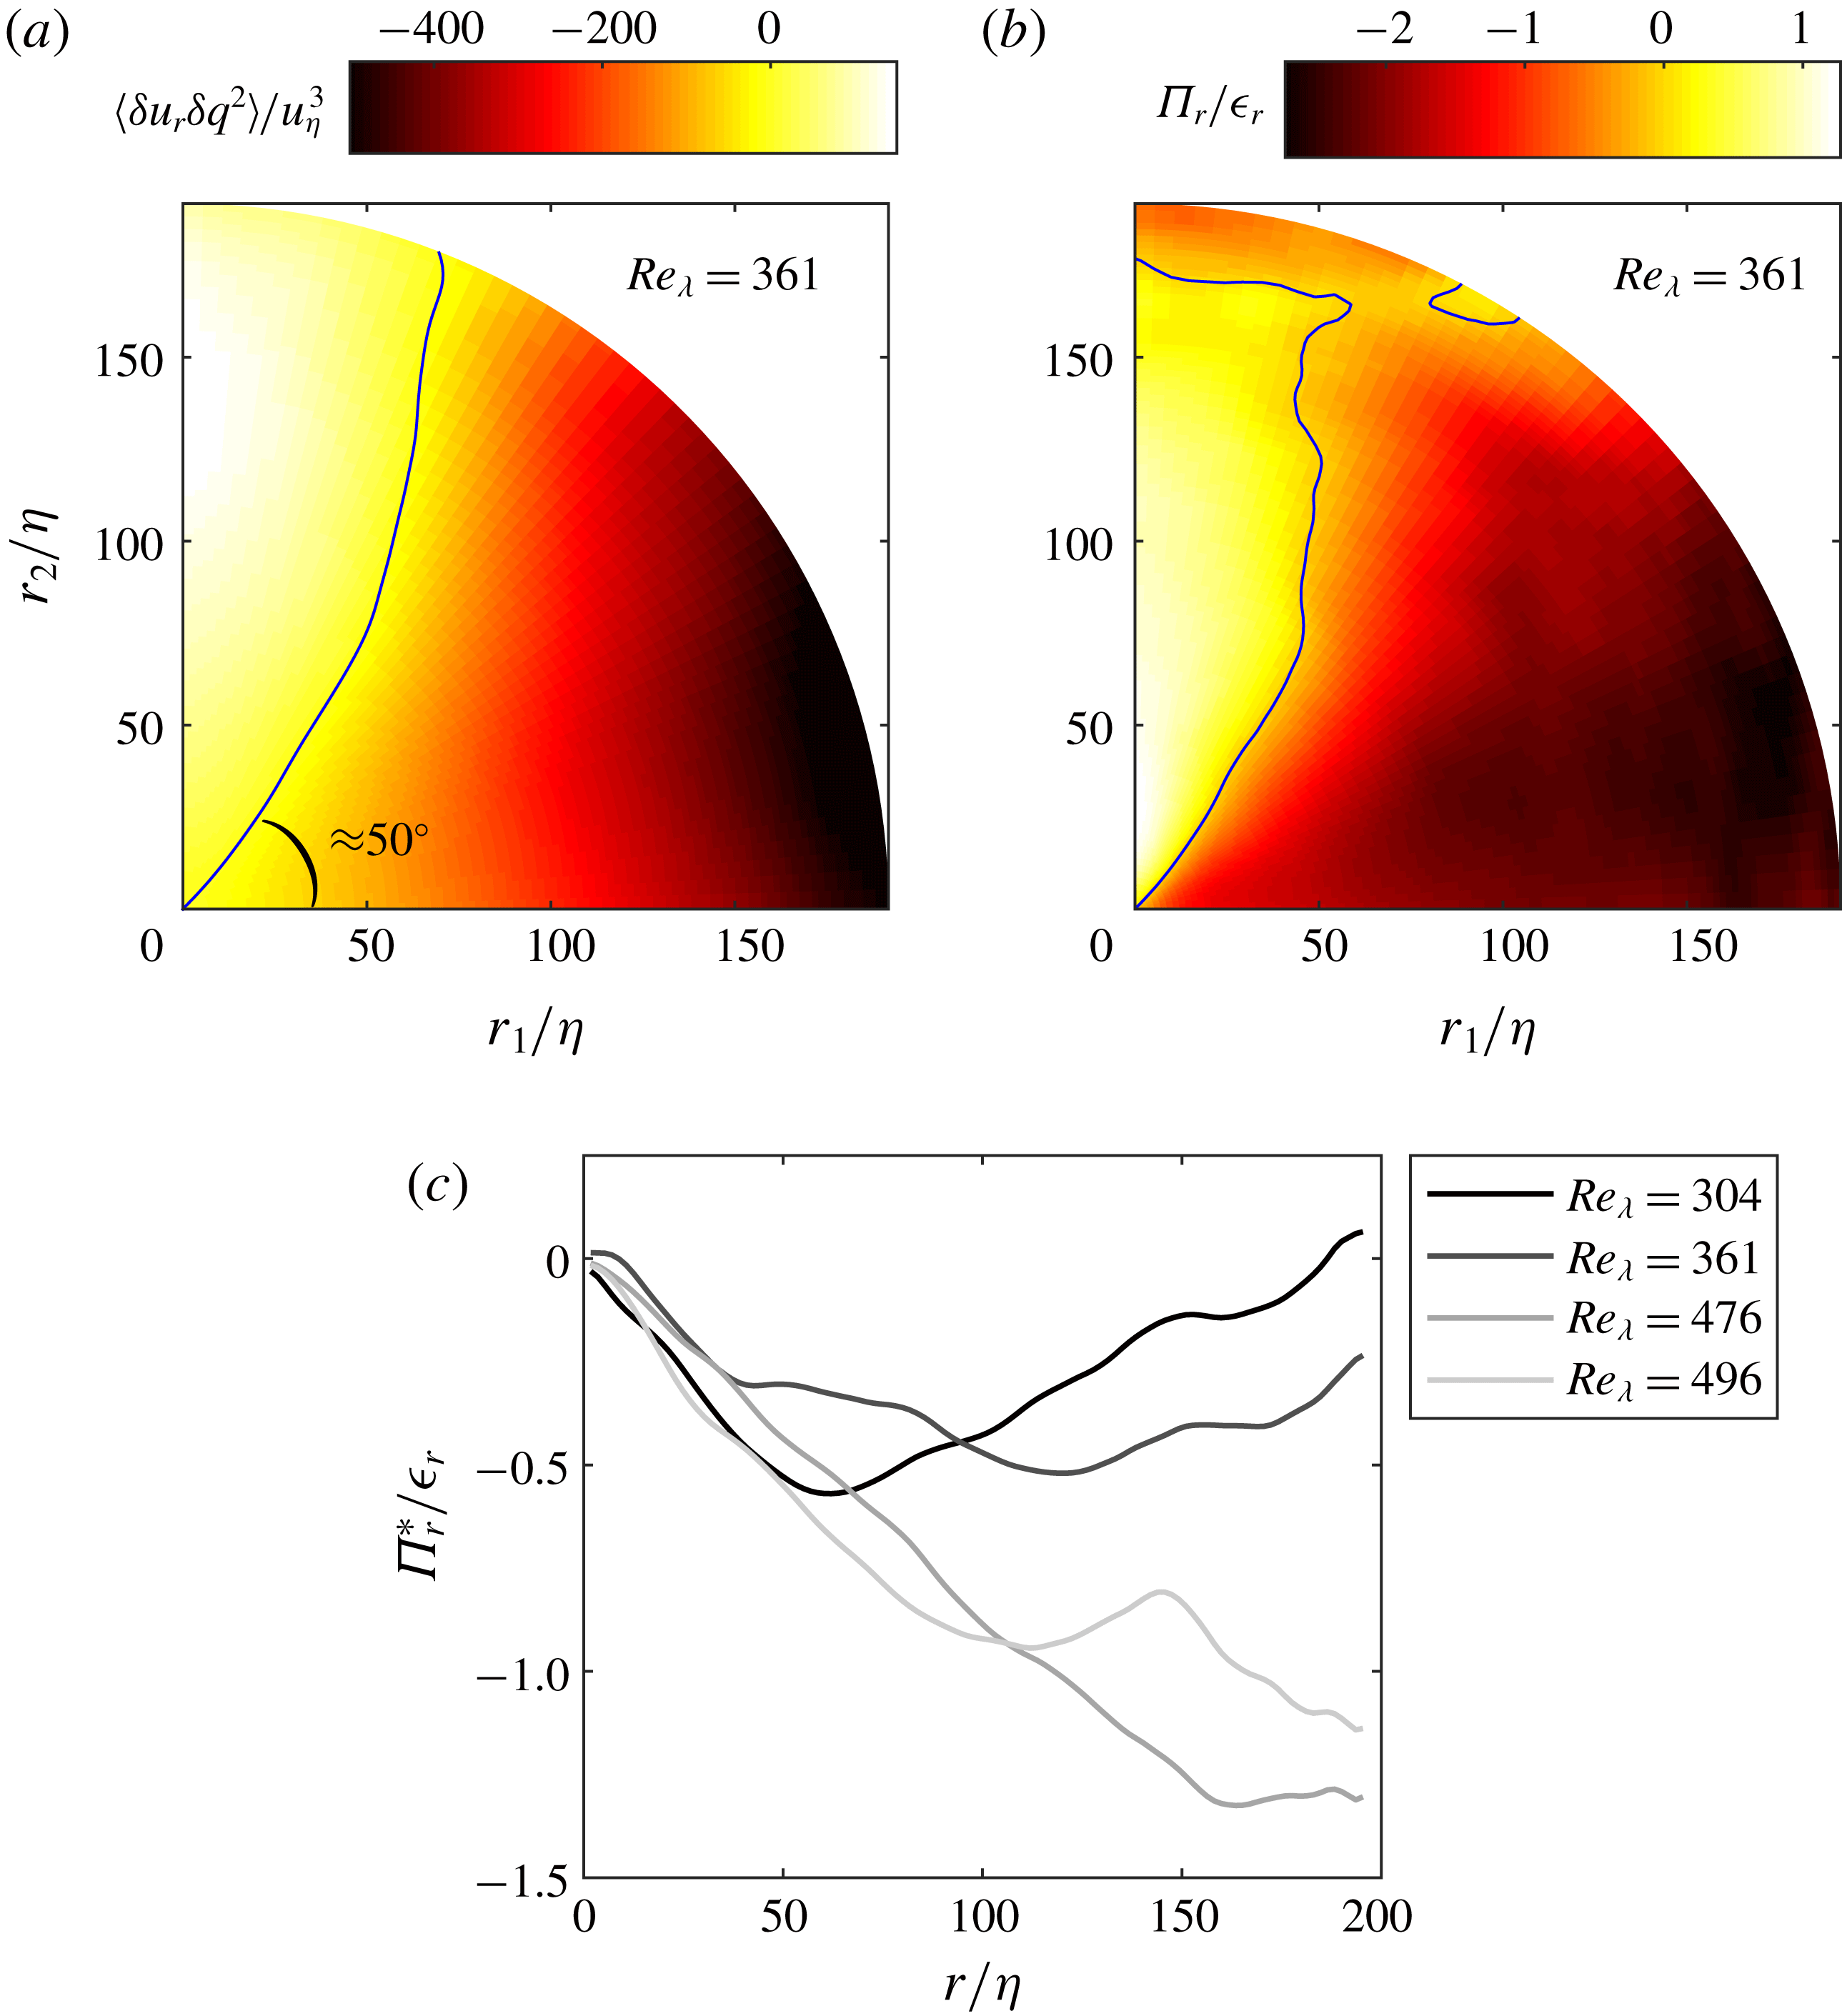
Figure 16. Radial component of the flux of
![]() $\langle \unicode[STIX]{x1D6FF}u_{i}\unicode[STIX]{x1D6FF}q^{2}\rangle$
normalized by
$\langle \unicode[STIX]{x1D6FF}u_{i}\unicode[STIX]{x1D6FF}q^{2}\rangle$
normalized by
![]() $u_{\unicode[STIX]{x1D702}}^{3}$
(a) and the radial component of the nonlinear scale-to-scale energy transfer normalized by
$u_{\unicode[STIX]{x1D702}}^{3}$
(a) and the radial component of the nonlinear scale-to-scale energy transfer normalized by
![]() $\unicode[STIX]{x1D716}_{r}$
(b) for the case
$\unicode[STIX]{x1D716}_{r}$
(b) for the case
![]() $Re_{\unicode[STIX]{x1D706}}=361$
with zero-level contours (solid lines). The solid angle-averaged nonlinear transfer
$Re_{\unicode[STIX]{x1D706}}=361$
with zero-level contours (solid lines). The solid angle-averaged nonlinear transfer
![]() $\unicode[STIX]{x1D6F1}_{r}^{\ast }$
is shown for all cases in (c) normalized by
$\unicode[STIX]{x1D6F1}_{r}^{\ast }$
is shown for all cases in (c) normalized by
![]() $\unicode[STIX]{x1D716}_{r}$
.
$\unicode[STIX]{x1D716}_{r}$
.
These results corroborate recent findings by Gomes-Fernandes et al. (Reference Gomes-Fernandes, Ganapathisubramani and Vassilicos2015) and Alves Portela et al. (Reference Alves Portela, Papadakis and Vassilicos2017). These authors examined various locations in fully turbulent wakes with well-defined
![]() $-5/3$
energy spectra as predicted by Kolmogorov (Reference Kolmogorov1941), and demonstrated the coexistence of both forward and inverse cascade behaviours in different directions in scale space. Our configuration also displays a
$-5/3$
energy spectra as predicted by Kolmogorov (Reference Kolmogorov1941), and demonstrated the coexistence of both forward and inverse cascade behaviours in different directions in scale space. Our configuration also displays a
![]() $-5/3$
spectrum over a significant wavenumber range (Carter et al.
Reference Carter, Petersen, Amili and Coletti2016). However, unlike the above-mentioned wake flows, it is quasi-homogeneous, free of significant shear and with negligible mean flow advection compared to the turbulent fluctuations. In this condition the advection, shear production and linear transfer terms are expected to be at most secondary. This is confirmed in appendix B, where we present contour maps of all terms in (5.1) for the
$-5/3$
spectrum over a significant wavenumber range (Carter et al.
Reference Carter, Petersen, Amili and Coletti2016). However, unlike the above-mentioned wake flows, it is quasi-homogeneous, free of significant shear and with negligible mean flow advection compared to the turbulent fluctuations. In this condition the advection, shear production and linear transfer terms are expected to be at most secondary. This is confirmed in appendix B, where we present contour maps of all terms in (5.1) for the
![]() $Re_{\unicode[STIX]{x1D706}}=496$
case, and the approximations made to estimate them. Alves Portela et al. (Reference Alves Portela, Papadakis and Vassilicos2017) prudently remarked that mechanisms related to inhomogeneity might have influenced their findings. However, the present analysis indicates that forward and inverse energy transfer may coexist, both leaving distinct statistical footprints, even in quasi-homogeneous turbulence.
$Re_{\unicode[STIX]{x1D706}}=496$
case, and the approximations made to estimate them. Alves Portela et al. (Reference Alves Portela, Papadakis and Vassilicos2017) prudently remarked that mechanisms related to inhomogeneity might have influenced their findings. However, the present analysis indicates that forward and inverse energy transfer may coexist, both leaving distinct statistical footprints, even in quasi-homogeneous turbulence.
Perhaps the most evident trait our flow configuration shares with those studied by Gomes-Fernandes et al. (Reference Gomes-Fernandes, Ganapathisubramani and Vassilicos2015) and Alves Portela et al. (Reference Alves Portela, Papadakis and Vassilicos2017) is the anisotropy. It does indeed seem obvious that the maps of energy flux vectors and transfer rates in figures 14 and 15 and are strongly influenced by the anisotropy in the flow, which breaks the spherical symmetry expected in perfectly homogeneous and isotropic turbulence. However, it may not be trivial to determine a direct correspondence between the scale-space orientation of the energy transfer and the type of anisotropy. The present case approximates prolate axisymmetric turbulence (in the terminology of Bewley et al. Reference Bewley, Chang and Bodenschatz2012), i.e. with stronger turbulence activity along the axis of symmetry. Such approximation was found to apply reasonably well also to grid turbulence and plane cylinder wakes (George Reference George1992; Mi & Antonia Reference Mi and Antonia2010; Rabey et al. Reference Rabey, Wynn and Buxton2015), therefore one could expect strong similarities between our study and those of Gomes-Fernandes et al. (Reference Gomes-Fernandes, Ganapathisubramani and Vassilicos2015) and Alves Portela et al. (Reference Alves Portela, Papadakis and Vassilicos2017). However, the former showed energy backscatter along the streamwise direction, while the latter found such behaviour in either streamwise or cross-stream direction depending on the location. Evidently other factors beyond the anisotropy ratio influence the orientation of the cascade in these different cases. In the following, we specifically consider the relation between the inter-scale energy transfer and the instantaneous turbulence structure, as described by the enstrophy and dissipation fields.
5.3 Energy transfer in hyperactive and sleeping states
The cascade of kinetic energy in scale space is the consequence of the evolution and mutual interaction of turbulent structures in physical space (Davidson Reference Davidson2004). A mutual hierarchy of dissipative structures is also central to the successful cascade model theorized by She & Leveque (Reference She and Leveque1994). While different (and sometimes conflicting) views of the exact cascading mechanisms have been proposed (for example concerning the role of vortex stretching, Tsinober Reference Tsinober2001; Goto Reference Goto2008), the consensus is that enstrophy and strain rate (and their production/destruction) are the key quantities in the process. In § 4.2 we showed how, in the imaged portion of the present flow, the spatially averaged enstrophy and strain rate vary broadly from one realization to another, leading us to the definition of hyperactive and sleeping states. These were found to contain very large and very small numbers of intense structures, respectively. Given the prominent role of high-enstrophy and high-strain features in the energy transfer process, we conjecture that the analysis carried out in § 5.2 will yield qualitatively different results when confined to hyperactive versus sleeping states. This is verified in the following.
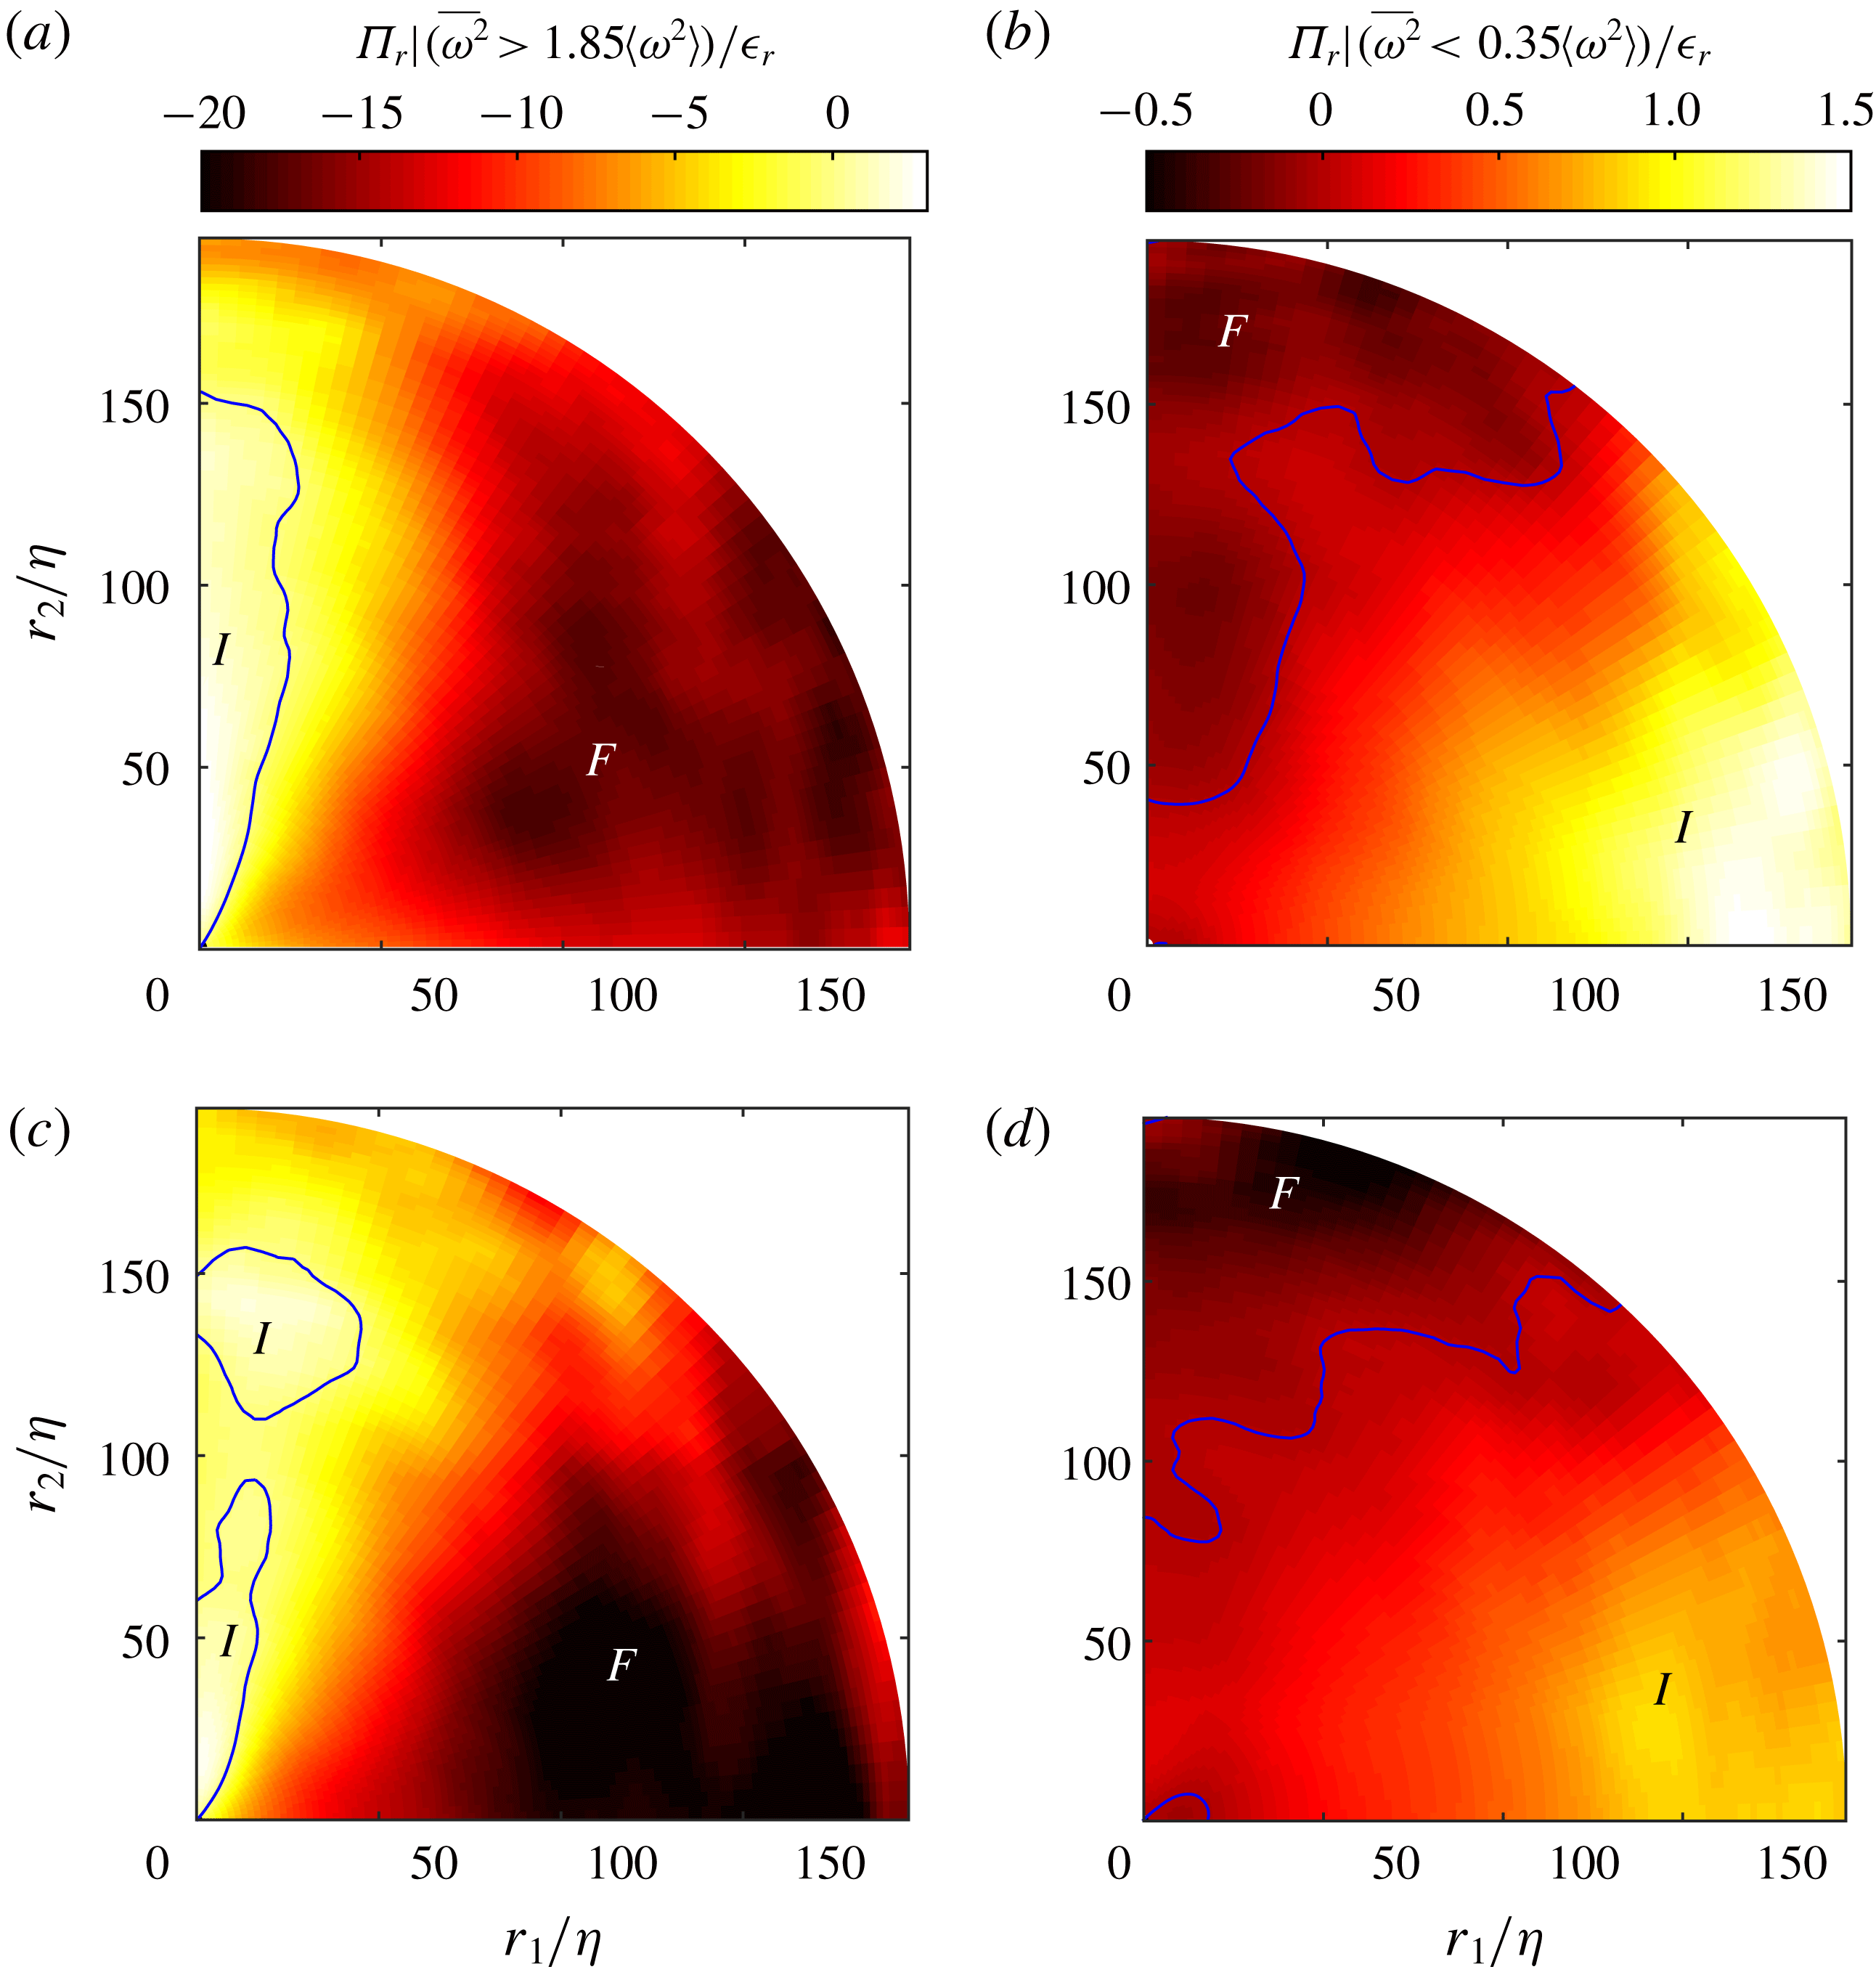
Figure 17. Normalized nonlinear scale-to-scale energy transfer conditioned on hyperactive (a,c) and sleeping (b,d) states for
![]() $Re_{\unicode[STIX]{x1D706}}=361$
(a,b) and
$Re_{\unicode[STIX]{x1D706}}=361$
(a,b) and
![]() $Re_{\unicode[STIX]{x1D706}}=496$
(c,d). The lines along zero indicate the transition from forward (
$Re_{\unicode[STIX]{x1D706}}=496$
(c,d). The lines along zero indicate the transition from forward (
![]() $F$
) to inverse (
$F$
) to inverse (
![]() $I$
) energy transfers.
$I$
) energy transfers.
In figure 17 we display contour maps of the radial portion of the nonlinear energy transfer rate
![]() $\unicode[STIX]{x1D6F1}_{r}$
(normalized by the two-point average dissipation
$\unicode[STIX]{x1D6F1}_{r}$
(normalized by the two-point average dissipation
![]() $\unicode[STIX]{x1D716}_{r}$
) calculated using only hyperactive (panels a and c) and sleeping (panels b and d) states, for the cases
$\unicode[STIX]{x1D716}_{r}$
) calculated using only hyperactive (panels a and c) and sleeping (panels b and d) states, for the cases
![]() $Re_{\unicode[STIX]{x1D706}}=361$
and
$Re_{\unicode[STIX]{x1D706}}=361$
and
![]() $496$
. Figure 17(a,b) can be directly compared with the unconditioned map in figure 16(b). Given the smaller sample size (200 versus 2000 realizations) and since
$496$
. Figure 17(a,b) can be directly compared with the unconditioned map in figure 16(b). Given the smaller sample size (200 versus 2000 realizations) and since
![]() $\unicode[STIX]{x1D6F1}_{r}$
, is a gradient of
$\unicode[STIX]{x1D6F1}_{r}$
, is a gradient of
![]() $\langle \unicode[STIX]{x1D6FF}u_{i}\unicode[STIX]{x1D6FF}q^{2}\rangle$
, the uncertainty in the conditioned third-order structure function is larger (see appendix A) and propagates into
$\langle \unicode[STIX]{x1D6FF}u_{i}\unicode[STIX]{x1D6FF}q^{2}\rangle$
, the uncertainty in the conditioned third-order structure function is larger (see appendix A) and propagates into
![]() $\unicode[STIX]{x1D6F1}_{r}$
. However, it does not overshadow the qualitative trends. In hyperactive states, the energy transfer is highly enhanced and directed towards smaller scales over almost the entire space of separations. The pattern is similar to figure 16(b), in that separations closer to
$\unicode[STIX]{x1D6F1}_{r}$
. However, it does not overshadow the qualitative trends. In hyperactive states, the energy transfer is highly enhanced and directed towards smaller scales over almost the entire space of separations. The pattern is similar to figure 16(b), in that separations closer to
![]() $\unicode[STIX]{x1D703}=0$
are associated with strong forward inter-scale fluxes, while those closer to
$\unicode[STIX]{x1D703}=0$
are associated with strong forward inter-scale fluxes, while those closer to
![]() $\unicode[STIX]{x1D703}=\unicode[STIX]{x03C0}/2$
show weaker and even inverse fluxes. Compared to the unconditioned map, the backscatter is limited to smaller pockets. On the other hand, in sleeping states the
$\unicode[STIX]{x1D703}=\unicode[STIX]{x03C0}/2$
show weaker and even inverse fluxes. Compared to the unconditioned map, the backscatter is limited to smaller pockets. On the other hand, in sleeping states the
![]() $\unicode[STIX]{x1D6F1}_{r}$
distribution is fundamentally different: the energy transfer is depressed by at least an order of magnitude, and directed towards larger scales over a large portion of scale space, especially for orientations close to
$\unicode[STIX]{x1D6F1}_{r}$
distribution is fundamentally different: the energy transfer is depressed by at least an order of magnitude, and directed towards larger scales over a large portion of scale space, especially for orientations close to
![]() $\unicode[STIX]{x1D703}=0$
. These features are found in all investigated cases; while they appear more pronounced at higher
$\unicode[STIX]{x1D703}=0$
. These features are found in all investigated cases; while they appear more pronounced at higher
![]() $Re_{\unicode[STIX]{x1D706}}$
, a clear trend cannot be discerned over the considered range.
$Re_{\unicode[STIX]{x1D706}}$
, a clear trend cannot be discerned over the considered range.
In conclusion, the states characterized by intense enstrophy and strain rate appear primarily responsible for the inter-scale transfer of energy. In these realizations the cascade is mostly directed from larger to smaller scales, but there are also sizeable portions of scale-space with significant backscatter. Moreover, because the fine-scale activity in these states is strongly correlated with intense large-scale velocity gradients (addressed in § 4.2), a significant portion of the transfer might be due to distant-scale interactions, incompatible with Kolmogorov’s phenomenology. Sleeping states account for weak energy transfers, and their contribution to the polar-averaged
![]() $\unicode[STIX]{x1D6F1}_{r}$
is indeed marginal. Their local-in-space transfers, however, are not negligible, and interestingly they are predominantly directed towards larger scales. Energy backscatter, as discussed in § 1, has important consequences for the theoretical understanding and numerical modelling of turbulent flows. In this perspective the background turbulent fluctuations, often overlooked (Tsinober, Ortenberg & Shtilman Reference Tsinober, Ortenberg and Shtilman1999), may play a significant role and probably deserve more attention. We remark, however, that the stronger inverse transfers in the sleeping states happen in portions of scale space where the overall cascade is forward. Therefore, in the present flow, the sleeping states do not account for the inverse cascade in the transverse direction highlighted in figure 15. These are rather due to the much stronger inverse transfers in the hyperactive states. This is consistent with the argument of Meneveau & Sreenivasan (Reference Meneveau and Sreenivasan1991) that significant backscatter requires strong intermittent fluctuations.
$\unicode[STIX]{x1D6F1}_{r}$
is indeed marginal. Their local-in-space transfers, however, are not negligible, and interestingly they are predominantly directed towards larger scales. Energy backscatter, as discussed in § 1, has important consequences for the theoretical understanding and numerical modelling of turbulent flows. In this perspective the background turbulent fluctuations, often overlooked (Tsinober, Ortenberg & Shtilman Reference Tsinober, Ortenberg and Shtilman1999), may play a significant role and probably deserve more attention. We remark, however, that the stronger inverse transfers in the sleeping states happen in portions of scale space where the overall cascade is forward. Therefore, in the present flow, the sleeping states do not account for the inverse cascade in the transverse direction highlighted in figure 15. These are rather due to the much stronger inverse transfers in the hyperactive states. This is consistent with the argument of Meneveau & Sreenivasan (Reference Meneveau and Sreenivasan1991) that significant backscatter requires strong intermittent fluctuations.
In recent years the topics of energy cascade and intermittency in turbulence have been tackled with novel analytical and numerical tools, notably through decimation of the Navier–Stokes equations, which are evolved on a restricted set of Fourier modes (Frisch et al. Reference Frisch, Pomyalov, Procaccia and Ray2012; Lanotte et al. Reference Lanotte, Benzi, Malapaka, Toschi and Biferale2015; Ray Reference Ray2015; Buzzicotti et al. Reference Buzzicotti, Bhatnagar, Biferale, Lanotte and Ray2016). In particular this approach has been used to probe the connection between intermittent small-scale structure and the inter-scale energy transfer. For the three-dimensional case, it was found that the cascade is robust to even a severe decimation of the modes, while intermittency is quenched as soon as the effective dimension of the set is decreased just below the integer value of 3 (Lanotte et al. Reference Lanotte, Benzi, Malapaka, Toschi and Biferale2015). A connection may be drawn between the non-intermittent realizations of such artificial class of flows and the sleeping states identified here, also considering that the most intense inverse transfers are found in the hyperactive states. However, further research is required to determine whether the present type of experiments can be used to corroborate those analytical and numerical results for which full 3-D information is crucial.
6 Conclusions
We have used two-dimensional PIV measurements of a laboratory flow to examine the fine-scale structure of homogeneous turbulence, the interaction between scales small and large, and the energy transfer across them. Those topics have been the focus of numerous past investigations (although rarely using quantitative flow imaging), and therefore we have tried to place our results in the context of existing views, however incomplete. The study has leveraged a jet-stirred zero-mean-flow chamber that produces anisotropic and (to a good approximation) homogeneous turbulence over a volume much larger than the integral length. This removes the influence of boundaries, shear-driven mechanisms and convective effects, and reduces possible impacts of inhomogeneities on the two-point statistics. We find trends which are qualitatively independent of Reynolds number in the considered range,
![]() $Re_{\unicode[STIX]{x1D706}}\approx 300{-}500$
. While the latter is arguably sufficient to produce an inertial range (or at least a scaling range, Qian Reference Qian1997), finite Reynolds number effects could be significant and need to be evaluated in future studies examining similar aspects. Also, the variation of large-scale anisotropy with
$Re_{\unicode[STIX]{x1D706}}\approx 300{-}500$
. While the latter is arguably sufficient to produce an inertial range (or at least a scaling range, Qian Reference Qian1997), finite Reynolds number effects could be significant and need to be evaluated in future studies examining similar aspects. Also, the variation of large-scale anisotropy with
![]() $Re_{\unicode[STIX]{x1D706}}$
in the data sets does not allow us to disentangle these effects.
$Re_{\unicode[STIX]{x1D706}}$
in the data sets does not allow us to disentangle these effects.
The analysis of the enstrophy and dissipation agrees with previous findings, including recent numerical results which had not yet been compared with experiments (Yeung et al.
Reference Yeung, Donzis and Sreenivasan2012, Reference Yeung, Zhai and Sreenivasan2015). These fields show highly intermittent distributions, with significant probability of events hundreds of times more intense than the mean values. The extremely weak events show clear chi-square scaling over many decades, indicating that over those ranges the velocity gradients are essentially random variables. The instances of extremely strong dissipation and enstrophy tend to happen concurrently, in agreement with theoretical arguments and recent simulations at very high Reynolds numbers. The instantaneous realizations suggest, and the statistical analysis confirms, that the high-enstrophy and high-dissipation regions are shaped as tube-like and sheet-like objects, respectively, whose thickness is
![]() $4$
–
$4$
–
![]() $8\unicode[STIX]{x1D702}$
and the largest dimension can be of the order of the field of view (approximately
$8\unicode[STIX]{x1D702}$
and the largest dimension can be of the order of the field of view (approximately
![]() $200\unicode[STIX]{x1D702}$
). The intense structures tend to form large connected objects of scale-invariant topology with definite fractal dimensions (Moisy & Jiménez Reference Moisy and Jiménez2004). In keeping with the concurrency of extreme events for both fields, high-dissipation and high-enstrophy structures often overlap, the former usually wrapped around the latter. Kolmogorov scaling collapses the data in the considered range of Reynolds numbers reasonably well.
$200\unicode[STIX]{x1D702}$
). The intense structures tend to form large connected objects of scale-invariant topology with definite fractal dimensions (Moisy & Jiménez Reference Moisy and Jiménez2004). In keeping with the concurrency of extreme events for both fields, high-dissipation and high-enstrophy structures often overlap, the former usually wrapped around the latter. Kolmogorov scaling collapses the data in the considered range of Reynolds numbers reasonably well.
The small-scale activity, characterized by the level of enstrophy (or, analogously, dissipation) spatially averaged over each instantaneous realization, is found to be strongly correlated with the large-scale fluctuations. This echoes several recent observations of amplitude modulation between distant scales. However, those were reported in advection-dominated shear flows, and often explained by convective mechanisms (Buxton & Ganapathisubramani Reference Buxton and Ganapathisubramani2014). Here instead mean advection and shear are negligible, and the distant-scale correlation is clearer when using large-scale velocity gradients, which are Galilean invariant. This suggests that the cross-talk between large and small scales is ubiquitous in turbulence, and not connected to a specific production mechanism. The dependence on the large-scale energy input, quantified by the conditioned energy structure function, is stronger at the smaller scales, contrary to arguments of small-scale universality (Kolmogorov Reference Kolmogorov1941). This may be a consequence of the dissipation rate (and therefore the Kolmogorov length) fluctuating along with the energy input (Blum et al. Reference Blum, Bewley, Bodenschatz, Gibert, Gylfason, Mydlarski, Voth, Xu and Yeung2011).
The wide temporal variation of turbulence activity has prompted us to isolate states of the flow with especially high (hyperactive) and low (sleeping) levels of strain rate and enstrophy. These are also characterized by an abundance/lack of discrete structures, and strong/weak large-scale velocity gradients. Moreover, the hyperactive and sleeping states contribute very differently to the inter-scale energy transfer. The latter is characterized in scale space by the nonlinear transfer term in the Kármán–Howarth–Monin equation, which is confirmed to dominate the present quasi-homogeneous configuration. The polar map of both the energy transfer and the third-order structure function indicate a forward cascade to smaller scales along the jet-axis direction, and an inverse cascade to larger scales along the transverse direction. Qualitatively similar behaviours were recently found in wake turbulence (Gomes-Fernandes et al. Reference Gomes-Fernandes, Ganapathisubramani and Vassilicos2015; Alves Portela et al. Reference Alves Portela, Papadakis and Vassilicos2017), but in very inhomogeneous regions of the flow. The hyperactive states are characterized by very intense energy transfers, while the sleeping states show much weaker fluxes, largely directed from small to large scales.
These results trigger several considerations on some of the open issues mentioned in § 1, starting with the relevance of the intense coherent structures in homogeneous turbulence. The small volume fraction occupied by these objects (Moisy & Jiménez Reference Moisy and Jiménez2004), while connecting them to the intermittent nature of turbulence, also calls into question their dynamic importance. As noted by Jiménez & Wray (Reference Jiménez and Wray1998), there is no reason for the cascading process to start with filaments of the order of the Kolmogorov scale, and such filaments more likely represent the last stage in the energy transfer process (Goto Reference Goto2008). On the other hand, the apparent correlation between turbulence activity at distant scales suggests also a different possibility, i.e. that the small intense structures are produced directly from much larger ones in a one-step process. While such non-local interactions in scale space conflict with the view of Kolmogorov (Reference Kolmogorov1941), they are compatible with the original cascade picture of Richardson (Reference Richardson1920) in physical space. Indeed, the indicators we have utilized in § 4.1 ultimately tell us that the small-scale activity is enhanced at the same locations and instants at which the large-scale fluctuations are strong. Moreover, the self-similar geometry of the coherent structures over a wide range of scales suggests that merging and break-up of eddies (with associated transfer of energy in physical space) are prevalent. Recent numerical efforts in Lagrangian tracking of coherent structures highlight the importance of this cascade in physical space, both for understanding and modelling of turbulence dynamics (Lozano-Durán & Jiménez Reference Lozano-Durán and Jiménez2014; Cardesa et al. Reference Cardesa, Vela-Martín and Jiménez2017). The present experimental results support this view.
When seen in the classic scale-space framework, the transfer of energy in the present flow is clearly a combination of forward and inverse cascade. Instantaneously, this is the case for all turbulent flows (even homogeneous and isotropic), with large fluctuations of both positive and negative inter-scale fluxes which can be decomposed in coexisting direct and inverse cascades (Aoyama et al. Reference Aoyama, Ishihara, Kaneda, Yokokawa, Itakura and Uno2005; Alexakis Reference Alexakis2017). However, only recent studies in the near region of wake/grid turbulence by Vassilicos group demonstrated cases in which the ensemble-average transfer is towards larger scales over a large portion of the separation space. Our results in approximately homogeneous turbulence suggest that this phenomenon may be common to a much larger class of flows. Here the anisotropy is clearly the feature that allows the inverse energy transfer to manifest itself. Still, identifying the specific underlying mechanism may not be a trivial task, and is deferred to future studies. This will likely require the examination of both real-space and scale-space dynamics.
The completeness of information achievable by DNS would enable the exploration of these themes in greater depth. However, numerically setting up a homogeneous anisotropic flow similar to the present one may not be straightforward. Homogeneity and anisotropy are both needed to highlight key aspects discussed here while keeping the minimal turbulence dynamics; but simulations that generate homogeneous anisotropic turbulence usually do so in presence of shear, stratification or rotation. As was discussed in Carter & Coletti (Reference Carter and Coletti2017), the ability to isolate anisotropy without the superposition of these complex mechanisms is a distinctive feature of this experimental facility. Additionally, distant-scale interactions can only be investigated if the low wavenumbers are not contaminated by the forcing, and this poses a severe constraint on DNS (Davidson Reference Davidson2004). Future numerical efforts designed to take these issues into account are warranted.
It is possible that the specific forcing we utilize also plays a role in determining the direction of the energy transfer. Several authors have remarked that both real and artificial turbulence configurations with non-vanishing helicity exhibit an inverse cascade behaviour (Waleffe Reference Waleffe1992; Biferale, Musacchio & Toschi Reference Biferale, Musacchio and Toschi2012; Herbert et al. Reference Herbert, Daviaud, Dubrulle, Nazarenko and Naso2012; Alexakis Reference Alexakis2017). Helical structures are among the dominant coherent motions of axisymmetric jets (e.g. Iqbal & Thomas Reference Iqbal and Thomas2007). It seems likely that the interactions between the turbulent jets in our facility would destroy this organization (unlike in von Kármán flows, where the swirling motion is continuously imposed by the forcing and boundary conditions, Herbert et al. Reference Herbert, Daviaud, Dubrulle, Nazarenko and Naso2012). Yet, one cannot exclude that part of it could survive in the apparently homogeneous turbulence region, influencing the direction of the energy fluxes.
Several studies, including this one, have shown how the fluctuation of the energy input, referred to as large-scale (or integral-scale) intermittency, leaves its footprint on the local dissipation rate. As discussed in detail elsewhere (Frisch Reference Frisch1995; Mouri et al. Reference Mouri, Takaoka, Hori and Kawashima2006; Chien et al. Reference Chien, Blum and Voth2013), this was the original sense of Landau’s famous footnote criticizing Kolmogorov’s notion of small-scale universality (Landau & Lifshitz Reference Landau and Lifshitz1959); his comment did not address the intense dissipation events that lead to anomalous scaling, i.e. the so-called small-scale (or internal) intermittency, although Kolmogorov (Reference Kolmogorov1962) gave him credit for it. If, however, the small coherent structures are connected to coarse-grained velocities and velocity gradients, then large-scale and small-scale intermittency may be more closely related than usually thought. The large scales being non-universal, a similar view would put in question the notion of universality of the small scales, which instead received strong support not only at very large (e.g. Saddoughi & Veeravalli Reference Saddoughi and Veeravalli1994) but even at moderate Reynolds numbers, at least in terms of scaling behaviour (Schumacher et al. Reference Schumacher, Scheel, Krasnov, Donzis, Yakhot and Sreenivasan2014). While an accepted paradigm to reconcile universality and distant-scale interaction has not yet emerged, the recent analysis of several turbulent flows in the strain-rate eigenframe has suggested the existence of a prevalent flow pattern which may account for many of the observations: a shear layer structure containing swirling motions and formed between large regions of uniform flow (Elsinga & Marusic Reference Elsinga and Marusic2010; Elsinga et al. Reference Elsinga, Ishihara, Goudar, da Silva and Hunt2017).
Future experimental studies will overcome the limitations of the present measurements, including their two-dimensional nature, the limited dynamic spatial range, and the lack of temporal resolution. These prevented us from characterizing the spatial organization of the discrete structures, and the large-scale motions most often correlated with their appearance. In the future, using three-dimensional imaging and/or very large camera sensors, it will be interesting to verify whether the small vortices are clustered around shear layer structures, as indicated by Ishihara et al. (Reference Ishihara, Kaneda and Hunt2013) and Hunt et al. (Reference Hunt, Ishihara, Worth and Kaneda2014). Such experiments should ideally be time-resolved in order to determine the temporal correlation between events at different scales, which is especially important to better understand the energy transfer dynamics in physical space.
Acknowledgement
The present work was supported in part by the US Office for Naval Research (grant N00014-17-1-2578).
Appendix A. Uncertainty in third-order structure functions
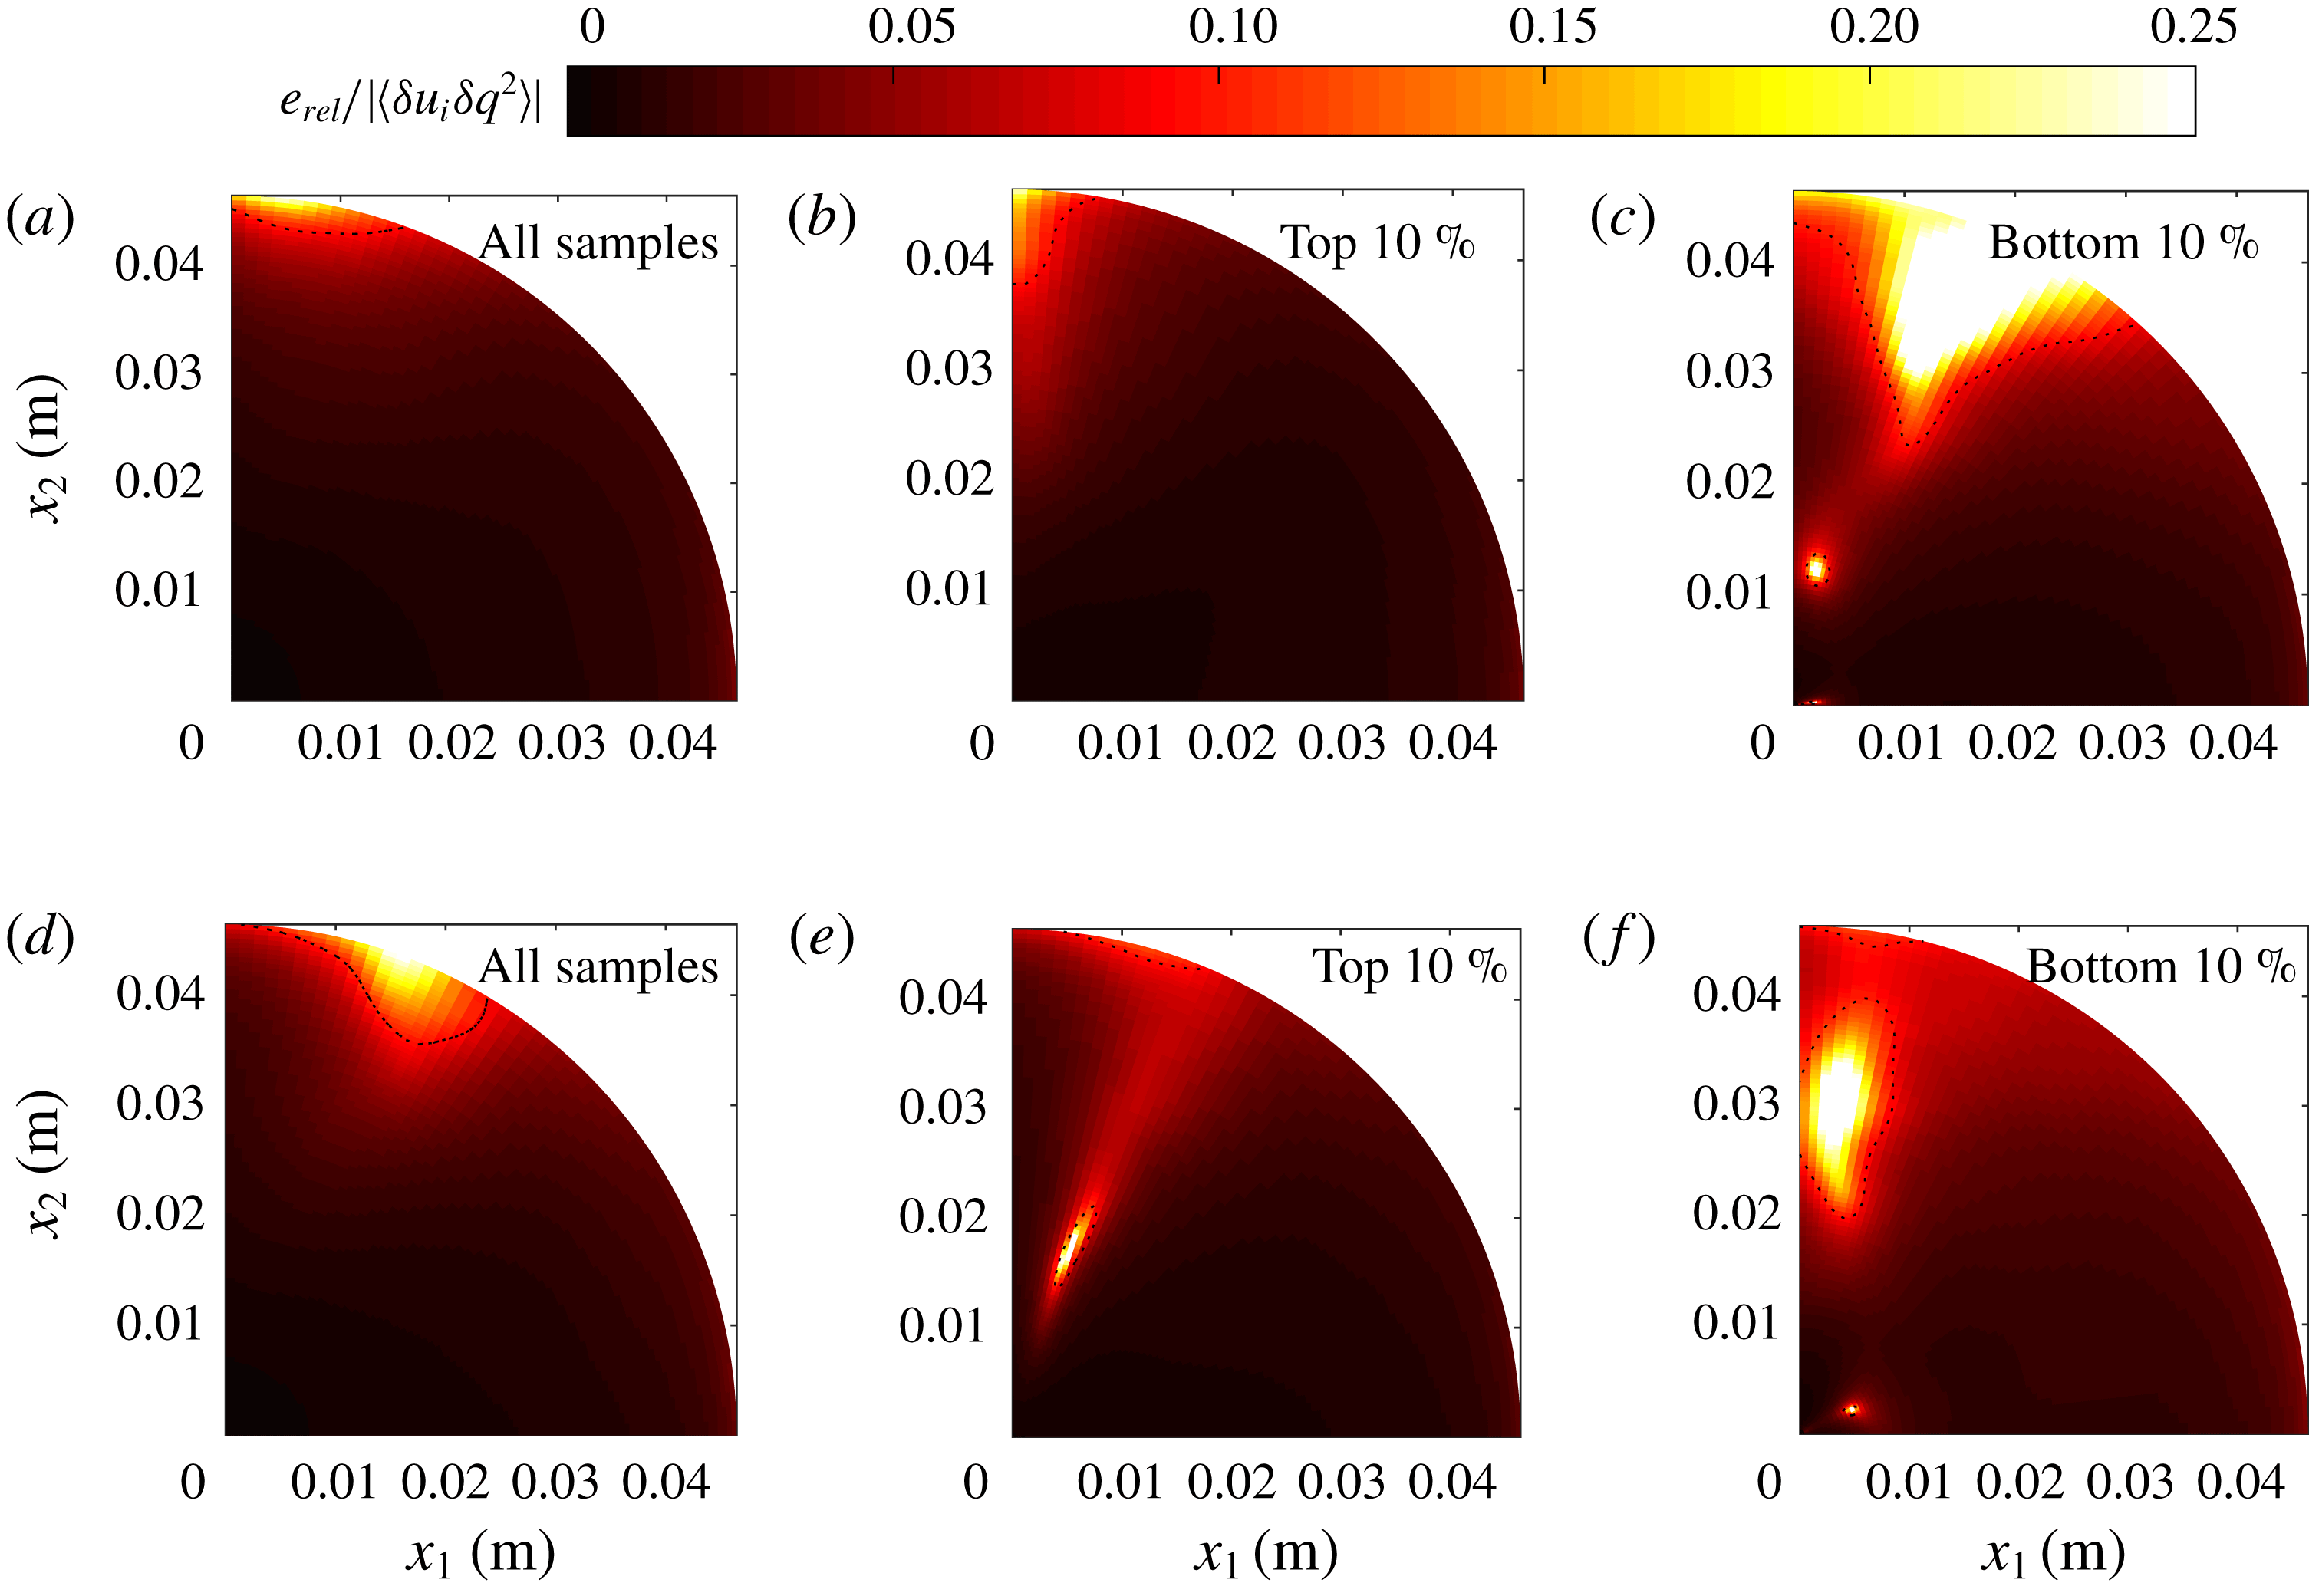
Figure 18. Relative uncertainty
![]() $e_{rel}/|\langle \unicode[STIX]{x1D6FF}u_{i}\unicode[STIX]{x1D6FF}q^{2}\rangle |$
of the third-order structure function for the cases
$e_{rel}/|\langle \unicode[STIX]{x1D6FF}u_{i}\unicode[STIX]{x1D6FF}q^{2}\rangle |$
of the third-order structure function for the cases
![]() $Re_{\unicode[STIX]{x1D706}}=361$
(a–c) and
$Re_{\unicode[STIX]{x1D706}}=361$
(a–c) and
![]() $496$
(d–f) for all samples (a,d), hyperactive samples (b,e) and sleeping samples (c,f). The dotted contour is drawn at 10 % of relative uncertainty.
$496$
(d–f) for all samples (a,d), hyperactive samples (b,e) and sleeping samples (c,f). The dotted contour is drawn at 10 % of relative uncertainty.
We estimate the statistical uncertainty of the third-order structure functions (20 : 1 confidence level) as
![]() $e_{rel}=\pm 1.96\unicode[STIX]{x1D70E}/\sqrt{N}$
(Benedict & Gould Reference Benedict and Gould1996), where
$e_{rel}=\pm 1.96\unicode[STIX]{x1D70E}/\sqrt{N}$
(Benedict & Gould Reference Benedict and Gould1996), where
![]() $\unicode[STIX]{x1D70E}$
is the variance of
$\unicode[STIX]{x1D70E}$
is the variance of
![]() $\langle \unicode[STIX]{x1D6FF}u_{i}\unicode[STIX]{x1D6FF}q^{2}\rangle$
and
$\langle \unicode[STIX]{x1D6FF}u_{i}\unicode[STIX]{x1D6FF}q^{2}\rangle$
and
![]() $N$
is the number of independent samples at separation
$N$
is the number of independent samples at separation
![]() $\boldsymbol{r}$
. The variance and the number of samples are computed at each location in scale space and the relative uncertainty is plotted in figure 18 for the cases
$\boldsymbol{r}$
. The variance and the number of samples are computed at each location in scale space and the relative uncertainty is plotted in figure 18 for the cases
![]() $Re_{\unicode[STIX]{x1D706}}=361$
and
$Re_{\unicode[STIX]{x1D706}}=361$
and
![]() $496$
.
$496$
.
Appendix B. Calculation of terms in Kármán–Howarth–Monin equation
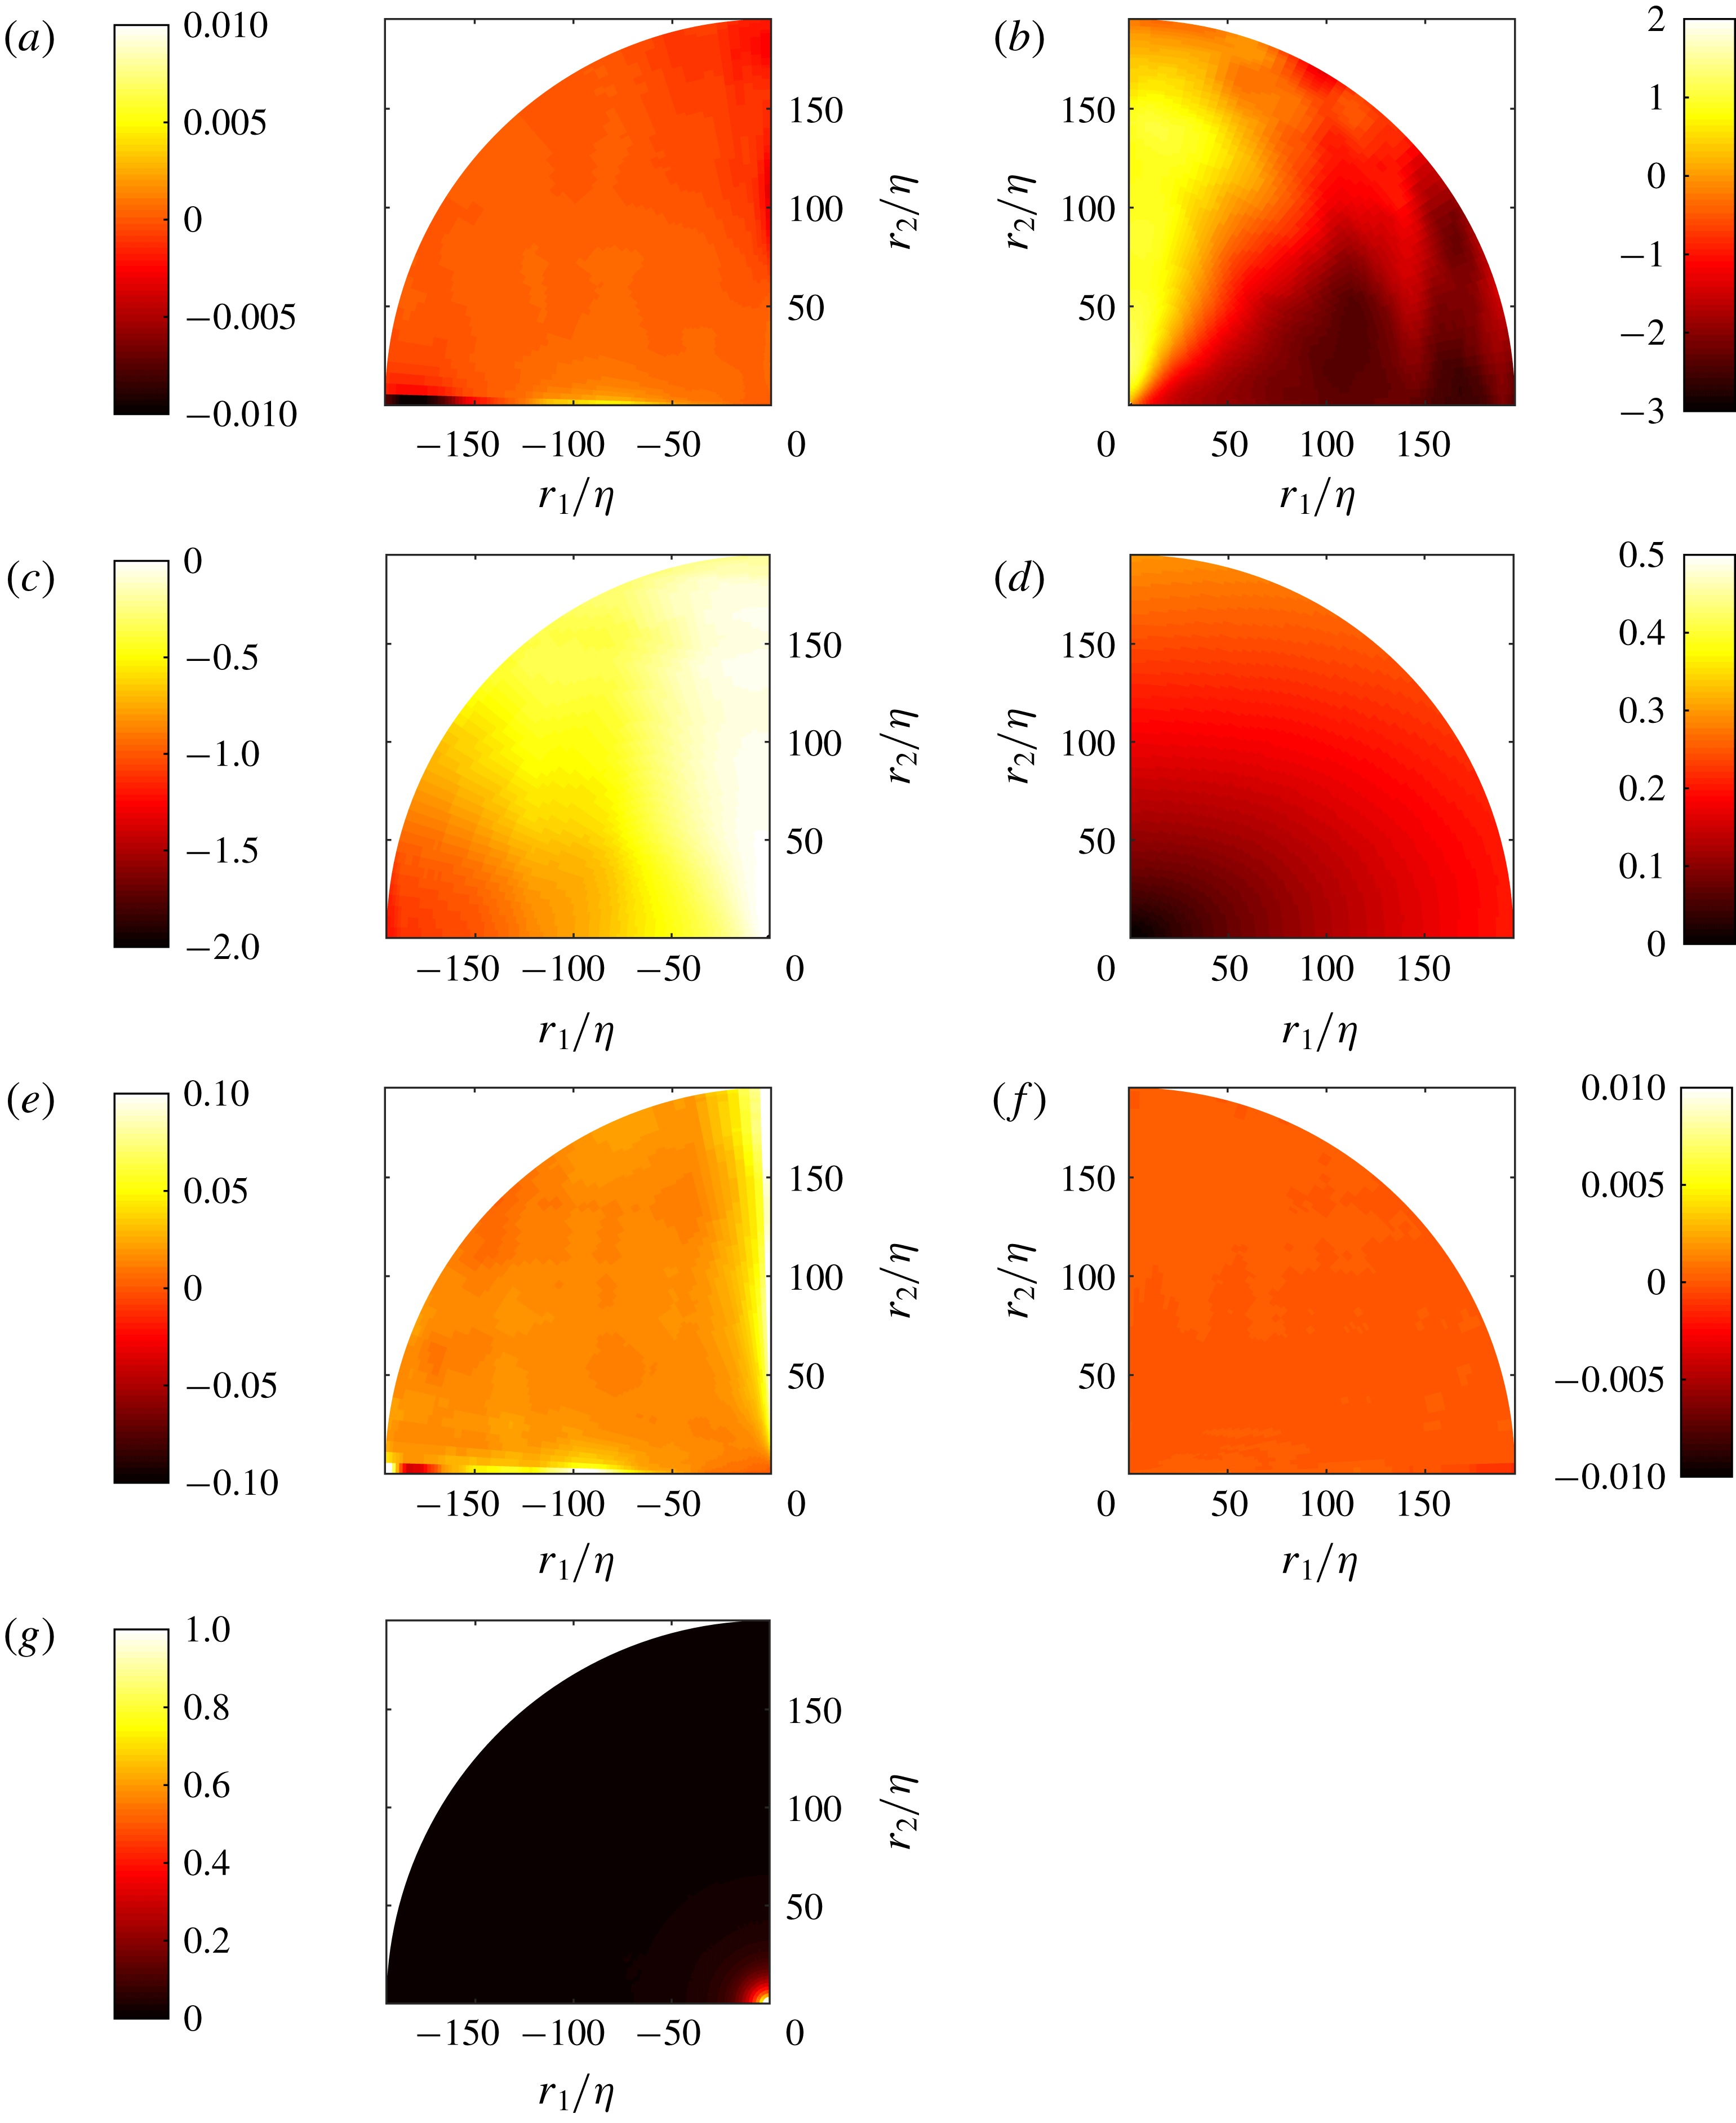
Figure 19. Mean flow advection
![]() $\mathscr{A}/\unicode[STIX]{x1D716}_{r}$
(a), radial nonlinear scale-to-scale transfer
$\mathscr{A}/\unicode[STIX]{x1D716}_{r}$
(a), radial nonlinear scale-to-scale transfer
![]() $\unicode[STIX]{x1D6F1}_{r}/\unicode[STIX]{x1D716}_{r}$
(b), radial linear scale-to-scale transfer
$\unicode[STIX]{x1D6F1}_{r}/\unicode[STIX]{x1D716}_{r}$
(b), radial linear scale-to-scale transfer
![]() $\unicode[STIX]{x1D6F1}_{U,r}/\unicode[STIX]{x1D716}_{r}$
(c), production
$\unicode[STIX]{x1D6F1}_{U,r}/\unicode[STIX]{x1D716}_{r}$
(c), production
![]() $\mathscr{P}/\unicode[STIX]{x1D716}_{r}$
(d), turbulent transport
$\mathscr{P}/\unicode[STIX]{x1D716}_{r}$
(d), turbulent transport
![]() $\mathscr{T}_{u}/\unicode[STIX]{x1D716}_{r}$
(e), viscous spatial diffusion
$\mathscr{T}_{u}/\unicode[STIX]{x1D716}_{r}$
(e), viscous spatial diffusion
![]() $\mathscr{D}_{\unicode[STIX]{x1D708},X}/\unicode[STIX]{x1D716}_{r}$
(f), viscous scale-to-scale diffusion
$\mathscr{D}_{\unicode[STIX]{x1D708},X}/\unicode[STIX]{x1D716}_{r}$
(f), viscous scale-to-scale diffusion
![]() $\mathscr{D}_{\unicode[STIX]{x1D708}}/\unicode[STIX]{x1D716}_{r}$
(g) for the case
$\mathscr{D}_{\unicode[STIX]{x1D708}}/\unicode[STIX]{x1D716}_{r}$
(g) for the case
![]() $Re_{\unicode[STIX]{x1D706}}=496$
.
$Re_{\unicode[STIX]{x1D706}}=496$
.
The terms in the Kármán–Howarth equation (5.1) are approximated as follows, invoking axisymmetry and using similar notation to Valente & Vassilicos (Reference Valente and Vassilicos2015):
(i) The unsteady term
 $4\mathscr{A}_{t}=\unicode[STIX]{x2202}\langle \unicode[STIX]{x1D6FF}q^{2}\rangle /\unicode[STIX]{x2202}t=0$
by virtue of collecting time-independent samples.
$4\mathscr{A}_{t}=\unicode[STIX]{x2202}\langle \unicode[STIX]{x1D6FF}q^{2}\rangle /\unicode[STIX]{x2202}t=0$
by virtue of collecting time-independent samples.(ii) The mean flow advection term
 $4\mathscr{A}=(U_{k}+U_{k}^{\prime }/2)\unicode[STIX]{x2202}\langle \unicode[STIX]{x1D6FF}q^{2}\rangle /\unicode[STIX]{x2202}X_{k}$
is approximated as (B 1)in figure 19(a) and is found to be negligible.
 $$\begin{eqnarray}4\mathscr{A}\approx \left(\frac{U+U^{\prime }}{2}\right)\frac{\unicode[STIX]{x2202}\langle \unicode[STIX]{x1D6FF}q^{2}\rangle }{\unicode[STIX]{x2202}X_{1}}+2\left(\frac{V+V^{\prime }}{2}\right)\frac{\unicode[STIX]{x2202}\langle \unicode[STIX]{x1D6FF}q^{2}\rangle }{\unicode[STIX]{x2202}X_{2}}\end{eqnarray}$$
(iii) The nonlinear scale-to-scale transfer
 $4\unicode[STIX]{x1D6F1}=\unicode[STIX]{x2202}\langle \unicode[STIX]{x1D6FF}u_{k}\unicode[STIX]{x1D6FF}q^{2}\rangle /\unicode[STIX]{x2202}r_{k}$
is a divergence in scale space calculated in spherical coordinates as (B 2)Only the radial portion
 $$\begin{eqnarray}4\unicode[STIX]{x1D6F1}=4(\unicode[STIX]{x1D6F1}_{r}+\unicode[STIX]{x1D6F1}_{\unicode[STIX]{x1D703}})=\frac{1}{r^{2}}\frac{\unicode[STIX]{x2202}}{\unicode[STIX]{x2202}r}\left(r^{2}\langle \unicode[STIX]{x1D6FF}u_{r}\unicode[STIX]{x1D6FF}q^{2}\rangle \right)+\frac{1}{r\sin \unicode[STIX]{x1D703}}\frac{\unicode[STIX]{x2202}}{\unicode[STIX]{x2202}\unicode[STIX]{x1D703}}\left(\sin \unicode[STIX]{x1D703}\langle \unicode[STIX]{x1D6FF}u_{\unicode[STIX]{x1D703}}\unicode[STIX]{x1D6FF}q^{2}\rangle \right).\end{eqnarray}$$
 $\unicode[STIX]{x1D6F1}_{r}$
contributes to the overall transfer of energy and is plotted in figure 19(b).
$\unicode[STIX]{x1D6F1}_{r}$
contributes to the overall transfer of energy and is plotted in figure 19(b).(iv) The linear scale-to-scale transfer
 $4\unicode[STIX]{x1D6F1}_{U}=\unicode[STIX]{x2202}\langle \unicode[STIX]{x1D6FF}U_{k}\unicode[STIX]{x1D6FF}q^{2}\rangle /\unicode[STIX]{x2202}r_{k}$
is obtained analogously to
 $\unicode[STIX]{x1D6F1}$
, as it is also a divergence in spherical coordinates: (B 3)and is shown in figure 19(c).
 $$\begin{eqnarray}4\unicode[STIX]{x1D6F1}_{U,r}=\frac{1}{r^{2}}\frac{\unicode[STIX]{x2202}}{\unicode[STIX]{x2202}r}\left(r^{2}\langle \unicode[STIX]{x1D6FF}U_{r}\unicode[STIX]{x1D6FF}q^{2}\rangle \right)\end{eqnarray}$$
(v) The production
 $4\mathscr{P}=-2\langle \unicode[STIX]{x1D6FF}u_{i}\unicode[STIX]{x1D6FF}u_{k}\rangle \unicode[STIX]{x2202}\unicode[STIX]{x1D6FF}U_{i}/\unicode[STIX]{x2202}r_{k}-\langle (u_{k}+u_{k}^{\prime })\unicode[STIX]{x1D6FF}u_{i}\rangle \unicode[STIX]{x2202}U_{i}/\unicode[STIX]{x2202}X_{k}$
is approximated (noting that
 $V\approx W\approx 0$
) as (B 4)
 $$\begin{eqnarray}4\mathscr{P}\approx 2\langle \unicode[STIX]{x1D6FF}u_{1}^{2}\rangle \frac{\unicode[STIX]{x2202}U_{1}}{\unicode[STIX]{x2202}x_{1}}+4\langle (u_{2}+u_{2}^{\prime })\unicode[STIX]{x1D6FF}u_{1}\rangle \frac{\unicode[STIX]{x2202}U_{1}}{\unicode[STIX]{x2202}x_{2}}.\end{eqnarray}$$
This is the same relation used to approximate the production by Valente & Vassilicos (Reference Valente and Vassilicos2015) and Gomes-Fernandes et al. (Reference Gomes-Fernandes, Ganapathisubramani and Vassilicos2015) for their grid-generated flows, which have similar symmetries to the present flow. The production is shown in figure 19(d) and although it is not negligible it remains below
 $0.25\unicode[STIX]{x1D716}_{r}$
over the field of view.
$0.25\unicode[STIX]{x1D716}_{r}$
over the field of view.(vi) The transport term
 $4\mathscr{T}=-\unicode[STIX]{x2202}/\unicode[STIX]{x2202}X_{k}(\langle (u_{k}+u_{k}^{\prime })\unicode[STIX]{x1D6FF}q^{2}\rangle /2)$
is approximated as (B 5)
 $$\begin{eqnarray}4\mathscr{T}\approx -\frac{\unicode[STIX]{x2202}}{\unicode[STIX]{x2202}X_{1}}(\langle (u_{1}+u_{1}^{\prime })\unicode[STIX]{x1D6FF}q^{2}\rangle /2)-2\frac{\unicode[STIX]{x2202}}{\unicode[STIX]{x2202}X_{2}}(\langle (u_{2}+u_{2}^{\prime })\unicode[STIX]{x1D6FF}q^{2}\rangle /2).\end{eqnarray}$$
The turbulent transport is plotted in figure 19(e) and is negligible for the present flow.
(vii) Diffusion terms arise both in scale space in and physical space, which we separate and calculate as
(B 6)in physical space and $$\begin{eqnarray}4\mathscr{D}_{\unicode[STIX]{x1D708},X}=\unicode[STIX]{x1D708}\left[\frac{1}{2}\frac{\unicode[STIX]{x2202}^{2}}{\unicode[STIX]{x2202}X_{k}^{2}}\right]\langle \unicode[STIX]{x1D6FF}q^{2}\rangle \approx \frac{\unicode[STIX]{x1D708}}{2}\left[\frac{\unicode[STIX]{x2202}^{2}}{\unicode[STIX]{x2202}X_{1}^{2}}\langle \unicode[STIX]{x1D6FF}q^{2}\rangle +2\frac{\unicode[STIX]{x2202}^{2}}{\unicode[STIX]{x2202}X_{2}^{2}}\langle \unicode[STIX]{x1D6FF}q^{2}\rangle \right]\end{eqnarray}$$
(B 7)in scale space. They are plotted in figures 19(f) and 19(g), respectively. The spatial diffusion is found to be negligible in all cases, as is the scale-to-scale diffusion except for very small separations, as expected.
 $$\begin{eqnarray}4\mathscr{D}_{\unicode[STIX]{x1D708}}=2\unicode[STIX]{x1D708}\left[\frac{\unicode[STIX]{x2202}^{2}}{\unicode[STIX]{x2202}r_{k}^{2}}\right]\langle \unicode[STIX]{x1D6FF}q^{2}\rangle \approx \frac{2\unicode[STIX]{x1D708}}{r^{2}}\frac{\unicode[STIX]{x2202}}{\unicode[STIX]{x2202}r}\left(r^{2}\frac{\unicode[STIX]{x2202}}{\unicode[STIX]{x2202}r}\langle \unicode[STIX]{x1D6FF}q^{2}\rangle \right)\end{eqnarray}$$
(viii) The dissipation term is twice the dissipation evaluated at points
 $\boldsymbol{x}$
and
 $\boldsymbol{x}^{\prime }$
,
 $4\unicode[STIX]{x1D716}_{r}=2\unicode[STIX]{x1D708}[\langle (\unicode[STIX]{x2202}u_{i}/\unicode[STIX]{x2202}x_{k})^{2}\rangle +\langle (\unicode[STIX]{x2202}u_{i}^{\prime }/\unicode[STIX]{x2202}x_{k}^{\prime })^{2}\rangle =2(\unicode[STIX]{x1D716}+\unicode[STIX]{x1D716}^{\prime })\approx 4\unicode[STIX]{x1D716}$
. As one approaches zero separation, the dissipation term balances with the scale-to-scale viscous diffusion term
 $\mathscr{D}_{\unicode[STIX]{x1D708}}$
.
The pressure–velocity term cannot be directly evaluated from our velocity measurements. The form of the forcing term is also not known for the present flow. The sum of both terms can be indirectly evaluated from the balance, and is found to be comparable to the nonlinear transfer term.


