


1. Introduction
The Leidenfrost effect, a two-century-old phenomenon (Leidenfrost Reference Leidenfrost1966; Quéré Reference Quéré2013) causing levitation of liquid droplets deposited on hot surfaces, has been playing a critical role in an increasing number of modern technologies. As the effect completely removes liquid–solid contact and subsequently liberates the liquid from frictional constraints of the surroundings, it has great potential to transform liquid-transport applications ranging from large-scale drag reduction (Vakarelski et al. Reference Vakarelski, Berry, Chan and Thoroddsen2016), rapid and autonomous transport of liquid droplets (Linke et al. Reference Linke, Alemán, Melling, Taormina, Francis, Dow-Hygelund, Narayanan, Taylor and Stout2006; Li et al. Reference Li, Hou, Liu, Hao, Li, Chaudhury, Yao and Wang2016; Bouillant et al. Reference Bouillant, Mouterde, Bourrianne, Lagarde, Clanet and Quéré2018), to nanoscale manufacturing processes (Cordeiro & Desai Reference Cordeiro and Desai2016). Our current understanding of the Leidenfrost phenomenon is largely based on the steady-state assumption, an approach used to justify exclusion of minute but accumulative effects such as drop-size reduction by evaporation. The resulting analysis, while offering tremendous insights into the short-time Leidenfrost dynamics, filters out phenomena only visible at longer time scales, e.g. the lifetime of Leidenfrost droplets.
Here, we reveal that as a Leidenfrost droplet shrinks on superheated solid surfaces, it involuntarily performs a series of oscillating motions, starting erratically at the beginning, followed by regular oscillation and finally settling at periodic bouncing towards the end of its lifetime. The bouncing behaviour has an unusually high restitution coefficient and exhibits signatures of parametric oscillation with occasional resonances. Our findings demonstrate the active nature of Leidenfrost droplets at long time scales by showing that they exhibit self-regulating ability by switching through different modes of oscillation in response to reduction in drop size by evaporation. The underlying active mechanism may serve as a basis for exploring strategies for energy harvesting or frictionless and autonomous liquid transport.
2. Experimental set-up
The spontaneous oscillation of a Leidenfrost droplet is self-triggered and occurs as the droplet loses its weight to evaporation. The transitions between characteristic behaviours inevitably result from liquid evaporation and subsequent size reduction, from the initial size, which is larger than the liquid's capillary length (see table 1), to a few hundreds of micrometres. In our experiment, we record the droplet's oscillation from the side view with a high-speed camera (SA-X2, Photron) at frame rates from 500 frames per second to 4000 frames per second. We use a Nikon micro lens with the focal length 105 mm to achieve a pixel size of  $20\ \mathrm {\mu }\textrm {m}$. To focus on the droplet's vertical motion and keep the droplet in the camera's field of view, we trap Leidenfrost droplets horizontally by using a slightly curved smooth surface. We note that such surface does not cause any difference in droplet behaviours compared with those observed on a flat one (see supplementary movie 1 available at https://doi.org/10.1017/jfm.2020.576).
Table 1. Properties of liquids and surface temperature ranges for liquids in this study.

We study the oscillation phenomenon on surfaces made of either copper or aluminium and for several liquids, i.e. acetone, ethanol, isopropyl alcohol (IPA) and FC72, and observe that the phenomenon is robust for all tested surfaces and liquids. The surface temperature  $T$ is systematically varied in the range from
  $150\ ^{\circ }\textrm {C}$ to
  $440\ ^{\circ }\textrm {C}$. The liquid properties, including boiling point
  $T_b$, surface tension
  $\sigma$ and capillary length
  $\lambda$ at
  $T_b$, as well as the specific temperature range for each liquid, are shown in table 1.
3. Results and discussion
3.1. Oscillation behaviours of a Leidenfrost droplet
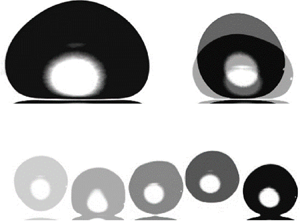
During the lifetime of a Leidenfrost droplet, its behaviour transitions through several stages, as illustrated in the schematic shown in figure 1(a). A droplet larger than the liquid's capillary length, after having been deposited on a sufficiently heated surface, first hovers around on its own vapour layer. In this so-called hovering stage (figure 1b, supplementary movie 2), the droplet has a relatively large flattened area at the bottom due to gravity and this area does not vary significantly with time. As the droplet gets smaller due to evaporation, capillary forces becomes dominating over gravitational forces, causing its behaviour transition from hovering to bobbing, i.e. periodic vertical deformation without leaving the surface (figure 1c, supplementary movie 3). When the droplet radius reduces to a critical value, it starts bouncing on the surface, i.e. the droplet is no longer separated from the surface by a thin vapour film but jumps up and down periodically (figure 1d, supplementary movies 4 and 5). Once the droplet becomes sufficiently small ( $R\sim 100\ \mathrm {\mu }\textrm {m}$), it either takes a final leap out of the camera's view or explodes (Celestini et al. Reference Celestini, Frisch and Pomeau2012; Lyu et al. Reference Lyu, Mathai, Wang, Sobac, Colinet, Lohse and Sun2019).

Figure 1.  $(a)$ Schematic illustrating the characteristic behaviours of a Leidenfrost droplet as it evaporates and shrinks. The initial drop size typically is larger than the liquid's capillary length. After a droplet is gently deposited on a superheated surface by a pipette, the droplet goes through the following stages:
  $(b)$ hovering,
  $(c)$ bobbing and
  $(d)$ bouncing. Eventually, when the drop becomes sufficiently small, it reaches the final stage in which it either lifts off or explodes (Celestini, Frisch & Pomeau Reference Celestini, Frisch and Pomeau2012; Lyu et al. Reference Lyu, Mathai, Wang, Sobac, Colinet, Lohse and Sun2019). Inset is the droplet's vertical centre of mass
  $y_{c}$ versus time
  $t$. For an oscillation cycle from one peak to the next one, we extract the oscillation period
  $t_{cycle}$, the oscillation amplitude
  $A$ and the oscillation frequency
  $f = 1/t_{cycle}$. The snapshots from panel
  $(b\hbox{--}d)$ were taken from an experiment using deionised (DI) water as the working liquid. The surface was polished aluminium surface and heated to
  $380\ ^{\circ }\textrm {C}$.
The recorded phenomenological behaviours of Leidenfrost droplets are robust for all tested liquids, including DI water, ethanol, IPA, acetone and FC-72, as well as for surface materials such as copper and aluminium. We also verify these behaviours for a wide range of surface temperatures, from  $150\ ^{\circ }\textrm {C}$ to
  $440\ ^{\circ }\textrm {C}$, confirming that the phenomenon is not material or temperature specific.
To shed light into the observed transient dynamics of Leidenfrost droplets, we track the vertical position  $y_c$ of the centre of mass as a function of time. Subsequently, the frequency
  $f$ and amplitude
  $A$ of the periodic motion of the centre of mass can be extracted (see inset in figure 1d). We note that there are two distinct time scales: the smaller one (
 ${\sim }10\ \textrm {ms}$) is associated with the oscillating motion, and the larger one (
 ${\sim }10\ \textrm {s}$) is associated with the transitions between behaviours. In figures 2(a) and 2(b), we show representative plots of
  $f$ and the normalised amplitude
  $A/R$ for a DI water droplet on an aluminium surface at
  $380\ ^{\circ }\textrm {C}$. Here
  $R$ is the droplet radius calculated for a spherical droplet of the same volume with the one recorded from the side view. The frequency plot presents a clear picture of the transition from the hovering stage, where a large scattering in
  $f$ is observed, to the bobbing stage, where
  $f$ gently increases with time. Throughout the experiment, the normalised droplet radius
  $R/\lambda$ decreases continuously with time, as illustrated in figure 2(c). Here, the capillary length
  $\lambda$ is defined as
  $\lambda =(\sigma /\rho g)^{1/2}$, where
  $\rho$ and
  $\sigma$ are the density and surface tension at the liquid's boiling point, respectively (Biance, Clanet & Quéré Reference Biance, Clanet and Quéré2003; Bouillant et al. Reference Bouillant, Mouterde, Bourrianne, Lagarde, Clanet and Quéré2018). We note that by following how the oscillation frequency
  $f$ changes, we are able to determine the droplet radius
  $R_{h}$ at the hovering–bobbing transition (figure 2c). The bobbing–bouncing transition, however, is clearly determined from the recording when the droplet starts jumping readily from the surface. The oscillation frequency at the bobbing–bouncing transition is denoted by
  $f_{b}$ (figure 2a), and the corresponding droplet radius is denoted by
  $R_{b}$ (figure 2c).

Figure 2.  $(a)$ Representative plot showing the oscillation frequency
  $f$ (left-hand axis) and the ratio
  $\gamma =2f_{n}/f$ (right-hand axis) versus time
  $t$ as the droplet transitions through several characteristic stages: hovering, bobbing and bouncing. Here,
  $f_{n}$ is the natural frequency of the oscillation droplet. Parametric resonance occurs in the bouncing stage at
  $t_1$,
  $t_2$,
  $t_3$ and
  $t_4$. Inset is internal velocity field of a droplet in the bobbing stage.
  $(b)$ Dimensionless oscillation amplitude
  $A/R$ versus time
  $t$.
$t$.  $(c)$ Dimensionless radius
  $R/\lambda = Bo^{1/2}$ (left-hand axis) and Froude number
  $Fr \approx (6/{\rm \pi} )^{1/2}(\,f/f_{n}) (R/\lambda )^{-1}$ in the bobbing stage (right-hand axis) versus
  $t$. The solid line indicates that the transition from hovering to bobbing stage happens at
  $R/\lambda \approx 0.93$, or equivalently
  $Bo \approx 0.86$. The dashed line indicates that the transition from bobbing to bouncing occurs at
  $Fr \approx 1.0$. The working liquid is water and surface temperature is
  $380\,^\circ \textrm {C}$.
3.2. Transitions between oscillation behaviours
We first focus on the transition from hovering to bobbing. The erratic oscillation of the droplet in the hovering stage originates from capillary waves on its surface. Indeed, the droplet radius measured in this stage is larger than the capillary length  $\lambda$ (see figure 2c). As the droplet radius becomes smaller than
  $\lambda$, the surface tension effect dominates over the gravitational effect, giving rise to more regular oscillations. The transition from hovering to bobbing therefore occurs when
  $R \approx \lambda$, or equivalently when the Bond number
  $Bo = \rho g R^2/\sigma = (R/\lambda )^2 \approx 1$. We confirm experimentally that although different liquid–surface combinations yield disparate values for the radius
  $R_{h}$ (figure 3a) and the capillary length
  $\lambda$, the condition
  $R_{h} \approx \lambda$, or
  $Bo_h \approx 1$, always holds at the hovering–bobbing transition, as shown in figures 3(b) and 3(c), respectively.

Figure 3.  $(a)$ Droplet radius
  $R_{h}$ at the hovering–bobbing transition for various liquid–surface combinations. The tested liquids are ethanol (Eth), DI water (DI), acetone (Ace), IPA and FC72, while the substrate materials are copper (Cu) and aluminium (Al).
  $(b)$ Droplet radius
  $R_{h}$ at hovering–bobbing transition versus the capillary length
  $\lambda$.
  $(c)$ The Bond number
  $Bo_{h}$ at the hovering–bobbing transition for various liquid–surface combinations.
We now focus on the transition from bobbing to bouncing. We observe experimentally that the internal flow of a droplet in the bobbing stage resembles a toroidal field, i.e. a strong downward flow at the centre of the droplet (a representative snapshot of the flow field is shown in figure 2a, inset). This flow field provides crucial evidence indicating the driving mechanism of the droplet's oscillation and the eventual transition to bouncing. We note that the internal flow may be induced by either the thermocapillary effect or the vapour flow underneath the droplet (Bouillant et al. Reference Bouillant, Mouterde, Bourrianne, Lagarde, Clanet and Quéré2018). We are unable to ascertain the domination of one effect over the other. Estimations of the internal velocity induced by either effect suggest that the vapour flow might play a slightly more significant role than thermocapillarity (Bouillant et al. Reference Bouillant, Mouterde, Bourrianne, Lagarde, Clanet and Quéré2018), although a separate investigation would be required to establish how these effects quantitatively influence the internal flow. Nonetheless, the observed toroidal flow field, which consists of a stagnation point at the bottom and the region with higher velocity at the droplet's waist, provides a mechanism for generating a non-zero pressure gradient inside the droplet. Combined with the restoring force by the surface tension, the deformation driven by the pressure gradient causes the droplet to oscillate.
We highlight that the involving parameters of the oscillation, i.e. the frequency associated with the internal flow and the droplet's natural frequency, vary with time as the droplet radius continuously decreases, although at different rates. Here, the natural frequency of a droplet refers to the frequency that the droplet oscillates in the absence of any driving or damping effects, and is defined as  $f_{n} = (\sigma /m)^{1/2}$, where
  $m=(4 {\rm \pi}/3)\rho R^3$ is the droplet's mass (Landau & Lifshitz Reference Landau and Lifshitz1976; Gilet & Bush Reference Gilet and Bush2009; Moláček & Bush Reference Moláček and Bush2013; Schutzius et al. Reference Schutzius, Jung, Maitra, Graeber, Köhme and Poulikakos2015). Evolution of the involving parameters eventually leads the oscillating droplet to parametric resonances, which are visible via abrupt jumps in its amplitude (figure 2b). The transition to bouncing therefore occurs when the excited oscillation gains sufficient upward acceleration to overcome gravity. If we denote
  $V_{i}$, the characteristic velocity of internal flow, then the acceleration associated with the internal flow (
 $a = V_{i}^2/2R$) in comparison with the gravitational acceleration is evaluated by the Froude number
  ${Fr} = (a/g)^{1/2} = V_{i}/(2Rg)^{1/2}$. In other words, the droplet overcomes gravity when
  $Fr \gtrsim 1$.
To test the hypothesis that the transition from bobbing to bouncing is possible at  $Fr \approx 1$, we now examine the dependence of the Froude number on the internal flow characteristics, in particular its frequency
  $f_{i}$. Since the oscillation is driven by the internal flow and recalling that
  $f$ is the oscillation frequency of the droplet, we have
  $f \approx f_{i} \approx V_{i}/4R$, giving
  $V_{i} \approx 4Rf$. By substituting the expression for
  $V_{i}$ into the one for
  $Fr$ and using the natural frequency
  $f_{n}$ of the droplet to normalise
  $f$, we obtain the following expression for
  $Fr$:
$Fr$:
 \begin{equation} Fr \approx \left(\frac{6}{\rm \pi}\right)^{1/2}\frac{f}{f_{n}} \left(\frac{R}{\lambda} \right)^{-1}. \end{equation}
In figure 2(c), we show how  $Fr$ changes in the bobbing stage. Indeed, the condition
  $Fr \approx 1$ holds at the transition to bouncing, indicating that the upward acceleration caused by internal flows overcomes the gravitational acceleration at the transition from bobbing to bouncing. We note that the expression for
  $Fr$ shown in (3.1) also implies that
  $f_{b} \approx (g/8)^{1/2}R_{b}^{-1/2} \, Fr_b$, a direct relation between
  $f_{b}$ and
  $R_{b}$ that can be experimentally checked assuming
  $Fr = 1$ at the bobbing–bouncing transition. Indeed, for the tested liquids with wide ranges of variation in
  $R_{b}$ and
  $f_{b}$ (figure 4a), we confirm that this relation is consistent with the experimental data (figure 4b). Moreover, a direct use of (3.1) to calculate
  $Fr_b$ also shows that the condition
  $Fr \approx 1$ holds at the bobbing–bouncing transition for various liquids (figure 4c).

Figure 4.  $(a)$ Variation in droplet radius
  $R_b$ (solid square, left-hand axis) and frequency
  $f_b$ (open diamond, right-hand axis) at the bobbing–bouncing transition for various liquid–surface combinations.
  $(b)$ Oscillation frequency
  $f_{b}$ as a function of
  $R_{b}^{-1/2}$ at the bobbing–bouncing transition for all tested substrate–liquids combinations. The dashed line represents the relation
  $f_{b} \approx (g/8)^{1/2}R_{b}^{-1/2}\textit{Fr}_\textit{b}$.
  $(c)$ Plots showing the Froude number
  $Fr_{b}$ at the bobbing–bouncing transition for various liquid–surface combinations.
We highlight that the condition for bobbing–bouncing transition can be alternatively examined by estimating the Froude number without using the frequency  $f_{b}$. Instead, we use the internal velocity experimentally measured near the transition. In figure 5(a), we show the internal flow field obtained by particle imaging velocimetry of a water droplet of radius 1.6 mm in the bobbing stage and near the bobbing–bouncing transition. From the internal flow field, we obtain the maximum velocity
  $V_{max}$ inside the droplet for two oscillation cycles. Here,
  $V_{max}$ ranges from
  $10\ \textrm {cm}\,\textrm {s}^{-1}$ to
  $25\ \textrm {cm}\,\textrm {s}^{-1}$, with an average value of
  $17\ \textrm {cm}\,\textrm {s}^{-1}$ (figure 5b). The Froude number, calculated as
  $Fr=V_{max}/(2Rg)^{1/2}$, is shown in figure 5(c). Indeed, the average value of the Froude number is 0.96, consistent with our hypothesis that
  $Fr \approx 1$ sets the condition for the bobbing–bouncing transition.

Figure 5.  $(a)$ Flow fields obtained by particle imaging velocimetry of the internal flow of a water droplet in the bobbing stage (and close to the bobbing–bouncing transition) with radius of 1.6 mm. (b) Maximum velocity
  $V_{max}$ measured inside a droplet in the bobbing stage for two oscillation cycles. The average value of
  $V_{max}$ is
  $17\ \textrm {cm}\,\textrm {s}^{-1}$.
  $(c)$ Froude number
  $Fr = V_{max}/(2Rg)^{1/2}$ calculated using
  $V_{max}$. The
  $Fr$ has an average value of
  $0.96\pm 0.35$.
We conclude that the two transitions that we observed can be understood using the dimensionless numbers  $Bo$ and
  $Fr$. The first transition, from hovering to bobbing, occurs when
  $Bo \approx 1$ (figure 3c) and the second transition, from bobbing to bouncing, occurs when
  $Fr \approx 1$ (figure 4c).
3.3. Oscillation dynamics in the bouncing stage
We now focus on the bouncing stage to discuss the abrupt drops in  $f$ and the corresponding jumps in
  $A$ (figures 2a and 2b). We note that an increasing natural frequency of an oscillating droplet, combined with the sudden drops in its frequency
  $f$ at
  $t_1$,
  $t_2$,
  $t_3$ and
  $t_4$ (figure 2a) suggests that the droplet experiences parametric resonances at such moments (Landau & Lifshitz Reference Landau and Lifshitz1976; Ibrahim Reference Ibrahim2008). Indeed, if we follow the signature of parametric resonances and examine the ratio
  $\gamma = 2f_{n}/f$, we observe that
  $\gamma$ increases substantially, from
  $2.8$ at the bobbing–bouncing transition to
  $14.7$ at the end of the bouncing stage. Whenever there is a sudden drop in
  $f$, e.g. at
  $t_1$,
  $t_2$,
  $t_3$ or
  $t_4$, the corresponding value of
  $\gamma$ is approximately in the vicinity of an integer (see figure 6a). We note that the actual values of
  $t_1$ to
  $t_4$ vary with liquid properties and the surface temperature. The first resonance at
  $t_1$ allows the droplet to gain sufficient upward acceleration to overcome gravitational acceleration and transition to the bouncing stage. We repeated the experiment for water droplets numerous times and recorded the value
  $\gamma = 2f_{n}/f$ at resonances for all these experiments. In figure 6(b), we plot the value of
  $\gamma$ averaged across several experiments having the same order of resonance for all measurements conducted using water droplets, showing that resonance occurs when
  $\gamma$ happens to take any integer value from 4 to 13. As a result, we conclude that the sudden decreases in
  $f$ and the corresponding amplitude jumps in the bouncing stage result from the droplet going through parametric resonances.

Figure 6.  $(a)$ Plot showing the ratio
  $\gamma =2f_{n}/f$ evaluated at the time of resonances. Dashed lines indicate integer values of
  $\gamma$.
  $(b)$ Average values of
  $\gamma$ versus the resonance order
  $N$ for all experiments with DI water droplets (44 cases).
We stress the important role of the initial conditions, in particular the initial droplet size, in causing the bouncing behaviour: if a droplet is deposited with initial radius  $R<R_{b}$ and with insignificant disturbance, parametric oscillation and the subsequent resonance may be completely absent. The droplet in this case will stay still on the substrate even though its size keeps reducing and eventually will either jump up (Celestini et al. Reference Celestini, Frisch and Pomeau2012) or explode (Lyu et al. Reference Lyu, Mathai, Wang, Sobac, Colinet, Lohse and Sun2019).
Between resonances, the parametric oscillation is characterised by an increasing contact time  $t_{c}$, defined as the duration in which the droplet appears in contact with the surface from the side-view recording (Bird et al. Reference Bird, Dhiman, Kwon and Varanasi2013). During this duration, the gap
  $h$ between the droplet and the surface is smaller than the spatial resolution of the imaging system, although strictly speaking a Leidenfrost droplet and the surface are always separated by a thin vapour layer. In figure 7(a), we select a representative oscillating period in the bouncing stage and show how the centre of mass of the droplet, measured by
  $y_{c}$, and
  $h$ vary with the normalised time
  $t/\tau$, where
  $\tau = 1/f_{n}$ is the natural bouncing period. In figure 7(b), we plot the time dependence of the normalised contact time
  $t_{c}/\tau$ in the entire bouncing stage of the data shown in figure 2. We observe that between two consecutive resonances,
  $t_{c}/\tau$ increases from 1.3, a typical value reported for impacting droplet on unheated surface (Richard, Clanet & Quéré Reference Richard, Clanet and Quéré2002; Schutzius et al. Reference Schutzius, Jung, Maitra, Graeber, Köhme and Poulikakos2015), to 2.3 before it drops to 1.3 due to a parametric resonance.

Figure 7.  $(a)$ Representative plots showing the vertical centre of mass
  $y_{c}$ (left-hand axis, square markers) and the gap
  $h$ between the droplet and the surface (right-hand axis, circular markers) versus the dimensionless time
  $(t-t_{s})/\tau$ in the bouncing stage. Here,
  $t_{s}=94\ \textrm {s}$ is an arbitrarily chosen moment in the bouncing stage, and
  $\tau = 1/f_{n}$ is the natural bouncing period. The shaded area indicates the contact time
  $t_{c}$ during which the droplet contacts with the surface (
 $h \approx 0$).
  $(b)$ Dimensionless contact time
  $t_{c}/\tau$ (left-hand axis, square markers) and contact time
  $t_{c}$ (right-hand axis, circle markers) versus
  $t$ in bouncing stage. The dashed and dashed–dotted lines represent the upper and lower bounds of
  $t_{c}/\tau$, respectively.
  $(c)$ Droplet's Weber number
  $We = \rho V^2R/\sigma$ versus
  $t$ in the bouncing stage. In the shaded area (
 $We<0.1$), the theoretical calculation of the contact time proposed by Chevy et al. (Reference Chevy, Chepelianskii, Quéré and Raphaël2012) is applicable.
  $(d)$ The ratio of contact time
  $t_{c}$ measured experimentally and
  $t_0$ predicted using the theory from Chevy et al. (Reference Chevy, Chepelianskii, Quéré and Raphaël2012) for
  $We<0.1$.
We rule out the possibility that the increase in contact time only results from the decrease in the velocity  $V$ for impacts at small Weber number (
 ${We = \rho V^2R/\sigma \ll 1}$) (Richard et al. Reference Richard, Clanet and Quéré2002). Here, we calculate the impact velocity as
  $V=(2gA)^{1/2}$. The dependence of the contact time on the impact velocity for impacts on unheated superhydrophobic surfaces at small Weber number was theoretically modelled and confirmed using experimental data in the study by Chevy et al. (Reference Chevy, Chepelianskii, Quéré and Raphaël2012). For each measured value of the contact time
  $t_{c}$, we numerically calculate the corresponding theoretical value
  $t_0$ (Chevy et al. Reference Chevy, Chepelianskii, Quéré and Raphaël2012) using the corresponding experimental values of impact velocity and drop size. We note that the comparison between
  $t_{c}$ and
  $t_0$ is carried out for
  $We < 0.1$, i.e. the valid range of the theoretical model (Chevy et al. Reference Chevy, Chepelianskii, Quéré and Raphaël2012). We also note that the variation of the Weber number in our experiment consists of several intervals separated by parametric resonances where the Weber number abruptly increases; in each interval the Weber number monotonically decreases due to reductions in drop size and impact velocity (figure 7c). In figure 7(d), we show the ratio
  $t_{c}/t_0$ for impacts with
  $We < 0.1$. It is evident that
  $t_{c}/t_0>1$ consistently, suggesting that the increase in the contact time is not solely due to the decrease in the impact velocity. Rather, it is a unique feature of bouncing Leidenfrost droplets.
The increasing contact time between consecutive resonances is tied to the mechanism supplying energy to the droplet to sustain its parametric oscillation. In particular, an increasing contact time energises the internal flow further and causes additional vapour pressure build-up under the droplet (Schutzius et al. Reference Schutzius, Jung, Maitra, Graeber, Köhme and Poulikakos2015). Both of these effects contribute to the supplied energy, causing the droplet to exhibit an unusually high recovery of gravitational potential after each time it touches the surface. This is best illustrated by examining the relation between the amplitude  $A_{k}$ of an arbitrary bouncing cycle
  $k$ and that of the immediately succeeding one,
  $A_{k+1}$. As shown in figure 8(a), the amplitudes
  $A_{k}$ and
  $A_{k+1}$ of any two consecutive cycles are always almost identical, indicating that the restitution coefficient
  $\epsilon _{k} =({A_{k+1}}/{A_{k}})^{1/2}$ of any cycle
  $k$ is approximately unity. The average restitution coefficient
  $\epsilon$ for the entire bouncing stage, shown in figure 8(b), ranges from 0.97 to 0.99 with the surface temperature varying from
  $300\ ^\circ \textrm {C}$ to
  $440\ ^\circ \textrm {C}$. This is remarkably higher than the restitution coefficient of droplets impinging on superhydrophobic surfaces in the same velocity range (Richard & Quéré Reference Richard and Quéré2000; Schutzius et al. Reference Schutzius, Jung, Maitra, Graeber, Köhme and Poulikakos2015) (see figure 8c). We note that
  $\epsilon \approx 1$ does not mean perfectly elastic collisions, but rather suggests that the energy lost to viscous dissipation is almost completely compensated by energy gained via parametric oscillation.

Figure 8.  $(a)$ Amplitude ratio
  $A_{k+1}/A_{k}$ of two consecutive oscillations
  $A_{k}$ and
  $A_{k+1}$ in the bouncing stage versus time
  $t$.
$t$.  $(b)$ Restitution coefficient
  $\epsilon$ averaged over the entire bouncing stage of a water droplet versus wall temperature
  $T$.
$T$.  $(c)$ Comparison of restitution coefficient
  $\epsilon$ of water droplets: present study (squares,
  $0.05\ \textrm {m}\,\textrm {s}^{-1} \le V \le 0.15\ \textrm {m}\,\textrm {s}^{-1}$); Leidenfrost surfaces (circles,
  $0.02\ \textrm {m}\,\textrm {s}^{-1} \le V \le 0.2\ \textrm {m}\,\textrm {s}^{-1}$); unheated superhydrophobic surfaces (upward-triangles,
  $0.05\ \textrm {m}\,\textrm {s}^{-1} \le V \le 0.15\ \textrm {m}\,\textrm {s}^{-1}$); and unheated superhydrophobic surfaces (downward–triangles,
  $0.15\ \textrm {m}\,\textrm {s}^{-1} \le V \le 0.3\ \textrm {m}\,\textrm {s}^{-1}$).
4. Conclusions
Leidenfrost droplets, therefore, always set off to a series of spontaneous oscillating motions with a variety of rhythms. A sufficiently large Leidenfrost droplet always starts hovering on the heated surface with fluctuating frequencies until its size becomes comparable to the liquid's capillary length, at which the droplet starts bobbing, i.e. oscillating with more regular frequencies but without bouncing. A transition from bobbing to bouncing occurs when the Froude number becomes larger than unity, signifying that the upward acceleration caused by internal flows overcomes the gravitational acceleration. In the bouncing stage, the droplet's dynamics is driven by parametric oscillation with occasional resonances whereby the oscillation frequency drops and the amplitude trebles. The bouncing motions of the Leidenfrost droplet, if not interrupted by a parametric resonance, is also characterised by two notable factors: an increasing contact time and an unusually high restitution coefficient, both of which are tied to the energy supplied to the droplet to sustain its parametric oscillation. The bouncing stage ends when the droplet becomes sufficiently small ( $R\sim 100\ \mathrm {\mu }\textrm {m}$) and either takes a final leap (Celestini et al. Reference Celestini, Frisch and Pomeau2012) or explodes (Lyu et al. Reference Lyu, Mathai, Wang, Sobac, Colinet, Lohse and Sun2019).
We highlight that parametric oscillation was also identified in several studies as the mechanism driving Leidenfrost droplets into energetically excited behaviours. These include oscillation of droplets confined between two superheated surfaces (Celestini et al. Reference Celestini, Frisch, Cohen, Raufaste, Duchemin and Pomeau2014), impacting and subsequent bouncing of Leidenfrost droplets (Biance et al. Reference Biance, Chevy, Clanet, Lagubeau and Quéré2006) and surface oscillation of large droplets with radius  $R>1.5\lambda$ (Brunet & Snoeijer Reference Brunet and Snoeijer2011; Ma, Liétor-Santos & Burton Reference Ma, Liétor-Santos and Burton2017; Ma & Burton Reference Ma and Burton2018). The vapour pressure build-up was considered as an important factor supplying energy for parametric oscillation of large droplets and could also be responsible for oscillating small Leidenfrost droplets (Biance et al. Reference Biance, Chevy, Clanet, Lagubeau and Quéré2006; Caswell Reference Caswell2014). Nonetheless, our study reveals the role of parametric oscillation in a series of distinct oscillating behaviours that a Leidenfrost droplet inevitably goes through as it shrinks.
Our findings of the spontaneous oscillations of Leidenfrost droplets completes their portraiture as an active system capable of creating its own motions and energetic states. The underlying active mechanism may provide a promising avenue for frictionless liquid manipulation and transport, as well as a potential strategy for energy harvesting.
Acknowledgements
This research was conducted in collaboration with HP Inc. and supported by Nanyang Technological University and the Singapore Government through the Industry Alignment Fund–Industry Collaboration Projects Grant.
Declaration of interests
The authors report no conflict of interest.
Supplementary movies
Supplementary movies are available at https://doi.org/10.1017/jfm.2020.576.


